The MEG Experiment ~result from the first data~
83
The MEG Experiment ~result from the first data~ T2K seminar @ J-PARC,Tokai 04/November/2009 Yusuke UCHIYAMA On behalf of MEG collaboration ICEPP
Transcript of The MEG Experiment ~result from the first data~
The MEG Experiment
~result from the first data~
T2K seminar @ J-PARC,Tokai04/November/2009
Yusuke UCHIYAMAOn behalf of MEG collaboration
ICEPP
09/11/04 T2K seminar/Yusuke UCHIYAMA 2
Theme
μ+ → e+ γ search experiment, MEG started physics data taking in 2008. In this talk, we report the analysis of first 3 months data and its result.
An example of MEG trigger event
Contents Introduction
− Subject and purpose Overview of MEG RUN 2008 Analysis
− Performance of detector− Likelihood Analysis
Current status & prospect of 2009 Conclusion
09/11/04 T2K seminar/Yusuke UCHIYAMA 3
Introduction
09/11/04 T2K seminar/Yusuke UCHIYAMA 4
Subject of research
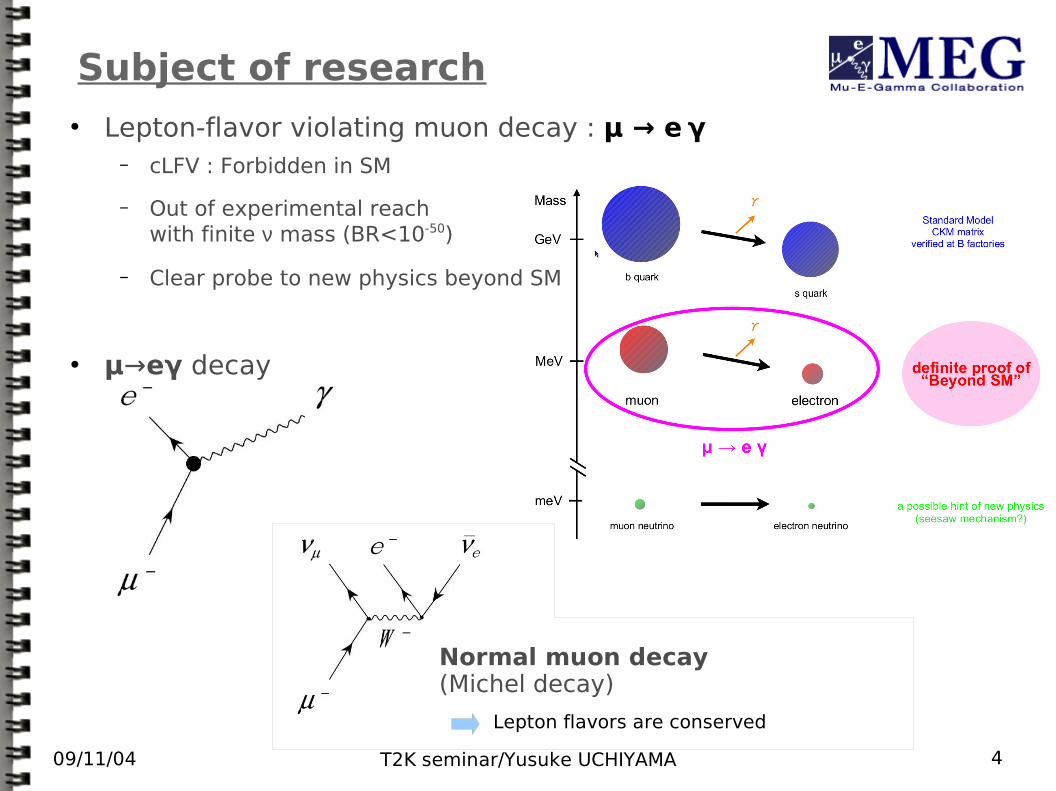
Normal muon decay(Michel decay)
Lepton flavors are conserved
Lepton-flavor violating muon decay : μ → e γ− cLFV : Forbidden in SM
− Out of experimental reach with finite ν mass (BR<10-50)
− Clear probe to new physics beyond SM
μ→eγ decay
09/11/04 T2K seminar/Yusuke UCHIYAMA 5
Physics Motivation
m l2=
m e e2 m e
2 m e 2
m e2 m
2 m
2
m e2 m
2 m 2
Mixing through slepton
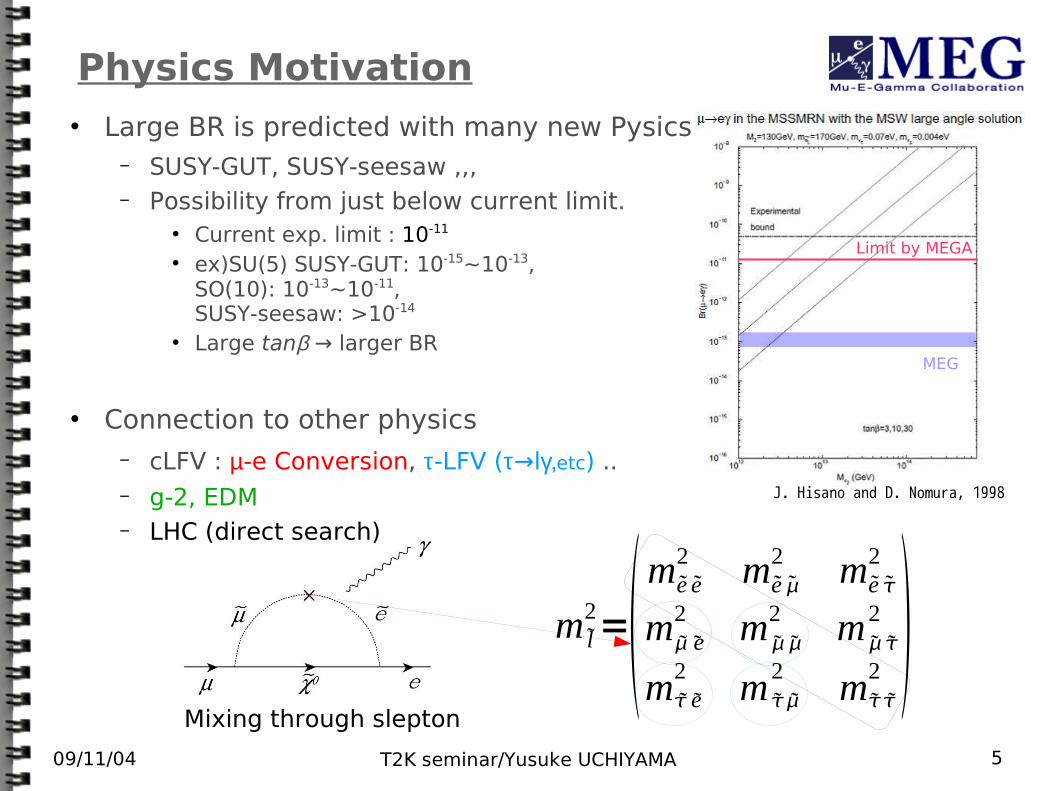
J. Hisano and D. Nomura, 1998
Limit by MEGA
MEG
Large BR is predicted with many new Pysics− SUSY-GUT, SUSY-seesaw ,,,− Possibility from just below current limit.
Current exp. limit : 10-11
ex)SU(5) SUSY-GUT: 10-15~10-13, SO(10): 10-13~10-11, SUSY-seesaw: >10-14
Large tanβ → larger BR
Connection to other physics− cLFV : µ-e Conversion, τ-LFV (τ→lγ,etc) ..− g-2, EDM− LHC (direct search)
09/11/04 T2K seminar/Yusuke UCHIYAMA 6
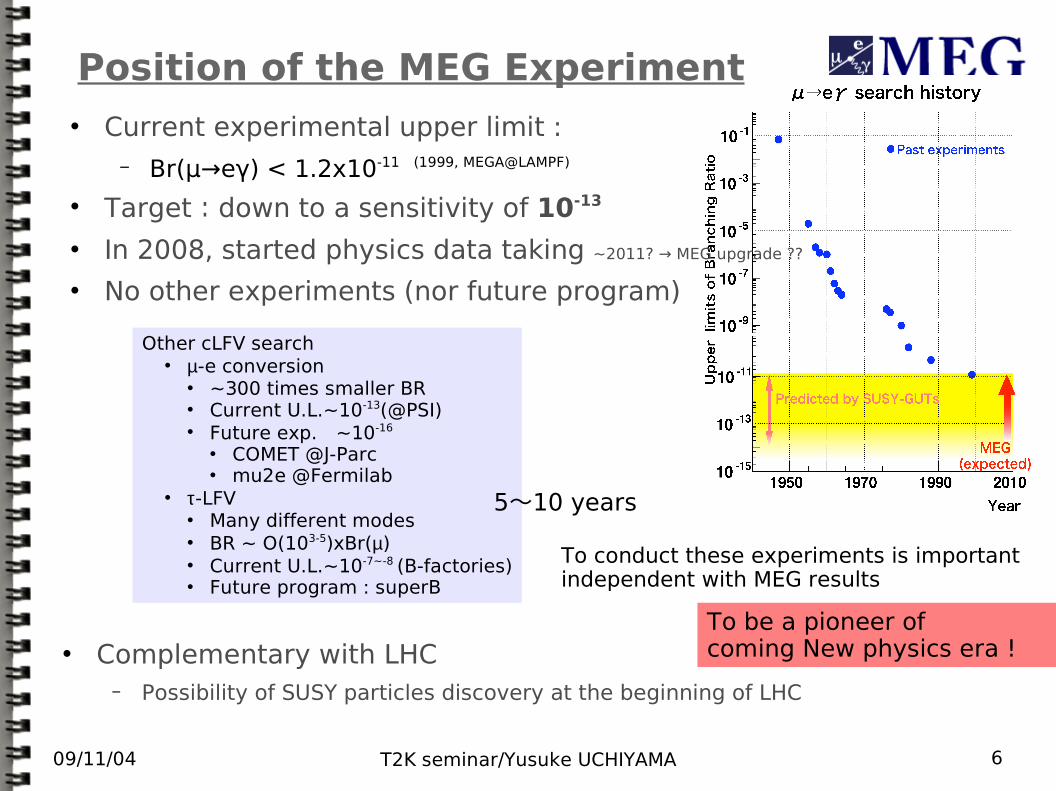
Position of the MEG Experiment Current experimental upper limit :
− Br(μ→eγ) < 1.2x10⁻¹¹ (1999, MEGA@LAMPF)
Target:down to a sensitivity of 10-13
In 2008, started physics data taking ~2011? → MEG upgrade ??
No other experiments (nor future program)
Other cLFV search µ-e conversion
~300 times smaller BR Current U.L.~10-13(@PSI) Future exp. ~10-16
COMET @J-Parc mu2e @Fermilab
τ-LFV Many different modes BR ~ O(103-5)xBr(µ) Current U.L.~10-7~-8 (B-factories) Future program : superB
5~10 years
Complementary with LHC− Possibility of SUSY particles discovery at the beginning of LHC
To conduct these experiments is importantindependent with MEG results
To be a pioneer of coming New physics era !
09/11/04 T2K seminar/Yusuke UCHIYAMA 7
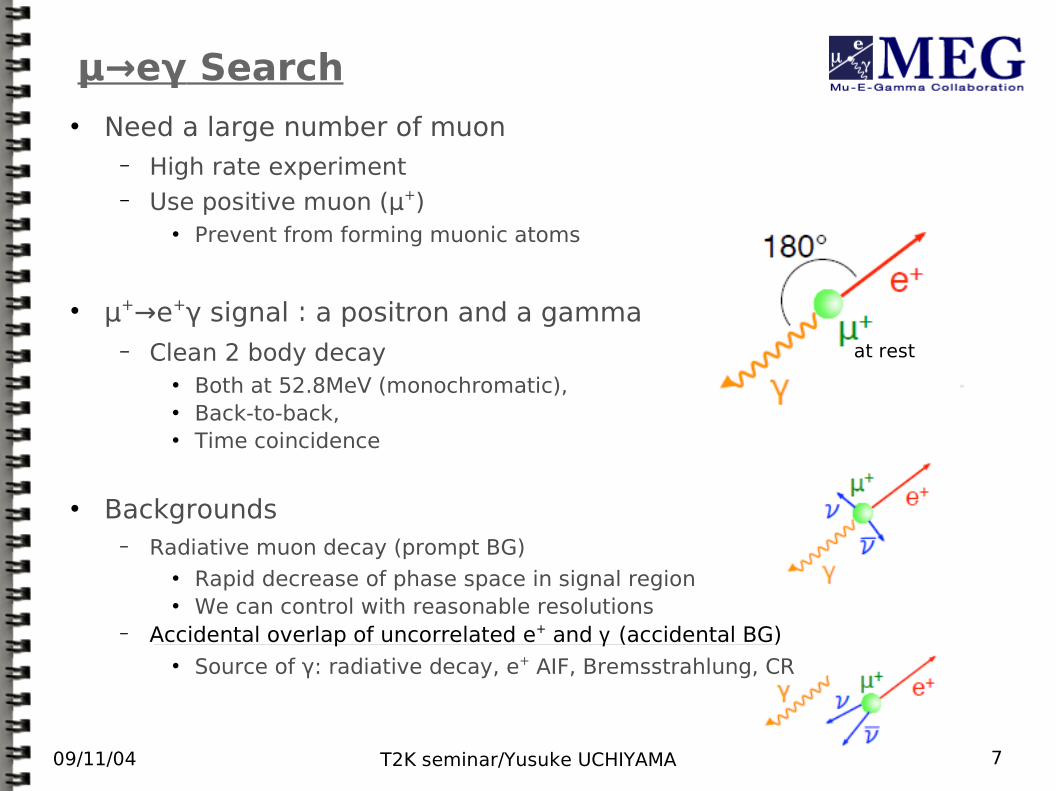
μ→eγ Search Need a large number of muon
− High rate experiment− Use positive muon (μ+)
Prevent from forming muonic atoms
μ+→e+γ signal:a positron and a gamma− Clean 2 body decay
Both at 52.8MeV (monochromatic), Back-to-back, Time coincidence
Backgrounds
− Radiative muon decay (prompt BG) Rapid decrease of phase space in signal region We can control with reasonable resolutions
− Accidental overlap of uncorrelated e+ and γ (accidental BG) Source of γ: radiative decay, e+ AIF, Bremsstrahlung, CR
at rest
09/11/04 T2K seminar/Yusuke UCHIYAMA 8
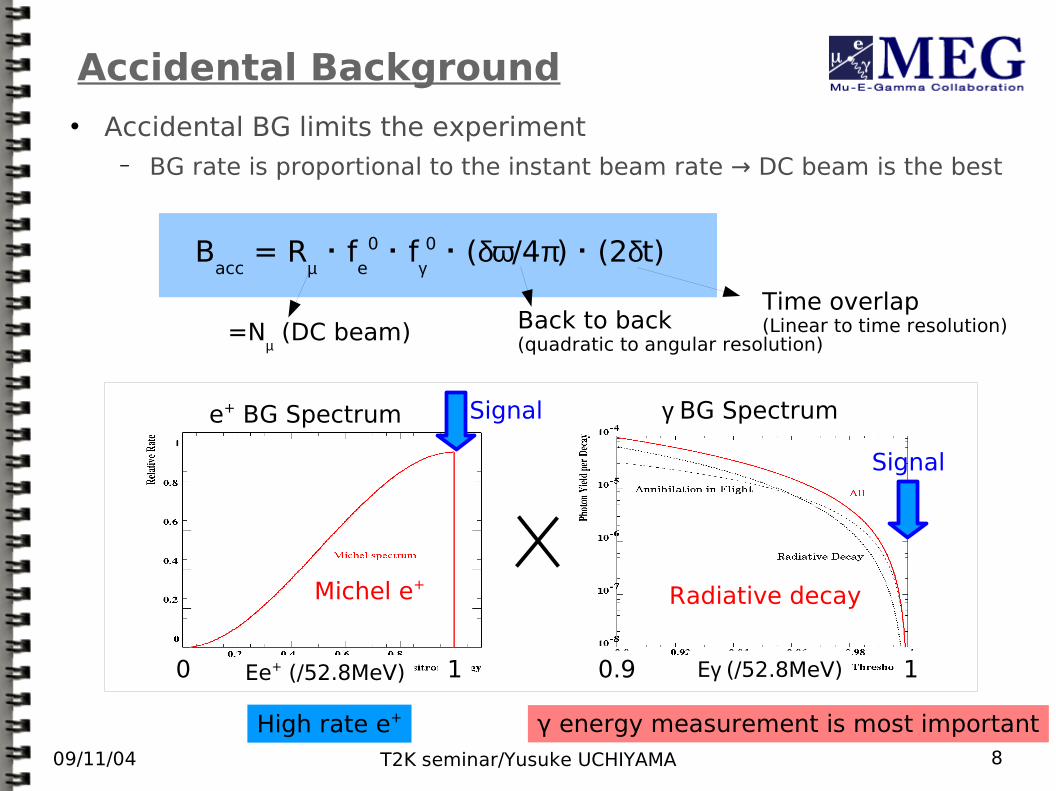
Accidental Background Accidental BG limits the experiment
− BG rate is proportional to the instant beam rate → DC beam is the best
e+ BG Spectrum Signal γ BG Spectrum
Signal
Michel e+Radiative decay
Bacc
= Rµ・f
e0・f
γ0・(δω/4π)・(2δt)
=Nµ (DC beam)
Time overlap(Linear to time resolution)Back to back
(quadratic to angular resolution)
0 1 10.9Ee+ (/52.8MeV) Eγ (/52.8MeV)
γ energy measurement is most importantHigh rate e+
09/11/04 T2K seminar/Yusuke UCHIYAMA 9
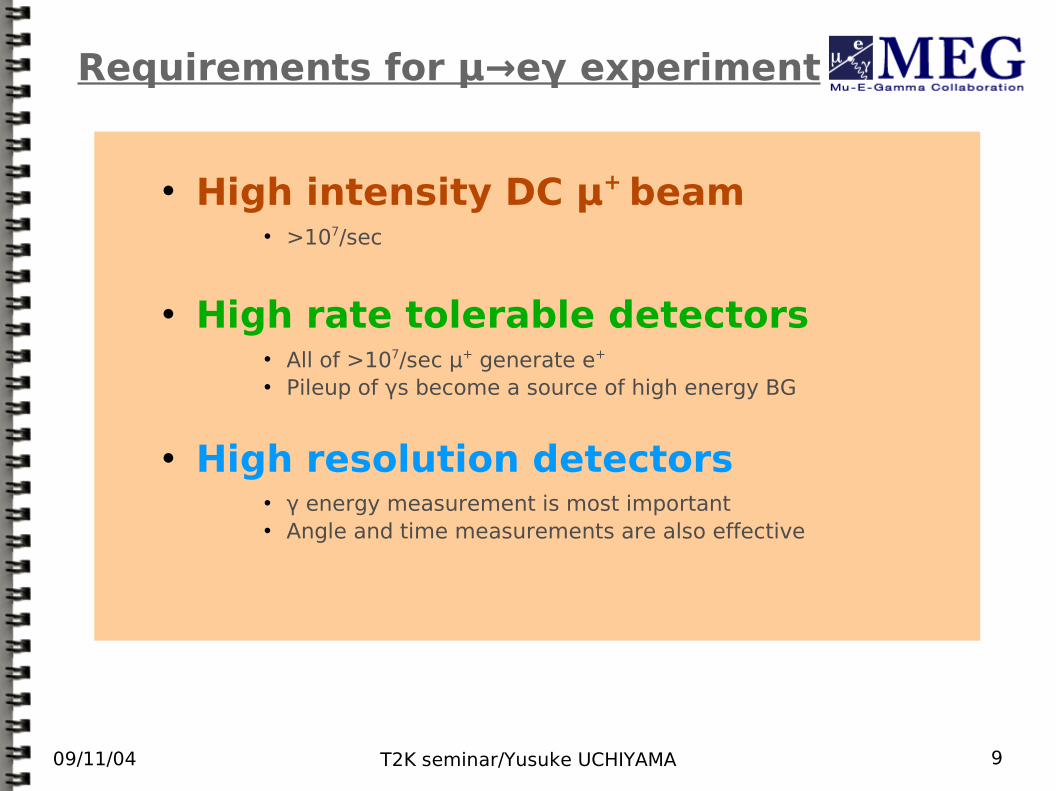
Requirements for μ→eγ experiment
High intensity DC μ+ beam >107/sec
High rate tolerable detectors All of >107/sec μ+ generate e+
Pileup of γs become a source of high energy BG
High resolution detectors γ energy measurement is most important Angle and time measurements are also effective
09/11/04 T2K seminar/Yusuke UCHIYAMA 10
The MEG Experiment
09/11/04 T2K seminar/Yusuke UCHIYAMA 11
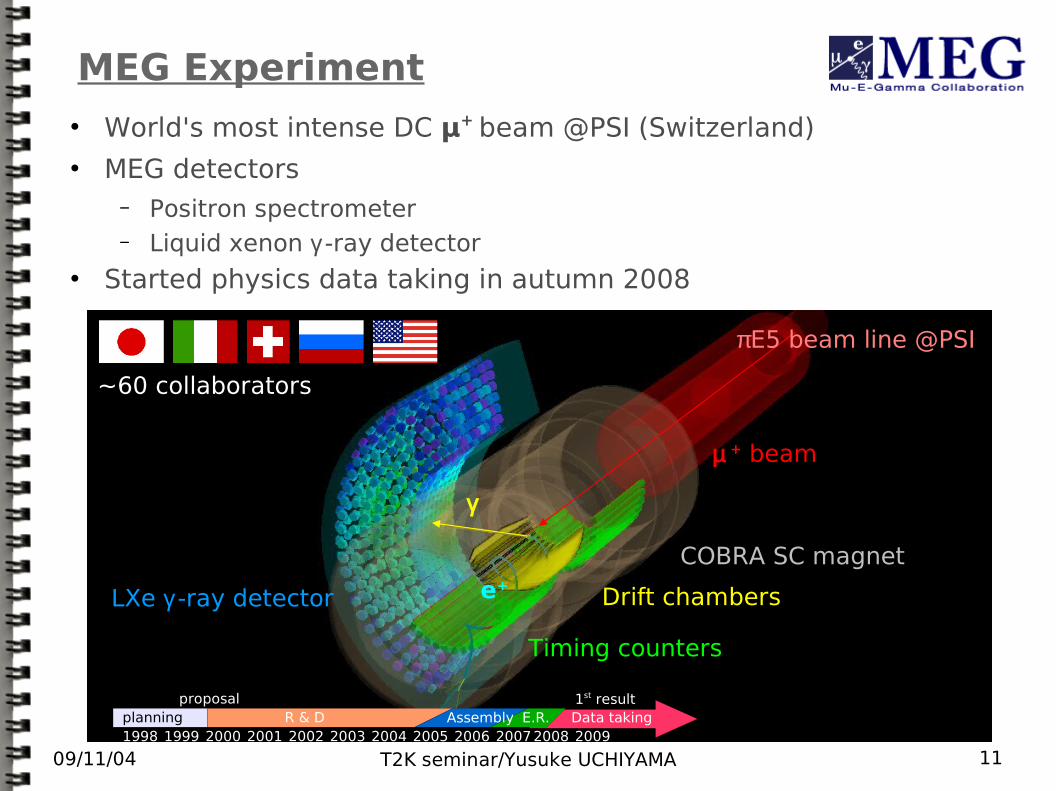
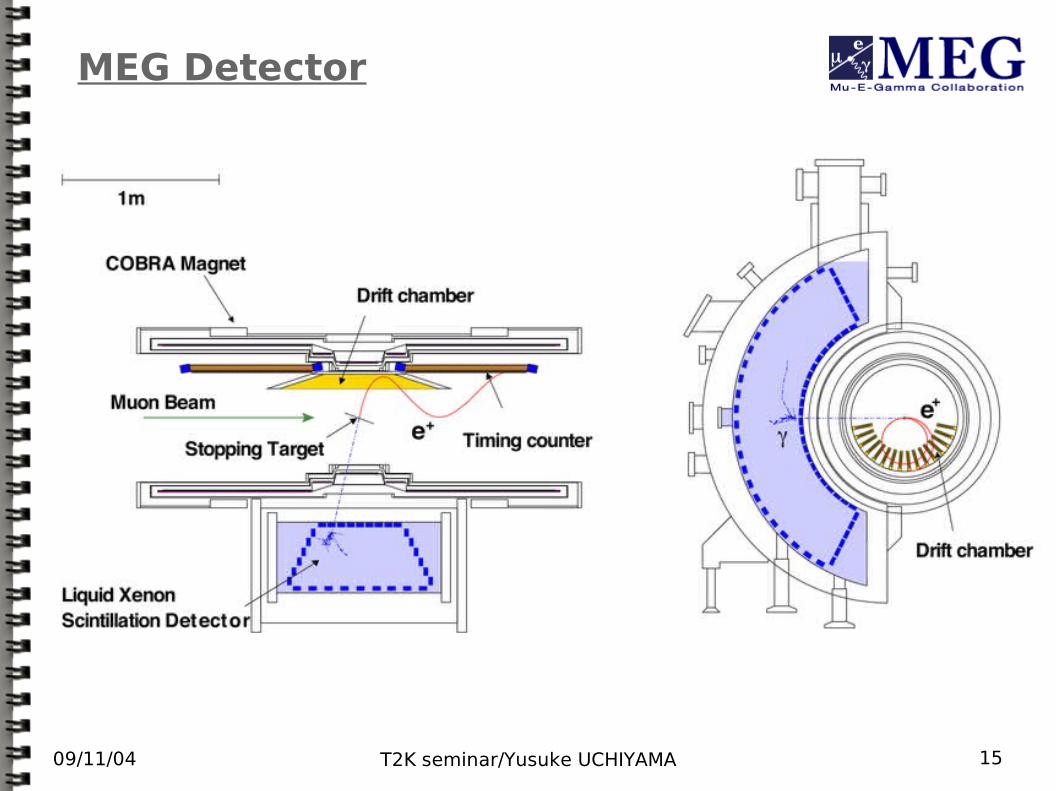
MEG Experiment World's most intense DC μ+ beam @PSI (Switzerland) MEG detectors
− Positron spectrometer− Liquid xenon γ -ray detector
Started physics data taking in autumn 2008
µ + beam
πE5 beam line @PSI
LXe γ -ray detector
COBRA SC magnet
Drift chambers
Timing counters
e+
γ
~60 collaborators
1998 1999 2000 2001 2002 2003 2004 2005 2006 20072008 2009planning R & D Assembly E.R. Data taking
proposal 1st result
09/11/04 T2K seminar/Yusuke UCHIYAMA 12
MEG Experiment
µ + beam
πE5 beam line @PSI
LXe γ -ray detector
COBRA SC magnet
Drift chambers
Timing counters
e+
~60 collaborators
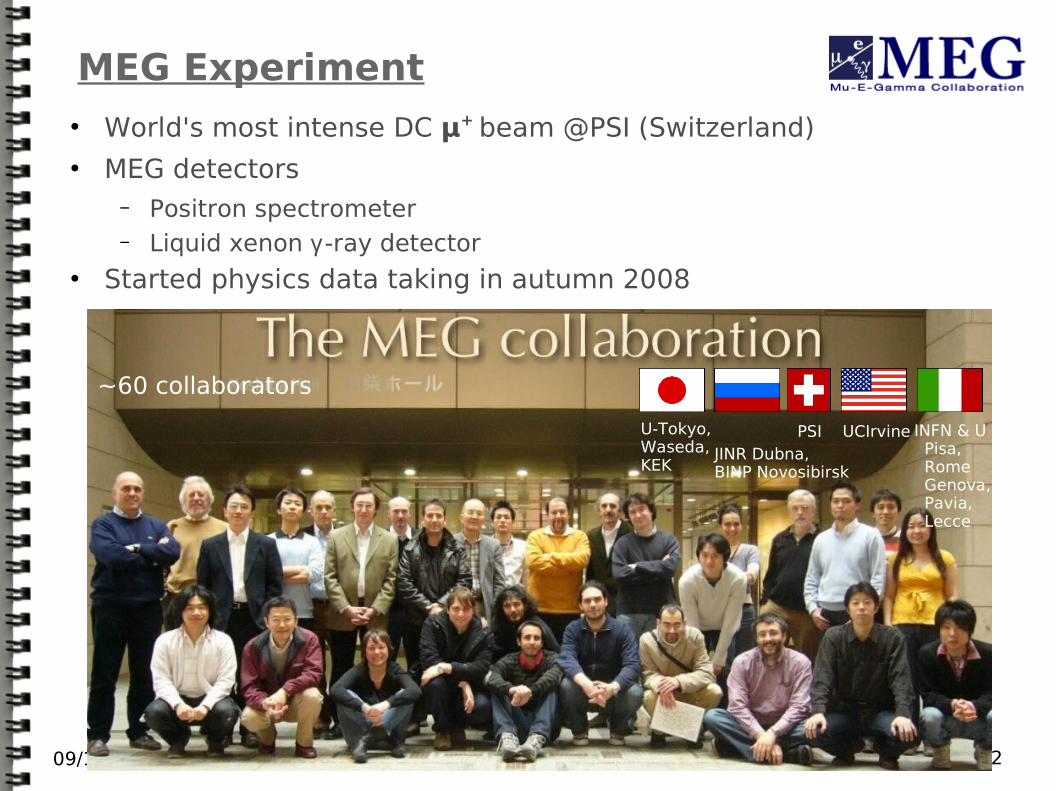
U-Tokyo,Waseda,KEK
INFN & U Pisa, Rome Genova, Pavia, Lecce
JINR Dubna,BINP Novosibirsk
PSI UCIrvine
World's most intense DC μ+ beam @PSI (Switzerland) MEG detectors
− Positron spectrometer− Liquid xenon γ -ray detector
Started physics data taking in autumn 2008
~60 collaborators
09/11/04 T2K seminar/Yusuke UCHIYAMA 13
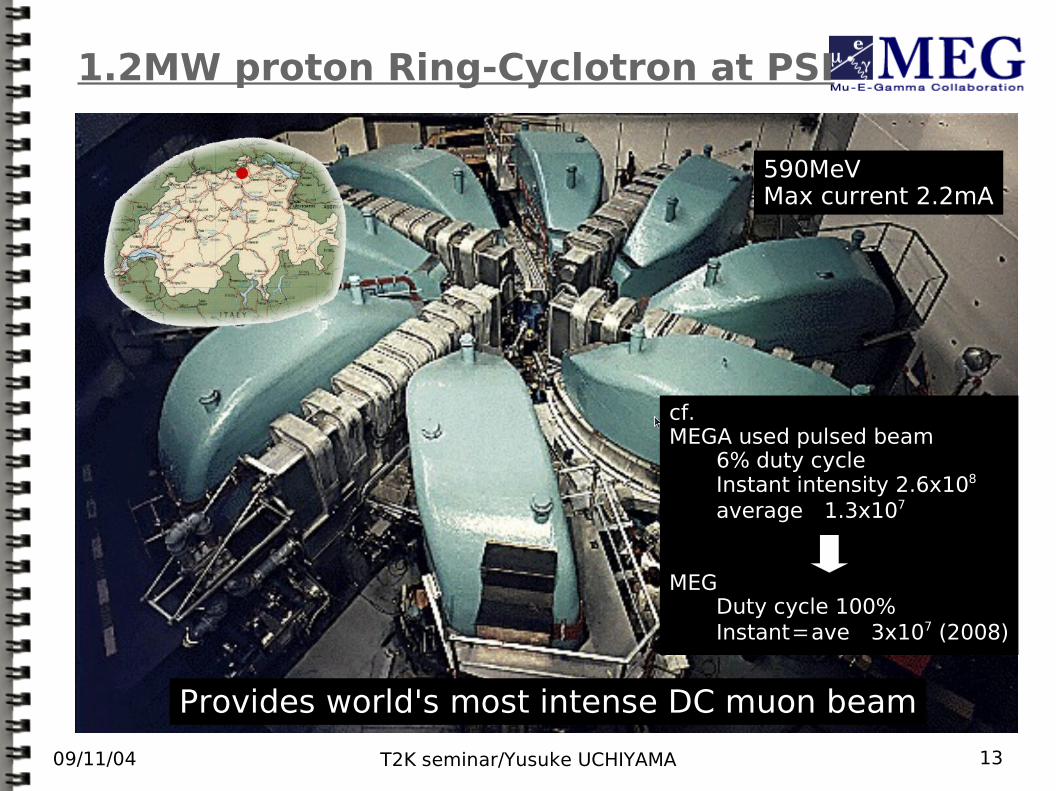
1.2MW proton Ring-Cyclotron at PSI
Provides world's most intense DC muon beam
590MeVMax current 2.2mA
cf.MEGA used pulsed beam
6% duty cycleInstant intensity 2.6x10⁸
average 1.3x10⁷
MEGDuty cycle 100%Instant=ave 3x10⁷ (2008)
09/11/04 T2K seminar/Yusuke UCHIYAMA 14
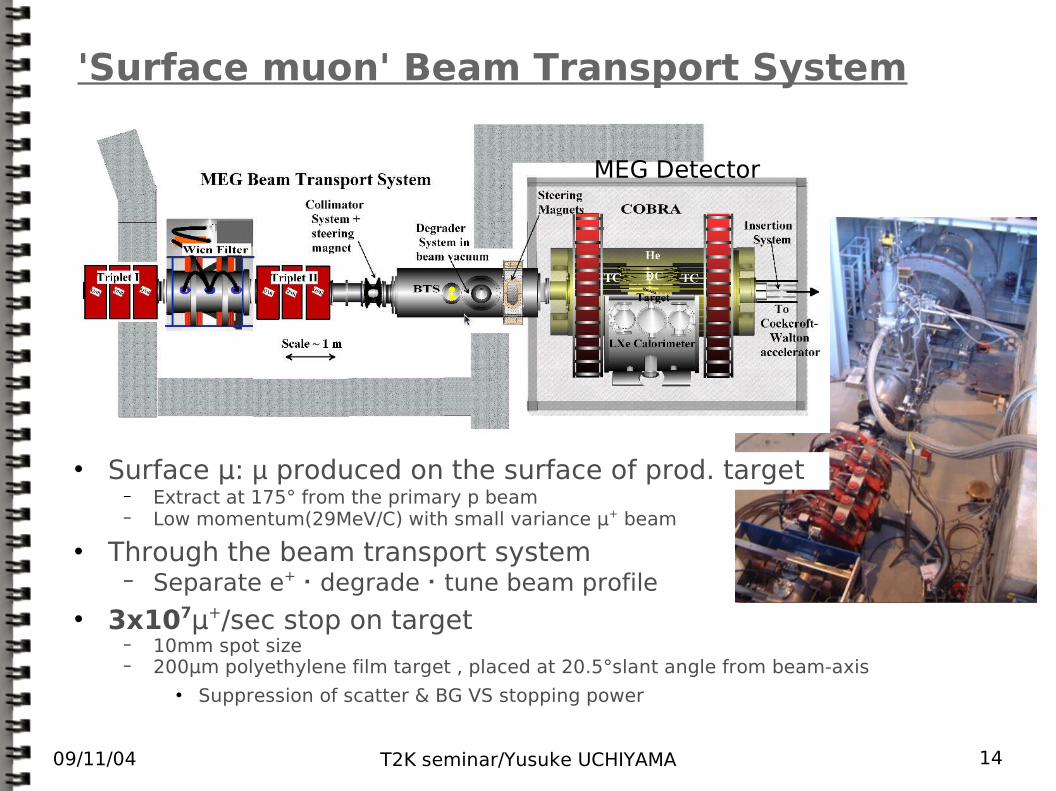
'Surface muon' Beam Transport System
MEG Detector
Surface μ: µ produced on the surface of prod. target − Extract at 175° from the primary p beam− Low momentum(29MeV/C) with small variance μ+ beam
Through the beam transport system− Separate e+・degrade・tune beam profile
3x10⁷μ+/sec stop on target− 10mm spot size− 200μm polyethylene film target , placed at 20.5°slant angle from beam-axis
Suppression of scatter & BG VS stopping power
09/11/04 T2K seminar/Yusuke UCHIYAMA 15
MEG Detector
09/11/04 T2K seminar/Yusuke UCHIYAMA 16
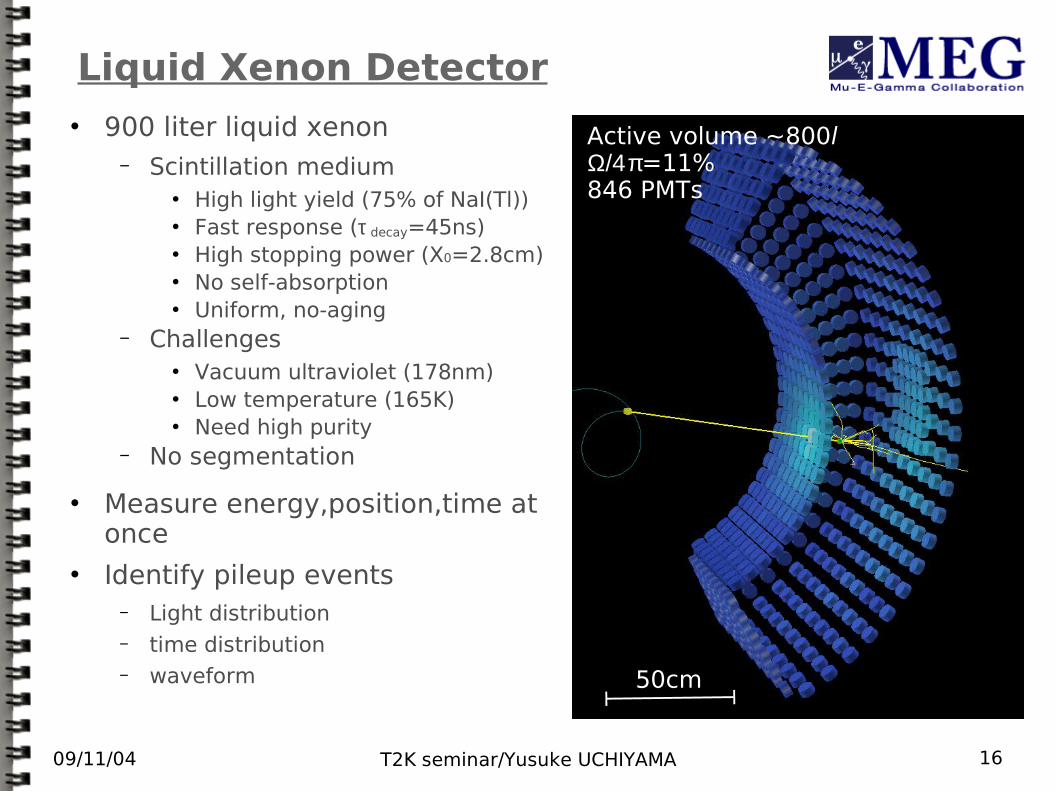
Liquid Xenon Detector 900 liter liquid xenon
− Scintillation medium High light yield (75% of NaI(Tl)) Fast response (τ decay=45ns) High stopping power (X0=2.8cm) No self-absorption Uniform, no-aging
− Challenges Vacuum ultraviolet (178nm) Low temperature (165K) Need high purity
− No segmentation
Measure energy,position,time at once
Identify pileup events− Light distribution− time distribution− waveform2007年完成
50cm
Active volume ~800lΩ/4 π=11%846 PMTs

09/11/04 T2K seminar/Yusuke UCHIYAMA 17
Prototype / R&D Verified performance with prototype detector
− Energy resolution @55MeV
σup
= 1.23%, FWHM = 4.8%
− Time resolution @55MeV
σt = 65 ps
Various R&D, obtained a lot of know-how necessary of the final detector
09/11/04 T2K seminar/Yusuke UCHIYAMA 18
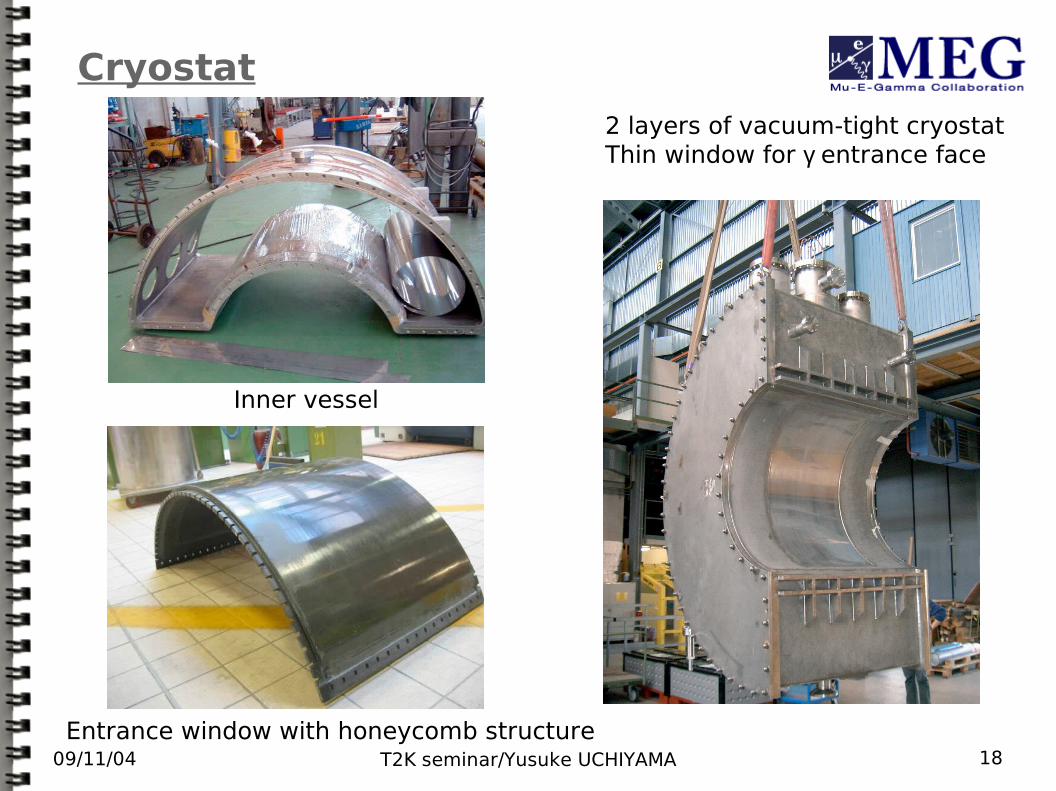
Cryostat2 layers of vacuum-tight cryostatThin window for γ entrance face
Inner vessel
Entrance window with honeycomb structure
09/11/04 T2K seminar/Yusuke UCHIYAMA 19
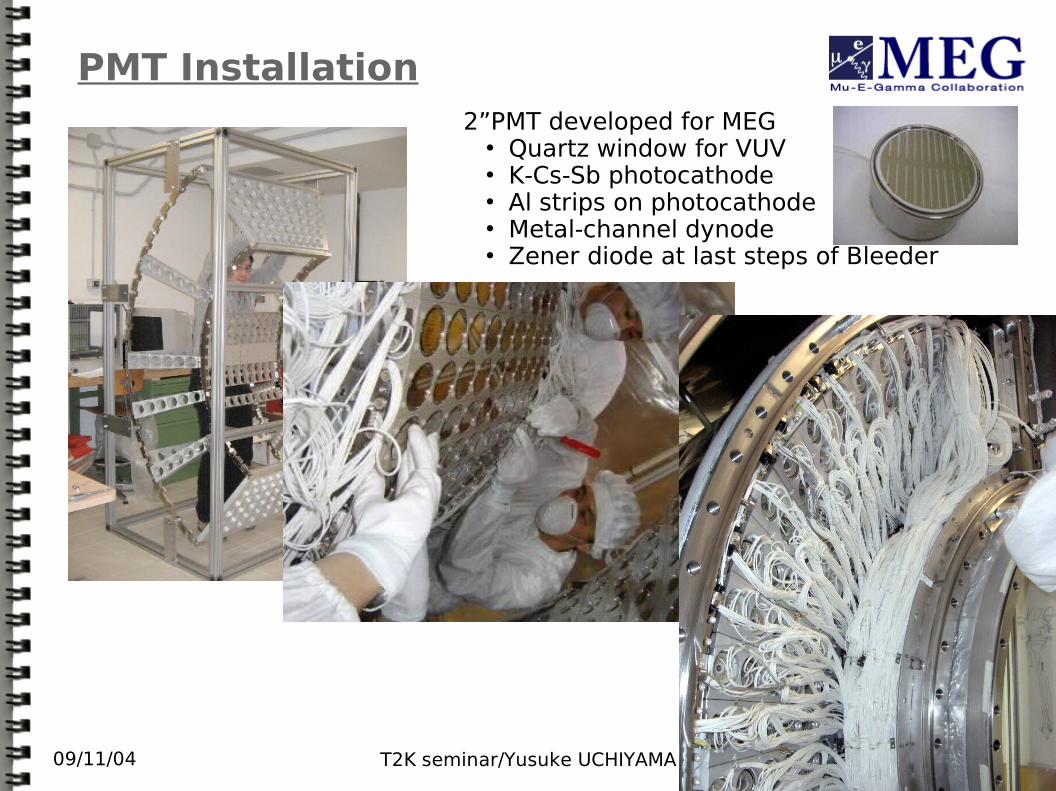
PMT Installation2”PMT developed for MEG
Quartz window for VUV K-Cs-Sb photocathode Al strips on photocathode Metal-channel dynode Zener diode at last steps of Bleeder
09/11/04 T2K seminar/Yusuke UCHIYAMA 20
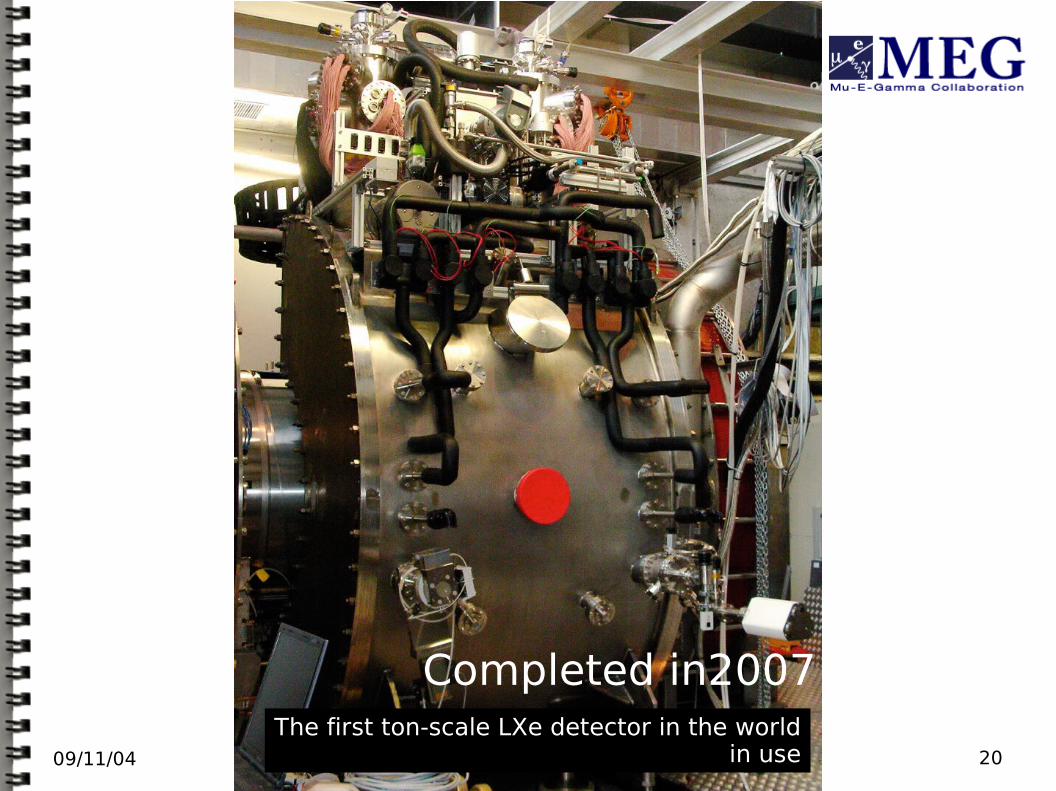
Completed in2007The first ton-scale LXe detector in the world
in use
09/11/04 T2K seminar/Yusuke UCHIYAMA 21
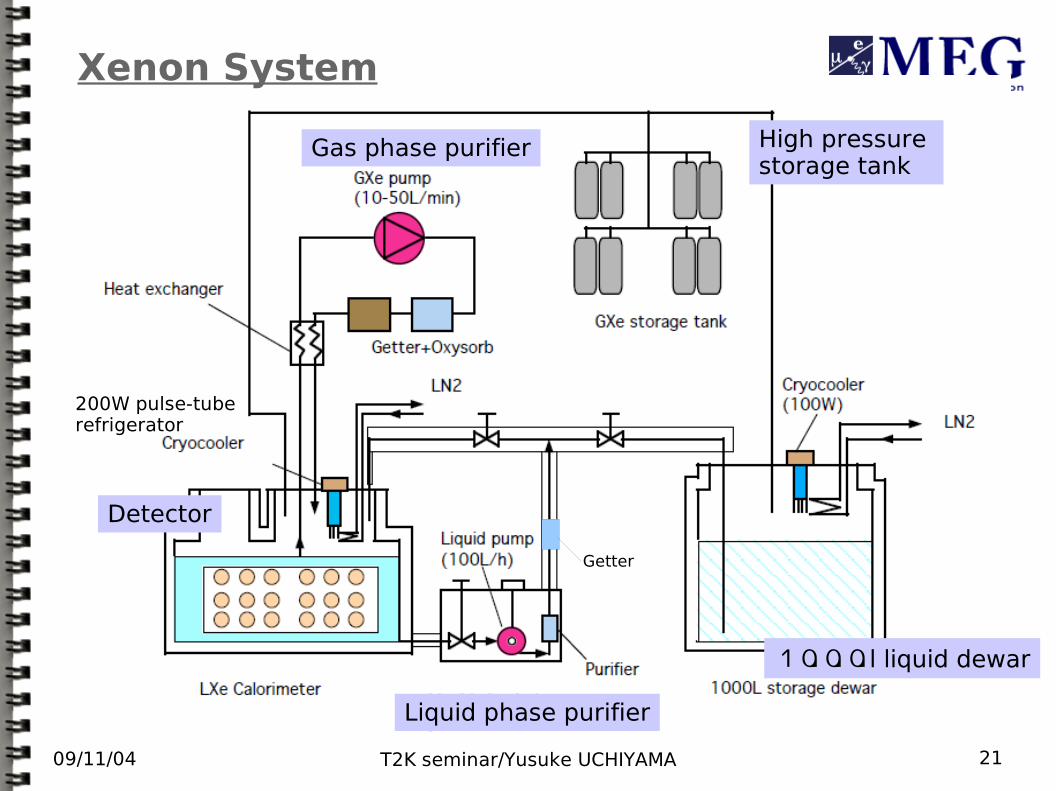
Xenon System
1000l liquid dewar
Gas phase purifier
Getter
Detector
High pressure storage tank
Liquid phase purifier
200W pulse-tuberefrigerator
09/11/04 T2K seminar/Yusuke UCHIYAMA 22
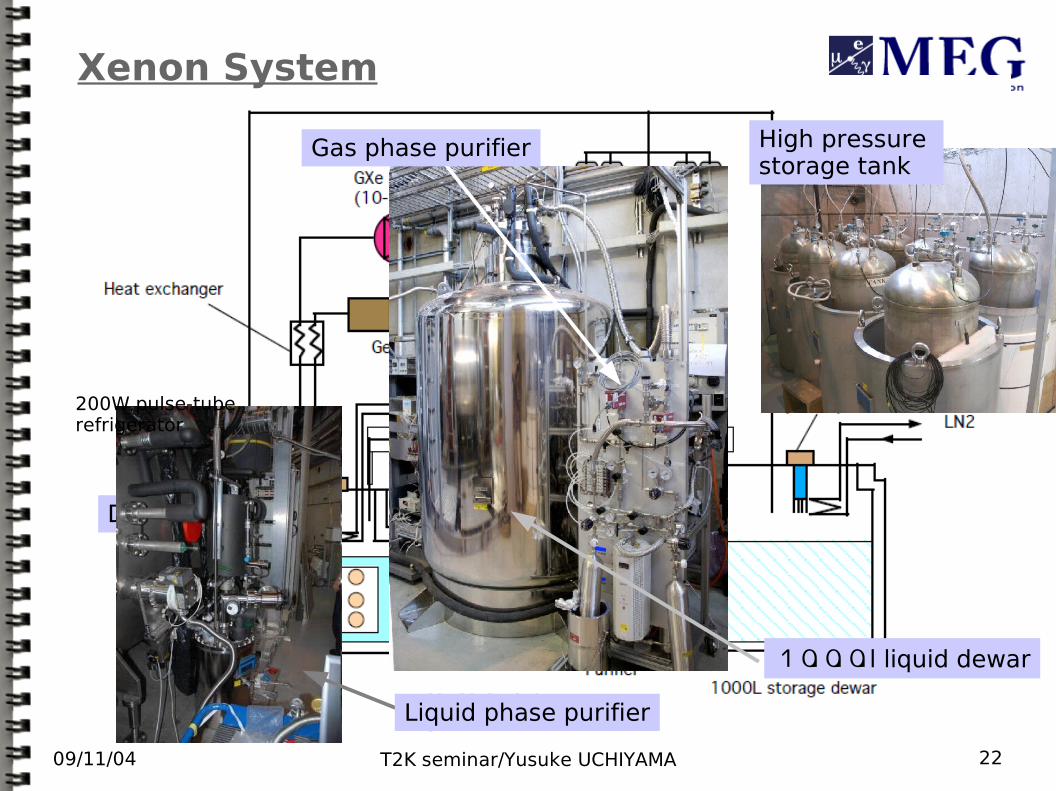
Xenon System
Detector
1000l liquid dewar
Gas phase purifier High pressure storage tank
Liquid phase purifier
200W pulse-tuberefrigerator
09/11/04 T2K seminar/Yusuke UCHIYAMA 23
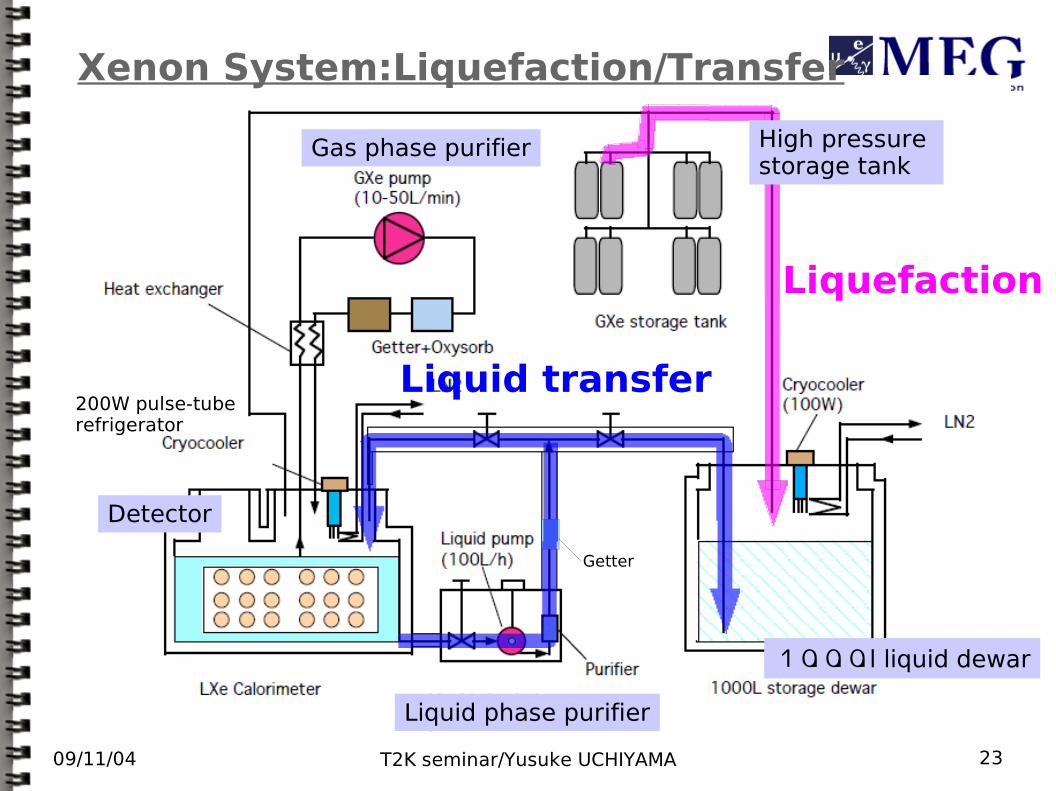
Xenon System:Liquefaction/Transfer
Getter
Liquefaction
Liquid transfer
1000l liquid dewar
Gas phase purifier
Detector
High pressure storage tank
Liquid phase purifier
200W pulse-tuberefrigerator
09/11/04 T2K seminar/Yusuke UCHIYAMA 24
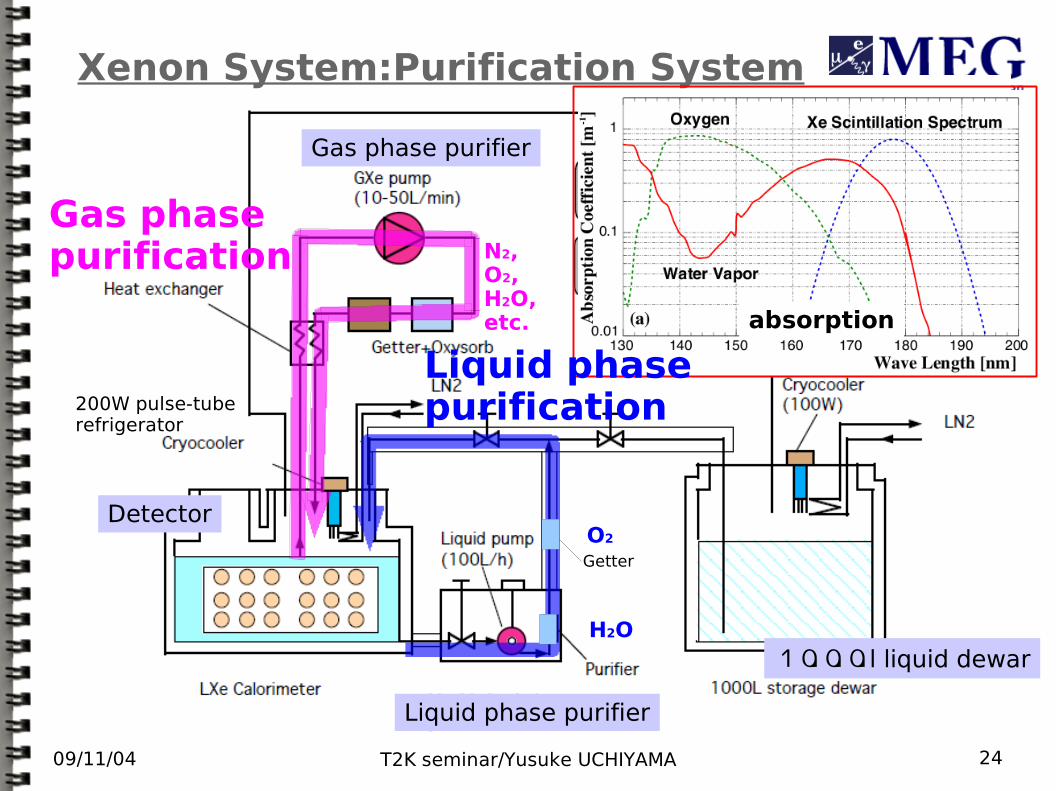
Xenon System:Purification System
Getter
高圧ガス貯蔵タンク
Gas phasepurification N2,
O2,H2O,etc.
O2
H2O1000l liquid dewar
Gas phase purifier
Detector
Liquid phase purifier
200W pulse-tuberefrigerator
Liquid phasepurification
absorption
09/11/04 T2K seminar/Yusuke UCHIYAMA 25
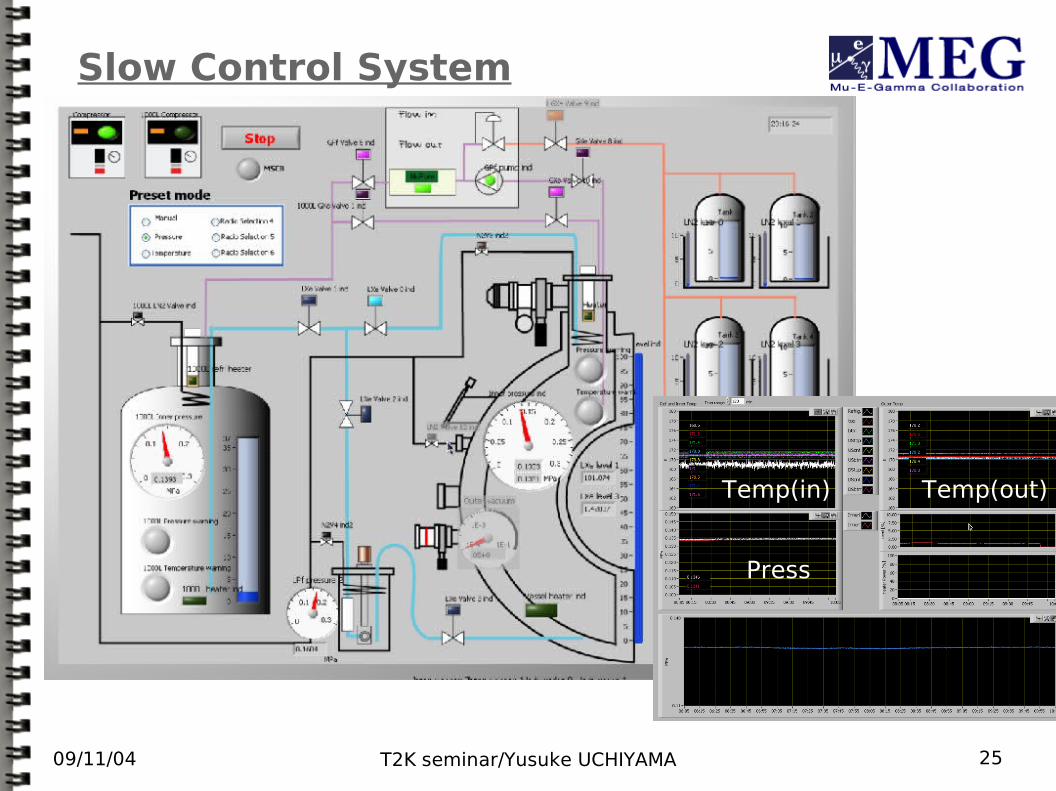
Slow Control System
Temp(in) Temp(out)
Press
09/11/04 T2K seminar/Yusuke UCHIYAMA 26
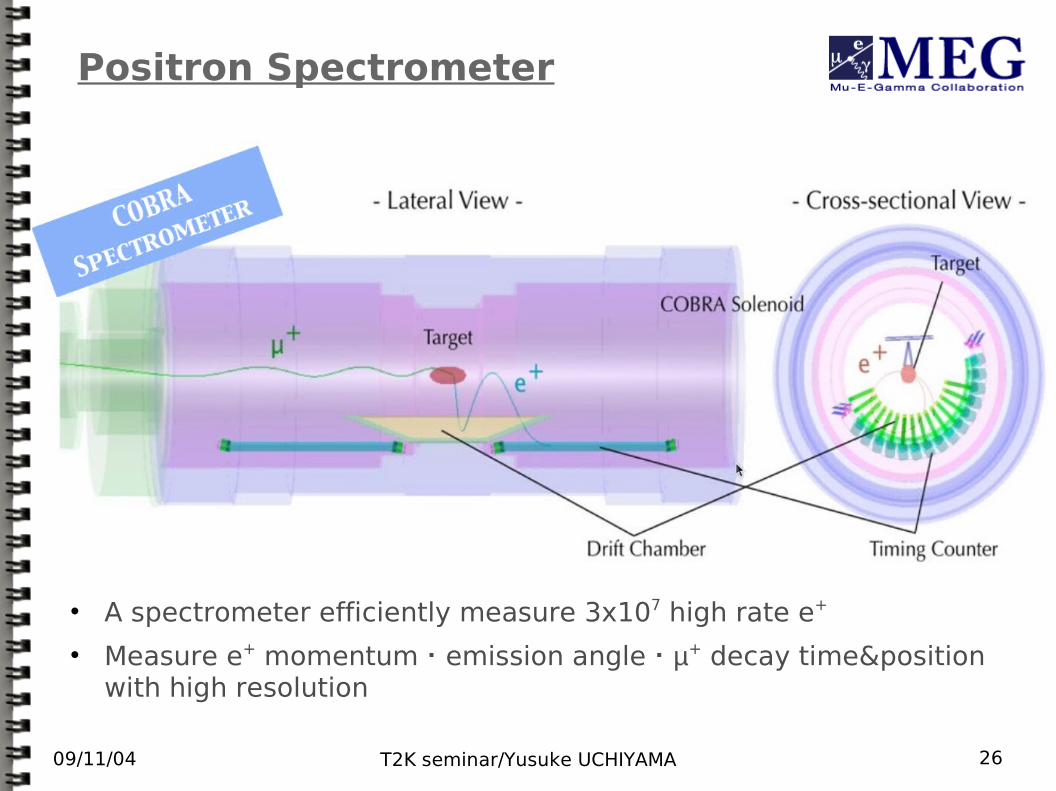
Positron Spectrometer
A spectrometer efficiently measure 3x10⁷ high rate e+
Measure e+ momentum・emission angle・µ+ decay time&position with high resolution
09/11/04 T2K seminar/Yusuke UCHIYAMA 27
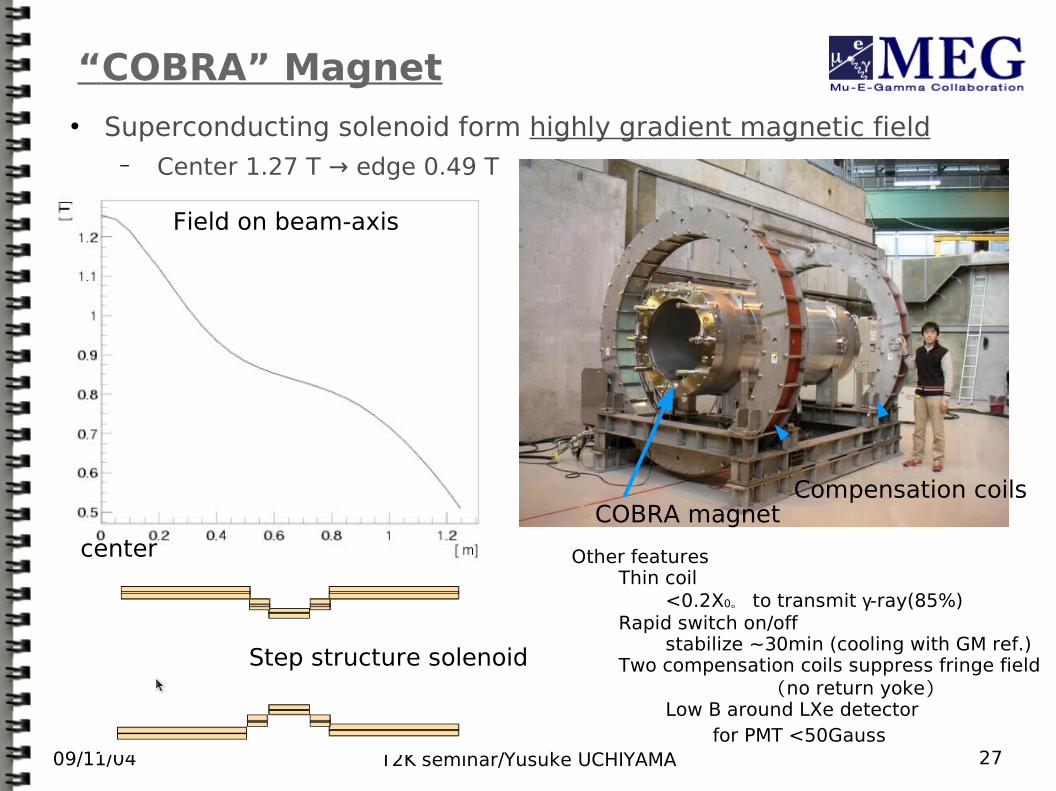
“COBRA” Magnet Superconducting solenoid form highly gradient magnetic field
− Center 1.27 T → edge 0.49 T
COBRA magnetCompensation coils
Field on beam-axis
center
Step structure solenoid
Other featuresThin coil
<0.2X0。 to transmit γ-ray(85%)Rapid switch on/off
stabilize ~30min (cooling with GM ref.)Two compensation coils suppress fringe field (no return yoke)
Low B around LXe detectorfor PMT <50Gauss
09/11/04 T2K seminar/Yusuke UCHIYAMA 28
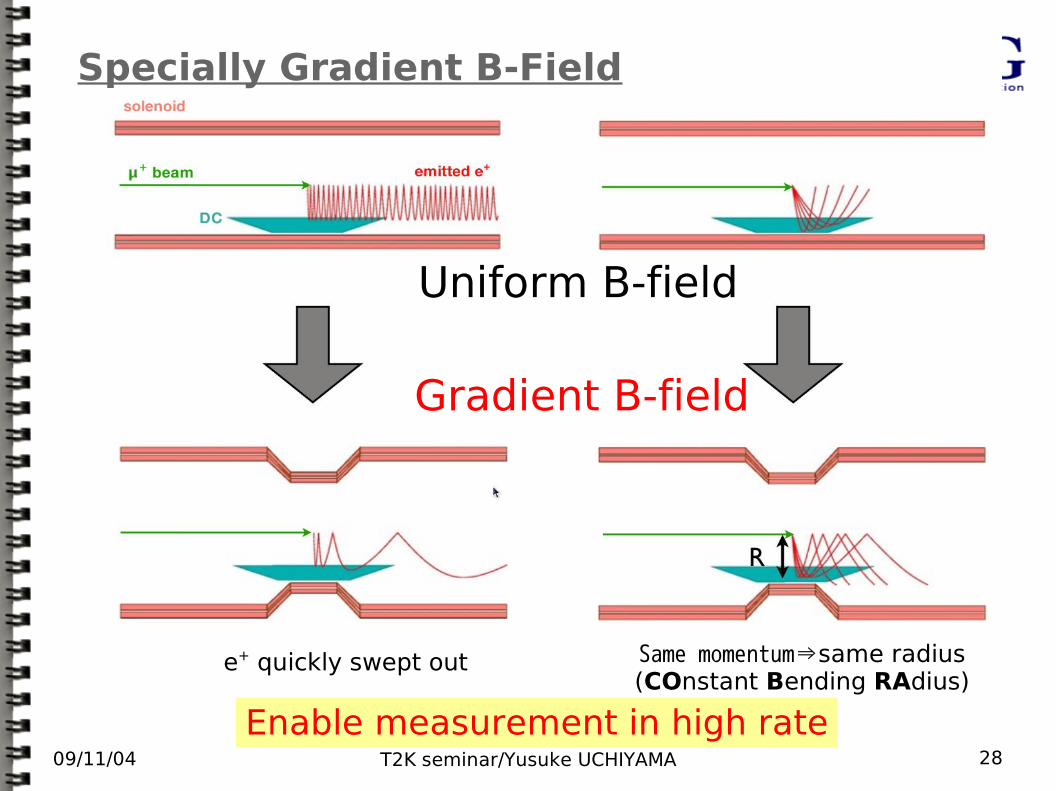
Specially Gradient B-Field
Uniform B-field
Gradient B-field
e+ quickly swept out Same momentum⇒same radius(COnstant Bending RAdius)
Enable measurement in high rate
09/11/04 T2K seminar/Yusuke UCHIYAMA 29
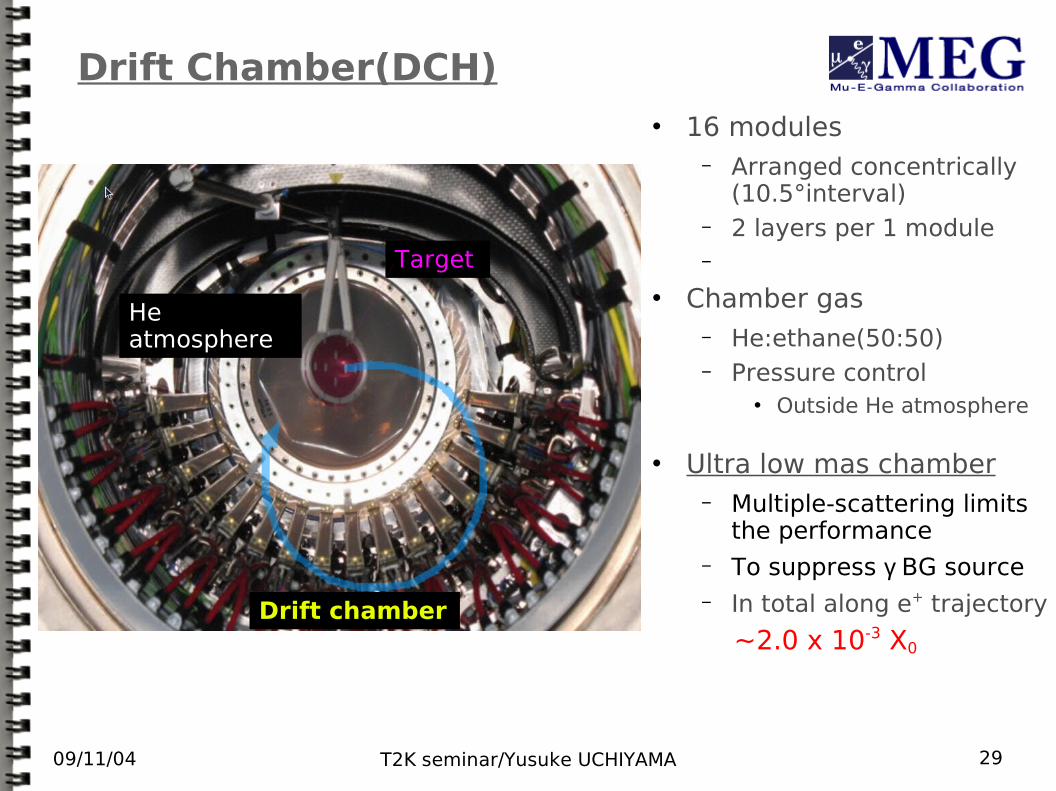
Drift Chamber(DCH) 16 modules
− Arranged concentrically (10.5°interval)
− 2 layers per 1 module−
Chamber gas− He:ethane(50:50)− Pressure control
Outside He atmosphere
Ultra low mas chamber− Multiple-scattering limits
the performance− To suppress γ BG source− In total along e+ trajectory
~2.0 x 10-3 X0
Target
Drift chamber
He atmosphere
09/11/04 T2K seminar/Yusuke UCHIYAMA 30
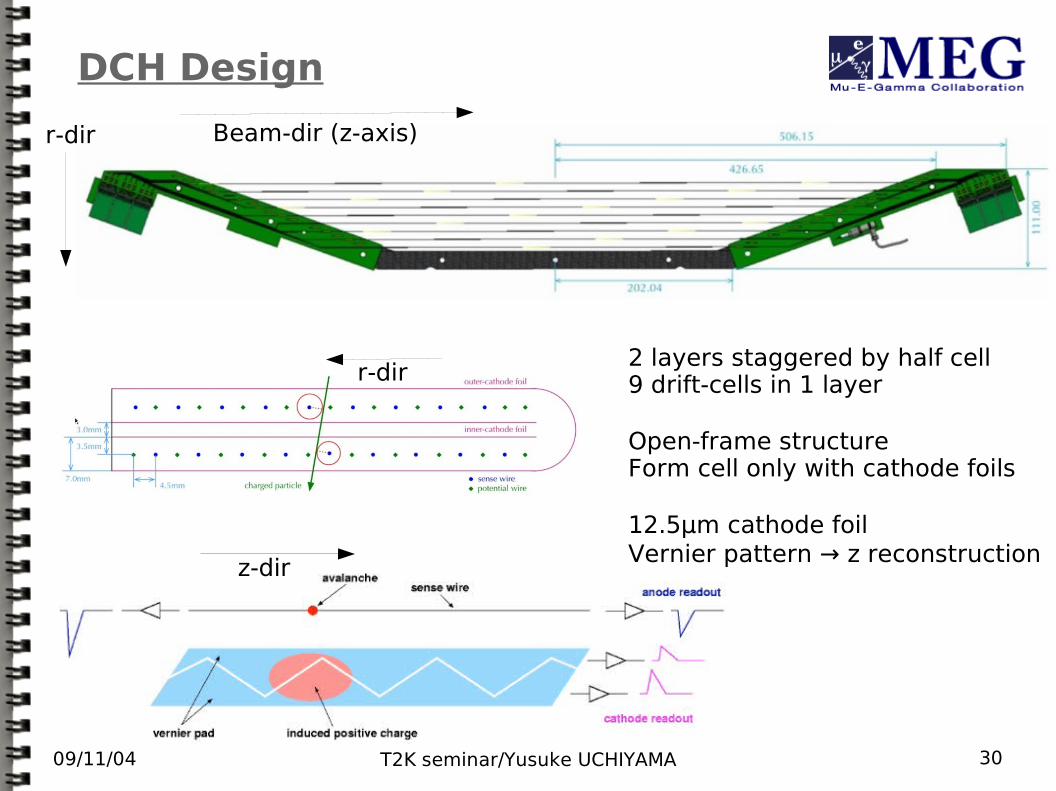
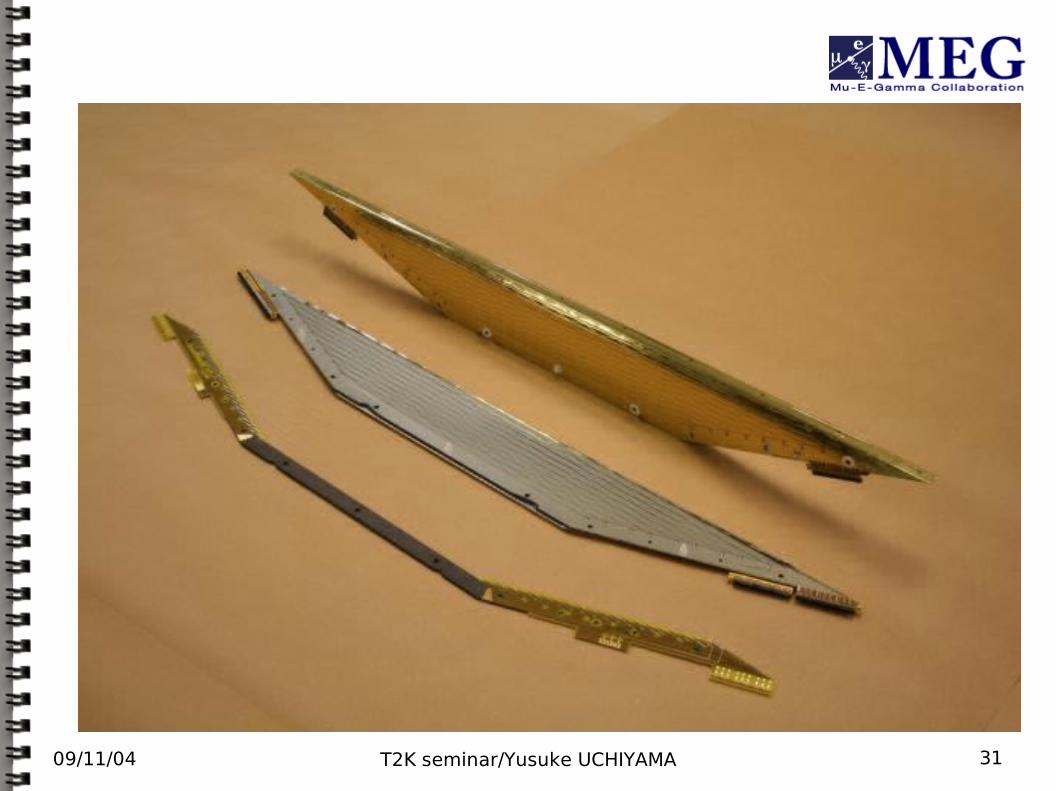
DCH Design
2 layers staggered by half cell9 drift-cells in 1 layer
Open-frame structureForm cell only with cathode foils
12.5μm cathode foilVernier pattern → z reconstruction
Beam-dir (z-axis)r-dir
r-dir
z-dir
09/11/04 T2K seminar/Yusuke UCHIYAMA 31
09/11/04 T2K seminar/Yusuke UCHIYAMA 32
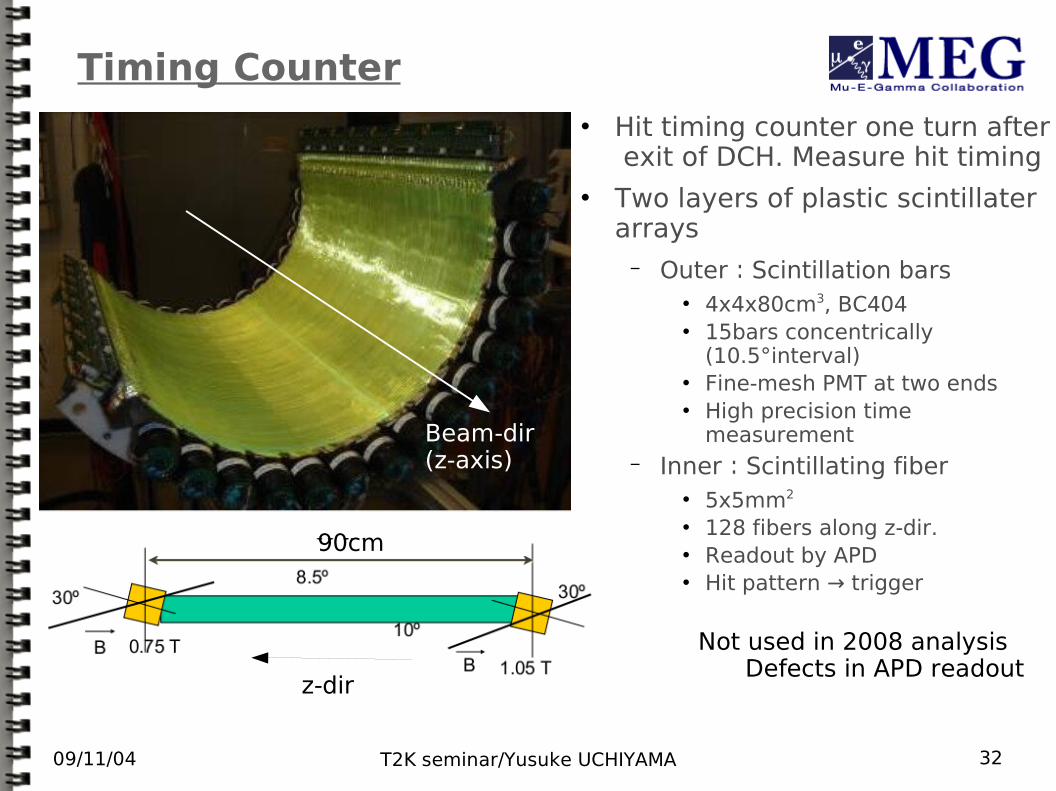
Timing Counter Hit timing counter one turn after
exit of DCH. Measure hit timing Two layers of plastic scintillater
arrays− Outer:Scintillation bars
4x4x80cm3, BC404 15bars concentrically
(10.5°interval) Fine-mesh PMT at two ends High precision time
measurement− Inner:Scintillating fiber
5x5mm2
128 fibers along z-dir. Readout by APD Hit pattern → trigger
90cm
z-dir
Beam-dir(z-axis)
Not used in 2008 analysisDefects in APD readout
09/11/04 T2K seminar/Yusuke UCHIYAMA 33
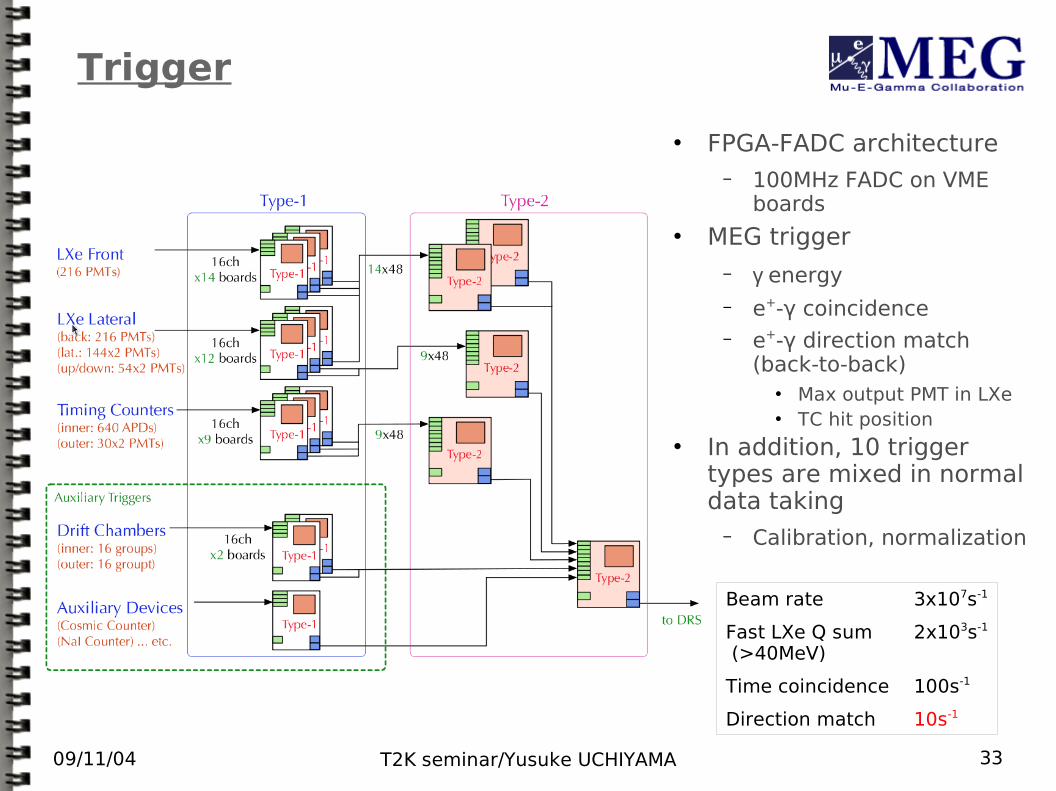
Trigger
FPGA-FADC architecture− 100MHz FADC on VME
boards MEG trigger
− γ energy− e+-γ coincidence− e+-γ direction match
(back-to-back) Max output PMT in LXe TC hit position
In addition, 10 trigger types are mixed in normal data taking
− Calibration, normalization
Beam rate 3x10⁷s-1
Fast LXe Q sum 2x10³s-1
(>40MeV)
Time coincidence 100s-1
Direction match 10s-1
09/11/04 T2K seminar/Yusuke UCHIYAMA 34
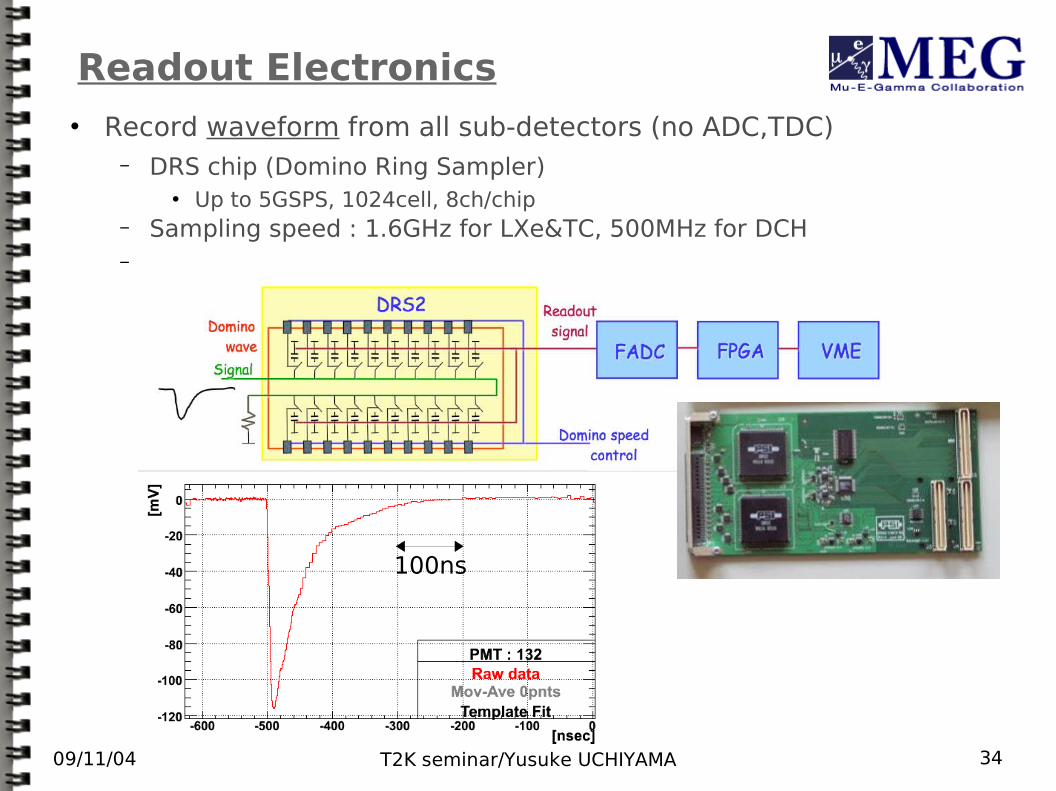
Readout Electronics Record waveform from all sub-detectors (no ADC,TDC)
− DRS chip (Domino Ring Sampler) Up to 5GSPS, 1024cell, 8ch/chip
− Sampling speed : 1.6GHz for LXe&TC, 500MHz for DCH−
100ns
09/11/04 T2K seminar/Yusuke UCHIYAMA 35
µ + b e a m
p b e a m
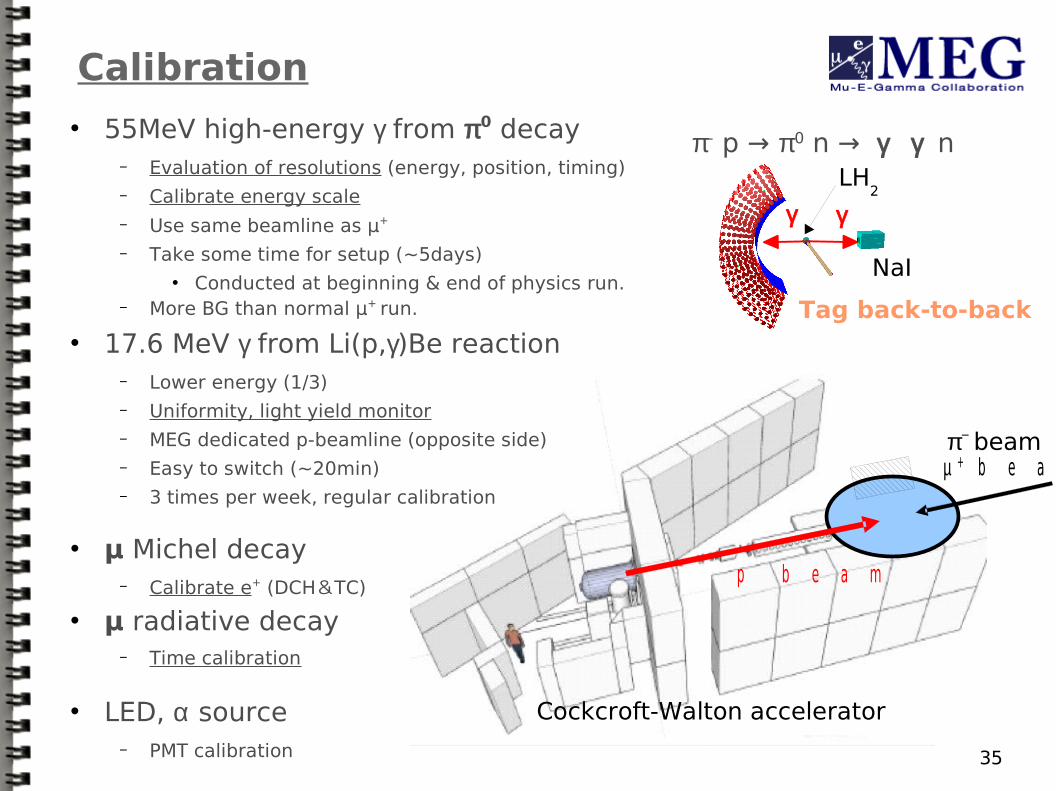
Calibration 55MeV high-energy γ from π0 decay
− Evaluation of resolutions (energy, position, timing)− Calibrate energy scale− Use same beamline as μ+
− Take some time for setup (~5days) Conducted at beginning & end of physics run.
− More BG than normal μ+ run.
17.6 MeV γ from Li(p,γ)Be reaction− Lower energy (1/3)− Uniformity, light yield monitor− MEG dedicated p-beamline (opposite side)− Easy to switch (~20min)− 3 times per week, regular calibration
μ Michel decay− Calibrate e+ (DCH&TC)
μ radiative decay− Time calibration
LED, α source− PMT calibration
π- p → π0 n → γ γ n
γγ
Tag back-to-back
NaI
LH2
π− beam
Cockcroft-Walton accelerator
09/11/04 T2K seminar/Yusuke UCHIYAMA 36
RUN 2008
09/11/04 T2K seminar/Yusuke UCHIYAMA 37
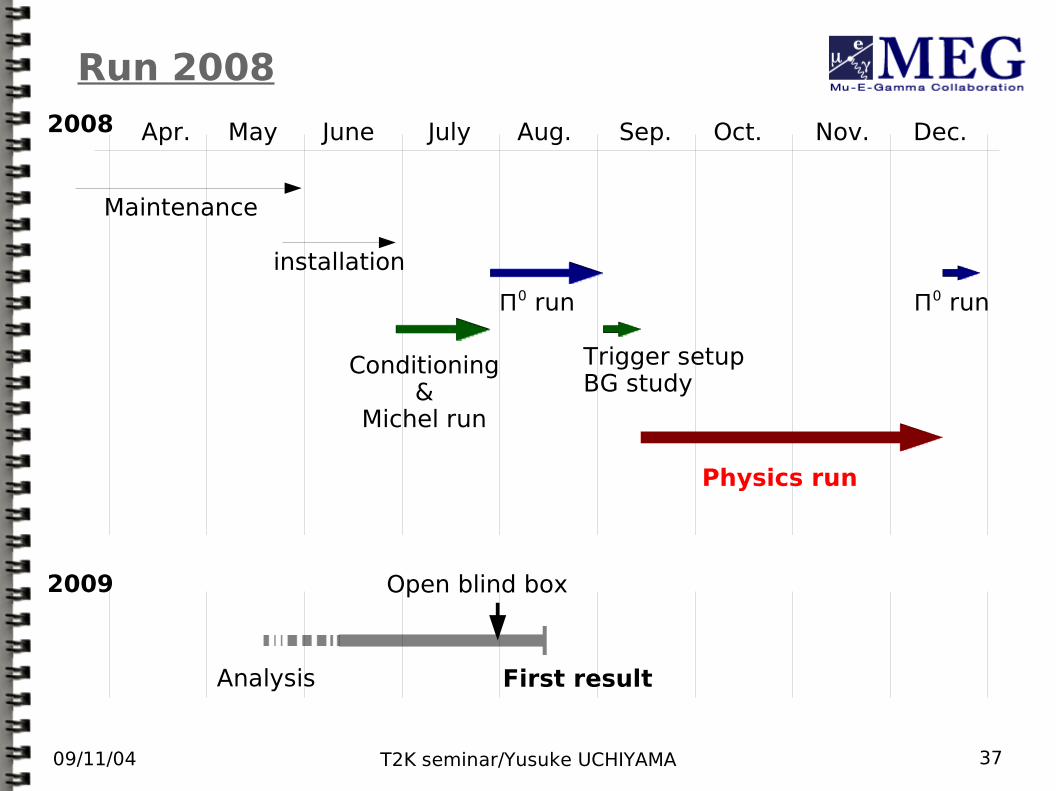
Run 2008
Maintenance
Apr. May June July Aug. Sep. Oct. Nov. Dec.
installation
Conditioning&
Michel run
Π0 run
Trigger setupBG study
Π0 run
Physics run
2009
2008
Open blind box
Analysis First result
09/11/04 T2K seminar/Yusuke UCHIYAMA 38
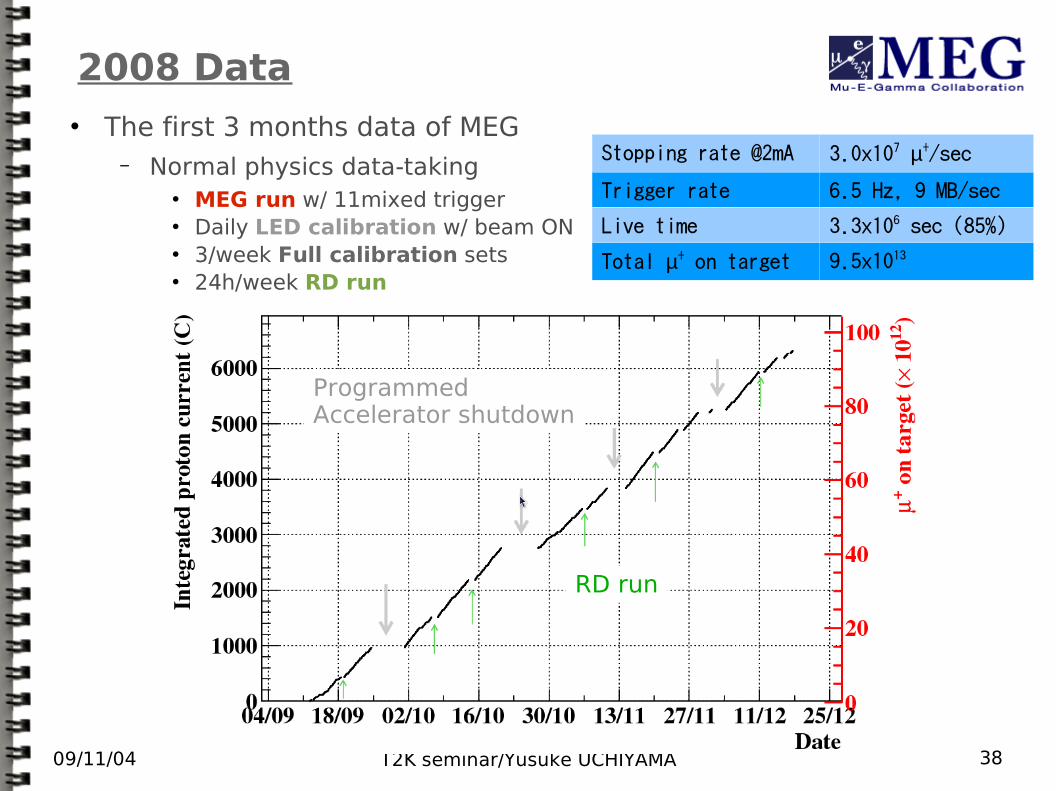
2008 Data The first 3 months data of MEG
− Normal physics data-taking MEG run w/ 11mixed trigger Daily LED calibration w/ beam ON 3/week Full calibration sets 24h/week RD run
ProgrammedAccelerator shutdown
RD run
Stopping rate @2mA 3.0x10⁷ µ+/sec
Trigger rate 6.5 Hz, 9 MB/sec
Live time 3.3x10⁶ sec (85%)
Total µ+ on target 9.5x10¹³
09/11/04 T2K seminar/Yusuke UCHIYAMA 39
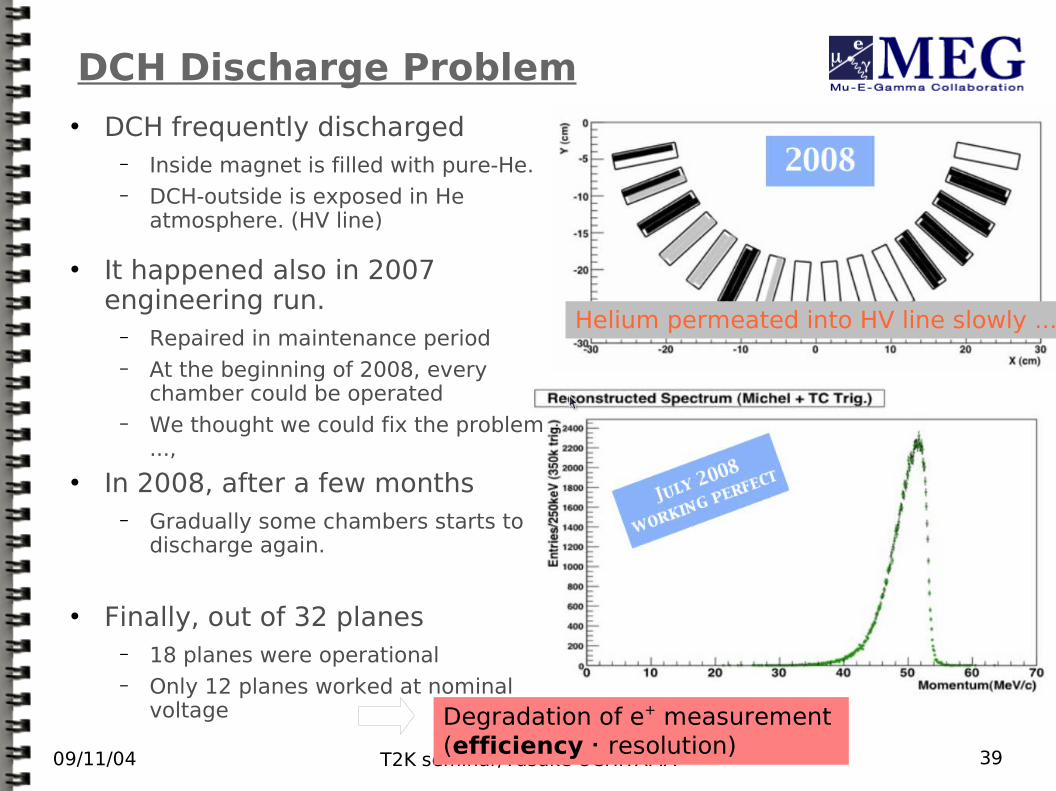
DCH Discharge Problem DCH frequently discharged
− Inside magnet is filled with pure-He.− DCH-outside is exposed in He
atmosphere. (HV line)
It happened also in 2007 engineering run.
− Repaired in maintenance period− At the beginning of 2008, every
chamber could be operated− We thought we could fix the problem
..., In 2008, after a few months
− Gradually some chambers starts to discharge again.
Finally, out of 32 planes− 18 planes were operational− Only 12 planes worked at nominal
voltage
Helium permeated into HV line slowly ...
Degradation of e+ measurement (efficiency・resolution)
09/11/04 T2K seminar/Yusuke UCHIYAMA 40
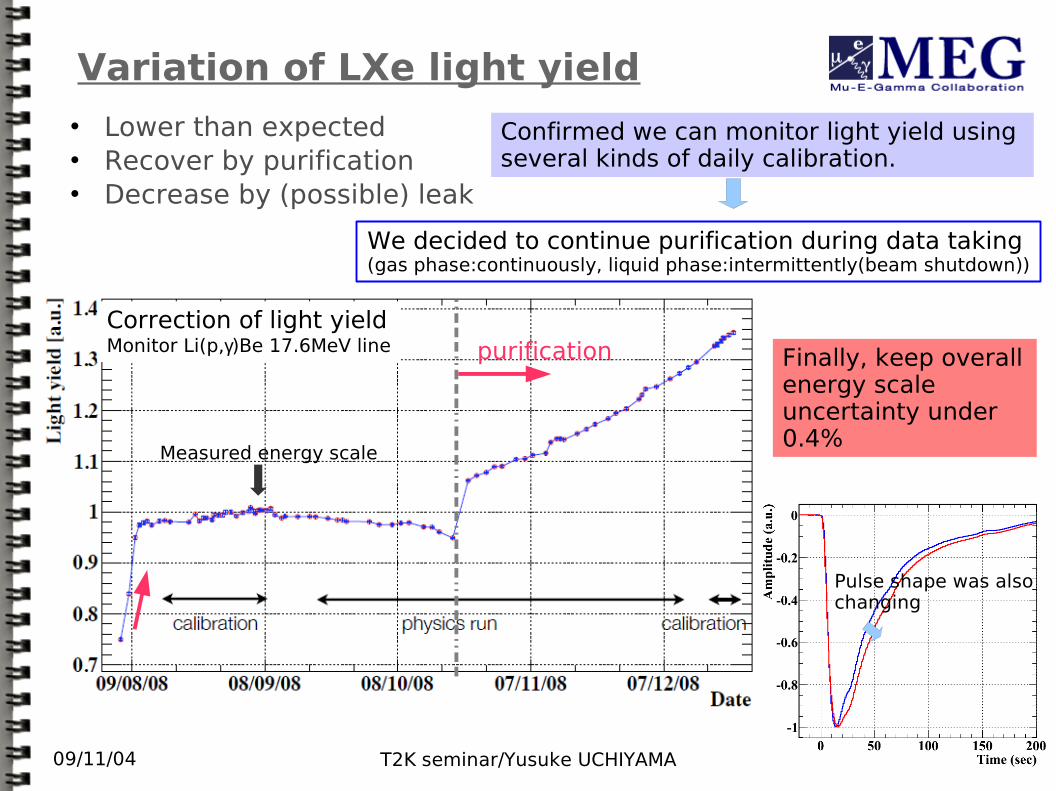
Variation of LXe light yield Lower than expected Recover by purification Decrease by (possible) leak
9月12月
purification
Measured energy scale
Confirmed we can monitor light yield using several kinds of daily calibration.
We decided to continue purification during data taking(gas phase:continuously, liquid phase:intermittently(beam shutdown))
Pulse shape was alsochanging
Correction of light yieldMonitor Li(p,γ)Be 17.6MeV line Finally, keep overall
energy scale uncertainty under 0.4%
09/11/04 T2K seminar/Yusuke UCHIYAMA 41
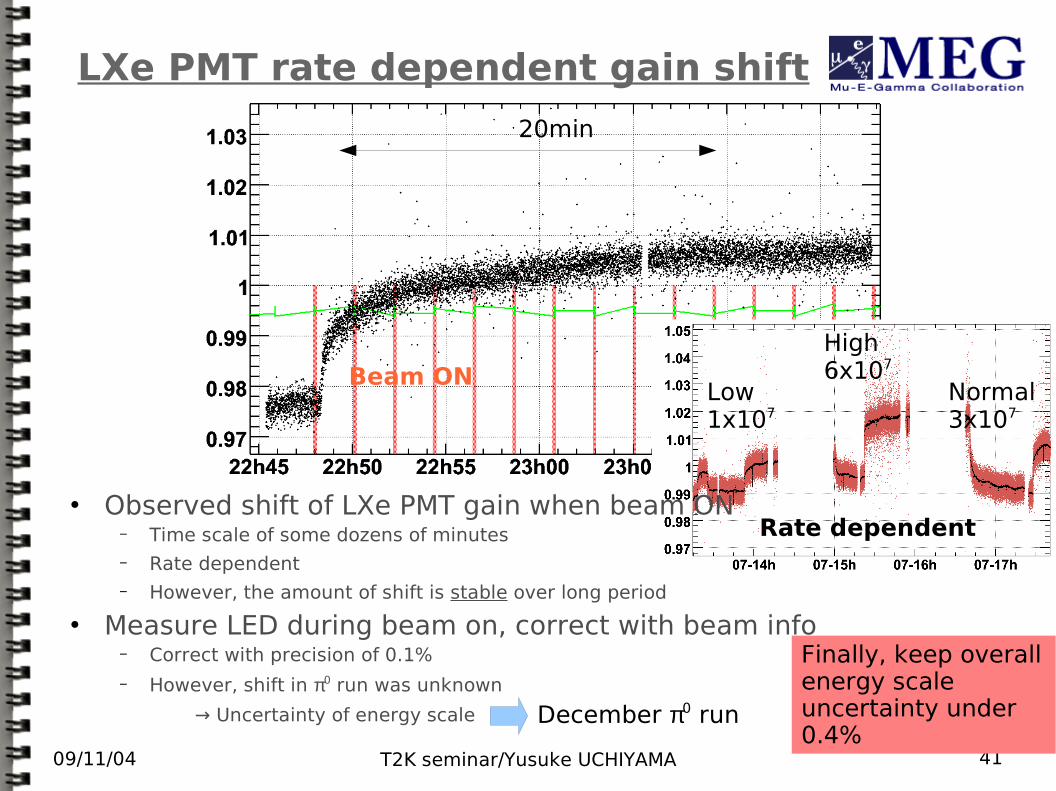
LXe PMT rate dependent gain shift
20min
Low1x107
High6x107
Normal3x107
Rate dependent
Beam ON
December π0 run
Finally, keep overall energy scale uncertainty under 0.4%
Observed shift of LXe PMT gain when beam ON− Time scale of some dozens of minutes− Rate dependent− However, the amount of shift is stable over long period
Measure LED during beam on, correct with beam info− Correct with precision of 0.1%
− However, shift in π0 run was unknown
→ Uncertainty of energy scale
09/11/04 T2K seminar/Yusuke UCHIYAMA 42
Analysis
09/11/04 T2K seminar/Yusuke UCHIYAMA 43
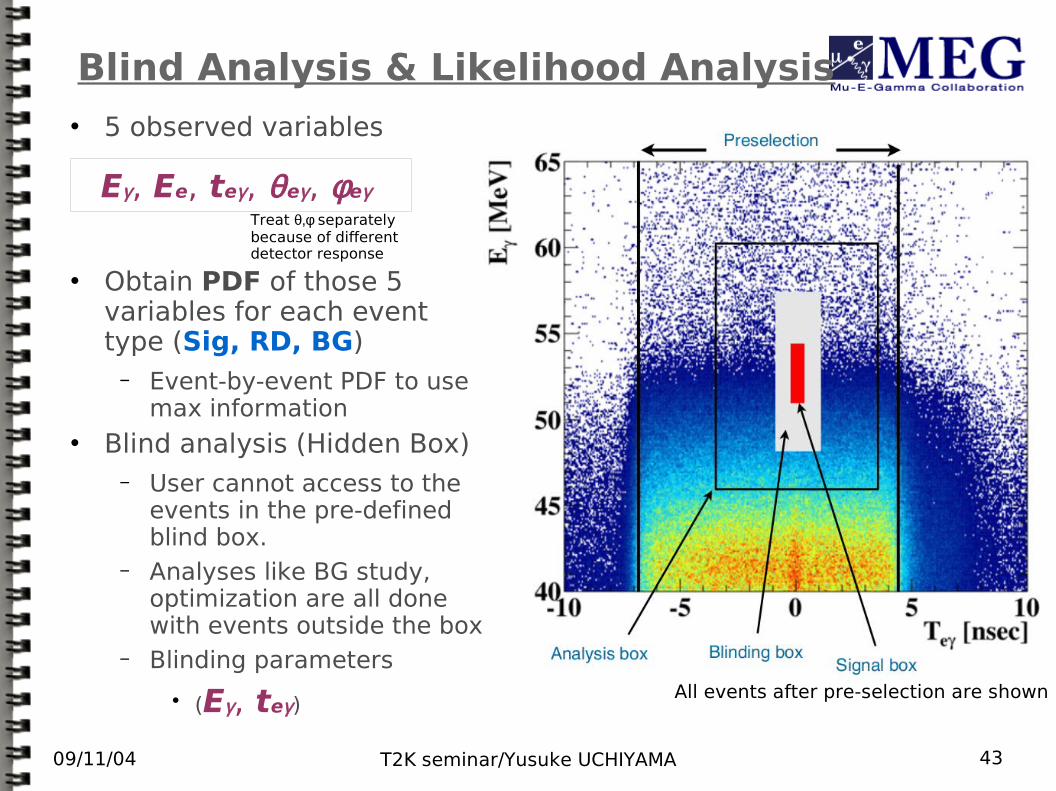
Blind Analysis & Likelihood Analysis 5 observed variables
All events after pre-selection are shown
Eγ, Ee, teγ, θeγ, φeγTreat θ,φ separately because of different detector response
Blind analysis (Hidden Box)− User cannot access to the
events in the pre-defined blind box.
− Analyses like BG study, optimization are all done with events outside the box
− Blinding parameters
(Eγ, teγ)
Obtain PDF of those 5 variables for each event type (Sig, RD, BG)
− Event-by-event PDF to use max information
09/11/04 T2K seminar/Yusuke UCHIYAMA 44
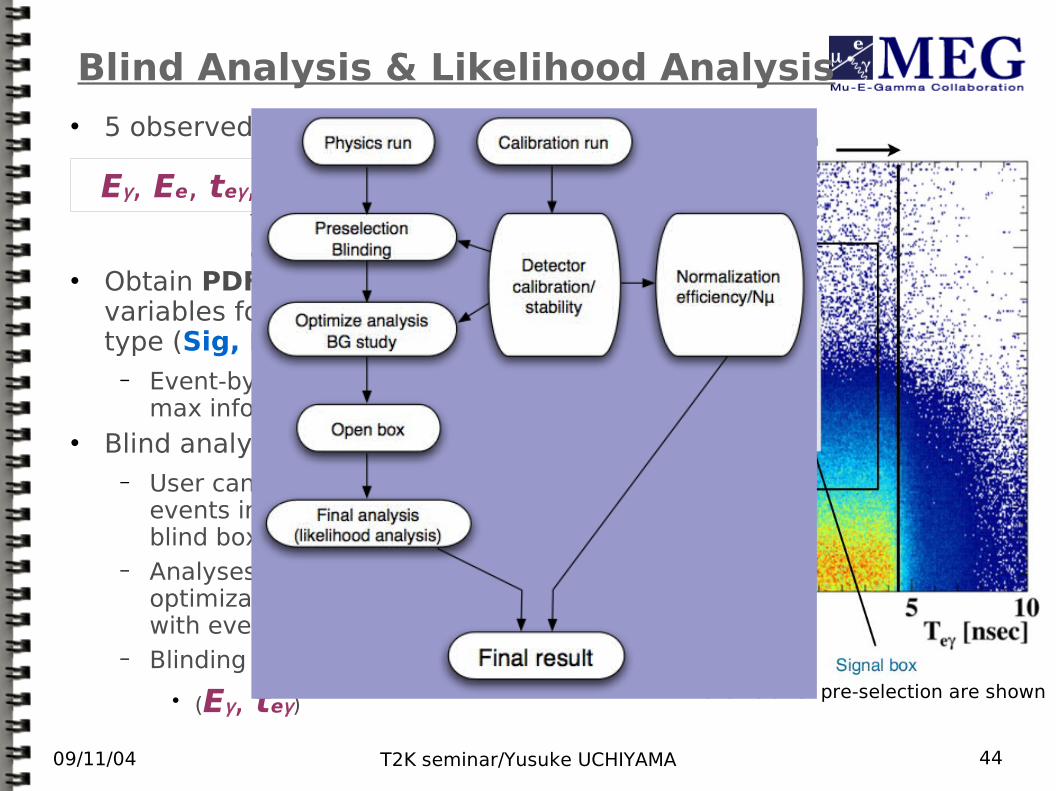
Blind Analysis & Likelihood Analysis 5 observed variables
All events after pre-selection are shown
Eγ, Ee, teγ, θeγ, φeγ
Treat θ,φ separately because of different detector response
Blind analysis (Hidden Box)− User cannot access to the
events in the pre-defined blind box.
− Analyses like BG study, optimization are all done with events outside the box
− Blinding parameters
(Eγ, teγ)
Obtain PDF of those 5 variables for each event type (Sig, RD, BG)
− Event-by-event PDF to use max information
Eγ, Ee, teγ, θeγ, φeγ
09/11/04 T2K seminar/Yusuke UCHIYAMA 45
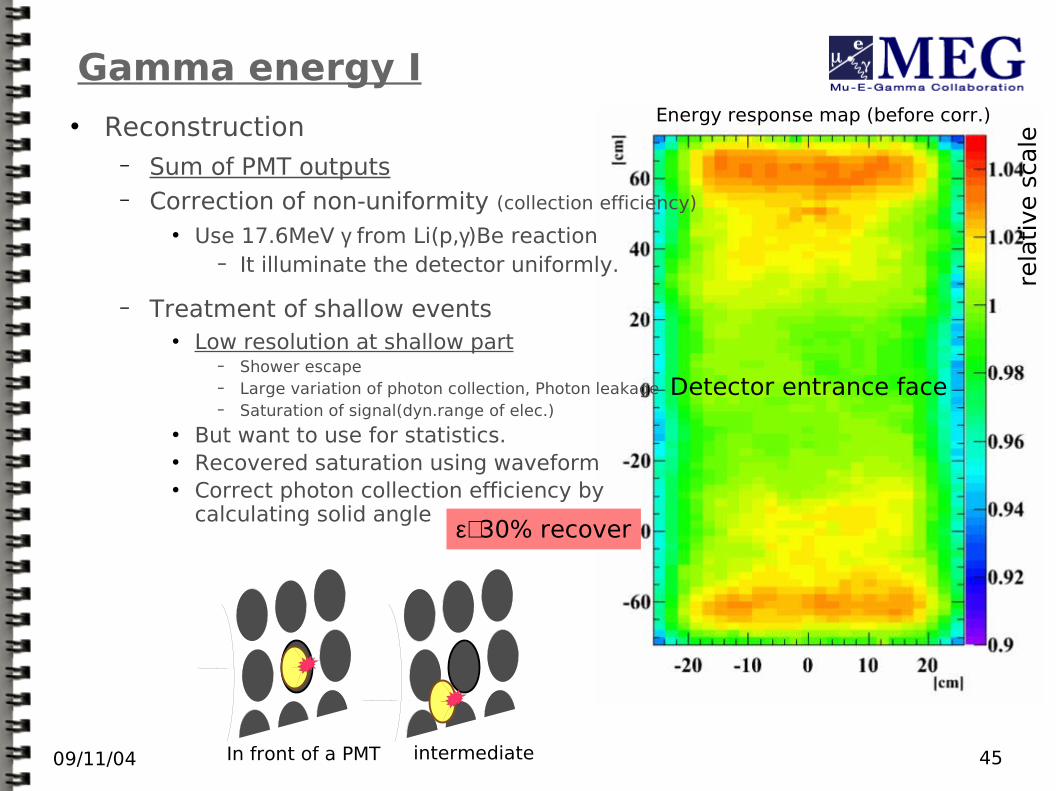
Gamma energy I Reconstruction
− Sum of PMT outputs− Correction of non-uniformity (collection efficiency)
Use 17.6MeV γ from Li(p,γ)Be reaction− It illuminate the detector uniformly.
− Treatment of shallow events Low resolution at shallow part
− Shower escape− Large variation of photon collection, Photon leakage− Saturation of signal(dyn.range of elec.)
But want to use for statistics. Recovered saturation using waveform Correct photon collection efficiency by
calculating solid angle
Detector entrance face
Energy response map (before corr.)
rela
tive s
cale
ε∼30% recover
In front of a PMT intermediate
09/11/04 T2K seminar/Yusuke UCHIYAMA 46
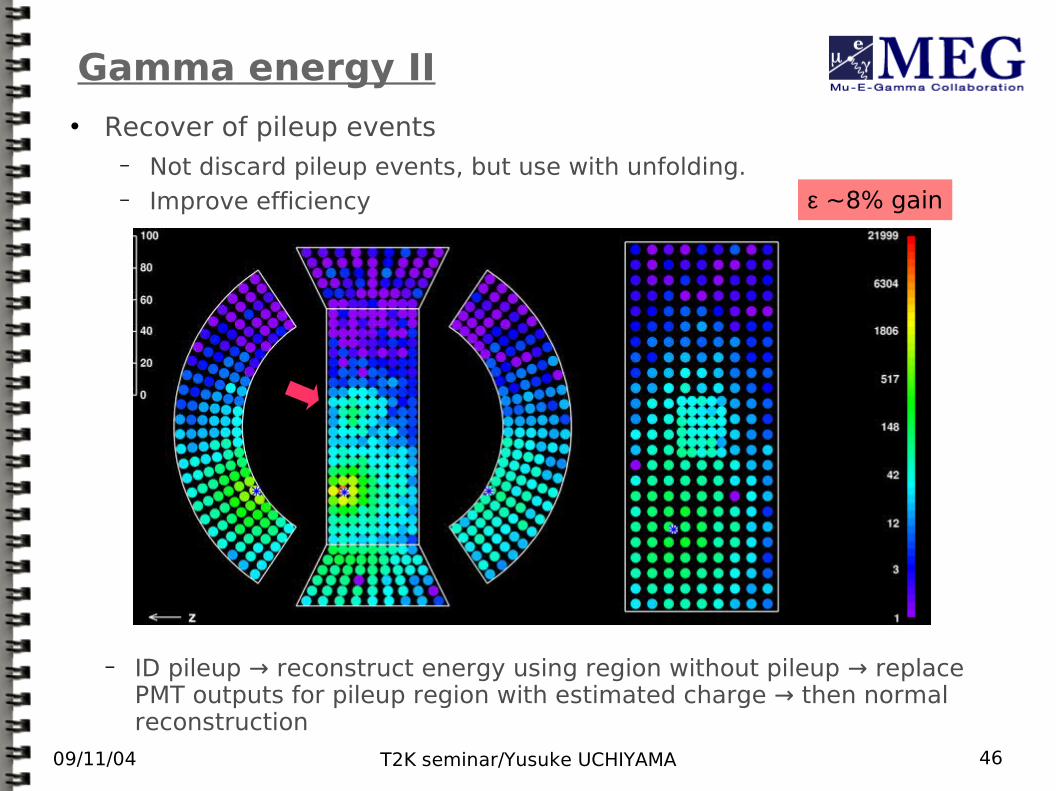
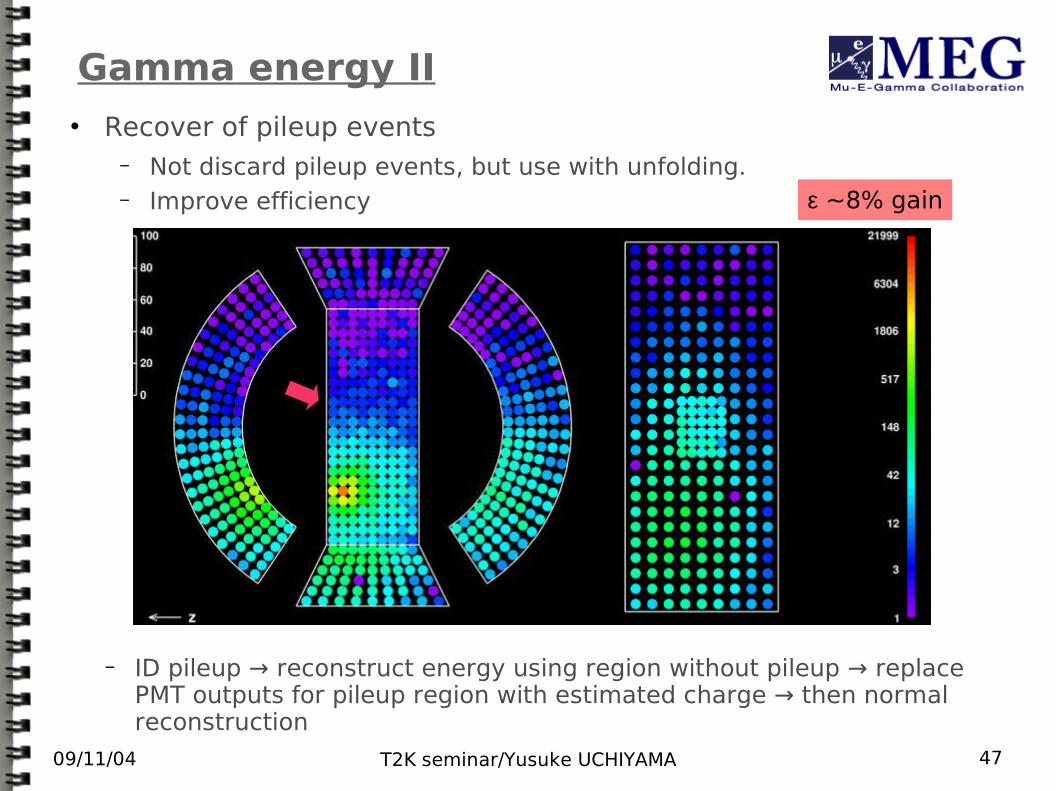
Gamma energy II Recover of pileup events
− Not discard pileup events, but use with unfolding.− Improve efficiency
− ID pileup → reconstruct energy using region without pileup → replace PMT outputs for pileup region with estimated charge → then normal reconstruction
ε ~8% gain
09/11/04 T2K seminar/Yusuke UCHIYAMA 47
Gamma energy II Recover of pileup events
− Not discard pileup events, but use with unfolding.− Improve efficiency
− ID pileup → reconstruct energy using region without pileup → replace PMT outputs for pileup region with estimated charge → then normal reconstruction
ε ~8% gain
09/11/04 T2K seminar/Yusuke UCHIYAMA 48
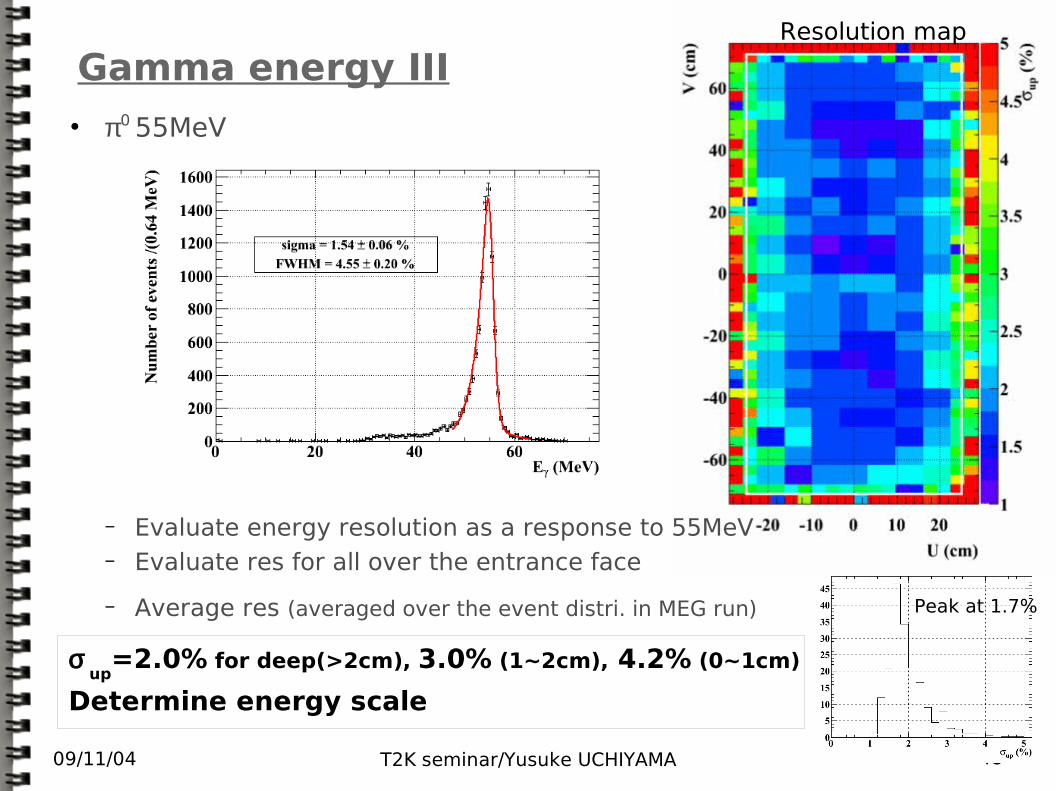
Gamma energy III π0 55MeV
Resolution map
− Evaluate energy resolution as a response to 55MeV− Evaluate res for all over the entrance face
− Average res (averaged over the event distri. in MEG run)
σup
=2.0% for deep(>2cm), 3.0% (1~2cm), 4.2% (0~1cm)
Determine energy scale
Peak at 1.7%
09/11/04 T2K seminar/Yusuke UCHIYAMA 49
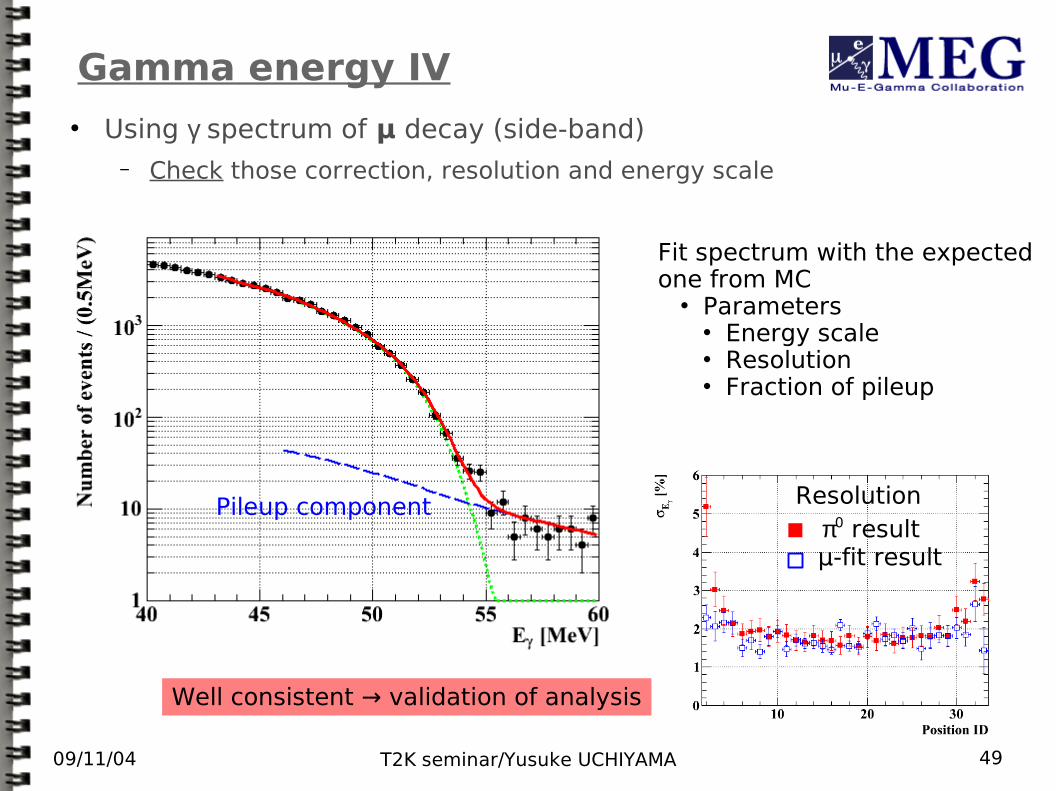
Gamma energy IV Using γ spectrum of μ decay (side-band)
− Check those correction, resolution and energy scale
Well consistent → validation of analysis
Pileup component Resolutionπ0 resultμ-fit result
Fit spectrum with the expected one from MC
Parameters Energy scale Resolution Fraction of pileup
09/11/04 T2K seminar/Yusuke UCHIYAMA 50
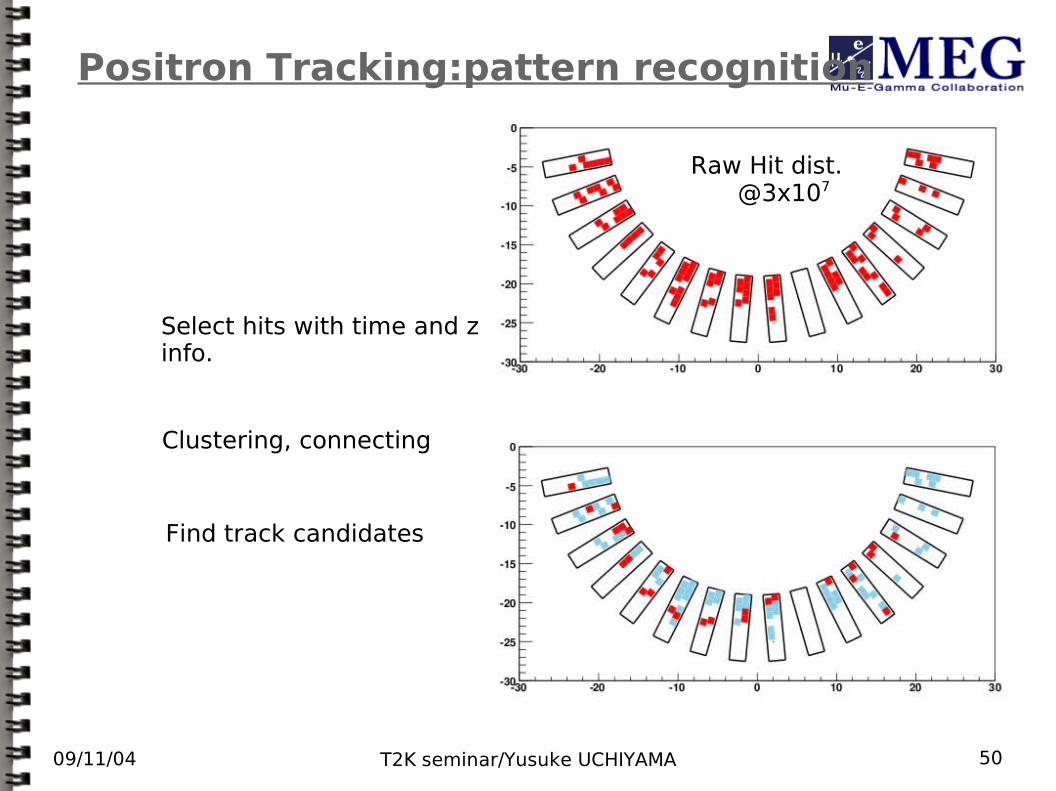
Positron Tracking:pattern recognition
Raw Hit dist.@3x10⁷
Select hits with time and z info.
Clustering, connecting
Find track candidates
09/11/04 T2K seminar/Yusuke UCHIYAMA 51
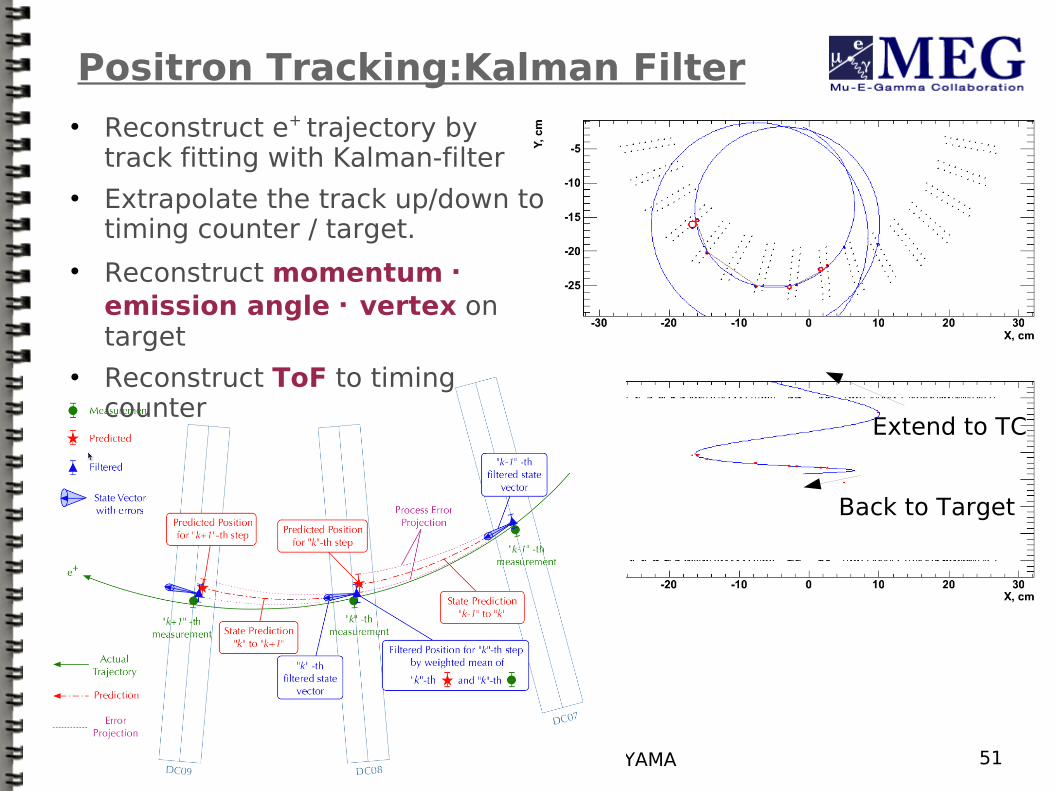
Positron Tracking:Kalman Filter
Back to Target
Extend to TC
Reconstruct e+ trajectory by track fitting with Kalman-filter
Extrapolate the track up/down to timing counter / target.
Reconstruct momentum・emission angle・vertex on target
Reconstruct ToF to timing counter
09/11/04 T2K seminar/Yusuke UCHIYAMA 52
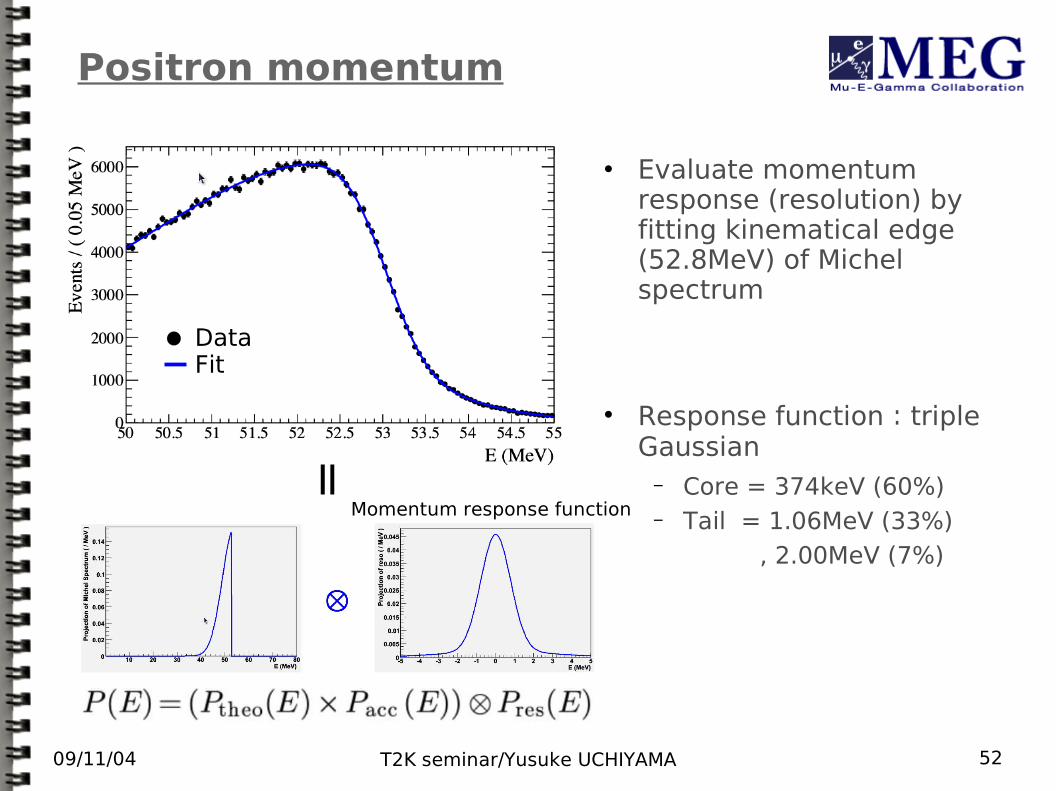
Positron momentum
Evaluate momentum response (resolution) by fitting kinematical edge (52.8MeV) of Michel spectrum
Response function:triple Gaussian
− Core = 374keV (60%)− Tail = 1.06MeV (33%)
, 2.00MeV (7%)
=
Momentum response function
DataFit
09/11/04 T2K seminar/Yusuke UCHIYAMA 53
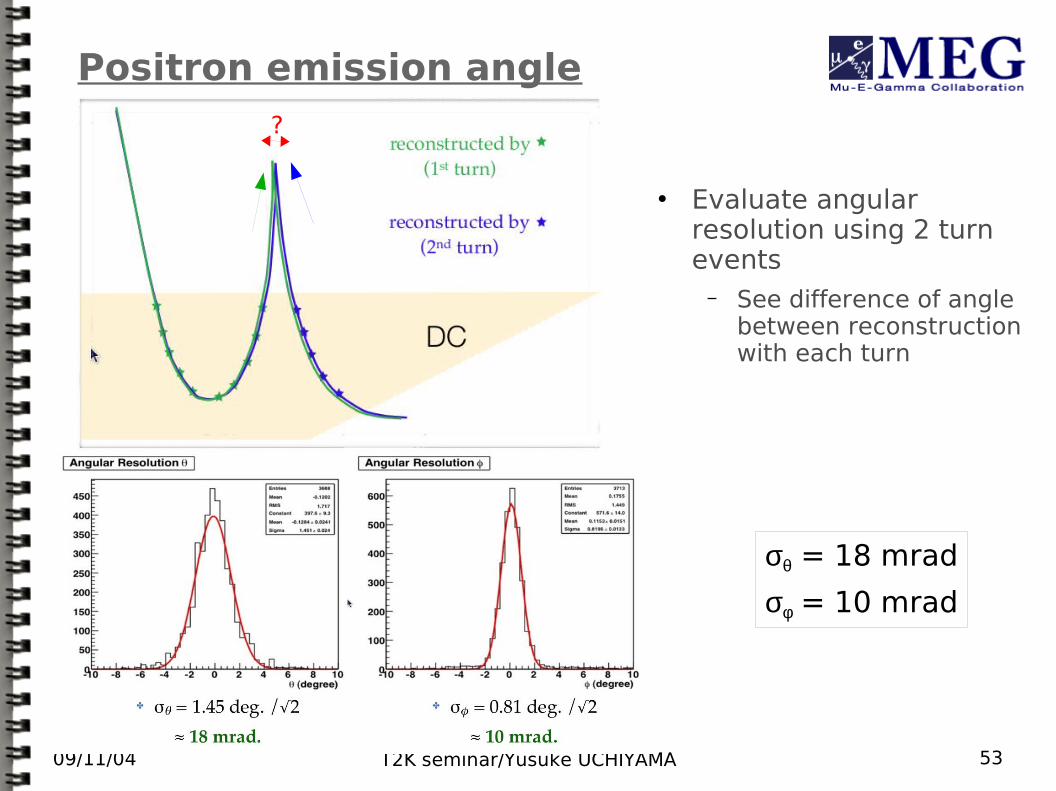
Positron emission angle
Evaluate angular resolution using 2 turn events
− See difference of angle between reconstruction with each turn
?
σθ = 18 mrad
σφ = 10 mrad
09/11/04 T2K seminar/Yusuke UCHIYAMA 54
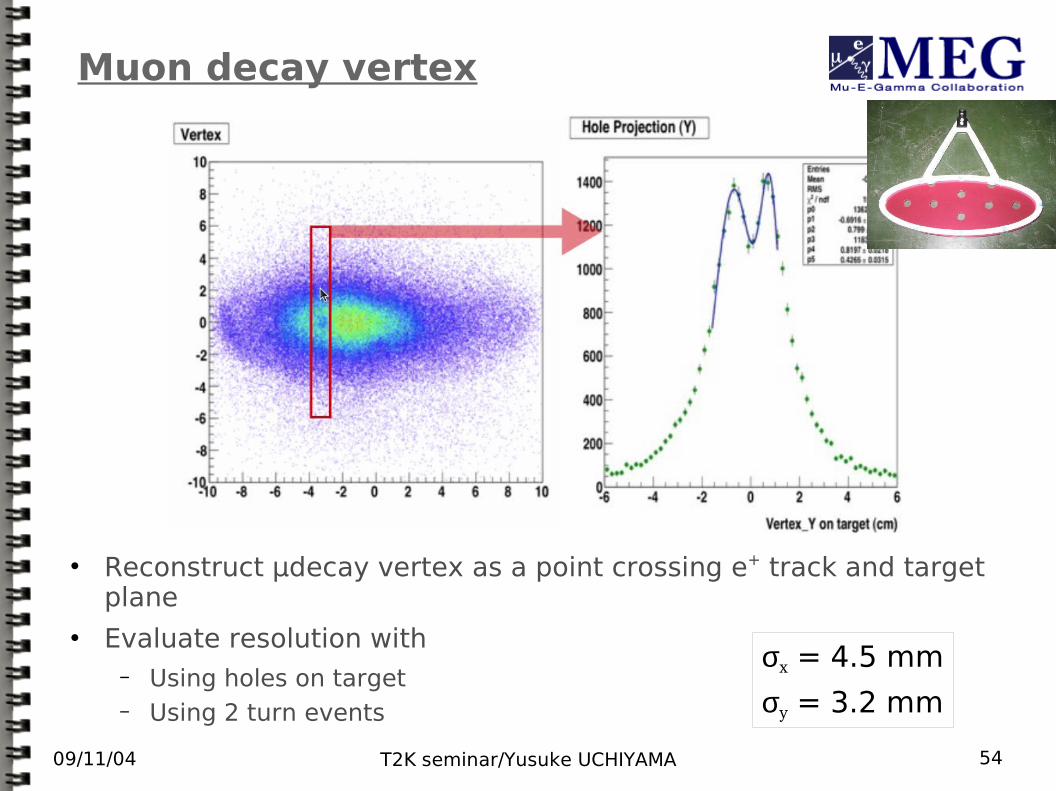
Muon decay vertex
Reconstruct μdecay vertex as a point crossing e+ track and target plane
Evaluate resolution with− Using holes on target− Using 2 turn events
σx = 4.5 mm
σy = 3.2 mm
09/11/04 T2K seminar/Yusuke UCHIYAMA 55
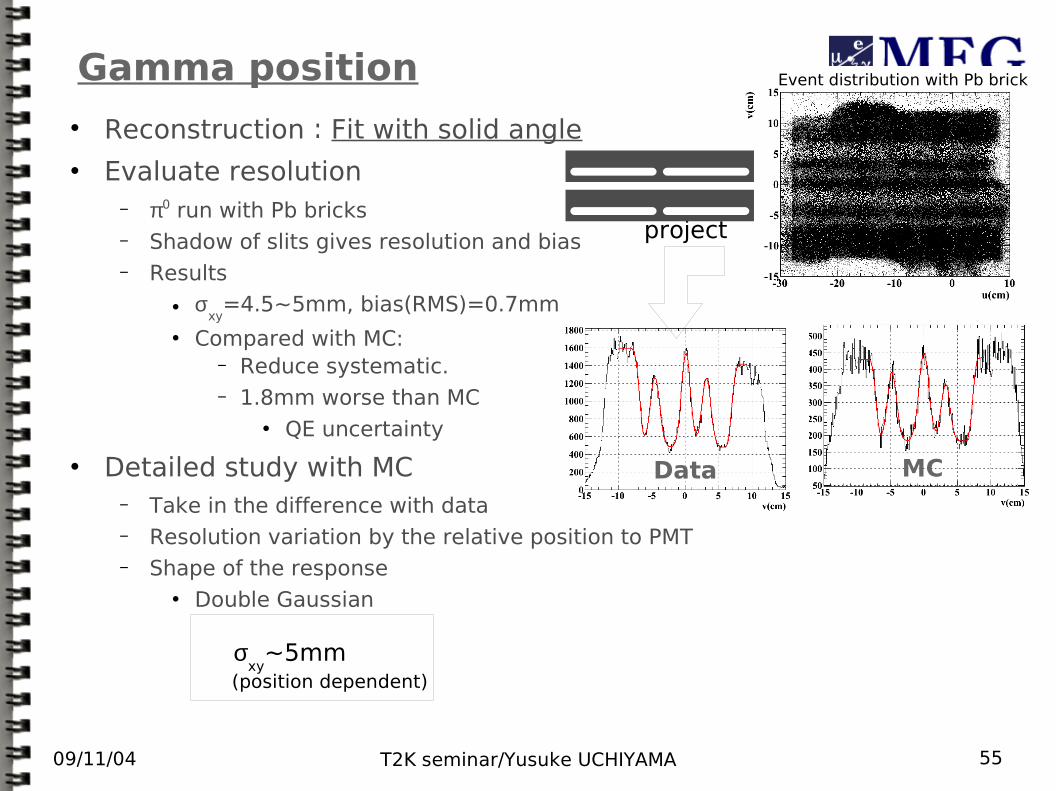
Gamma position
Data MC
project
Reconstruction:Fit with solid angle Evaluate resolution
− π0 run with Pb bricks− Shadow of slits gives resolution and bias− Results
σxy
=4.5~5mm, bias(RMS)=0.7mm Compared with MC:
− Reduce systematic.− 1.8mm worse than MC
QE uncertainty
Detailed study with MC− Take in the difference with data− Resolution variation by the relative position to PMT− Shape of the response
Double Gaussian
σxy
~5mm(position dependent)
Event distribution with Pb brick
09/11/04 T2K seminar/Yusuke UCHIYAMA 56
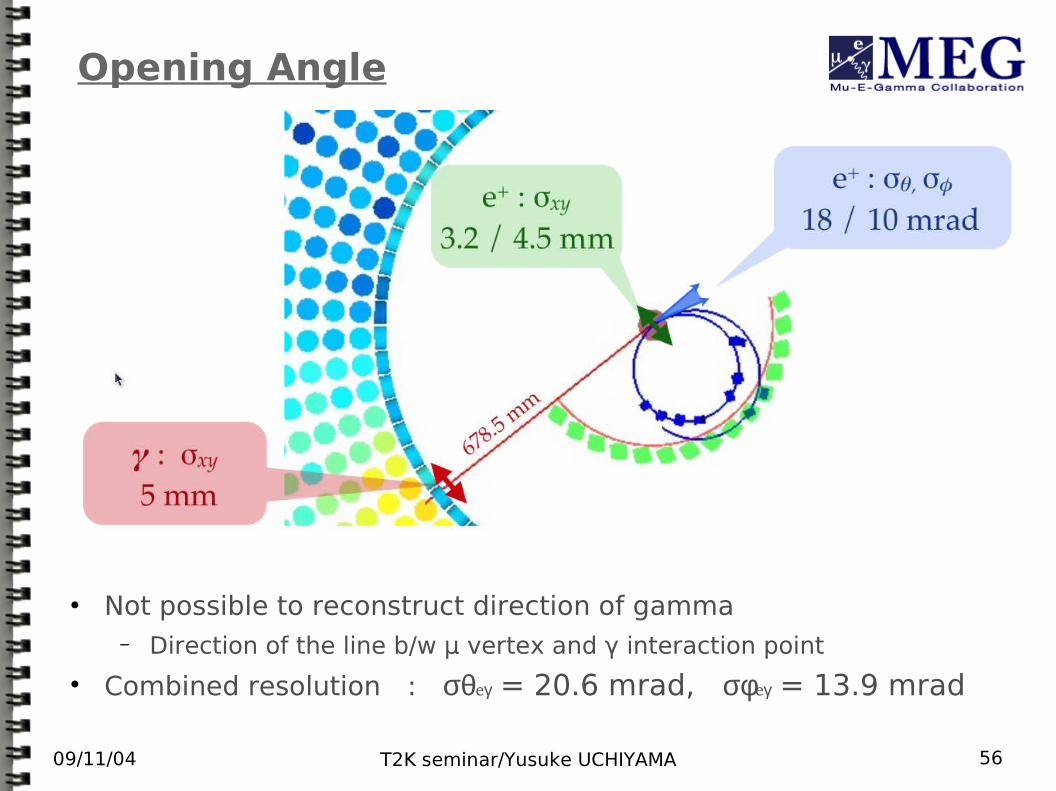
Opening Angle
Not possible to reconstruct direction of gamma− Direction of the line b/w μ vertex and γ interaction point
Combined resolution : σθeγ = 20.6 mrad, σφeγ = 13.9 mrad
09/11/04 T2K seminar/Yusuke UCHIYAMA 57
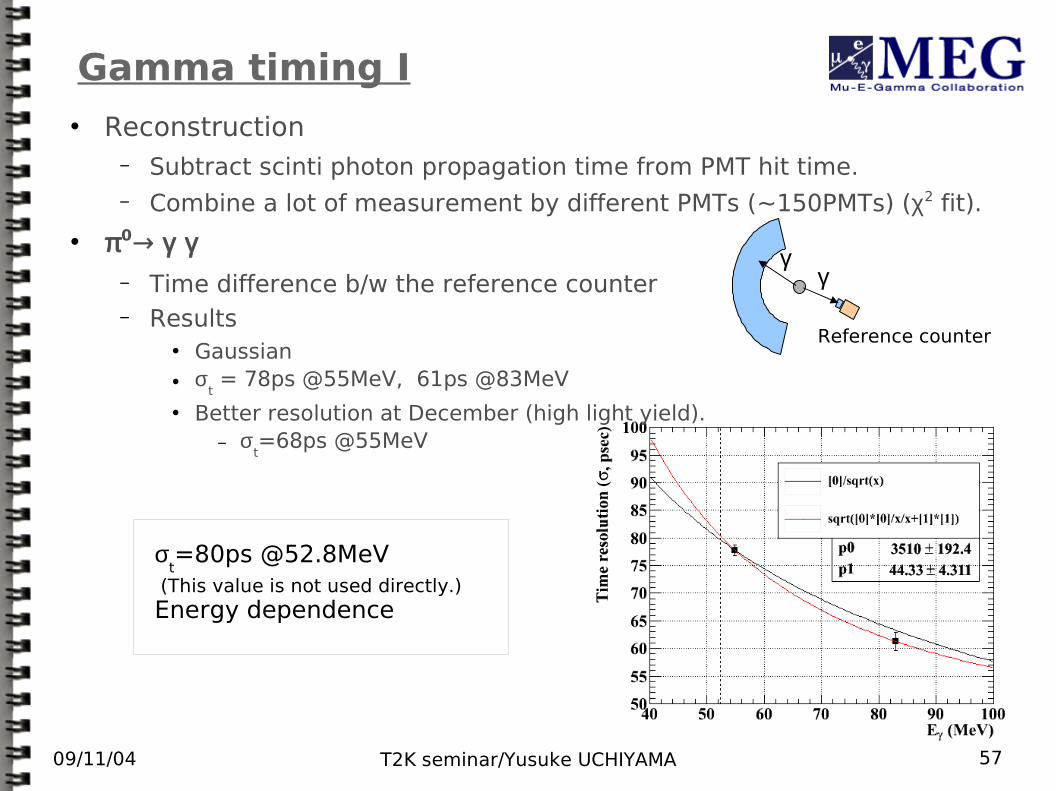
Gamma timing I Reconstruction
− Subtract scinti photon propagation time from PMT hit time.− Combine a lot of measurement by different PMTs (~150PMTs) (χ2 fit).
π0→ γ γ− Time difference b/w the reference counter− Results
Gaussian σ
t = 78ps @55MeV, 61ps @83MeV
Better resolution at December (high light yield).− σ
t=68ps @55MeV
σt=80ps @52.8MeV
(This value is not used directly.)Energy dependence
γγ
Reference counter
09/11/04 T2K seminar/Yusuke UCHIYAMA 58
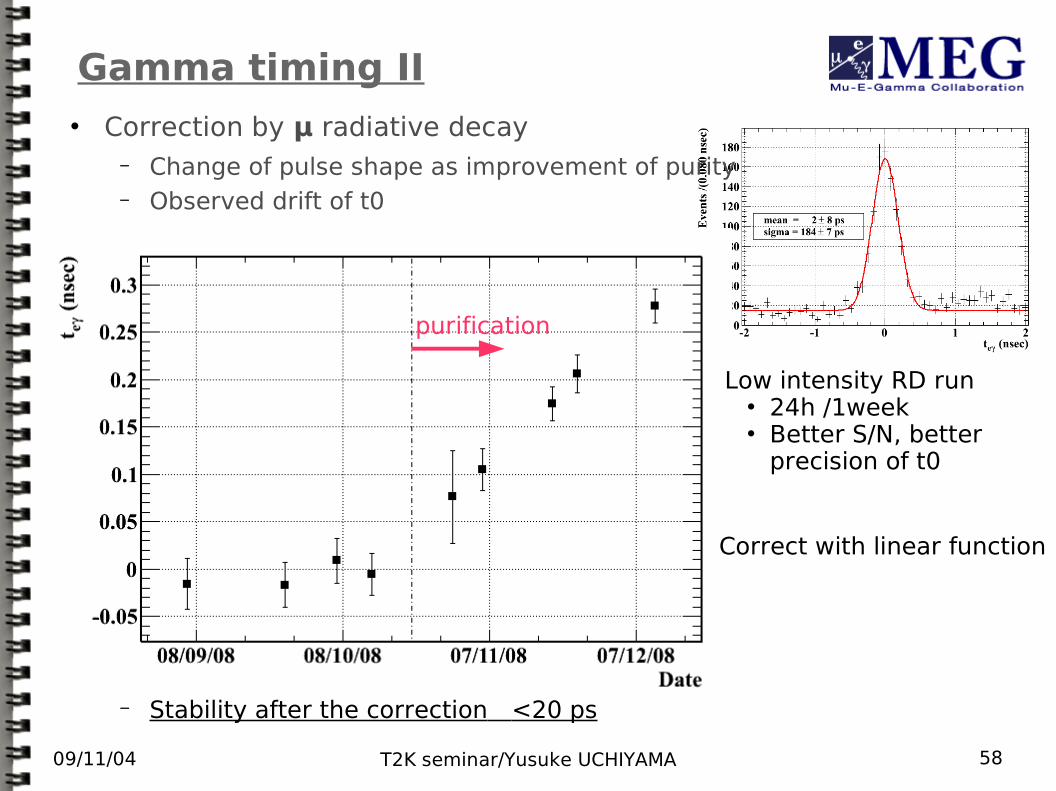
Gamma timing II Correction by μ radiative decay
− Change of pulse shape as improvement of purity− Observed drift of t0
Low intensity RD run 24h /1week Better S/N, better
precision of t0
Correct with linear function
− Stability after the correction <20 ps
purification
09/11/04 T2K seminar/Yusuke UCHIYAMA 59
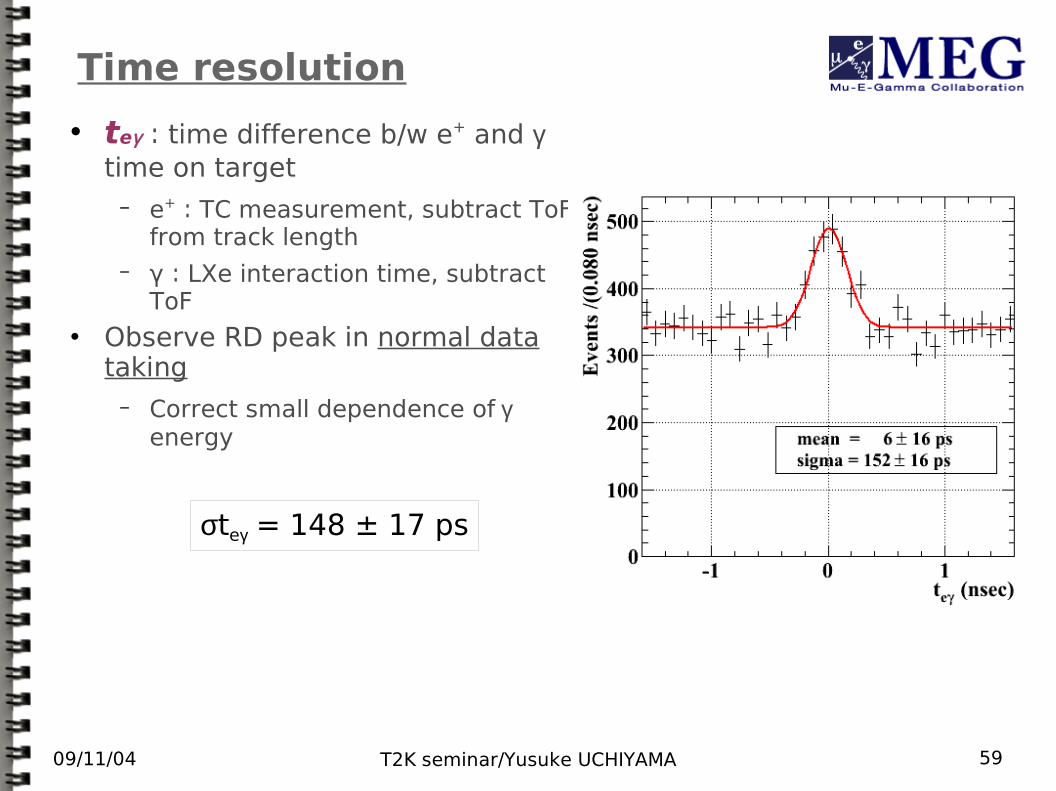
Time resolution
teγ:time difference b/w e+ and γ time on target
− e+:TC measurement, subtract ToF from track length
− γ:LXe interaction time, subtract ToF
Observe RD peak in normal data taking
− Correct small dependence of γ energy
σteγ = 148 ± 17 ps
09/11/04 T2K seminar/Yusuke UCHIYAMA 60
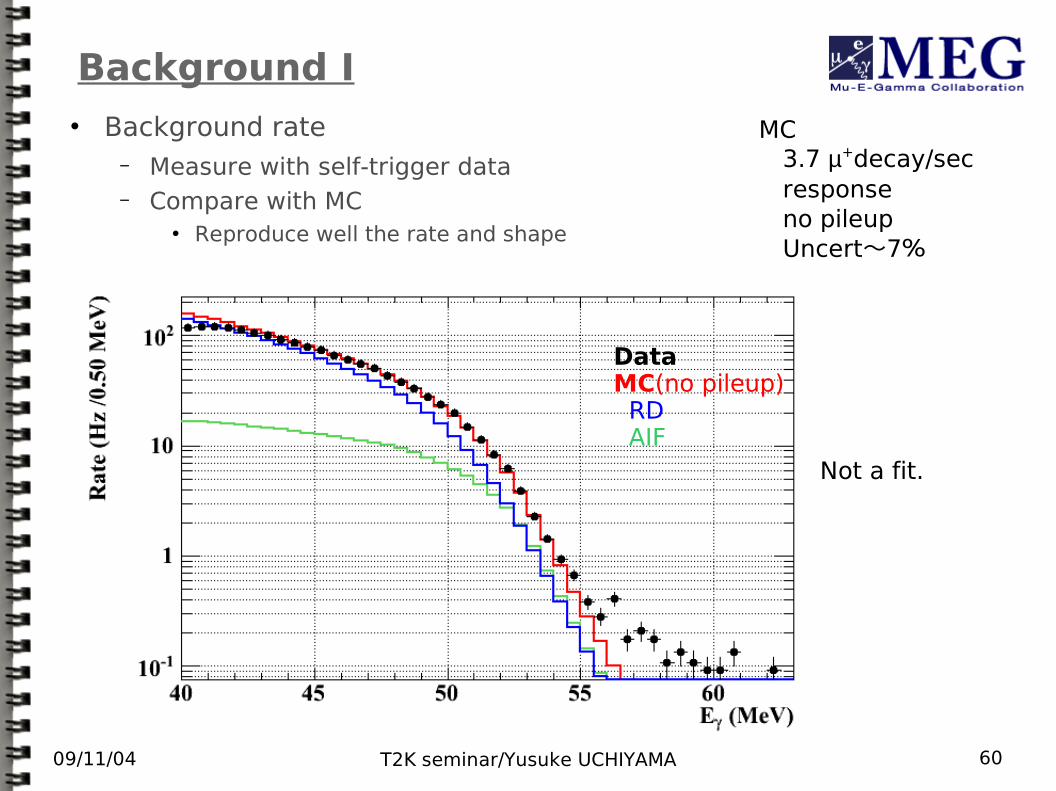
Background I Background rate
− Measure with self-trigger data− Compare with MC
Reproduce well the rate and shape
DataMC(no pileup) RD AIF
MC 3.7 µ+decay/sec response no pileup Uncert~7%
Not a fit.
09/11/04 T2K seminar/Yusuke UCHIYAMA 61
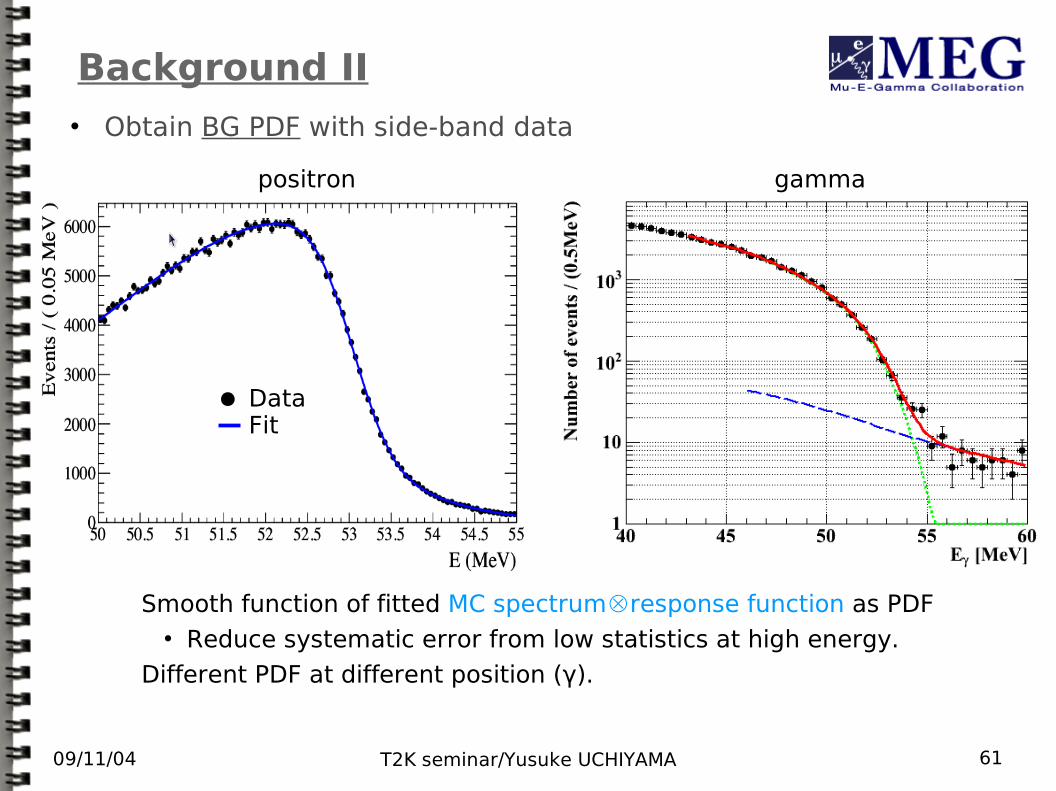
Background II Obtain BG PDF with side-band data
Smooth function of fitted MC spectrum⊗response function as PDF Reduce systematic error from low statistics at high energy.
Different PDF at different position (γ).
DataFit
positron gamma
09/11/04 T2K seminar/Yusuke UCHIYAMA 62
Now we got all information for Likelihood fitting
Eγ, Ee, teγ, θeγ, φeγ
09/11/04 T2K seminar/Yusuke UCHIYAMA 63
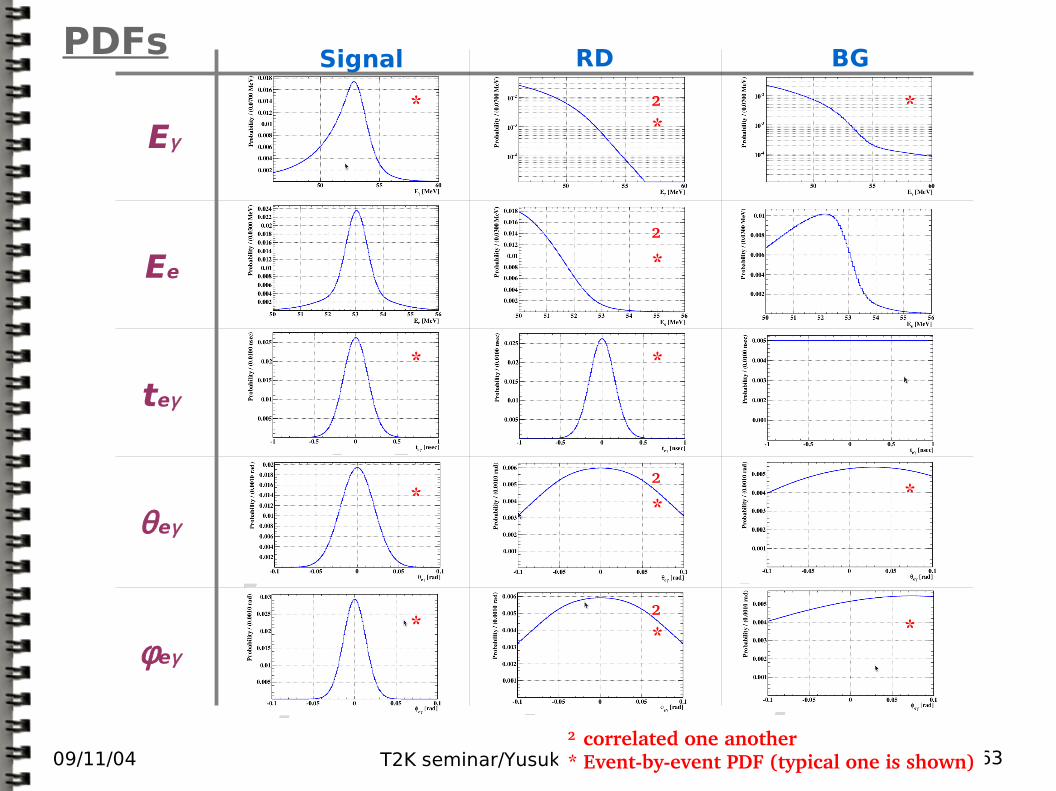
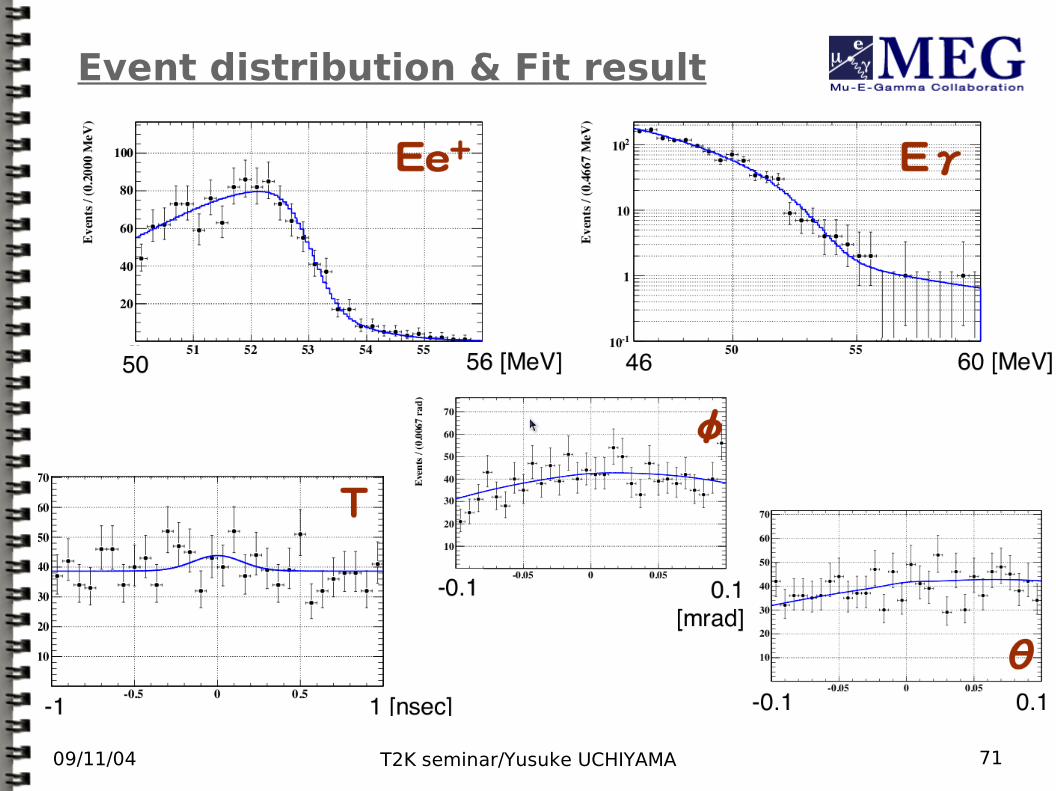
Eγ
Ee
teγ
θeγ
φeγ
Signal RD BG
†
†
†
†
*
*
*
* *
*
*
*
*
*
*
*
† correlated one another* Eventbyevent PDF (typical one is shown)
PDFs
09/11/04 T2K seminar/Yusuke UCHIYAMA 64
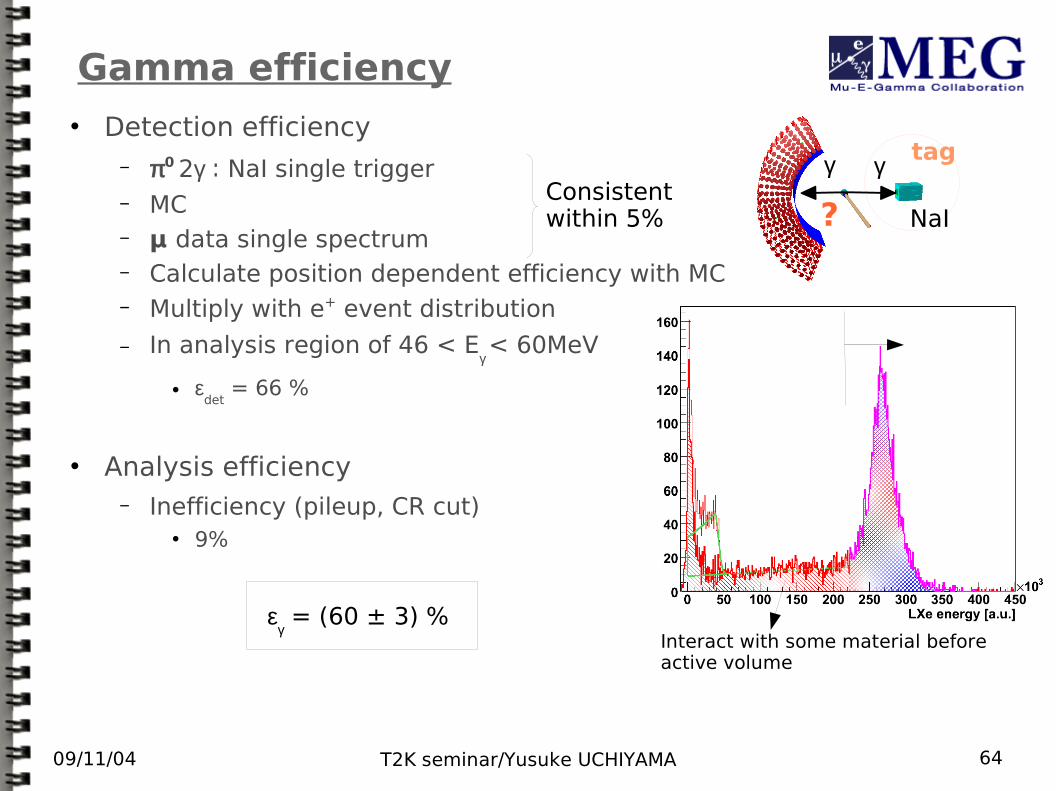
Gamma efficiency Detection efficiency
− π0 2γ:NaI single trigger− MC− μ data single spectrum− Calculate position dependent efficiency with MC− Multiply with e+ event distribution
− In analysis region of 46 < Eγ < 60MeV
εdet
= 66 %
Analysis efficiency− Inefficiency (pileup, CR cut)
9%
εγ = (60 ± 3) %
Consistent within 5%
γγ tag
?
Interact with some material beforeactive volume
NaI
09/11/04 T2K seminar/Yusuke UCHIYAMA 65
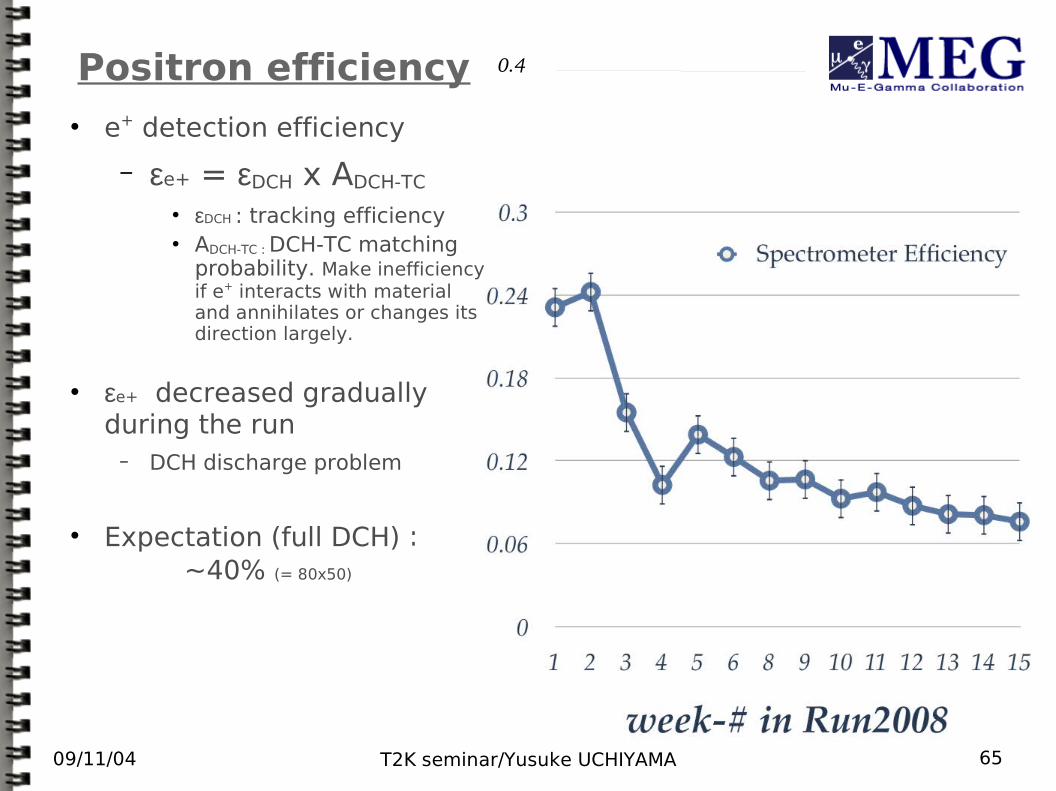
Positron efficiency e+ detection efficiency
− εe+ = εDCH x ADCH-TC
εDCH : tracking efficiency ADCH-TC : DCH-TC matching
probability. Make inefficiency if e+ interacts with material and annihilates or changes its direction largely.
εe+ decreased gradually during the run
− DCH discharge problem
Expectation (full DCH): ~40% (= 80x50)
0.4
09/11/04 T2K seminar/Yusuke UCHIYAMA 66
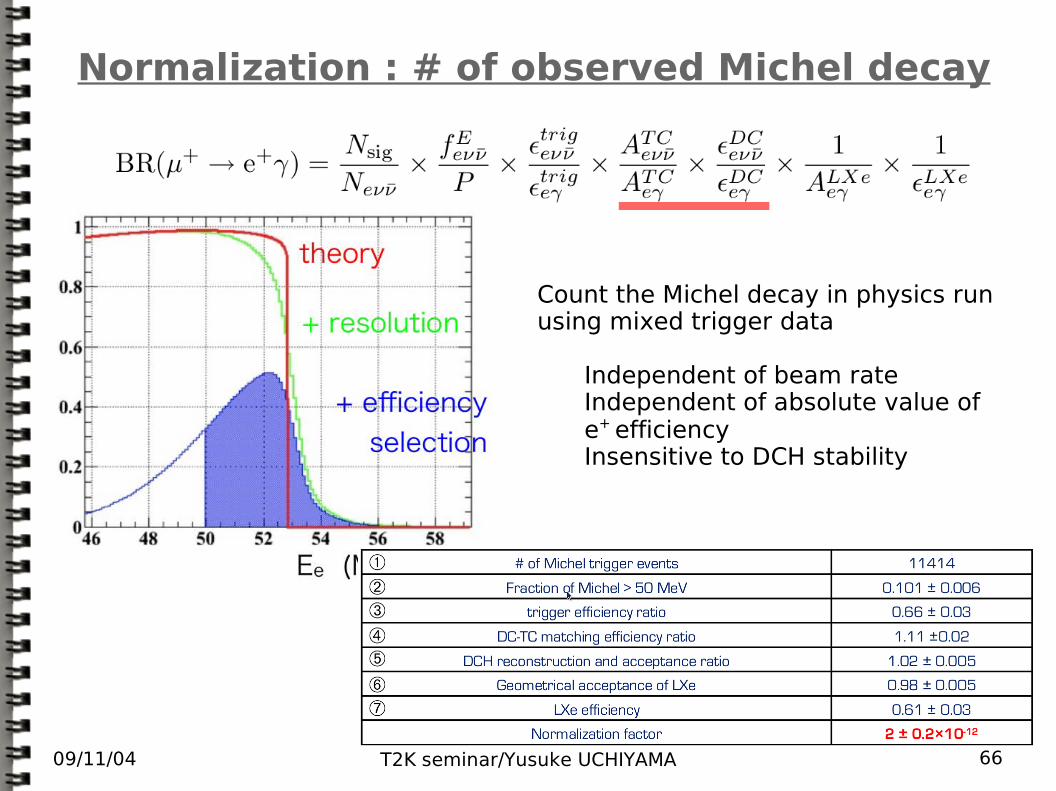
Normalization : # of observed Michel decay
Count the Michel decay in physics run using mixed trigger data
Independent of beam rateIndependent of absolute value of e+ efficiencyInsensitive to DCH stability
09/11/04 T2K seminar/Yusuke UCHIYAMA 67
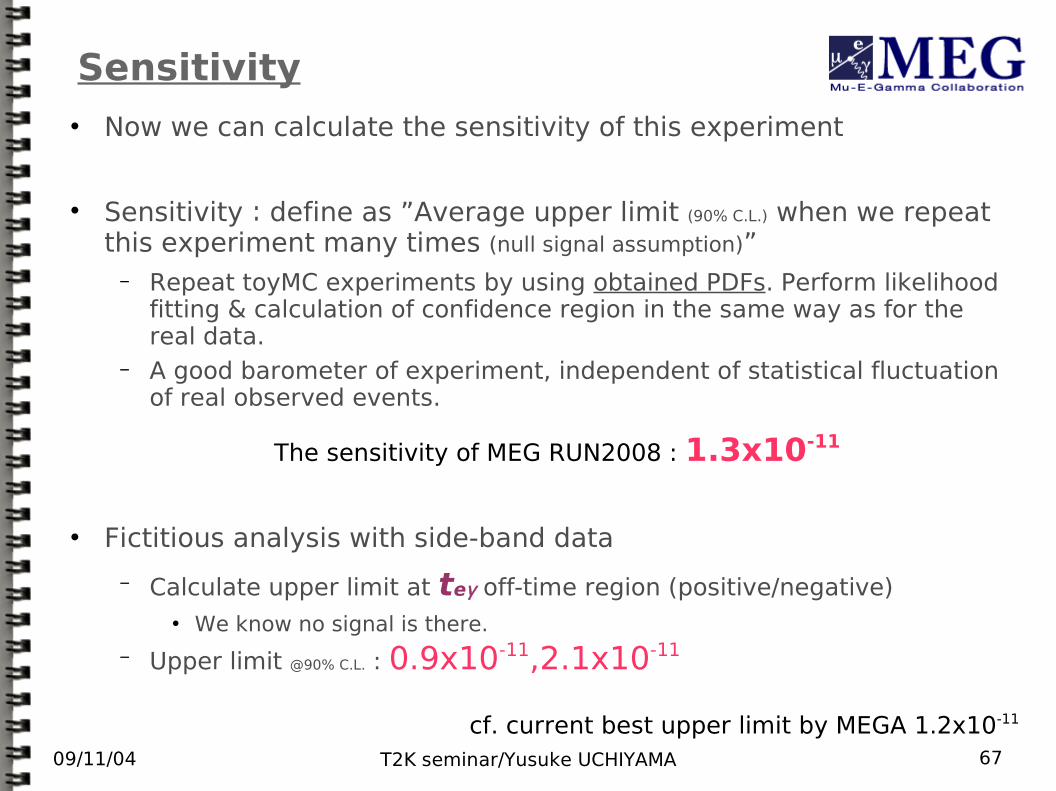
Sensitivity Now we can calculate the sensitivity of this experiment
Sensitivity:define as ”Average upper limit (90% C.L.) when we repeat this experiment many times (null signal assumption)”
− Repeat toyMC experiments by using obtained PDFs. Perform likelihood fitting & calculation of confidence region in the same way as for the real data.
− A good barometer of experiment, independent of statistical fluctuation of real observed events.
The sensitivity of MEG RUN2008 : 1.3x10⁻¹¹
Fictitious analysis with side-band data
− Calculate upper limit at teγ off-time region (positive/negative) We know no signal is there.
− Upper limit @90% C.L. : 0.9x10-11,2.1x10-11
cf. current best upper limit by MEGA 1.2x10⁻¹¹
09/11/04 T2K seminar/Yusuke UCHIYAMA 68
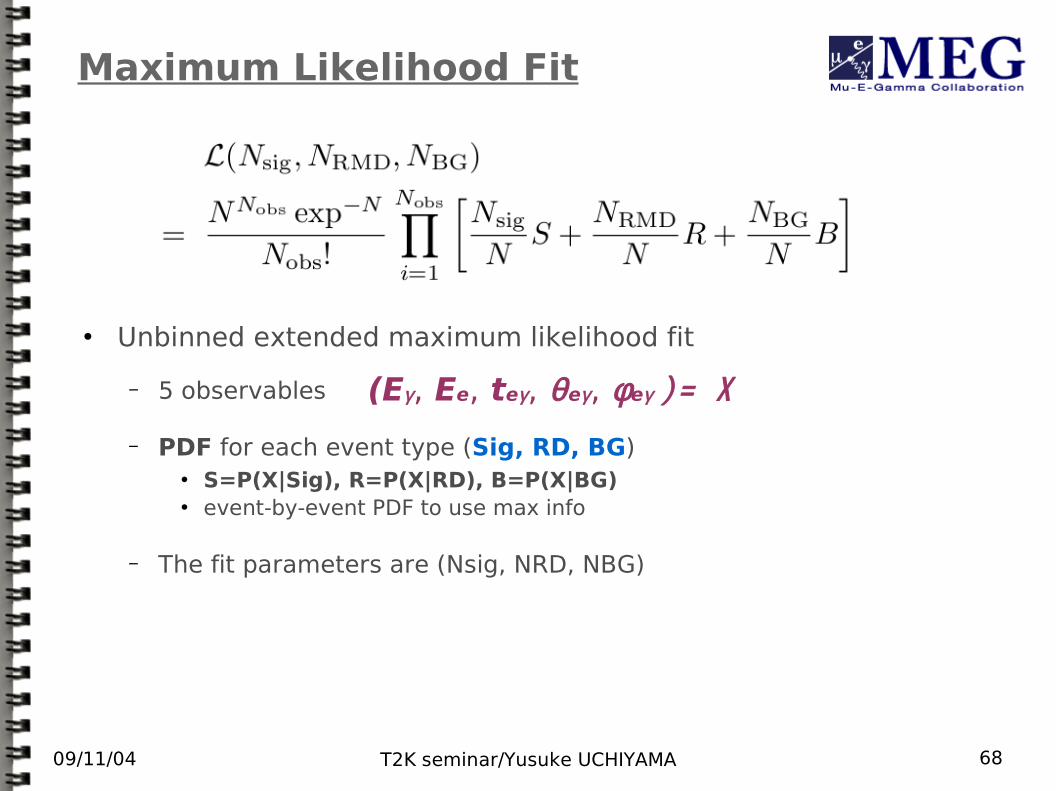
Maximum Likelihood Fit
− 5 observables
− PDF for each event type (Sig, RD, BG) S=P(X|Sig), R=P(X|RD), B=P(X|BG) event-by-event PDF to use max info
− The fit parameters are (Nsig, NRD, NBG)
(Eγ, Ee, teγ, θeγ, φeγ )= X
Unbinned extended maximum likelihood fit
09/11/04 T2K seminar/Yusuke UCHIYAMA 69
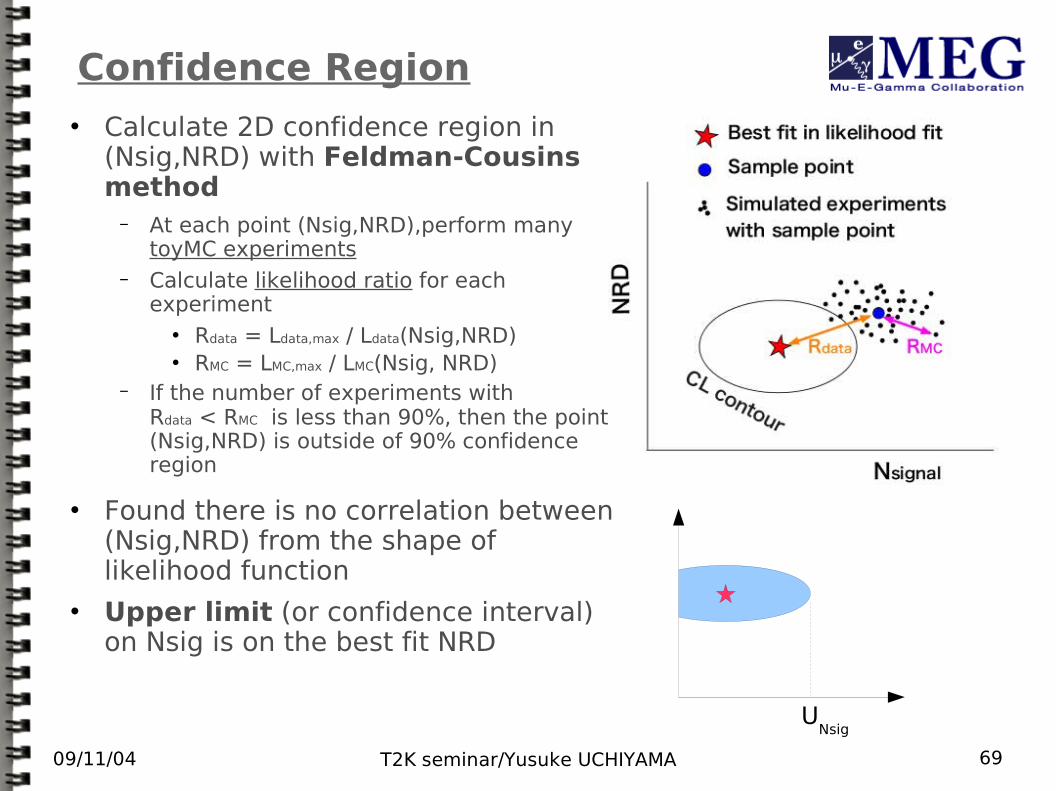
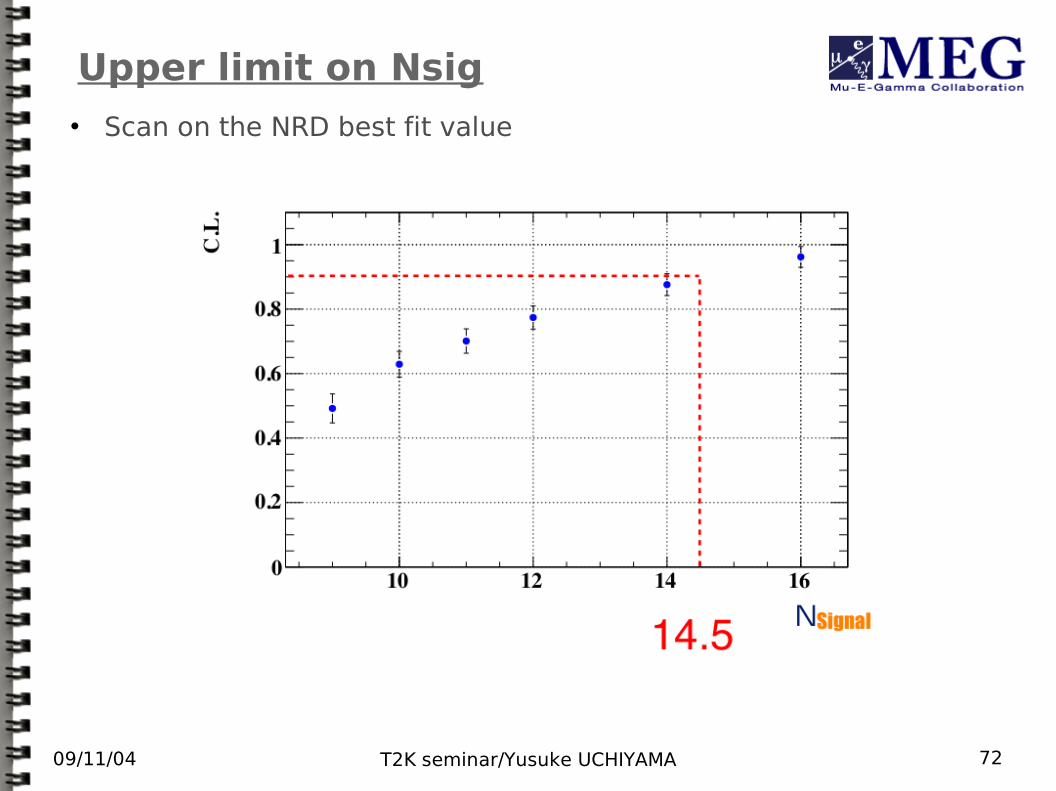
Confidence Region Calculate 2D confidence region in
(Nsig,NRD) with Feldman-Cousins method
− At each point (Nsig,NRD),perform many toyMC experiments
− Calculate likelihood ratio for each experiment
Rdata = Ldata,max / Ldata(Nsig,NRD) RMC = LMC,max / LMC(Nsig, NRD)
− If the number of experiments with Rdata < RMC is less than 90%, then the point (Nsig,NRD) is outside of 90% confidence region
Found there is no correlation between (Nsig,NRD) from the shape of likelihood function
Upper limit (or confidence interval) on Nsig is on the best fit NRD
UNsig
09/11/04 T2K seminar/Yusuke UCHIYAMA 70
Open blind box (30/July)
09/11/04 T2K seminar/Yusuke UCHIYAMA 71
Event distribution & Fit result
09/11/04 T2K seminar/Yusuke UCHIYAMA 72
Upper limit on Nsig Scan on the NRD best fit value
09/11/04 T2K seminar/Yusuke UCHIYAMA 73
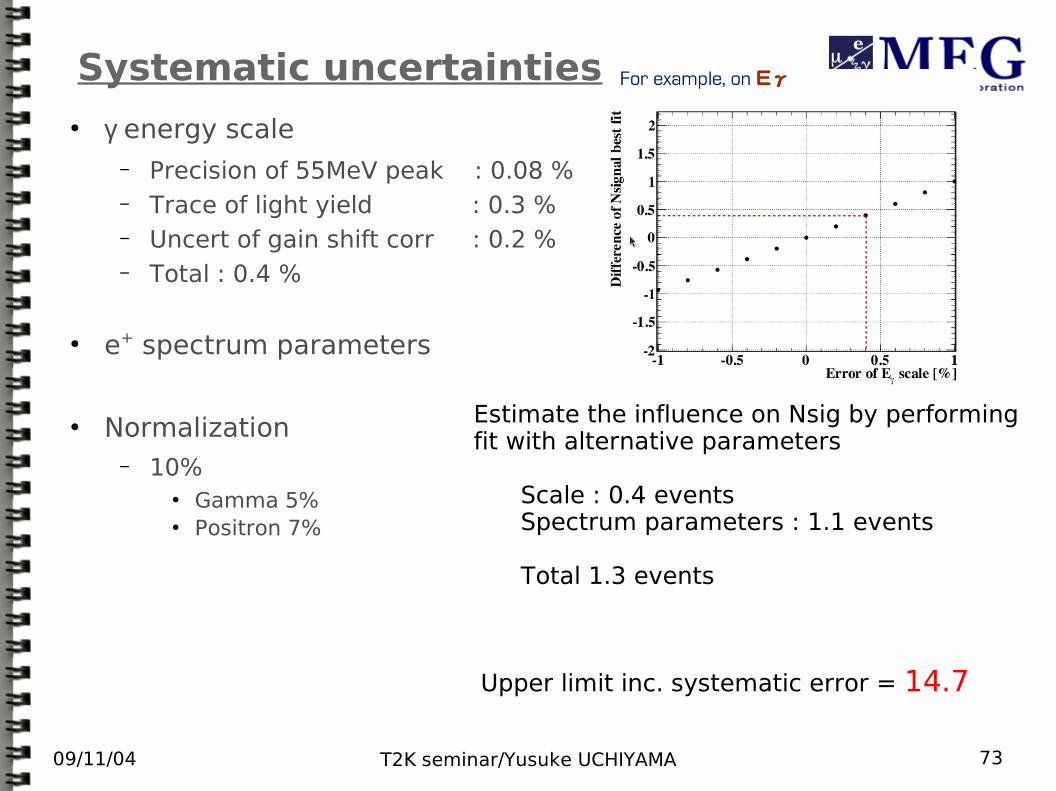
Systematic uncertainties γ energy scale
− Precision of 55MeV peak : 0.08 %− Trace of light yield : 0.3 %− Uncert of gain shift corr : 0.2 %− Total : 0.4 %
e+ spectrum parameters
Normalization− 10%
Gamma 5% Positron 7%
Estimate the influence on Nsig by performingfit with alternative parameters
Scale : 0.4 eventsSpectrum parameters : 1.1 events
Total 1.3 events
Upper limit inc. systematic error = 14.7
09/11/04 T2K seminar/Yusuke UCHIYAMA 74
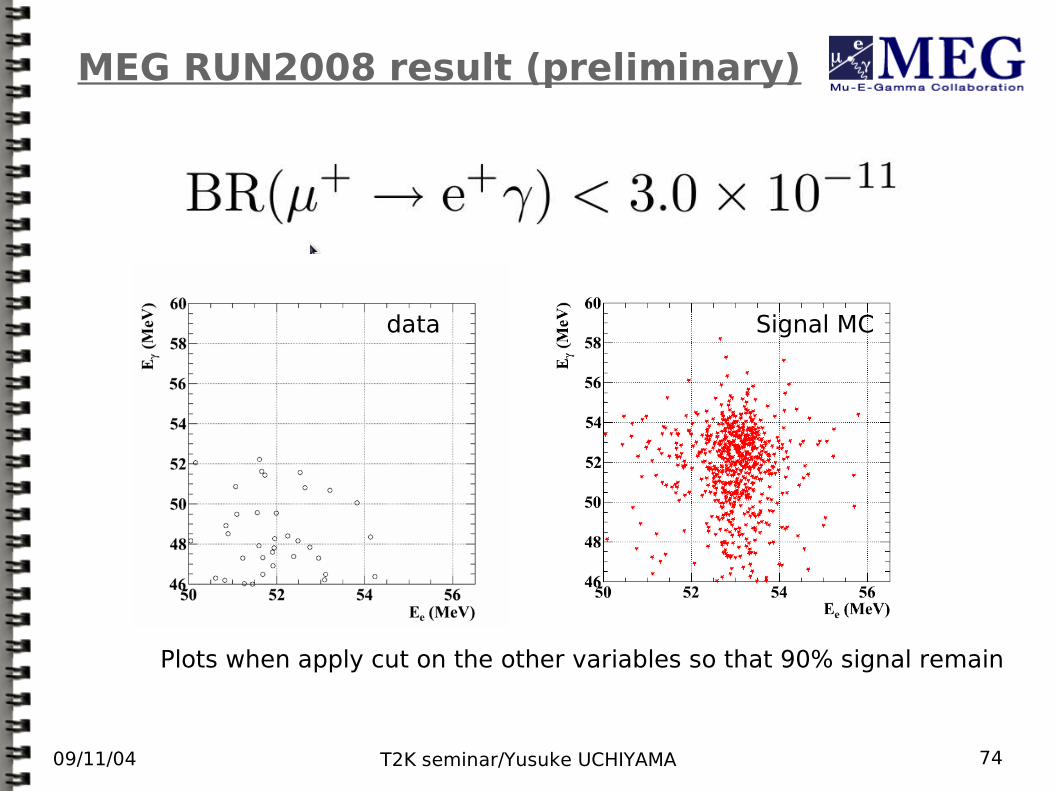
MEG RUN2008 result (preliminary)
data Signal MC
Plots when apply cut on the other variables so that 90% signal remain
09/11/04 T2K seminar/Yusuke UCHIYAMA 75
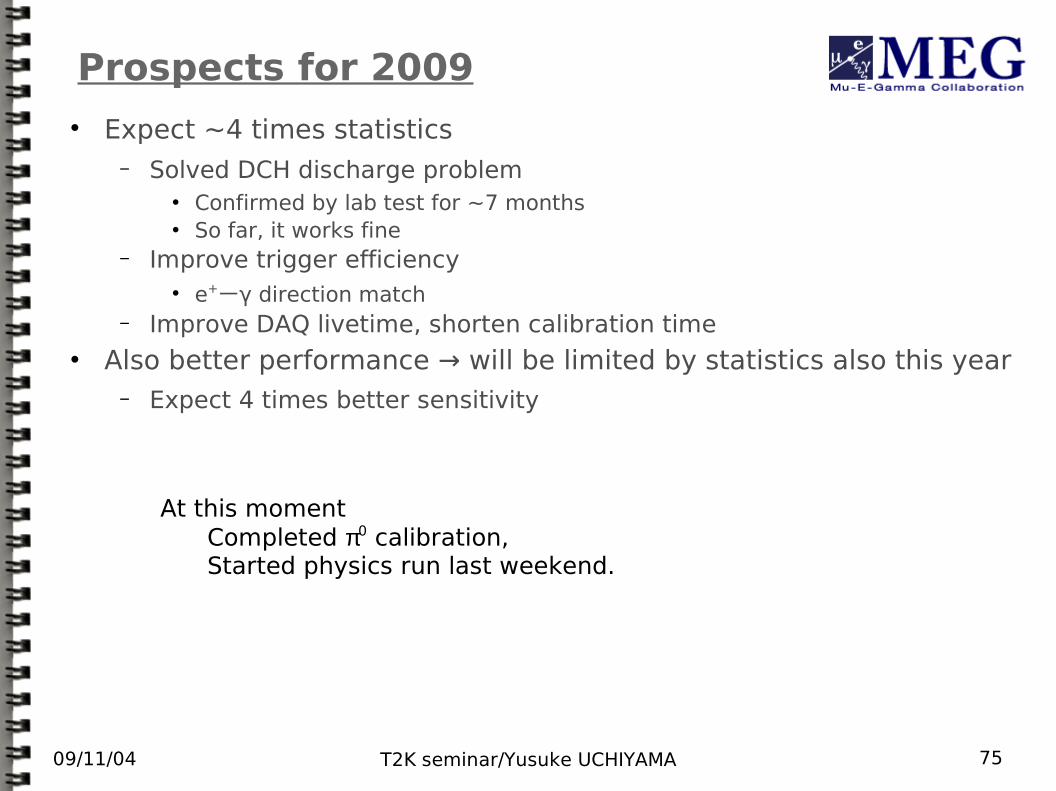
Prospects for 2009 Expect ~4 times statistics
− Solved DCH discharge problem Confirmed by lab test for ~7 months So far, it works fine
− Improve trigger efficiency e+ーγ direction match
− Improve DAQ livetime, shorten calibration time Also better performance → will be limited by statistics also this year
− Expect 4 times better sensitivity
At this momentCompleted π0 calibration,Started physics run last weekend.
09/11/04 T2K seminar/Yusuke UCHIYAMA 76
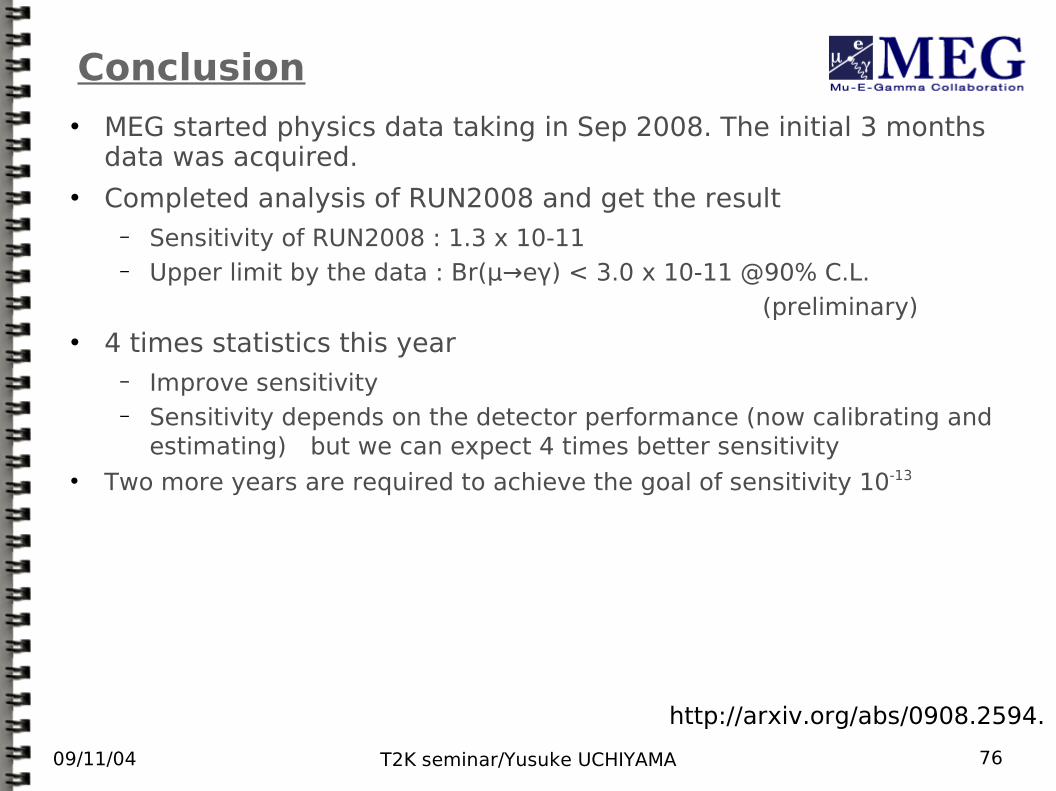
Conclusion MEG started physics data taking in Sep 2008. The initial 3 months
data was acquired. Completed analysis of RUN2008 and get the result
− Sensitivity of RUN2008 : 1.3 x 10⁻¹¹− Upper limit by the data : Br(μ→eγ) < 3.0 x 10⁻¹¹ @90% C.L.
(preliminary) 4 times statistics this year
− Improve sensitivity− Sensitivity depends on the detector performance (now calibrating and
estimating) but we can expect 4 times better sensitivity Two more years are required to achieve the goal of sensitivity 10-13
MEG実験は2008年秋、物理データ取得を開始。RUN2008ではMEG最初の3ヶ月分のデータをとった。
RUN2008を一通り解析し結果を出した。− RUN2008のsensitivity : 1.3 x 10⁻¹¹− 実際のデータからのupper limit : Br(μ→eγ) < 3.0 x 10⁻¹¹ @90% C.L.
(preliminary) 今年はこの4倍の統計をためる。
− これに応じてsensitivityの向上− sensitivityの詳細は今年の検出器の性能に依存する(現在、)
MEG実験は2008年秋、物理データ取得を開始。RUN2008ではMEG最初の3ヶ月分のデータをとった。
RUN2008を一通り解析し結果を出した。− RUN2008のsensitivity : 1.3 x 10⁻¹¹− 実際のデータからのupper limit : Br(μ→eγ) < 3.0 x 10⁻¹¹ @90% C.L.
(preliminary) 今年はこの4倍の統計をためる。
− これに応じてsensitivityの向上− sensitivityの詳細は今年の検出器の性能に依存する(現在、)
MEG実験は2008年秋、物理データ取得を開始。RUN2008ではMEG最初の3ヶ月分のデータをとった。
RUN2008を一通り解析し結果を出した。− RUN2008のsensitivity : 1.3 x 10⁻¹¹− 実際のデータからのupper limit : Br(μ→eγ) < 3.0 x 10⁻¹¹ @90% C.L.
(preliminary) 今年はこの4倍の統計をためる。
− これに応じてsensitivityの向上− sensitivityの詳細は今年の検出器の性能に依存する(現在、)
http://arxiv.org/abs/0908.2594.
09/11/04 T2K seminar/Yusuke UCHIYAMA 77
Thank you.
09/11/04 T2K seminar/Yusuke UCHIYAMA 78
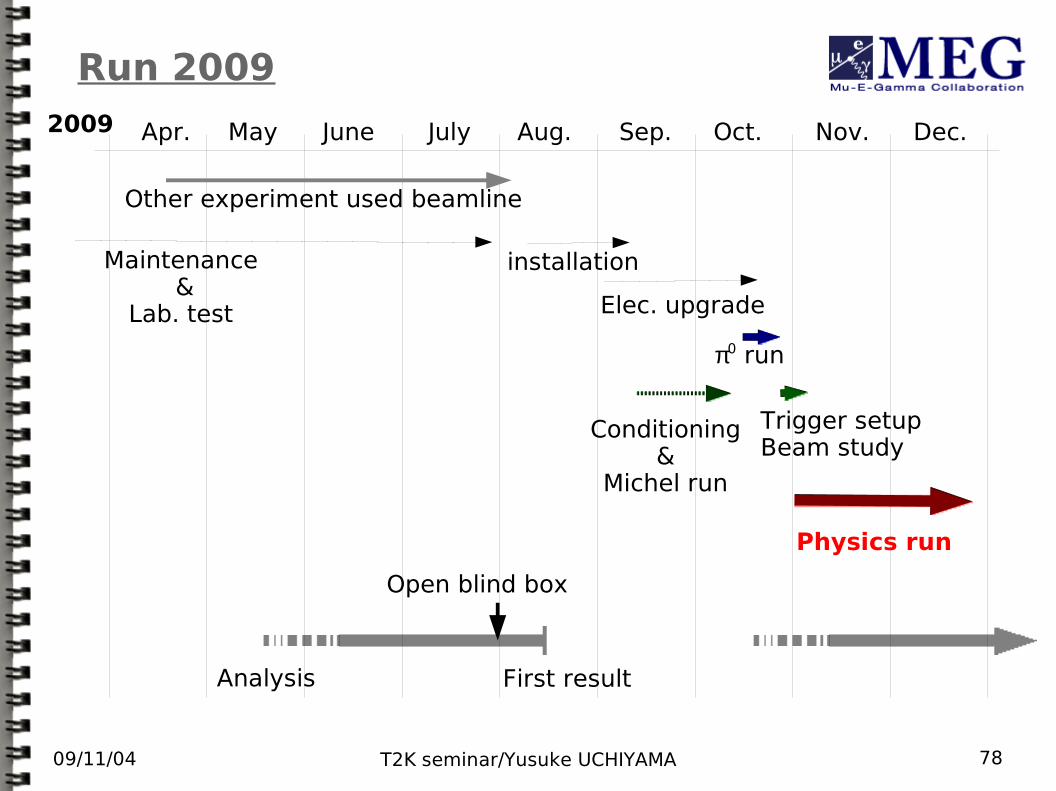
Run 2009
Maintenance &
Lab. test
Apr. May June July Aug. Sep. Oct. Nov. Dec.
installation
Conditioning&
Michel run
Trigger setupBeam study
π0 run
Physics run
2009
Open blind box
Analysis First result
Other experiment used beamline
Elec. upgrade
09/11/04 T2K seminar/Yusuke UCHIYAMA 79
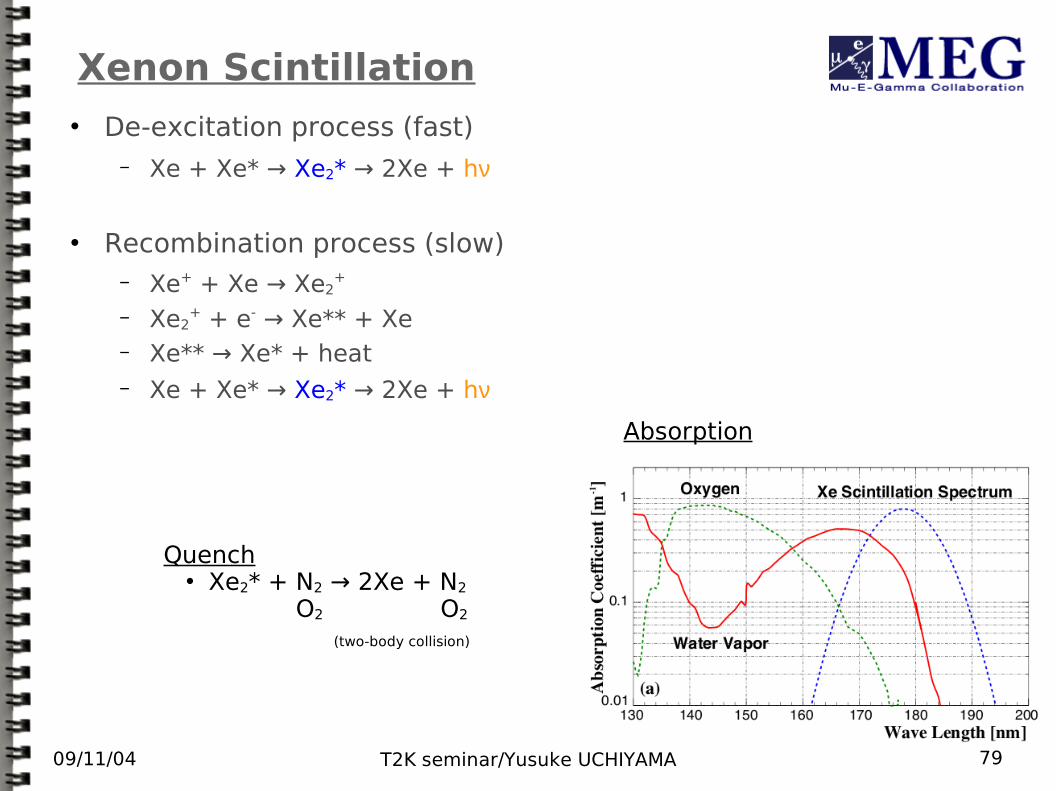
Xenon Scintillation De-excitation process (fast)
− Xe + Xe* → Xe2* → 2Xe + hν
Recombination process (slow)− Xe+ + Xe → Xe2
+
− Xe2+ + e- → Xe** + Xe
− Xe** → Xe* + heat− Xe + Xe* → Xe2* → 2Xe + hν
Quench Xe2* + N2 → 2Xe + N2
Xe2* + O2 → 2Xe + O2
(two-body collision)
Absorption
09/11/04 T2K seminar/Yusuke UCHIYAMA 80
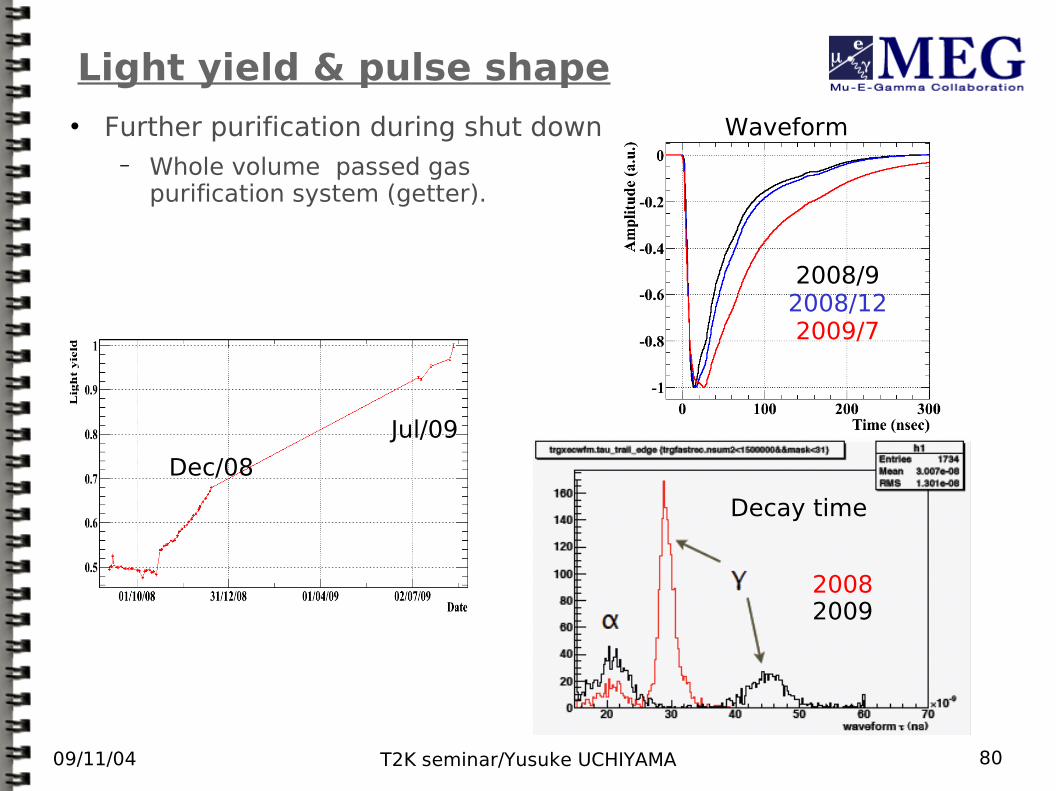
Light yield & pulse shape Further purification during shut down
− Whole volume passed gas purification system (getter).
Dec/08
Jul/09
2008/92008/122009/7
Decay time
20082009
Waveform
09/11/04 T2K seminar/Yusuke UCHIYAMA 81
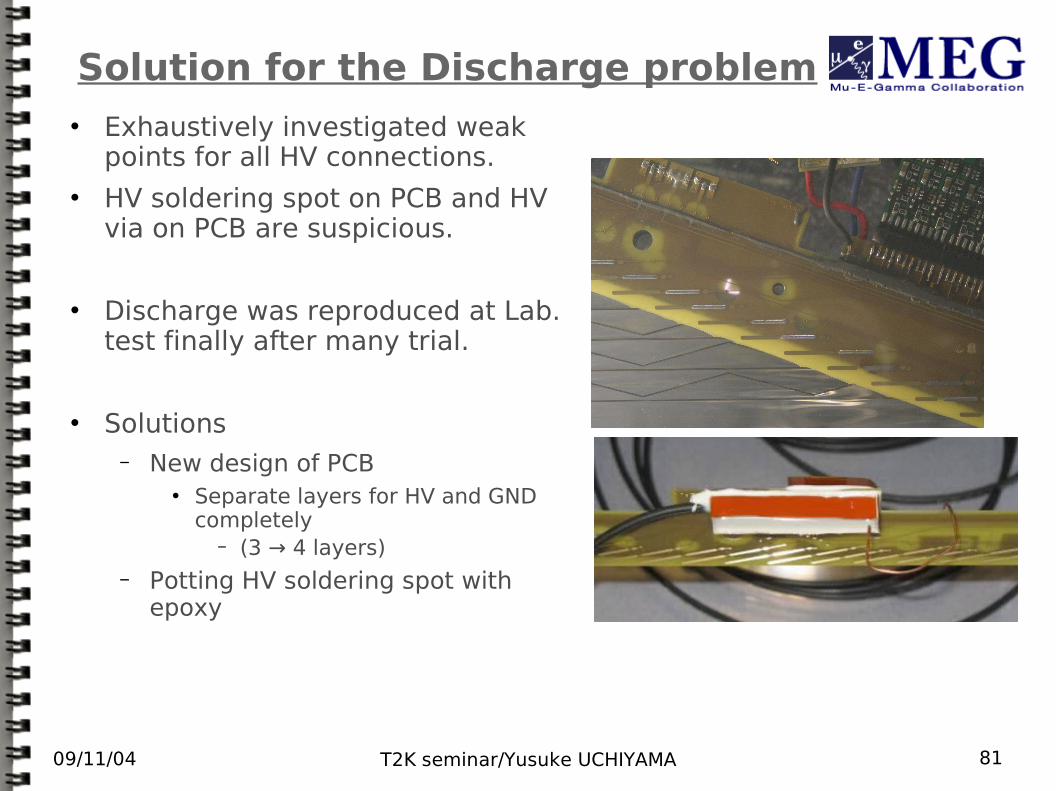
Solution for the Discharge problem Exhaustively investigated weak
points for all HV connections. HV soldering spot on PCB and HV
via on PCB are suspicious.
Discharge was reproduced at Lab. test finally after many trial.
Solutions− New design of PCB
Separate layers for HV and GND completely
− (3 → 4 layers)− Potting HV soldering spot with
epoxy
09/11/04 T2K seminar/Yusuke UCHIYAMA 82
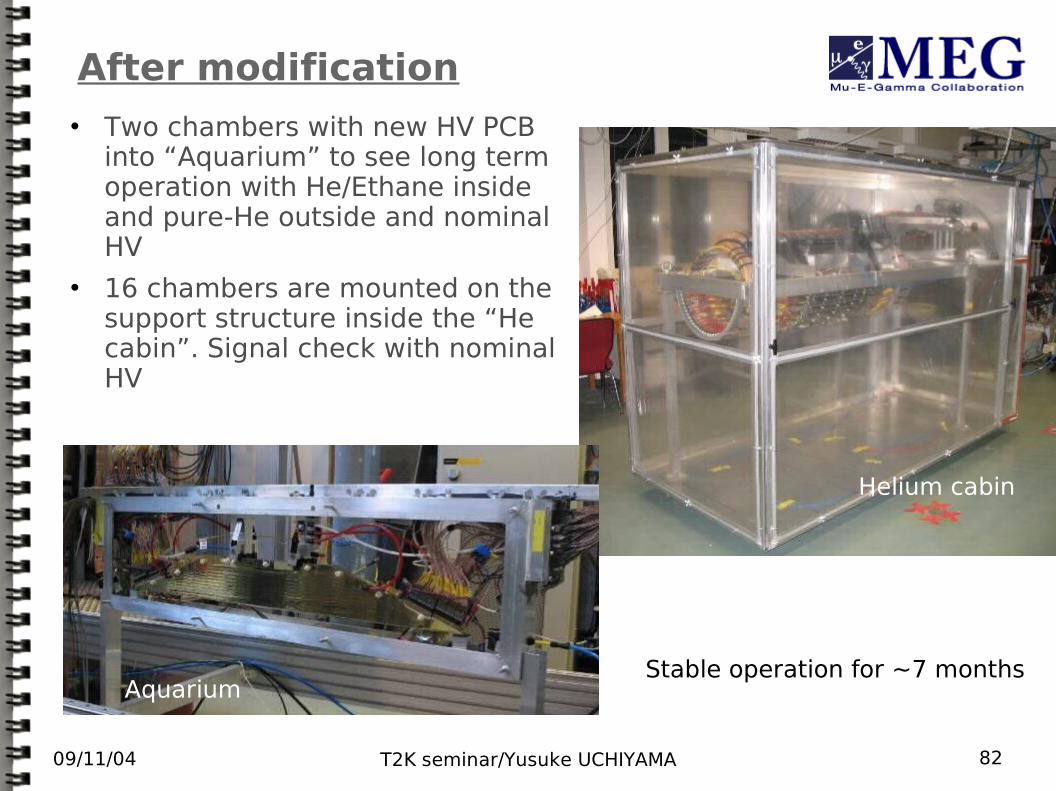
After modification Two chambers with new HV PCB
into “Aquarium” to see long term operation with He/Ethane inside and pure-He outside and nominal HV
16 chambers are mounted on the support structure inside the “He cabin”. Signal check with nominal HV
Stable operation for ~7 monthsAquarium
Helium cabin
09/11/04 T2K seminar/Yusuke UCHIYAMA 83
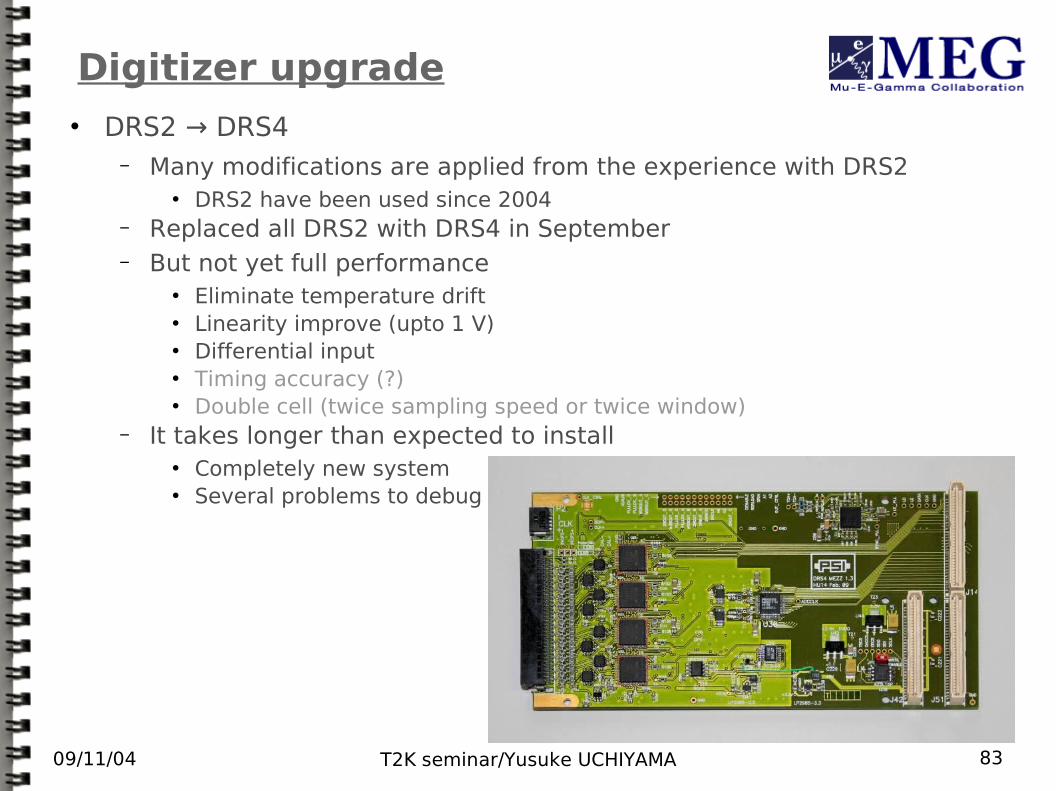
Digitizer upgrade DRS2 → DRS4
− Many modifications are applied from the experience with DRS2 DRS2 have been used since 2004
− Replaced all DRS2 with DRS4 in September− But not yet full performance
Eliminate temperature drift Linearity improve (upto 1 V) Differential input Timing accuracy (?) Double cell (twice sampling speed or twice window)
− It takes longer than expected to install Completely new system Several problems to debug