The evolution of the application of CFD on pedestrian wind ...
9
EACWE 5 Florence, Italy 19 th – 23 rd July 2009 Flying Sphere image © Museo Ideale L. Da Vinci Keywords: CFD wind tunnel pedestrian wind-comfort. ABSTRACT Starting in 2002, Peutz BV in the Netherlands is developing an application using CFD for the prediction of pedestrian wind comfort. The first models used the standard k-ε model and a hybrid differencing scheme and showed moderate agreement with measurement results of wind tunnel test on physical models of the same building projects. Nowadays better agreement is found using the RNG k-ε model, a second order differencing scheme (MINMOD), improved boundary conditions and an increasing number of grid cells. However, a numerical ‘virtual wind tunnel’ cannot yet replace a real one. But, the location of ‘hot spots’ can be predicted, which can be advantageous for certain projects and can be of help to the set up of measurements. For projects with a rather simple geometry CFD can even by used as an alternative for wind tunnel measurements. 1. INTRODUCTION Peutz is a consultancy active in the fields of acoustics, industrial noise, building physics, fire safety, environmental technology and wind tunnel research. Peutz has branches in the Netherlands, Belgium, Germany, France and the United Kingdom and is involved in the design of office and Contact person: L. Aanen, Peutz BV, PO Box 66, 6585 ZH, Mook, The Netherlands, phone +31 (0) 24 357 07 07, fax +31 (0) 024 358 51 50, E-mail [email protected] The evolution of the application of CFD on pedestrian wind comfort in engineering practice, a validation study L. Aanen, G.M. van Uffelen Peutz BV – [email protected]– Peutz BV– [email protected]
Transcript of The evolution of the application of CFD on pedestrian wind ...
EACWE 5Florence, Italy
19th
– 23rd
July 2009
Flying Sphere image © Museo Ideale L. Da Vinci
Keywords: CFD wind tunnel pedestrian wind-comfort.
ABSTRACT
Starting in 2002, Peutz BV in the Netherlands is developing an application using CFD for theprediction of pedestrian wind comfort. The first models used the standard k-ε model and a hybriddifferencing scheme and showed moderate agreement with measurement results of wind tunnel teston physical models of the same building projects. Nowadays better agreement is found using theRNG k-ε model, a second order differencing scheme (MINMOD), improved boundary conditionsand an increasing number of grid cells. However, a numerical ‘virtual wind tunnel’ cannot yetreplace a real one. But, the location of ‘hot spots’ can be predicted, which can be advantageous forcertain projects and can be of help to the set up of measurements. For projects with a rather simplegeometry CFD can even by used as an alternative for wind tunnel measurements.
1. INTRODUCTION
Peutz is a consultancy active in the fields of acoustics, industrial noise, building physics, fire safety,environmental technology and wind tunnel research. Peutz has branches in the Netherlands,Belgium, Germany, France and the United Kingdom and is involved in the design of office and
Contact person: L. Aanen, Peutz BV, PO Box 66, 6585 ZH, Mook, The Netherlands,
phone +31 (0) 24 357 07 07, fax +31 (0) 024 358 51 50, E-mail [email protected]
The evolution of the application of CFD on pedestrian windcomfort in engineering practice, a validation study
L. Aanen, G.M. van UffelenPeutz BV – [email protected]– Peutz BV– [email protected]
residential buildings, railway stations, airports etc.In Mook in the Netherlands, besides a certified acoustical laboratory and a laboratory for
building physics, an atmospheric boundary layer wind tunnel is present. In the wind tunnel studiesare performed with respect to:− pedestrian wind comfort;− dispersion of air pollution;− mean pressures on ventilation openings for ventilation of parking garages and natural ventilation
for CFD;− forces and moments on building constructions.
This paper deals with the comparison between numerical simulation and experimental work.Numerical CFD models concerning wind around buildings and pedestrian wind comfort are testedand the results are compared with measurements on physical scale models in the wind tunnel.
The possibilities of CFD for application in the field of wind around buildings and pedestriancomfort are studied. The code Phoenics of Cham Ltd. is employed with a Cartesian mesh.
Recently, Hu and Wang [2005] showed that using CFD, an adequate prediction of street-levelwinds can be obtained. However, there remain some drawbacks, especially concerning the so-calledVenturi-effect between tall buildings, as Blocken et. al. [2007] show. Comparison of wind tunnelmeasurements on pedestrian comfort with CFD predictions was investigated by a.o. Lam and To[2006], Richards et. al. [2002] and Li et. al.[2004]. Lam and To [2006] show that with the RNG k-εmodel a accuracy of +/- 10% can be achieved.
2. EVALUATION OF THE WIND CLIMATE
In The Netherlands the way to evaluate the wind climate is prescribed in an official standard, theNEN 8100:2006 "wind comfort and wind danger in the built environment". The standard offers thepossibility to use both wind tunnel experiments and CFD to evaluate the wind climate.
The NEN 8100 prescribes that the wind climate has to be judged after the probability ofexceeding a critical wind speed of 5 m/s. Beside that criteria for wind danger are given based on theprobability of exceeding a critical wind speed of 15 m/s. The criteria are summarized in table 1 andtable 2.
Activity-levelProbability of ExceedanceP(Vloc > Vthreshold;wind nuisance)in percentagesof the number of hours per year
Quality-level I.
Walking,normal pace
II.WalkingLeisurely-strolling
III.Sittinglonger time
< 2.5 A Good Good Good
2.5 – 5 B Good Good Moderate
5 – 10 C Good Moderate Poor
10 – 20 D Moderate Poor Poor
≥ 20 E Poor Poor Poor
Table 1: Criteria wind nuisance according to NEN 8100
Probability of ExceedanceP(Vloc > Vthreshold;wind danger)in percentagesof the number of hours per year
Qualification
0.05 < p < 0.30 limited risk
p ≥ 0.30 dangerous
Table 2: Criteria wind danger according to NEN 8100.
According to the standard situations with an exceedance-percentage chance of 0.05 < p < 0.30should only be accepted if they fall within the activity-class I (walking at normal pace).
The number of wind directions tested should be at least 12. Since the Dutch standard refers to anapplication that provides the wind statistics at each position in the Netherlands at a height of 60 m.for 12 wind directions, usually these wind directions are tested.
3. WIND TUNNEL MEASUREMENTS
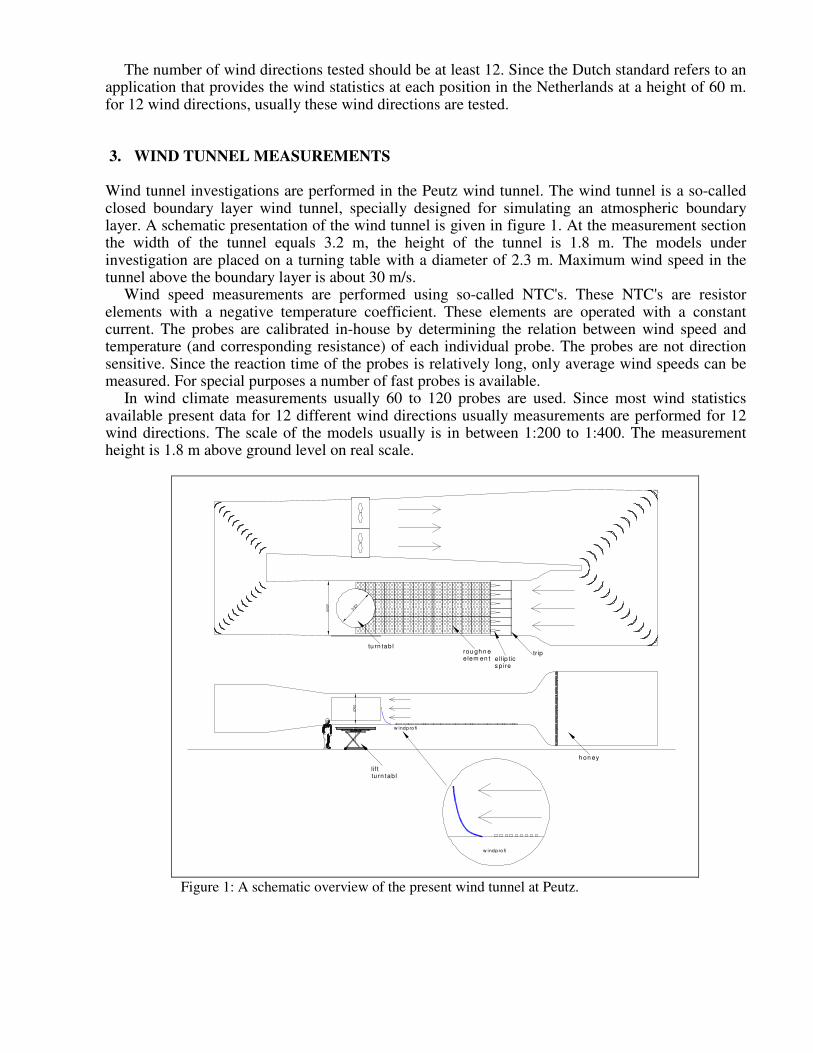
Wind tunnel investigations are performed in the Peutz wind tunnel. The wind tunnel is a so-calledclosed boundary layer wind tunnel, specially designed for simulating an atmospheric boundarylayer. A schematic presentation of the wind tunnel is given in figure 1. At the measurement sectionthe width of the tunnel equals 3.2 m, the height of the tunnel is 1.8 m. The models underinvestigation are placed on a turning table with a diameter of 2.3 m. Maximum wind speed in thetunnel above the boundary layer is about 30 m/s.
Wind speed measurements are performed using so-called NTC's. These NTC's are resistorelements with a negative temperature coefficient. These elements are operated with a constantcurrent. The probes are calibrated in-house by determining the relation between wind speed andtemperature (and corresponding resistance) of each individual probe. The probes are not directionsensitive. Since the reaction time of the probes is relatively long, only average wind speeds can bemeasured. For special purposes a number of fast probes is available.
In wind climate measurements usually 60 to 120 probes are used. Since most wind statisticsavailable present data for 12 different wind directions usually measurements are performed for 12wind directions. The scale of the models usually is in between 1:200 to 1:400. The measurementheight is 1.8 m above ground level on real scale.
tu rn tab le rou gh n e
s selem en ts
e ll ip ticC oun ih ans pires
h on eyc om b
tripb oard
liftw ithturn tab le
w indp ro file
w indp ro file
Figure 1: A schematic overview of the present wind tunnel at Peutz.
4. CFD MODELS
In the first stage of developing our CFD application for predicting pedestrian wind comfort a modelof a large part of our wind tunnel was constructed so as to be able to validate the computedatmospheric boundary layer and the resulting wind flow distribution around buildings. This firstmodel comprises the entire (former) wind tunnel of 15 m x 3 m x 0.9 m including the developmentof the boundary layer by the method of Counihan. This method consists of a turbulence generatorarray as well as roughness elements over a length of 10 m. The roughness elements have beenmodeled in Phoenics as a bottom plate with a surface roughness of 3 cm applying the so-called‘roughness wall functions’ for fully rough surfaces. Furthermore inlets have been placed at the endsof the ‘virtual wind tunnel’ with a turbulence intensity of 100 % and a uniform velocity equal to theaverage tunnel velocity of 8 m/s respectively. The first model uses the standard k-ε model and thehybrid differencing scheme. The total amount of grid cells was approximately 250,000. All modelsdiscussed in this article concern steady flow simulations.
The CFD model is capable of predicting the wind around a given geometry for 12 wind directionsone after another. The CFD model of the wind tunnel has exactly the same size as the former windtunnel at Mook so as to facilitate mutual comparison of the results, without need to worry about theeffect of scaling and as a result of Reynolds number effects.
Since in the approach described above a large part of the computer capacity is used to computethe flow approaching the geometry of interest, a second model was build. This model contains onlythe measurement section (with has a diameter of 2.3 m) with velocity and turbulence profiles forcedat inlets around this section.
The second model has a wind profile with again an average wind velocity of 8 m/s, but now thevelocity has been distributed over the height according to a power law with a coefficient of 0.35.Furthermore the RNG k-ε model and a second order differencing scheme (MINMOD) for the threevelocity components have been applied in this model. For both the turbulent kinetic energy and thedissipation a constant value is prescribed at the boundaries. The total amount of grid cells during thefirst tests of this model was approximately 250,000. Later versions of this latter model used moregrid cells (approximately 600,000).
In the most recent versions of the model a number of improvements were applied: By using theso-called "partial solids treatment" present in Phoenics, the geometry under investigation isrepresented more accurate. With this feature still a Cartesian grid is used, but the cells at thebuilding surface are cut at the surface. The inlet profiles for the velocity are prescribed using thelog-law and the models are no longer scaled down to wind tunnel scale. The roughness for eachwind direction can be prescribed separately. This is important if the location is situated at the shoreor other location with large differences in roughness for the different wind directions. The inletprofiles for the turbulence intensity k and the dissipation ε match with the velocity profile using theequations of the k-ε theory for a stable boundary layer. The equations for the velocity magnitude U,turbulence k and dissipation ε are:
−
−
=
0
0
ln
ln
)(
z
dz
z
dz
UzUref
ref or
−=
0
ln*
)(z
dzuzU
κ, (1)
µC
uk
2*= , (2)
and
)(
*3
dz
u
−=
κε . (3)
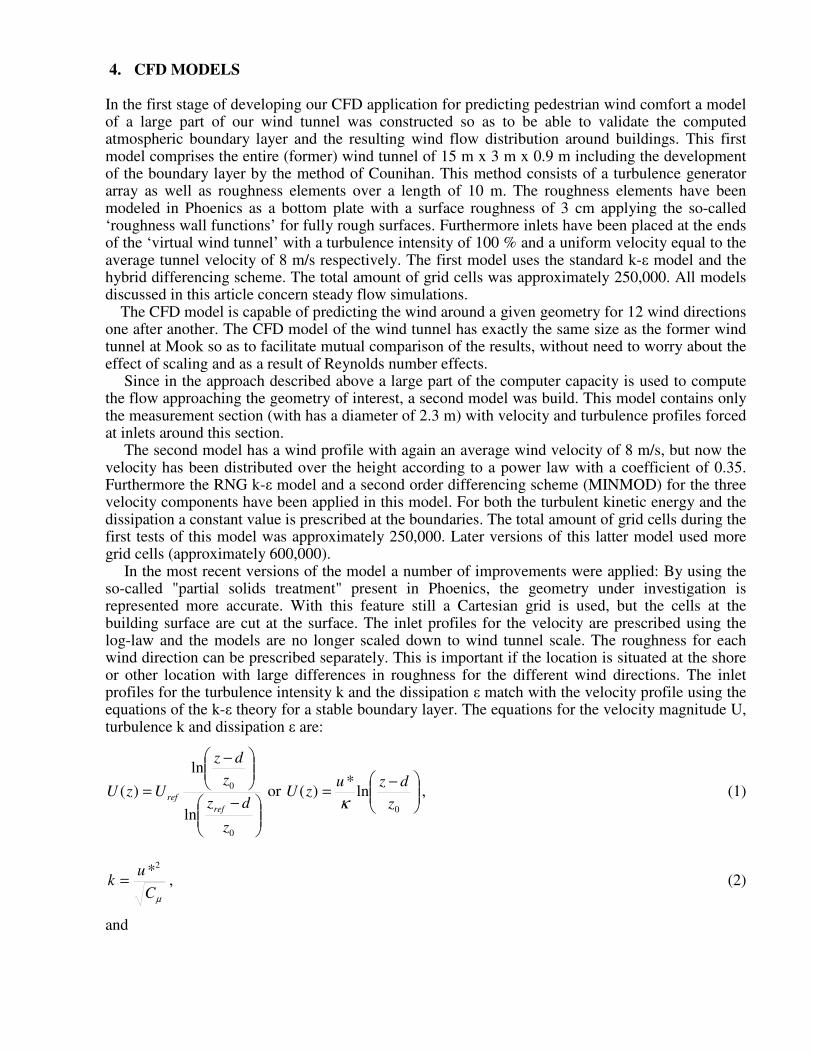
In these equations Uref is the velocity at a reference height zref, d the displacement height, z0 theroughness height, κ the Von Karman constant, u* the friction velocity and Cµ a model constant ofthe k-ε model. In the results presented, the displacement length is kept at a constant value of -z0. Inthis way a conservative estimate for the wind climate is made. To illustrate that the boundaryconditions for the turbulence intensity and the velocity profile match with the geometry underinvestigation, an example of a cross section of the domain showing the distribution of k and thevelocity magnitude is shown in figure 2. The flow in the figures is from left to right. The smallincrease in velocity is caused by the fact that no displacement length was used at the inlet. A smalldecrease of the turbulence intensity is shown. This indicates that the CFD -model is slightly toodissipative.
Figure 2: Velocity distribution (left) and turbulence intensity (right) in a cross
section of the computational domain.
A constant pressure boundary condition is used for the outlets. With increasing computer powerthe amount of cells used, is increased to about 2,000,000 or more.
5. RESULTS
The first model with the developing atmospheric boundary layer is very well capable of reproducingthe wind tunnel flow at the entrance of the measurement section. This means that at themeasurement section the turbulence intensity at a height of 10 m (full scale) adopts the abovementioned value of 35% and that the resulting velocity profile shows to approximate the power lawmentioned in the above.
The demand of CPU capacity to create the right velocity profile was relatively large(approximately 250,000 grid cells). This left too little grid cells available for the measurementsection itself (approximately 150,000 grid cells). However, for rather simple rectangular buildinggeometry’s promising results were produced, even with standard k-ε model and hybrid differencingscheme. For more complex simulations no reliable results were obtained due to the lack of cells inthe region of interest, in combination with the first order differencing scheme and the use of thesimple turbulence model.
In the second model, with only the measurement section modeled, more grid cells are availablein the region of interest. This means that in a typical street between two buildings 7 to 10 grid cellsare available in the region of interest. In combination with the use of the RNG k-ε turbulencemodel, a second order differencing scheme (MINMOD) for the three velocity components andincreasing computer power, more complex geometry's could be simulated. An example of a
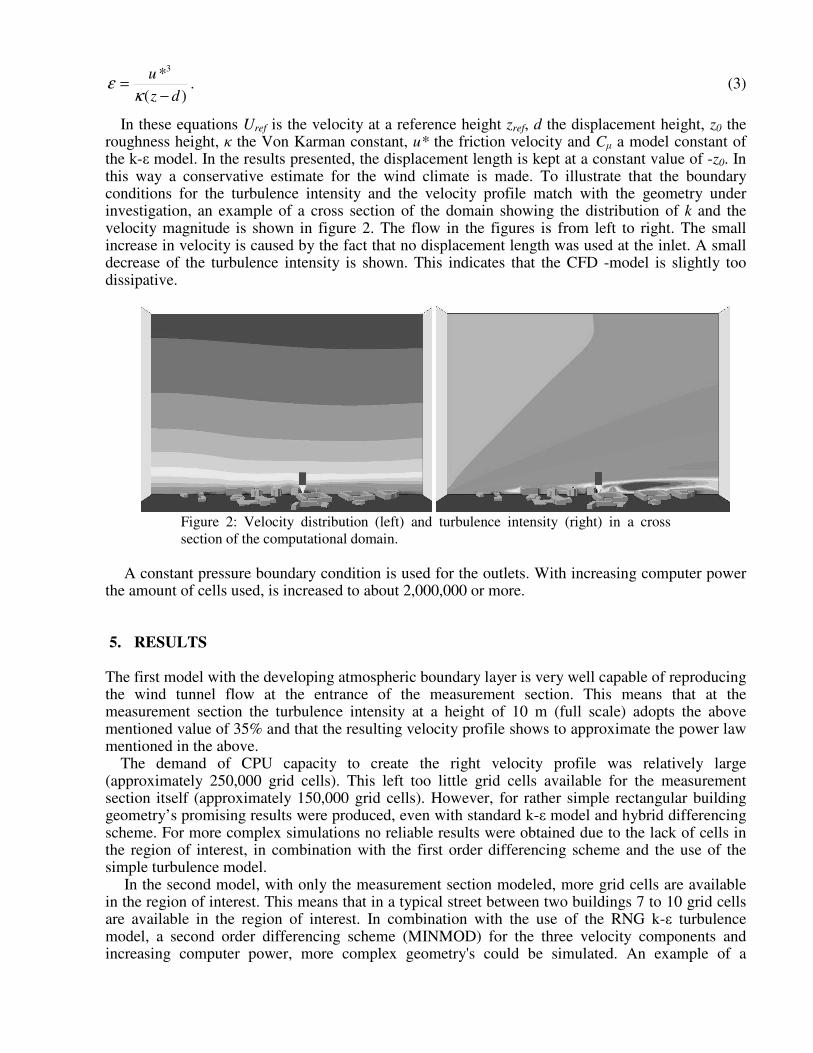
comparison between the results of a wind tunnel experiment and a CFD computation is shown infigure 3. The resolution of the CFD is still rather poor, and due to the Cartesian grid significantdifferences between the real and modeled geometry are present. The general image of the windclimate however is the same for both methods. However due to the lack of a proper boundarycondition for the turbulence properties and the relative low resolution the reliability of the model isnot very high.
25 / 23
32 / 33
42 / 4137 / 20
33 / 32
21 / 27
Figure 3: Comparison between the results of wind tunnel data and CFD for the
second model in probability of exceedance P(Vloc > 5 m/s). White numbers CFD
results, black numbers wind tunnel results.
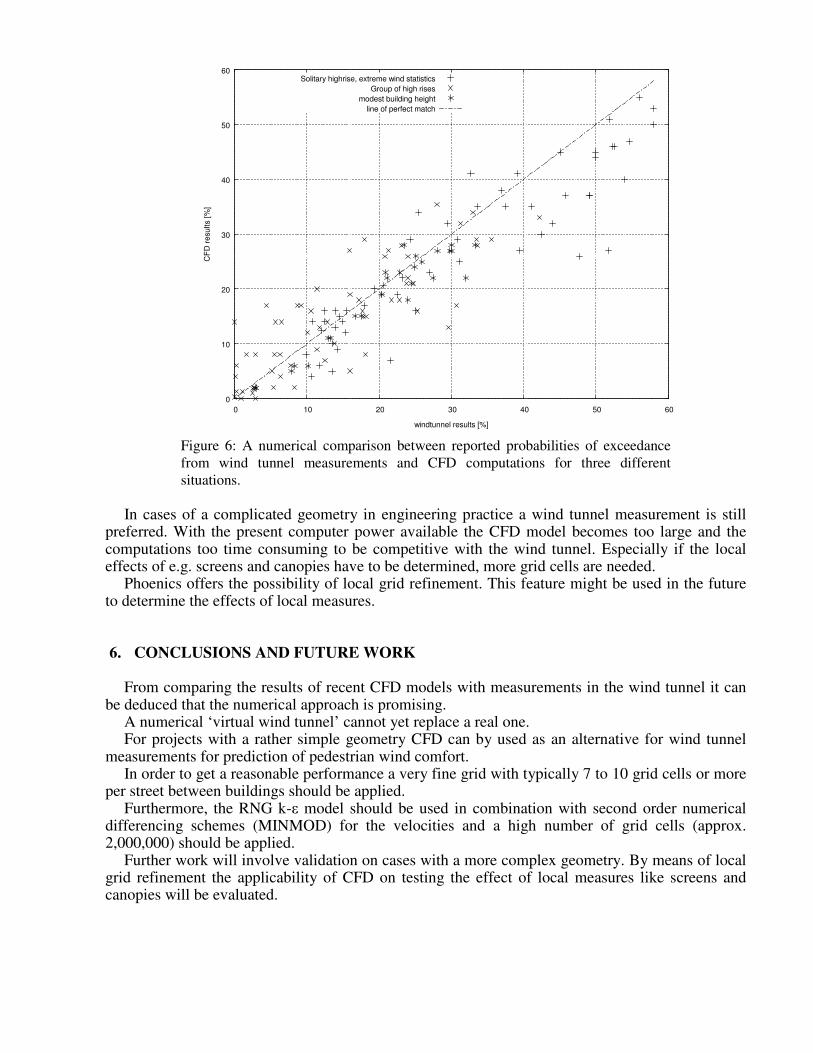
In the present model a good agreement can be found in the predicted probabilities of exceedingthe critical wind speed of 5 m/s, comparing the results of wind tunnel measurements and the resultsof a CFD computation. Even for a rather complex geometry like a group of high rise buildings areasonable estimate of the wind climate can be made. A comparison between a wind tunnelmeasurement and a CFD computation is given in figure 4. The results of the wind tunnelmeasurements are indicated by the dots, with the probability of exceeding the critical wind speedprinted next to it. The scale of the CFD results is limited to 20%. Above 20% the wind climate isqualified as "poor". In this case the maximum percentages in the CFD results are slightlyunderestimated (38% in the CFD, 44% in the measurements). In the CFD however the area in whicha poor wind climate is expected is much easier to determine. An example of a velocity field,together with the grid distribution around the buildings is given in figure 5.
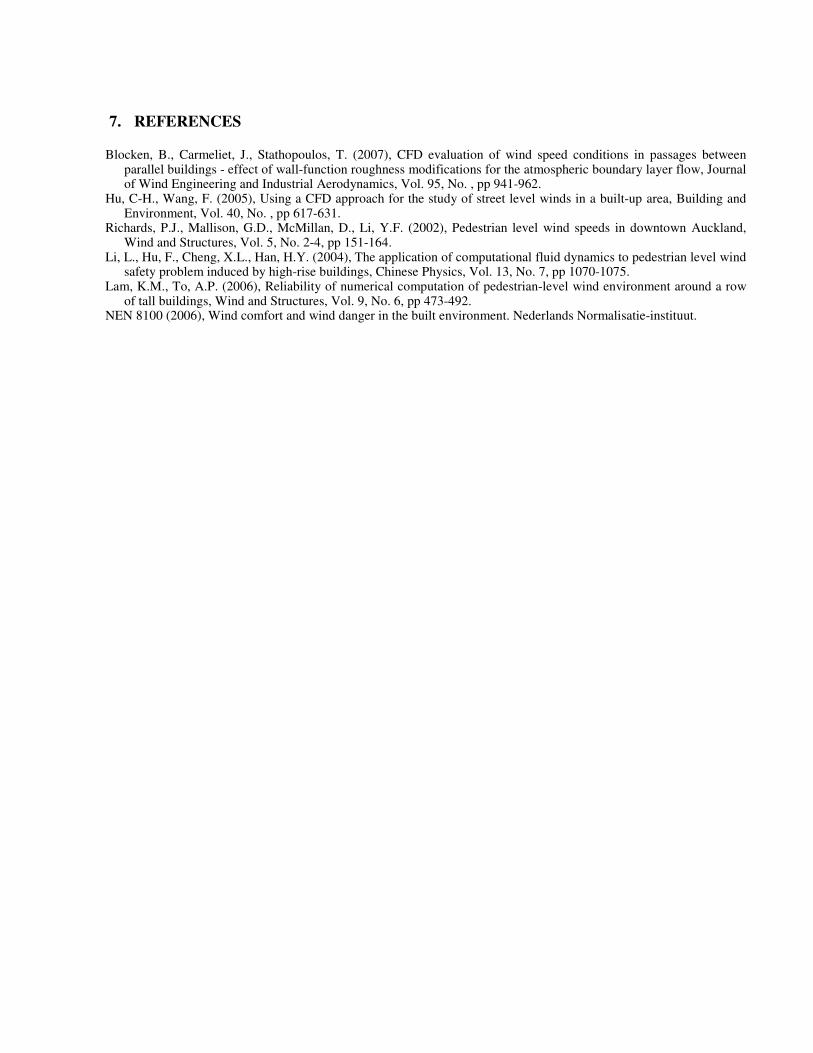
In order to get a better comparison between the results of wind tunnel measurements and CFDcomputations, the results of three different computations are presented in figure 6. The computedpercentage of time an hourly averaged wind speed of 5 m/s is exceeded at a number of points isdetermined with both methods. The results are plotted against each other. The figure shows that forprobabilities up to 40% there is a scatter in the data. On average however, the results are in goodagreement. For probabilities above 40% (which occurs rarely in normal projects) the CFD resultstend to underestimate the probability of exceeding the threshold value of 5 m/s.
The scatter in the data in figure 6 is quite large. Looking at the results in more detail however,reveals that the largest differences appear in the regions with high gradients in the results. Theresulting differences reveal both the strength and the weakness of CFD compared to wind tunnelmeasurements. Due to errors in the prediction of the recirculation region behind the buildings the
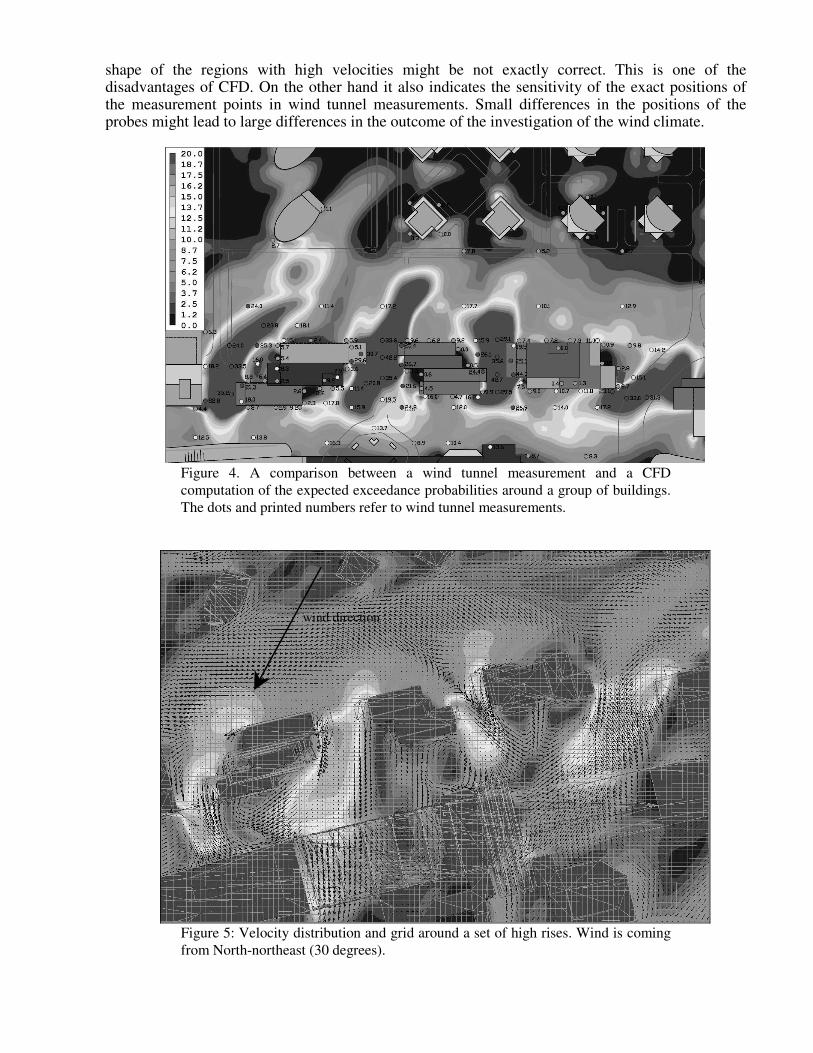
shape of the regions with high velocities might be not exactly correct. This is one of thedisadvantages of CFD. On the other hand it also indicates the sensitivity of the exact positions ofthe measurement points in wind tunnel measurements. Small differences in the positions of theprobes might lead to large differences in the outcome of the investigation of the wind climate.
Figure 4. A comparison between a wind tunnel measurement and a CFD
computation of the expected exceedance probabilities around a group of buildings.
The dots and printed numbers refer to wind tunnel measurements.
wind direction
Figure 5: Velocity distribution and grid around a set of high rises. Wind is coming
from North-northeast (30 degrees).
0
10
20
30
40
50
60
0 10 20 30 40 50 60
CF
D r
esults [
%]
windtunnel results [%]
Solitary highrise, extreme wind statistics
Group of high rises
modest building height
line of perfect match
Figure 6: A numerical comparison between reported probabilities of exceedance
from wind tunnel measurements and CFD computations for three different
situations.
In cases of a complicated geometry in engineering practice a wind tunnel measurement is stillpreferred. With the present computer power available the CFD model becomes too large and thecomputations too time consuming to be competitive with the wind tunnel. Especially if the localeffects of e.g. screens and canopies have to be determined, more grid cells are needed.
Phoenics offers the possibility of local grid refinement. This feature might be used in the futureto determine the effects of local measures.
6. CONCLUSIONS AND FUTURE WORK
From comparing the results of recent CFD models with measurements in the wind tunnel it canbe deduced that the numerical approach is promising.
A numerical ‘virtual wind tunnel’ cannot yet replace a real one.For projects with a rather simple geometry CFD can by used as an alternative for wind tunnel
measurements for prediction of pedestrian wind comfort.In order to get a reasonable performance a very fine grid with typically 7 to 10 grid cells or more
per street between buildings should be applied.Furthermore, the RNG k-ε model should be used in combination with second order numerical
differencing schemes (MINMOD) for the velocities and a high number of grid cells (approx.2,000,000) should be applied.
Further work will involve validation on cases with a more complex geometry. By means of localgrid refinement the applicability of CFD on testing the effect of local measures like screens andcanopies will be evaluated.
7. REFERENCES
Blocken, B., Carmeliet, J., Stathopoulos, T. (2007), CFD evaluation of wind speed conditions in passages betweenparallel buildings - effect of wall-function roughness modifications for the atmospheric boundary layer flow, Journalof Wind Engineering and Industrial Aerodynamics, Vol. 95, No. , pp 941-962.
Hu, C-H., Wang, F. (2005), Using a CFD approach for the study of street level winds in a built-up area, Building andEnvironment, Vol. 40, No. , pp 617-631.
Richards, P.J., Mallison, G.D., McMillan, D., Li, Y.F. (2002), Pedestrian level wind speeds in downtown Auckland,Wind and Structures, Vol. 5, No. 2-4, pp 151-164.
Li, L., Hu, F., Cheng, X.L., Han, H.Y. (2004), The application of computational fluid dynamics to pedestrian level windsafety problem induced by high-rise buildings, Chinese Physics, Vol. 13, No. 7, pp 1070-1075.
Lam, K.M., To, A.P. (2006), Reliability of numerical computation of pedestrian-level wind environment around a rowof tall buildings, Wind and Structures, Vol. 9, No. 6, pp 473-492.
NEN 8100 (2006), Wind comfort and wind danger in the built environment. Nederlands Normalisatie-instituut.