The Effects of Glycerol, Glucose, Galactose, Lactose and ... · PDF fileThe Effects of...
8
Journal of Experimental Microbiology and Immunology (JEMI) Vol. 2:130-137 Copyright April 2002, M&I UBC The Effects of Glycerol, Glucose, Galactose, Lactose and Glucose with Galactose on the Induction of β-galactosidase in Escherichia coli VICKY CHAN, LISA F. DREOLINI, KERRY A. FLINTOFF, SONJA J. LLOYD, AND ANDREA A. MATTENLEY Department of Microbiology and Immunology, UBC Previous work has shown that lactose, added to an Escherichia coli culture grown in M9 media + glycerol, reduces the expression of β-galactosidase. Transcription of the lac operon is normally activated in the presence of lactose. To investigate the possibility that the metabolites of lactose, glucose and galactose, were responsible for this effect, we compared a culture supplemented with lactose to one supplemented with glucose + galactose. We also examined the effect of glucose and galactose alone on β-galactosidase induction. β- galactosidase induction was determined by an enzymatic assay. Separately, glucose and galactose exerted different effects on the lac operon. Both lactose and glucose + galactose showed similar effects in reducing β-galactosidase induction, suggesting that the effects on repression seen with lactose are due to its constituent carbohydrate monomers and that the effects of glucose and galactose are additive. The expression of enzymes required to utilize various carbon sources in Escherichia coli is tightly regulated. Regulation is complex, with multiple distinct mechanisms overlapping and interacting with one another to coordinate responses. A well studied example is the lac operon, which encodes the enzyme, β-galactosidase, required for the metabolism of lactose. The expression of the operon is regulated by the LacI repressor and a global regulatory mechanism. This mechanism is known as carbon catabolite repression, and refers to the phenomenon whereby the presence of a rapidly metabolizable carbon source such as glucose inhibits the expression of genes encoding proteins required for the utilization of alternative carbon sources such as lactose (2). There exist numerous mechanisms that mediate catabolite repression, and many are still poorly understood. Previous work has demonstrated that the addition of isopropylthiogalactoside (IPTG), which is a gratuitous inducer of the lac operon, followed by the addition of lactose results in a decrease in β-galactosidase synthesis in relation to the glycerol control culture (3). This conflicts with what is known about the lac operon, since addition of lactose was expected to result in an increase in the induction of β-galactosidase formation. This decrease was also more severe than the decrease seen in the culture that had been grown on glucose. It was therefore postulated that the decrease was due to the presence of the metabolites of lactose, glucose and galactose, and the additive effects of the two metabolites resulted in the more severe repression. To test this, we compared the induction of β- galactosidase synthesis in cultures induced with IPTG, and subsequently grown in glucose, galactose, lactose, and glucose plus galactose. The rate of β-galactosidase production was measured by assaying enzyme activity using the artificial substrate o-nitrophenol β-galactoside (ONPG), which is cleaved by β-galactosidase to yield a colored product whose concentration is easily measured by spectrophotometer. MATERIALS AND METHODS Escherichia coli wild-type strain VC10 with high streptomycin resistance level (supplied by Dr. Ramey, UBC), was grown overnight in M9 medium supplemented with 0.2% glycerol in a shaking water bath at 37 o C. Four hours before the start of the experiment, the overnight culture, at a turbidity of 1.26 O.D. 460 (measured using Spectronic 20 zeroed with distilled water), was diluted 1-in-5 in fresh M9 + 0.2% glycerol media to a final volume of 61.5 ml. The diluted culture was kept in the 37 o C shaking water bath until the experiment started. To start the experiment, the culture was diluted again to 0.2 O.D. 460 to a final volume of 250 mL and incubated in the 37 o C shaking water bath for 5 minutes. IPTG (0.1 mM final concentration) was used to induce the expression of β-galactosidase from lac operon at time zero. At 3-minute intervals, 3 ml samples were taken for measurement of turbidity (O.D. 460 against sterile M9 media) and β-galactosidase activity. At 14 minute, 40 mL cultures were transferred to each of the four prewarmed Erlenemeyer flasks containing the additional carbon sources and the prewarmed empty flask. The five tested conditions included the control culture in M9 + 0.2% glycerol and the four cultures supplemented with either 5 mM glucose, 5 mM galactose, 5 mM lactose or 5 mM glucose with 5 mM galactose. The flasks were immediately returned to the 37 o C water bath. The turbidity and enzyme activity of each of the flask were monitored for one hour by collecting samples in 5 to 10-minute intervals. 130
Transcript of The Effects of Glycerol, Glucose, Galactose, Lactose and ... · PDF fileThe Effects of...
Journal of Experimental Microbiology and Immunology (JEMI) Vol. 2:130-137 Copyright April 2002, M&I UBC
The Effects of Glycerol, Glucose, Galactose, Lactose and Glucose with Galactose on the Induction of β-galactosidase in Escherichia coli
VICKY CHAN, LISA F. DREOLINI, KERRY A. FLINTOFF, SONJA J. LLOYD,
AND ANDREA A. MATTENLEY
Department of Microbiology and Immunology, UBC
Previous work has shown that lactose, added to an Escherichia coli culture grown in M9 media + glycerol, reduces the expression of β-galactosidase. Transcription of the lac operon is normally activated in the presence of lactose. To investigate the possibility that the metabolites of lactose, glucose and galactose, were responsible for this effect, we compared a culture supplemented with lactose to one supplemented with glucose + galactose. We also examined the effect of glucose and galactose alone on β-galactosidase induction. β-galactosidase induction was determined by an enzymatic assay. Separately, glucose and galactose exerted different effects on the lac operon. Both lactose and glucose + galactose showed similar effects in reducing β-galactosidase induction, suggesting that the effects on repression seen with lactose are due to its constituent carbohydrate monomers and that the effects of glucose and galactose are additive.
The expression of enzymes required to utilize various carbon sources in Escherichia coli is tightly regulated. Regulation is complex, with multiple distinct mechanisms overlapping and interacting with one another to coordinate responses. A well studied example is the lac operon, which encodes the enzyme, β-galactosidase, required for the metabolism of lactose. The expression of the operon is regulated by the LacI repressor and a global regulatory mechanism. This mechanism is known as carbon catabolite repression, and refers to the phenomenon whereby the presence of a rapidly metabolizable carbon source such as glucose inhibits the expression of genes encoding proteins required for the utilization of alternative carbon sources such as lactose (2). There exist numerous mechanisms that mediate catabolite repression, and many are still poorly understood. Previous work has demonstrated that the addition of isopropylthiogalactoside (IPTG), which is a gratuitous inducer of the lac operon, followed by the addition of lactose results in a decrease in β-galactosidase synthesis in relation to the glycerol control culture (3). This conflicts with what is known about the lac operon, since addition of lactose was expected to result in an increase in the induction of β-galactosidase formation. This decrease was also more severe than the decrease seen in the culture that had been grown on glucose. It was therefore postulated that the decrease was due to the presence of the metabolites of lactose, glucose and galactose, and the additive effects of the two metabolites resulted in the more severe repression. To test this, we compared the induction of β-galactosidase synthesis in cultures induced with IPTG, and subsequently grown in glucose, galactose, lactose, and glucose plus galactose. The rate of β-galactosidase production was measured by assaying enzyme activity using the artificial substrate o-nitrophenol β-galactoside (ONPG), which is cleaved by β-galactosidase to yield a colored product whose concentration is easily measured by spectrophotometer.
MATERIALS AND METHODS Escherichia coli wild-type strain VC10 with high streptomycin resistance level (supplied by Dr. Ramey, UBC), was grown overnight in M9 medium supplemented with 0.2% glycerol in a shaking water bath at 37oC. Four hours before the start of the experiment, the overnight culture, at a turbidity of 1.26 O.D.460
(measured using Spectronic 20 zeroed with distilled water), was diluted 1-in-5 in fresh M9 + 0.2% glycerol media to a final volume of 61.5 ml. The diluted culture was kept in the 37oC shaking water bath until the experiment started. To start the experiment, the culture was diluted again to 0.2 O.D.460 to a final volume of 250 mL and incubated in the 37oC shaking water bath for 5 minutes. IPTG (0.1 mM final concentration) was used to induce the expression of β-galactosidase from lac operon at time zero. At 3-minute intervals, 3 ml samples were taken for measurement of turbidity (O.D.460 against sterile M9 media) and β-galactosidase activity. At 14 minute, 40 mL cultures were transferred to each of the four prewarmed Erlenemeyer flasks containing the additional carbon sources and the prewarmed empty flask. The five tested conditions included the control culture in M9 + 0.2% glycerol and the four cultures supplemented with either 5 mM glucose, 5 mM galactose, 5 mM lactose or 5 mM glucose with 5 mM galactose. The flasks were immediately returned to the 37oC water bath. The turbidity and enzyme activity of each of the flask were monitored for one hour by collecting samples in 5 to 10-minute intervals.
130
Journal of Experimental Microbiology and Immunology (JEMI) Vol. 2:130-137 Copyright April 2002, M&I UBC β-galactosidase activity After the turbidity of the 3 ml sample was measured, 200 µl toluene was added and the sample was vortexed for 20 seconds. The mixture was allowed to sit for at least 1 minute before 0.4 ml of the permeabilized cells was transferred to a clean test tube. After all the samples were collected, 1.2 ml Tris (20mM, pH 8.0) was added to each tube and the samples were placed in a 25oC water bath. The reaction was started by adding 0.2 ml of 5 mM ONPG. The sample was mixed immediately by finger vortexing and returned to the water bath. The reaction was stopped by adding 2 ml of 0.6 M sodium carbonate. The start and stop time of the reaction were recorded for calculation of enzyme activity. Reactions that proceeded very slowly were stopped after 50 minutes. The absorbance readings were measured against distilled water and were corrected for the turbidity of the cell debris by subtracting the absorbance reading of the blank assay. Blank assays were prepared for each corresponding time point by mixing the permeabilized control culture with Tris, distilled water and sodium carbonate.
RESULTS
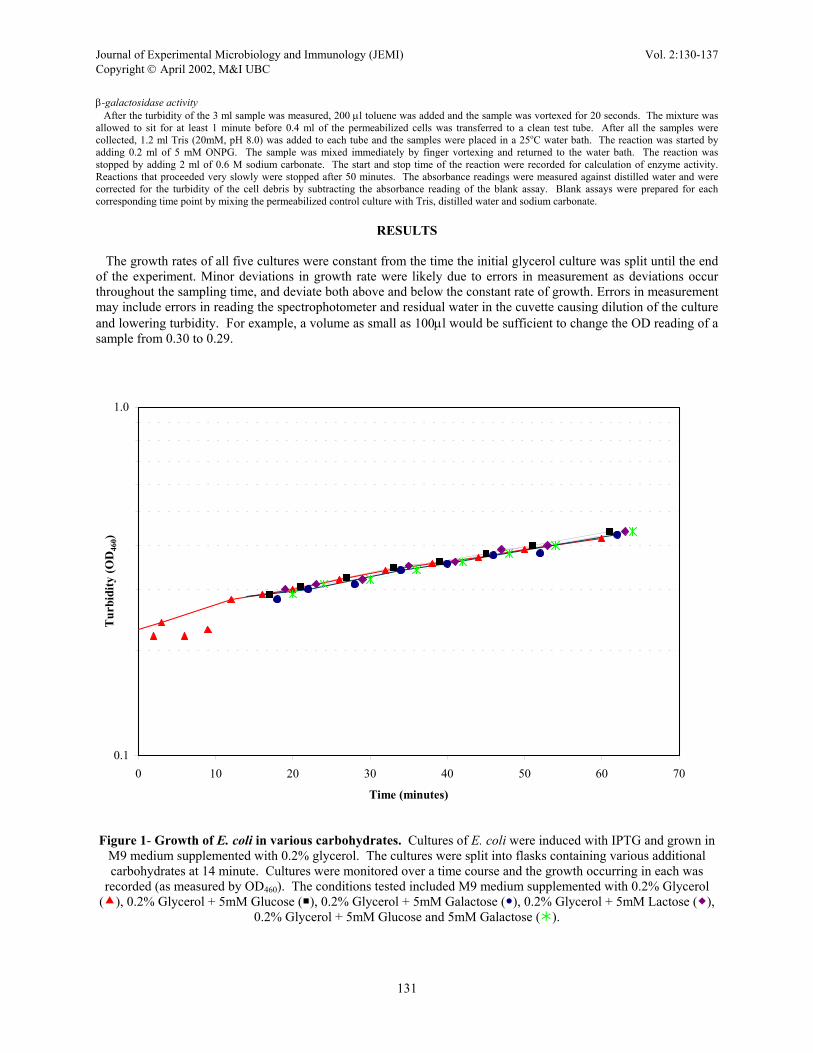
The growth rates of all five cultures were constant from the time the initial glycerol culture was split until the end of the experiment. Minor deviations in growth rate were likely due to errors in measurement as deviations occur throughout the sampling time, and deviate both above and below the constant rate of growth. Errors in measurement may include errors in reading the spectrophotometer and residual water in the cuvette causing dilution of the culture and lowering turbidity. For example, a volume as small as 100µl would be sufficient to change the OD reading of a sample from 0.30 to 0.29.
0.1
1.0
0 10 20 30 40 50 60 70
Time (minutes)
Tur
bidi
ty (O
D46
0)
Figure 1- Growth of E. coli in various carbohydrates. Cultures of E. coli were induced with IPTG and grown in
M9 medium supplemented with 0.2% glycerol. The cultures were split into flasks containing various additional carbohydrates at 14 minute. Cultures were monitored over a time course and the growth occurring in each was
recorded (as measured by OD460). The conditions tested included M9 medium supplemented with 0.2% Glycerol ( ), 0.2% Glycerol + 5mM Glucose ( ), 0.2% Glycerol + 5mM Galactose ( ), 0.2% Glycerol + 5mM Lactose ( ),
0.2% Glycerol + 5mM Glucose and 5mM Galactose ( ).
131
Journal of Experimental Microbiology and Immunology (JEMI) Vol. 2:130-137 Copyright April 2002, M&I UBC
-20
0
20
40
60
80
100
120
0 10 20 30 40 50 60
Time (minutes)
Enz
yme
Spec
ific
Act
ivity
(mU
/ml O
D46
0)
70
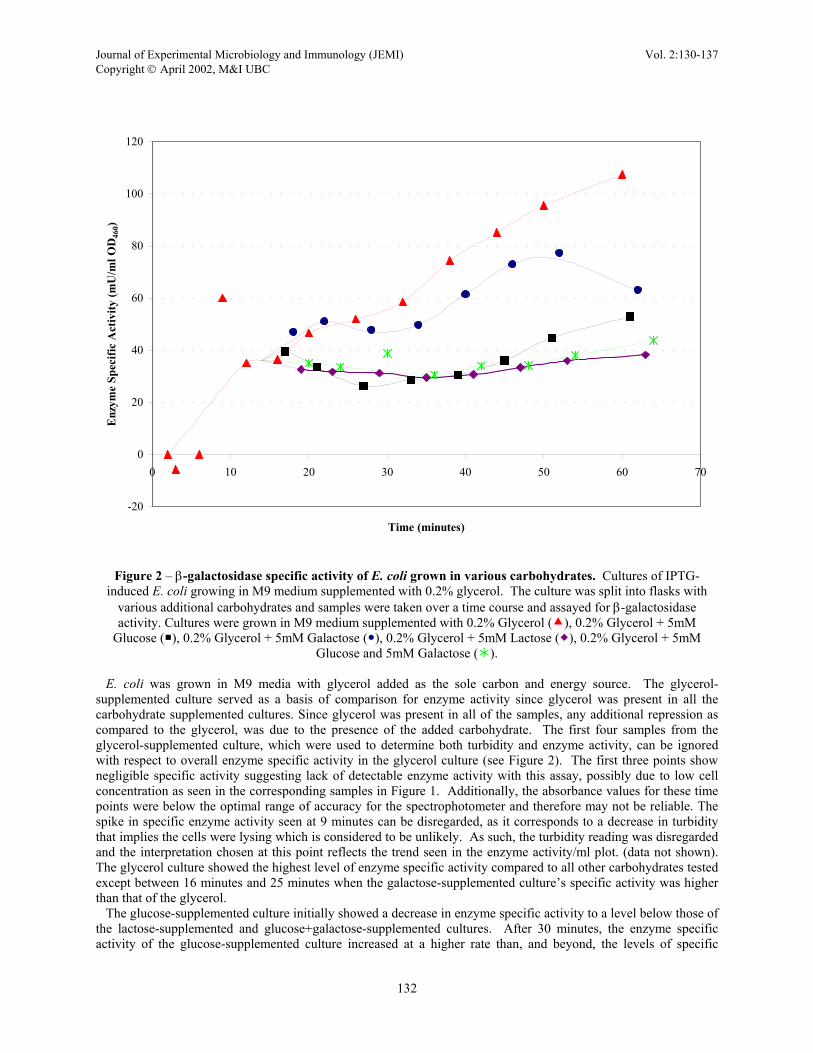
Figure 2 – β-galactosidase specific activity of E. coli grown in various carbohydrates. Cultures of IPTG-
induced E. coli growing in M9 medium supplemented with 0.2% glycerol. The culture was split into flasks with various additional carbohydrates and samples were taken over a time course and assayed for β-galactosidase activity. Cultures were grown in M9 medium supplemented with 0.2% Glycerol ( ), 0.2% Glycerol + 5mM
Glucose ( ), 0.2% Glycerol + 5mM Galactose ( ), 0.2% Glycerol + 5mM Lactose ( ), 0.2% Glycerol + 5mM Glucose and 5mM Galactose ( ).
E. coli was grown in M9 media with glycerol added as the sole carbon and energy source. The glycerol-supplemented culture served as a basis of comparison for enzyme activity since glycerol was present in all the carbohydrate supplemented cultures. Since glycerol was present in all of the samples, any additional repression as compared to the glycerol, was due to the presence of the added carbohydrate. The first four samples from the glycerol-supplemented culture, which were used to determine both turbidity and enzyme activity, can be ignored with respect to overall enzyme specific activity in the glycerol culture (see Figure 2). The first three points show negligible specific activity suggesting lack of detectable enzyme activity with this assay, possibly due to low cell concentration as seen in the corresponding samples in Figure 1. Additionally, the absorbance values for these time points were below the optimal range of accuracy for the spectrophotometer and therefore may not be reliable. The spike in specific enzyme activity seen at 9 minutes can be disregarded, as it corresponds to a decrease in turbidity that implies the cells were lysing which is considered to be unlikely. As such, the turbidity reading was disregarded and the interpretation chosen at this point reflects the trend seen in the enzyme activity/ml plot. (data not shown). The glycerol culture showed the highest level of enzyme specific activity compared to all other carbohydrates tested except between 16 minutes and 25 minutes when the galactose-supplemented culture’s specific activity was higher than that of the glycerol. The glucose-supplemented culture initially showed a decrease in enzyme specific activity to a level below those of the lactose-supplemented and glucose+galactose-supplemented cultures. After 30 minutes, the enzyme specific activity of the glucose-supplemented culture increased at a higher rate than, and beyond, the levels of specific
132
Journal of Experimental Microbiology and Immunology (JEMI) Vol. 2:130-137 Copyright April 2002, M&I UBC activity of the lactose-supplemented and glucose+galactose-supplemented cultures until the end of the experiment. The repression of the glucose-supplemented culture was initially more severe but recovered at a faster rate than that of the lactose-supplemented and glucose+galactose-supplemented cultures. The data points for specific activity of β-galactosidase in the glucose-supplemented culture are considered to be relatively accurate; points may slightly deviate from the overall trend due to errors in measurement, however these deviations are not considered to be significant. Initially, the galactose-supplemented culture showed a higher level of specific activity than even the glycerol culture. At 23 minutes the specific activity of the galactose-supplemented culture dropped below the level of the specific activity of the glycerol culture. From thirty-four to fifty-two minutes, the specific activity increased at a rate almost parallel to the glycerol culture. The galactose-supplemented culture’s specific activity remained higher than those of all other samples except glycerol. At sixty-two minutes, the galactose-supplemented culture showed a decrease in the specific activity. However, the 62 minute sample corresponds to a plateau in enzyme activity/ml (not shown) therefore it is likely that there is a slowing in specific enzyme activity. Considering this is a one-point trend, continued sampling after sixty-two minutes, through another doubling time, would be needed to determine if this reflects an actual decrease or a plateau in the specific enzyme activity of the galactose-treated culture. The lactose-supplemented sample showed essentially a constant level of repression of specific enzyme activity through forty-five minutes. This activity is similar to the glucose+galactose-supplemented culture. The last three samples from the lactose-supplemented culture suggest a slight increase in specific enzyme activity, although to a level less than the observed increases in the glucose supplemented and galactose supplemented cultures. Continuation of the experiment beyond one hour would be necessary to confirm an increase in the specific activity of the lactose-supplemented culture. The specific activity of the glucose+galactose-supplemented culture was effectively the same as the lactose culture for the first 30 minutes; specific activity is constant, then shows a slight increase. At forty minutes, the rate of increase of specific activity in this culture was slightly higher than that observe in the lactose culture. While the specific activity of the glucose-supplemented and glucose+galactose-supplemented cultures increased at similar rates, the specific activity in the glucose+galactose-supplemented culture was lower than the activity of glucose-supplemented culture.
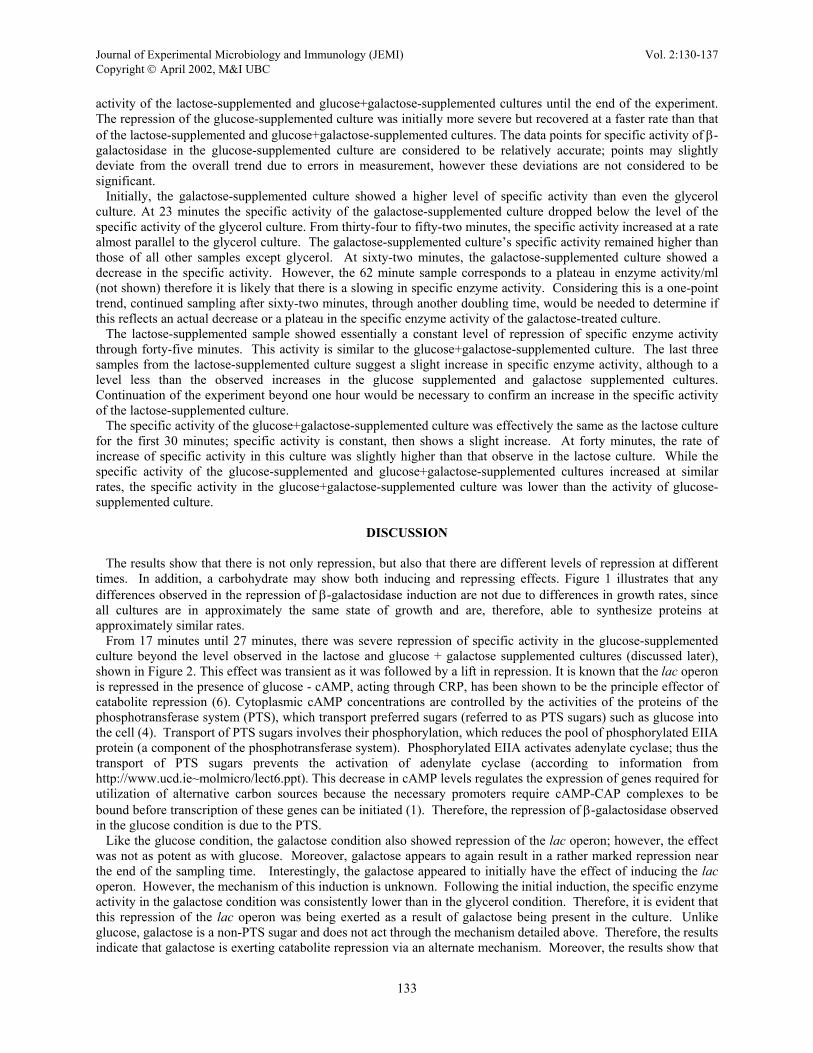
DISCUSSION The results show that there is not only repression, but also that there are different levels of repression at different times. In addition, a carbohydrate may show both inducing and repressing effects. Figure 1 illustrates that any differences observed in the repression of β-galactosidase induction are not due to differences in growth rates, since all cultures are in approximately the same state of growth and are, therefore, able to synthesize proteins at approximately similar rates. From 17 minutes until 27 minutes, there was severe repression of specific activity in the glucose-supplemented culture beyond the level observed in the lactose and glucose + galactose supplemented cultures (discussed later), shown in Figure 2. This effect was transient as it was followed by a lift in repression. It is known that the lac operon is repressed in the presence of glucose - cAMP, acting through CRP, has been shown to be the principle effector of catabolite repression (6). Cytoplasmic cAMP concentrations are controlled by the activities of the proteins of the phosphotransferase system (PTS), which transport preferred sugars (referred to as PTS sugars) such as glucose into the cell (4). Transport of PTS sugars involves their phosphorylation, which reduces the pool of phosphorylated EIIA protein (a component of the phosphotransferase system). Phosphorylated EIIA activates adenylate cyclase; thus the transport of PTS sugars prevents the activation of adenylate cyclase (according to information from http://www.ucd.ie~molmicro/lect6.ppt). This decrease in cAMP levels regulates the expression of genes required for utilization of alternative carbon sources because the necessary promoters require cAMP-CAP complexes to be bound before transcription of these genes can be initiated (1). Therefore, the repression of β-galactosidase observed in the glucose condition is due to the PTS. Like the glucose condition, the galactose condition also showed repression of the lac operon; however, the effect was not as potent as with glucose. Moreover, galactose appears to again result in a rather marked repression near the end of the sampling time. Interestingly, the galactose appeared to initially have the effect of inducing the lac operon. However, the mechanism of this induction is unknown. Following the initial induction, the specific enzyme activity in the galactose condition was consistently lower than in the glycerol condition. Therefore, it is evident that this repression of the lac operon was being exerted as a result of galactose being present in the culture. Unlike glucose, galactose is a non-PTS sugar and does not act through the mechanism detailed above. Therefore, the results indicate that galactose is exerting catabolite repression via an alternate mechanism. Moreover, the results show that
133
Journal of Experimental Microbiology and Immunology (JEMI) Vol. 2:130-137 Copyright April 2002, M&I UBC this mechanism appears to be less potent, as demonstrated by the relative differences in repression between the glucose and galactose conditions. Recently, alternate mechanisms (i.e. non-PTS) for catabolite repression in E. coli have been investigated – namely the catabolite repressor/activator (Cra) model (5). The Cra protein contributes to the phenomenon of carbon catabolite repression by controlling the expression of genes encoding key enzymes in all of the major pathways for carbon metabolism. The Cra protein can act as either a repressor or activator of gene transcription, depending on where it binds to the DNA in relation to the RNA polymerase binding site. Cra binds fructose-1,6-bisphosphate as well as fructose-1-phosphate, which are both catabolites of glycolytic substrates. The galactose degradation pathway leads to both fructose-1,6-bisphosphate and fructose-1-phosphate. Cra bound to these forms of fructose is unable to bind to the specific DNA sequences and is therefore unable to exert its effects (5). Those genes that are regulated by Cra are consequently subject to catabolite repression or catabolite activation, depending on the system. It is possible that the lac operon is subject to catabolite repression by this mechanism. As well, recent data have shown that under certain physiological conditions Cra modulates the activity of adenylate cyclase, and thus can influence intracellular cAMP concentrations independently of the PTS (5). Hence, the glycolytic products that result from the breakdown of galactose may be interacting with the Cra protein, which in turn is modulating the expression of the lac operon resulting in the observed catabolite repression effect. This effect can also be exerted by the glycolytic breakdown products of glucose. Both the glucose + galactose treated culture and the lactose treated culture show similar repression that is more acute than galactose throughout the experiment. However, this repression is initially less severe than that observed in the glucose treated culture between 17 and 27 minutes. The fact that the repression observed in the glucose supplemented culture was more severe than in the glucose + galactose supplemented culture suggests that galactose is counteracting the severe repression caused by glucose alone, in keeping with the initial induction of the lac operon observed in the galactose supplemented culture. After the 40 minute time point, glucose + galactose and lactose show stronger repression than glucose acting alone. Here, both the PTS (glucose) and Cra (glucose + galactose) mechanisms of repression are proposed to be taking effect. There might be more repression in these cultures than the glucose-supplemented culture as there were twice as many molecules of sugars added to repress enzyme activity. The lactose condition shows similar enzyme activity to that of the glucose + galactose condition. This supports our hypothesis that lactose is cleaved to glucose and galactose as it enters the cell and therefore exerts repression via these products. There is no repression due to the PTS as lactose is not a PTS sugar (4). Glucose + galactose and lactose are acting via different methods of repression (PTS + Cra and PTS + 2XCra, respectively). It might be expected that the glucose + galactose would repress more than the lactose, as a large part of the repression mechanism when galactose + glucose are added is due to the import of glucose via the PTS. Likely, this is due to a maximum level of repression represented by the lactose condition. Any additional repression by glucose + galactose is undetected. One further experiment could be to run the assay over a longer time period as described above. Another possibility includes adding equimolar amounts of glucose, galactose, and glucose+ galactose to the M9 + glycerol at higher concentrations (above 2.5mM). If there was no difference between this test and the lactose or glucose + galactose results, this would support our hypothesis involving a maximum level of repression. In addition, a range of different concentrations (3 mM to 9 mM) of the carbohydrates could also be used to test the effect of concentration on the level of β-galactosidase repression. In order to specifically investigate the potential involvement of the CRA system in modulation of expression of the lac operon, it would be useful to create E. coli mutants in which the CRA binding site in the promoter of the lac operon was removed. This would thus abolish the CRA ability to interact with, and affect transcription of, the lac operon. In order to verify glucose acting through the PTS system, cell lysates from cultures grown either in the presence or absence of glucose could be run on a polyacrylamide gel to resolve cellular proteins. A Western blot using antibodies specific for either the phosphorylated or dephosphorylated form of EIIA would then reveal differences in the relative levels of each form of the protein in these cultures. Our results support our hypothesis that after lactose is imported into the cell it is cleaved into glucose + galactose and that these sugars both contribute to catabolite repression. One mechanism is possibly through glucose repressing the lac operon directly. The other mechanisms are not clear, but might operate via the Cra pathway.
ACKNOWLEDGEMENTS We would like to thank Dr. W. D. Ramey for invaluable discussions on practical and theoretical aspects of the experiment, and Andre Comeau and Nick Cheng for assistance in the laboratory.
134
Journal of Experimental Microbiology and Immunology (JEMI) Vol. 2:130-137 Copyright April 2002, M&I UBC
REFERENCES
1. Lewin, B. 1990. Genes IV. Oxford University Press, New York, N.Y. 2. Paulsen, I.T., S. Chavaux, P.Choi, and M.H. Saier Jr. 1998. Characterization of glucose-specific catabolite repression-resistant
mutants of Bacillus subtilis: Identification of a novel Hexose:H+ symporter. J. Bacteriol. 180:498-504. 3. Ramey, W.D. 2002. ExpA4. Effect of glucose, lactose and sucrose on the induction of β-Galactosidase. In Manual of Experimental
Microbiology, Microbiology 421, UBC. 4. Saier, M.H., Jr. 1996. Regulation of carbon metabolism in bacteria. Res. Microbiol. 149: 439-447. 5. Saier, M.H., Jr., and T.M. Ramseier. 1996. The catabolite repressor/activator (Cra) protein of enteric bacteria. J. Bacteriol.
178:3411-3417. 6. Ullman, A. 1996. Catabolite repression: a story without end. Res. Microbiol. 147:455-458.
135
Journal of Experimental Microbiology and Immunology (JEMI) Vol. 2:130-137 Copyright April 2002, M&I UBC
Appendix I
Sample Calculations:
1% Glycerol
Raw data:
Enzyme Assay
Time
(min)
Turbidity
(OD460)
Start
(min)
Finish
(min)
A420 A420
Bkgrnd
.
A420
Corr
.
Enzyme
Activity
Log
Enzyme
Activity
Enzyme
Specific
Activity
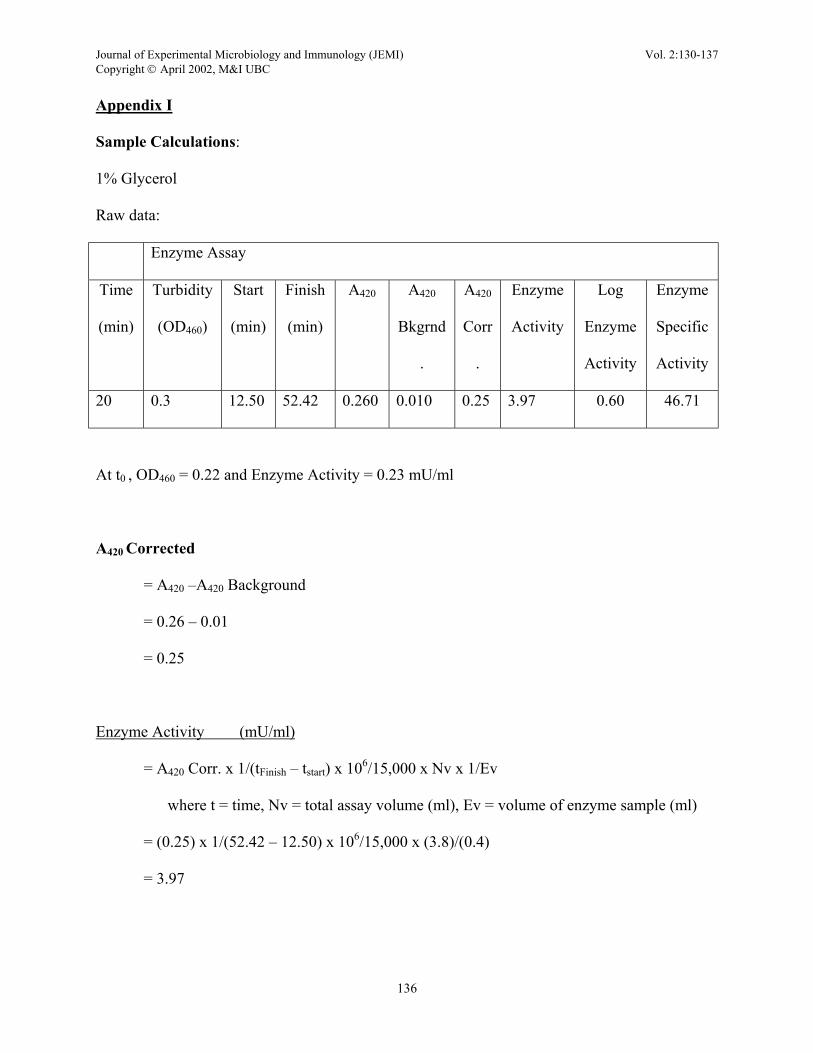
20 0.3 12.50 52.42 0.260 0.010 0.25 3.97 0.60 46.71
At t0 , OD460 = 0.22 and Enzyme Activity = 0.23 mU/ml
A420 Corrected
= A420 –A420 Background
= 0.26 – 0.01
= 0.25
Enzyme Activity (mU/ml)
= A420 Corr. x 1/(tFinish – tstart) x 106/15,000 x Nv x 1/Ev
where t = time, Nv = total assay volume (ml), Ev = volume of enzyme sample (ml)
= (0.25) x 1/(52.42 – 12.50) x 106/15,000 x (3.8)/(0.4)
= 3.97
136
Journal of Experimental Microbiology and Immunology (JEMI) Vol. 2:130-137 Copyright April 2002, M&I UBC
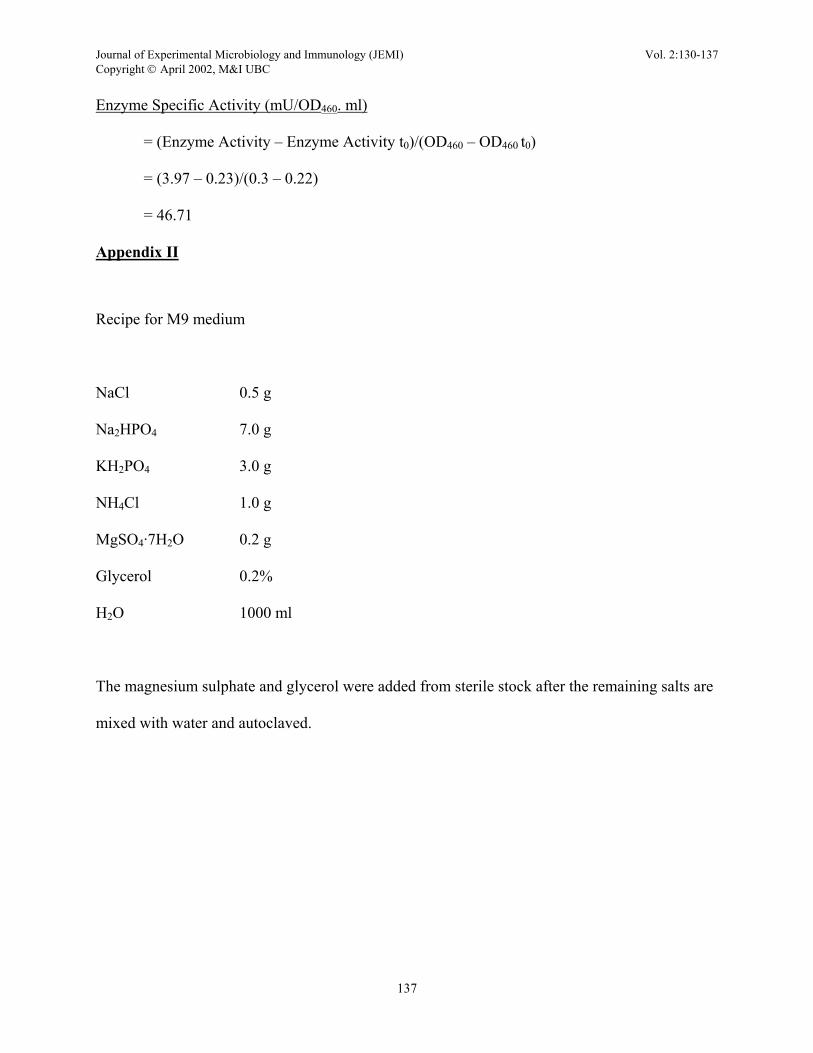
Enzyme Specific Activity (mU/OD460. ml)
= (Enzyme Activity – Enzyme Activity t0)/(OD460 – OD460 t0)
= (3.97 – 0.23)/(0.3 – 0.22)
= 46.71
Appendix II
Recipe for M9 medium
NaCl 0.5 g
Na2HPO4 7.0 g
KH2PO4 3.0 g
NH4Cl 1.0 g
MgSO4·7H2O 0.2 g
Glycerol 0.2%
H2O 1000 ml
The magnesium sulphate and glycerol were added from sterile stock after the remaining salts are
mixed with water and autoclaved.
137