Muscle-specific knockout of PKC-λ impairs glucose...
13
Research article The Journal of Clinical Investigation http://www.jci.org Volume 117 Number 8 August 2007 2289 Muscle-specific knockout of PKC-λ impairs glucose transport and induces metabolic and diabetic syndromes Robert V. Farese, 1,2,3 Mini P. Sajan, 1,2,3 Hong Yang, 1,2,3 Pengfei Li, 1,3 Steven Mastorides, 1 William R. Gower Jr., 1,3 Sonali Nimal, 1,2,3 Cheol Soo Choi, 4 Sheene Kim, 4 Gerald I. Shulman, 4 C. Ronald Kahn, 5 Ursula Braun, 6,7 and Michael Leitges 6,7 1 James A. Haley Veterans Medical Center, Tampa, Florida, USA. 2 Roskamp Institute, Sarasota, Florida, USA. 3 Department of Internal Medicine and Department of Molecular Medicine, University of South Florida College of Medicine, Tampa, Florida, USA. 4 Department of Internal Medicine, Yale University School of Medicine, New Haven, Connecticut, USA. 5 Joslin Research Foundation and Harvard Medical School, Boston, Massachusetts, USA. 6 Division of Nephrology, Department of Medicine, Hannover Medical School, Hannover, Germany. 7 Biotechnology Centre of Oslo, Oslo, Norway. Obesity, the metabolic syndrome, and type 2 diabetes mellitus (T2DM) are major global health problems. Insulin resistance is frequently present in these disorders, but the causes and effects of such resistance are unknown. Here, we generated mice with muscle-specific knockout of the major murine atypical PKC (aPKC), PKC-λ, a postulated mediator for insulin-stimulated glucose transport. Glucose transport and translocation of glucose transporter 4 (GLUT4) to the plasma membrane were diminished in muscles of both homozy- gous and heterozygous PKC-λ knockout mice and were accompanied by systemic insulin resistance; impaired glucose tolerance or diabetes; islet β cell hyperplasia; abdominal adiposity; hepatosteatosis; elevated serum triglycerides, FFAs, and LDL-cholesterol; and diminished HDL-cholesterol. In contrast to the defective activa- tion of muscle aPKC, insulin signaling and actions were intact in muscle, liver, and adipocytes. These findings demonstrate the importance of aPKC in insulin-stimulated glucose transport in muscles of intact mice and show that insulin resistance and resultant hyperinsulinemia owing to a specific defect in muscle aPKC is suffi- cient to induce abdominal obesity and other lipid abnormalities of the metabolic syndrome and T2DM. These findings are particularly relevant because humans who have obesity, impaired glucose tolerance, and T2DM reportedly have defective activation and/or diminished levels of muscle aPKC. Introduction Glucose transport is rate-limiting for glucose metabolism in most tissues. In muscle, the major tissue for whole-body glucose dispos- al, defects in insulin-stimulated glucose transport are observed in obesity; the metabolic syndrome, with associated abdominal obe- sity, hyperlipidemia, and impaired glucose tolerance (IGT); and type 2 diabetes mellitus (T2DM). Factors that mediate insulin stimulation of glucose transport are still poorly defined. Studies using inhibitory agents in cultured myocytes and adipocytes suggest that insulin-stimulated glucose transport is regulated by atypical PKCs (aPKCs), PKC-ζ and PCK-λ (1–7), and by PKB/Akt (8–12), operating downstream of PI3K. There is, however, little evidence from gene-targeting studies to implicate specific isoforms of aPKC and PKB that are required for insulin-stimulated glucose transport in intact muscle. Total-body KO of PKB-α/Akt1 does not alter glucose homeostasis (13), and total-body KO of PKB-β/Akt2 produces a diabetic state, charac- terized by markedly defective hepatic glucose metabolism and a partial decrease in insulin-stimulated glucose transport in muscle that is evident only at submaximal insulin concentrations (14). Total-body KO of PKC-λ, the major murine aPKC, is embryonic lethal, and, despite reports of liver-specific (15) and pancreatic β cell–specific (16) PKC-λ KO, there are no reports to our knowl- edge of muscle-specific PKC-λ KO. Information on effects of this deficiency in muscle aPKC is particularly relevant, because aPKC levels are diminished and/or poorly activated in muscles of humans who have obesity (17, 18), IGT (19, 20), and T2DM (17, 20, 21). Here, we report on a muscle-specific PKC-λ KO created by breed- ing mice harboring Cre recombinase transgene controlled by a mus- cle creatine kinase (MCK) promotor/enhancer with mice carrying a targeted PKC-λ allele with loxP sites flanking an essential exon located at nucleotides 110–233; details of the floxed PKC-λ con- struct were described previously (22). In these mice, we directly test- ed the hypothesis that aPKC is required for glucose transport effects of insulin; moreover, we examined the metabolic consequences of defects in aPKC availability/activation and glucose transport occur- ring specifically in muscle. We found that insulin-stimulated glu- cose transport was markedly impaired in heart muscle of KO mice in which aPKC levels were diminished. Moreover, this isolated defect in muscle glucose transport was accompanied by systemic insulin resistance, glucose intolerance, abdominal obesity, hyperlipidemia, and hepatosteosis, i.e., features of metabolic syndrome. Results Glucose transport in muscles of homozygous KO mice. Total aPKC and PKC-λ levels were markedly diminished (~80%) in vastus lateralis and heart muscles of mice with homozygous muscle-specific PKC-λ KO (Cre + loxP +/+ ; Figure 1, A and B, and Figure 2A). This aPKC defi- ciency was accompanied by marked decreases in muscle uptake of Nonstandard abbreviations used: aPKC, atypical PKC; AS160, Akt substrate 160; 2-DG, 2-deoxyglucose; FAS, fatty acid synthase; GLUT, glucose transporter; GSK, glycogen synthase kinase; HGP, hepatic glucose production; IGT, impaired glucose tolerance; IRS, insulin receptor substrate; MCK, muscle creatine kinase; PIP3, phos- phatidylinositol-3,4,5,-(PO4)3; T2DM, type 2 diabetes mellitus. Conflict of interest: The authors have declared that no conflict of interest exists. Citation for this article: J. Clin. Invest. 117:2289–2301 (2007). doi:10.1172/JCI31408.
Transcript of Muscle-specific knockout of PKC-λ impairs glucose...
Research article
TheJournalofClinicalInvestigation http://www.jci.org Volume 117 Number 8 August 2007 2289
Muscle-specific knockout of PKC-λ impairs glucose transport and induces metabolic
and diabetic syndromesRobert V. Farese,1,2,3 Mini P. Sajan,1,2,3 Hong Yang,1,2,3 Pengfei Li,1,3 Steven Mastorides,1
William R. Gower Jr.,1,3 Sonali Nimal,1,2,3 Cheol Soo Choi,4 Sheene Kim,4 Gerald I. Shulman,4 C. Ronald Kahn,5 Ursula Braun,6,7 and Michael Leitges6,7
1James A. Haley Veterans Medical Center, Tampa, Florida, USA. 2Roskamp Institute, Sarasota, Florida, USA. 3Department of Internal Medicine and Department of Molecular Medicine, University of South Florida College of Medicine, Tampa, Florida, USA. 4Department of Internal Medicine,
Yale University School of Medicine, New Haven, Connecticut, USA. 5Joslin Research Foundation and Harvard Medical School, Boston, Massachusetts, USA. 6Division of Nephrology, Department of Medicine, Hannover Medical School, Hannover, Germany. 7Biotechnology Centre of Oslo, Oslo, Norway.
Obesity,themetabolicsyndrome,andtype2diabetesmellitus(T2DM)aremajorglobalhealthproblems.Insulinresistanceisfrequentlypresentinthesedisorders,butthecausesandeffectsofsuchresistanceareunknown.Here,wegeneratedmicewithmuscle-specificknockoutofthemajormurineatypicalPKC(aPKC),PKC-λ,apostulatedmediatorforinsulin-stimulatedglucosetransport.Glucosetransportandtranslocationofglucosetransporter4(GLUT4)totheplasmamembranewerediminishedinmusclesofbothhomozy-gousandheterozygousPKC-λ knockoutmiceandwereaccompaniedbysystemicinsulinresistance;impairedglucosetoleranceordiabetes;isletβcellhyperplasia;abdominaladiposity;hepatosteatosis;elevatedserumtriglycerides,FFAs,andLDL-cholesterol;anddiminishedHDL-cholesterol.Incontrasttothedefectiveactiva-tionofmuscleaPKC,insulinsignalingandactionswereintactinmuscle,liver,andadipocytes.ThesefindingsdemonstratetheimportanceofaPKCininsulin-stimulatedglucosetransportinmusclesofintactmiceandshowthatinsulinresistanceandresultanthyperinsulinemiaowingtoaspecificdefectinmuscleaPKCissuffi-cienttoinduceabdominalobesityandotherlipidabnormalitiesofthemetabolicsyndromeandT2DM.Thesefindingsareparticularlyrelevantbecausehumanswhohaveobesity,impairedglucosetolerance,andT2DMreportedlyhavedefectiveactivationand/ordiminishedlevelsofmuscleaPKC.
IntroductionGlucose transport is rate-limiting for glucose metabolism in most tissues. In muscle, the major tissue for whole-body glucose dispos-al, defects in insulin-stimulated glucose transport are observed in obesity; the metabolic syndrome, with associated abdominal obe-sity, hyperlipidemia, and impaired glucose tolerance (IGT); and type 2 diabetes mellitus (T2DM).
Factors that mediate insulin stimulation of glucose transport are still poorly defined. Studies using inhibitory agents in cultured myocytes and adipocytes suggest that insulin-stimulated glucose transport is regulated by atypical PKCs (aPKCs), PKC-ζ and PCK-λ (1–7), and by PKB/Akt (8–12), operating downstream of PI3K. There is, however, little evidence from gene-targeting studies to implicate specific isoforms of aPKC and PKB that are required for insulin-stimulated glucose transport in intact muscle. Total-body KO of PKB-α/Akt1 does not alter glucose homeostasis (13), and total-body KO of PKB-β/Akt2 produces a diabetic state, charac-terized by markedly defective hepatic glucose metabolism and a partial decrease in insulin-stimulated glucose transport in muscle that is evident only at submaximal insulin concentrations (14). Total-body KO of PKC-λ, the major murine aPKC, is embryonic
lethal, and, despite reports of liver-specific (15) and pancreatic β cell–specific (16) PKC-λ KO, there are no reports to our knowl-edge of muscle-specific PKC-λ KO. Information on effects of this deficiency in muscle aPKC is particularly relevant, because aPKC levels are diminished and/or poorly activated in muscles of humans who have obesity (17, 18), IGT (19, 20), and T2DM (17, 20, 21).
Here, we report on a muscle-specific PKC-λ KO created by breed-ing mice harboring Cre recombinase transgene controlled by a mus-cle creatine kinase (MCK) promotor/enhancer with mice carrying a targeted PKC-λ allele with loxP sites flanking an essential exon located at nucleotides 110–233; details of the floxed PKC-λ con-struct were described previously (22). In these mice, we directly test-ed the hypothesis that aPKC is required for glucose transport effects of insulin; moreover, we examined the metabolic consequences of defects in aPKC availability/activation and glucose transport occur-ring specifically in muscle. We found that insulin-stimulated glu-cose transport was markedly impaired in heart muscle of KO mice in which aPKC levels were diminished. Moreover, this isolated defect in muscle glucose transport was accompanied by systemic insulin resistance, glucose intolerance, abdominal obesity, hyperlipidemia, and hepatosteosis, i.e., features of metabolic syndrome.
ResultsGlucose transport in muscles of homozygous KO mice. Total aPKC and PKC-λ levels were markedly diminished (~80%) in vastus lateralis and heart muscles of mice with homozygous muscle-specific PKC-λ KO (Cre+loxP+/+; Figure 1, A and B, and Figure 2A). This aPKC defi-ciency was accompanied by marked decreases in muscle uptake of
Nonstandardabbreviationsused: aPKC, atypical PKC; AS160, Akt substrate 160; 2-DG, 2-deoxyglucose; FAS, fatty acid synthase; GLUT, glucose transporter; GSK, glycogen synthase kinase; HGP, hepatic glucose production; IGT, impaired glucose tolerance; IRS, insulin receptor substrate; MCK, muscle creatine kinase; PIP3, phos-phatidylinositol-3,4,5,-(PO4)3; T2DM, type 2 diabetes mellitus.
Conflictofinterest: The authors have declared that no conflict of interest exists.
Citationforthisarticle: J. Clin. Invest. 117:2289–2301 (2007). doi:10.1172/JCI31408.
research article
2290 TheJournalofClinicalInvestigation http://www.jci.org Volume 117 Number 8 August 2007
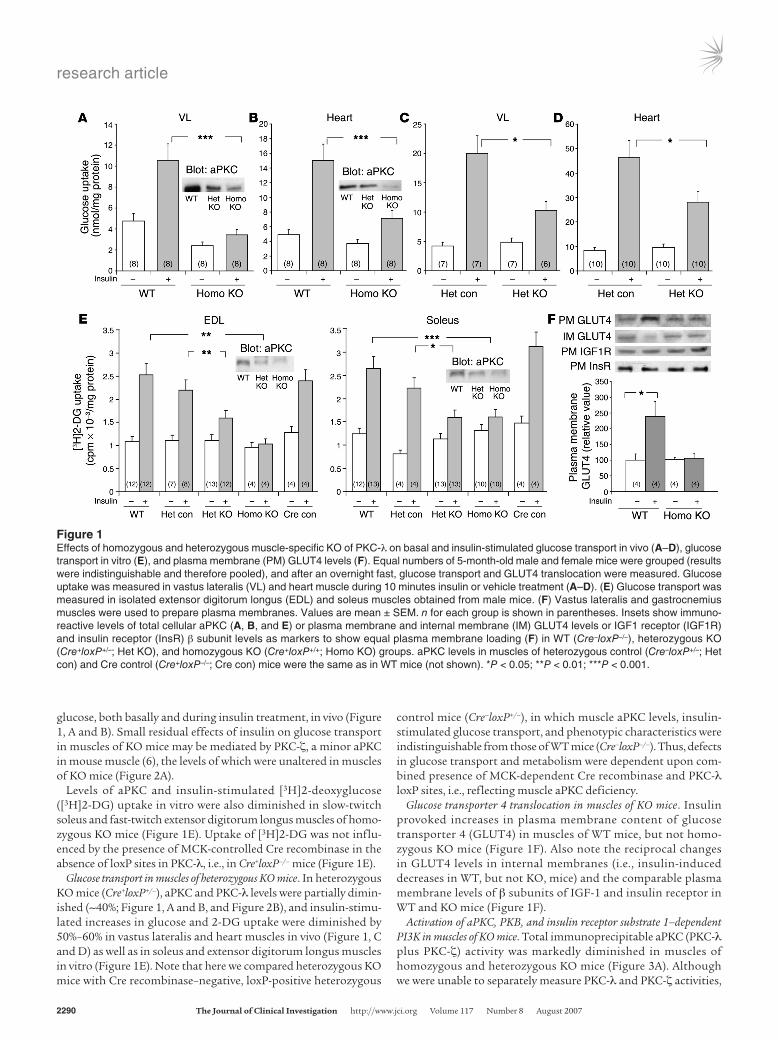
glucose, both basally and during insulin treatment, in vivo (Figure 1, A and B). Small residual effects of insulin on glucose transport in muscles of KO mice may be mediated by PKC-ζ, a minor aPKC in mouse muscle (6), the levels of which were unaltered in muscles of KO mice (Figure 2A).
Levels of aPKC and insulin-stimulated [3H]2-deoxyglucose ([3H]2-DG) uptake in vitro were also diminished in slow-twitch soleus and fast-twitch extensor digitorum longus muscles of homo-zygous KO mice (Figure 1E). Uptake of [3H]2-DG was not influ-enced by the presence of MCK-controlled Cre recombinase in the absence of loxP sites in PKC-λ, i.e., in Cre+loxP–/– mice (Figure 1E).
Glucose transport in muscles of heterozygous KO mice. In heterozygous KO mice (Cre+loxP+/–), aPKC and PKC-λ levels were partially dimin-ished (~40%; Figure 1, A and B, and Figure 2B), and insulin-stimu-lated increases in glucose and 2-DG uptake were diminished by 50%–60% in vastus lateralis and heart muscles in vivo (Figure 1, C and D) as well as in soleus and extensor digitorum longus muscles in vitro (Figure 1E). Note that here we compared heterozygous KO mice with Cre recombinase–negative, loxP-positive heterozygous
control mice (Cre–loxP+/–), in which muscle aPKC levels, insulin-stimulated glucose transport, and phenotypic characteristics were indistinguishable from those of WT mice (Cre–loxP–/–). Thus, defects in glucose transport and metabolism were dependent upon com-bined presence of MCK-dependent Cre recombinase and PKC-λ loxP sites, i.e., reflecting muscle aPKC deficiency.
Glucose transporter 4 translocation in muscles of KO mice. Insulin provoked increases in plasma membrane content of glucose transporter 4 (GLUT4) in muscles of WT mice, but not homo-zygous KO mice (Figure 1F). Also note the reciprocal changes in GLUT4 levels in internal membranes (i.e., insulin-induced decreases in WT, but not KO, mice) and the comparable plasma membrane levels of β subunits of IGF-1 and insulin receptor in WT and KO mice (Figure 1F).
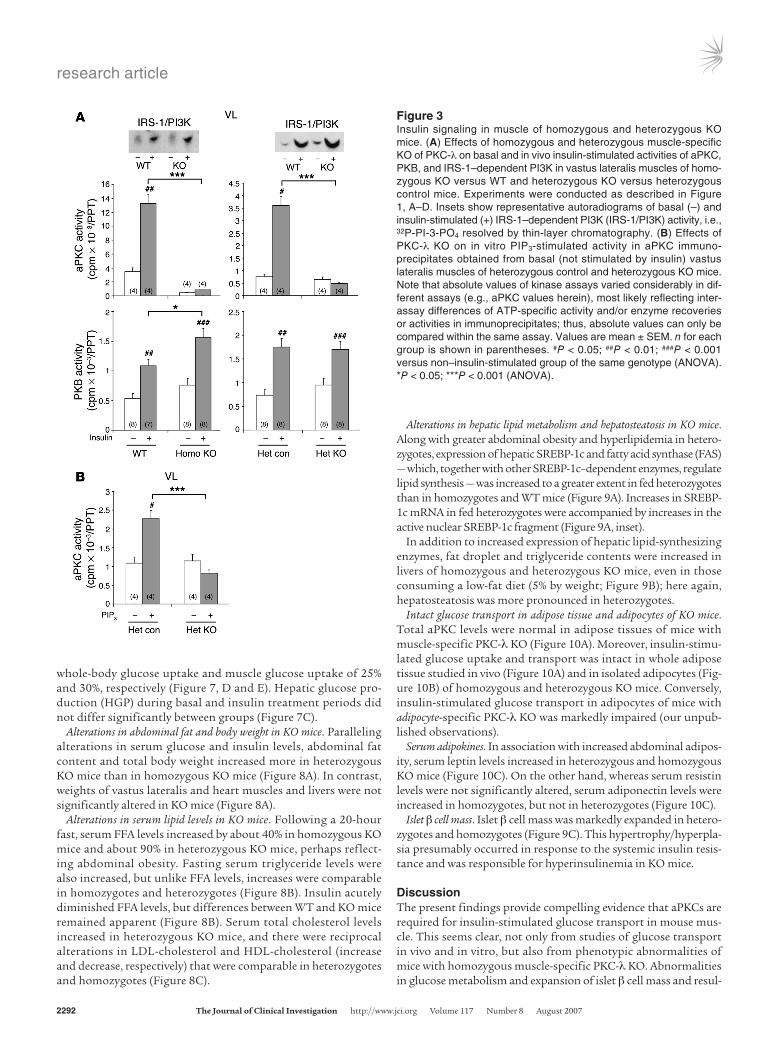
Activation of aPKC, PKB, and insulin receptor substrate 1–dependent PI3K in muscles of KO mice. Total immunoprecipitable aPKC (PKC-λ plus PKC-ζ) activity was markedly diminished in muscles of homozygous and heterozygous KO mice (Figure 3A). Although we were unable to separately measure PKC-λ and PKC-ζ activities,
Figure 1Effects of homozygous and heterozygous muscle-specific KO of PKC-λ on basal and insulin-stimulated glucose transport in vivo (A–D), glucose transport in vitro (E), and plasma membrane (PM) GLUT4 levels (F). Equal numbers of 5-month-old male and female mice were grouped (results were indistinguishable and therefore pooled), and after an overnight fast, glucose transport and GLUT4 translocation were measured. Glucose uptake was measured in vastus lateralis (VL) and heart muscle during 10 minutes insulin or vehicle treatment (A–D). (E) Glucose transport was measured in isolated extensor digitorum longus (EDL) and soleus muscles obtained from male mice. (F) Vastus lateralis and gastrocnemius muscles were used to prepare plasma membranes. Values are mean ± SEM. n for each group is shown in parentheses. Insets show immuno-reactive levels of total cellular aPKC (A, B, and E) or plasma membrane and internal membrane (IM) GLUT4 levels or IGF1 receptor (IGF1R) and insulin receptor (InsR) β subunit levels as markers to show equal plasma membrane loading (F) in WT (Cre–loxP–/–), heterozygous KO (Cre+loxP+/–; Het KO), and homozygous KO (Cre+loxP+/+; Homo KO) groups. aPKC levels in muscles of heterozygous control (Cre–loxP+/–; Het con) and Cre control (Cre+loxP–/–; Cre con) mice were the same as in WT mice (not shown). *P < 0.05; **P < 0.01; ***P < 0.001.
research article
TheJournalofClinicalInvestigation http://www.jci.org Volume 117 Number 8 August 2007 2291
the low total aPKC activity presumably reflected the greater abun-dance of PKC-λ in mouse muscle (6). Lower-than-expected muscle aPKC activity in heterozygous KO mice may reflect poor aPKC responsiveness to phosphatidylinositol-3,4,5,-(PO4)3 (PIP3), which increased activity of aPKC immunoprecipitated from muscles of heterozygous control mice, but not heterozygous KO mice (Figure 3B). Such aPKC unresponsiveness to PIP3 also occurs in some insu-lin-resistant humans and rodents (e.g., refs. 18, 20, 23).
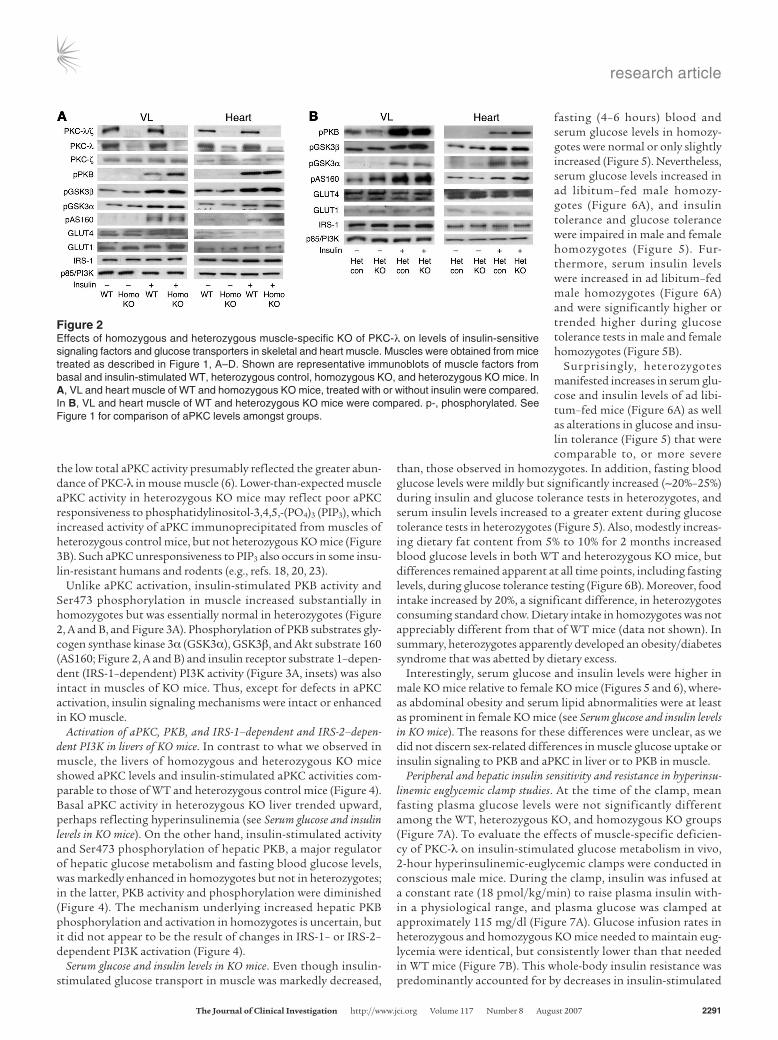
Unlike aPKC activation, insulin-stimulated PKB activity and Ser473 phosphorylation in muscle increased substantially in homozygotes but was essentially normal in heterozygotes (Figure 2, A and B, and Figure 3A). Phosphorylation of PKB substrates gly-cogen synthase kinase 3α (GSK3α), GSK3β, and Akt substrate 160 (AS160; Figure 2, A and B) and insulin receptor substrate 1–depen-dent (IRS-1–dependent) PI3K activity (Figure 3A, insets) was also intact in muscles of KO mice. Thus, except for defects in aPKC activation, insulin signaling mechanisms were intact or enhanced in KO muscle.
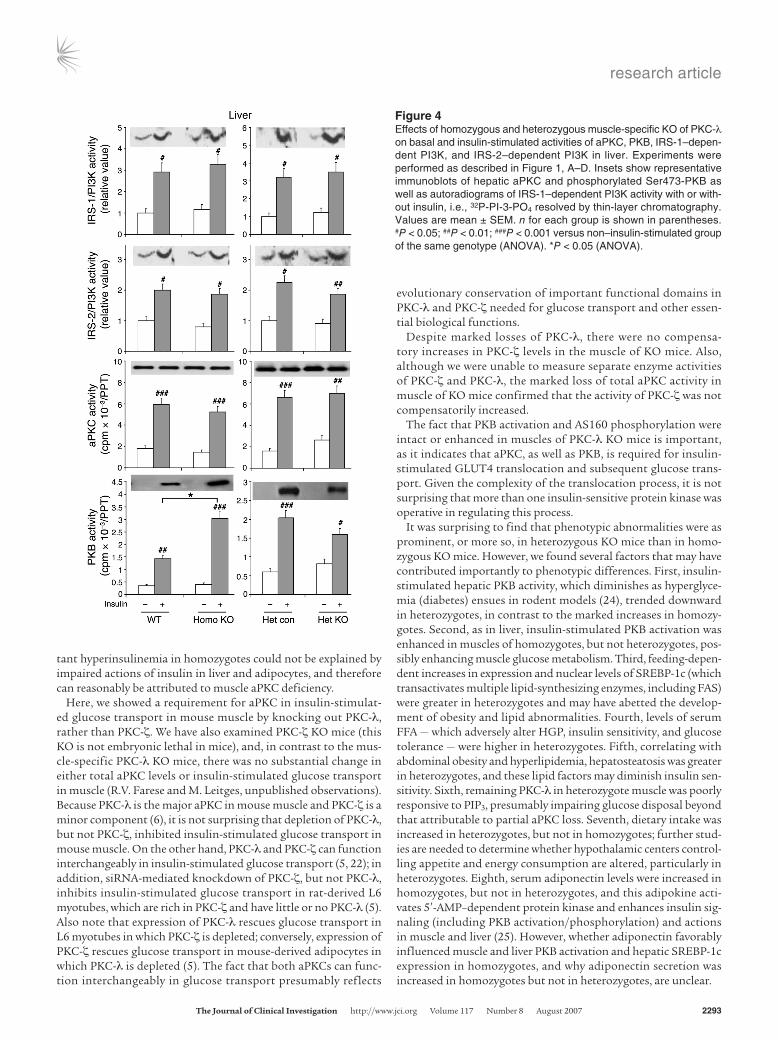
Activation of aPKC, PKB, and IRS-1–dependent and IRS-2–depen-dent PI3K in livers of KO mice. In contrast to what we observed in muscle, the livers of homozygous and heterozygous KO mice showed aPKC levels and insulin-stimulated aPKC activities com-parable to those of WT and heterozygous control mice (Figure 4). Basal aPKC activity in heterozygous KO liver trended upward, perhaps reflecting hyperinsulinemia (see Serum glucose and insulin levels in KO mice). On the other hand, insulin-stimulated activity and Ser473 phosphorylation of hepatic PKB, a major regulator of hepatic glucose metabolism and fasting blood glucose levels, was markedly enhanced in homozygotes but not in heterozygotes; in the latter, PKB activity and phosphorylation were diminished (Figure 4). The mechanism underlying increased hepatic PKB phosphorylation and activation in homozygotes is uncertain, but it did not appear to be the result of changes in IRS-1– or IRS-2– dependent PI3K activation (Figure 4).
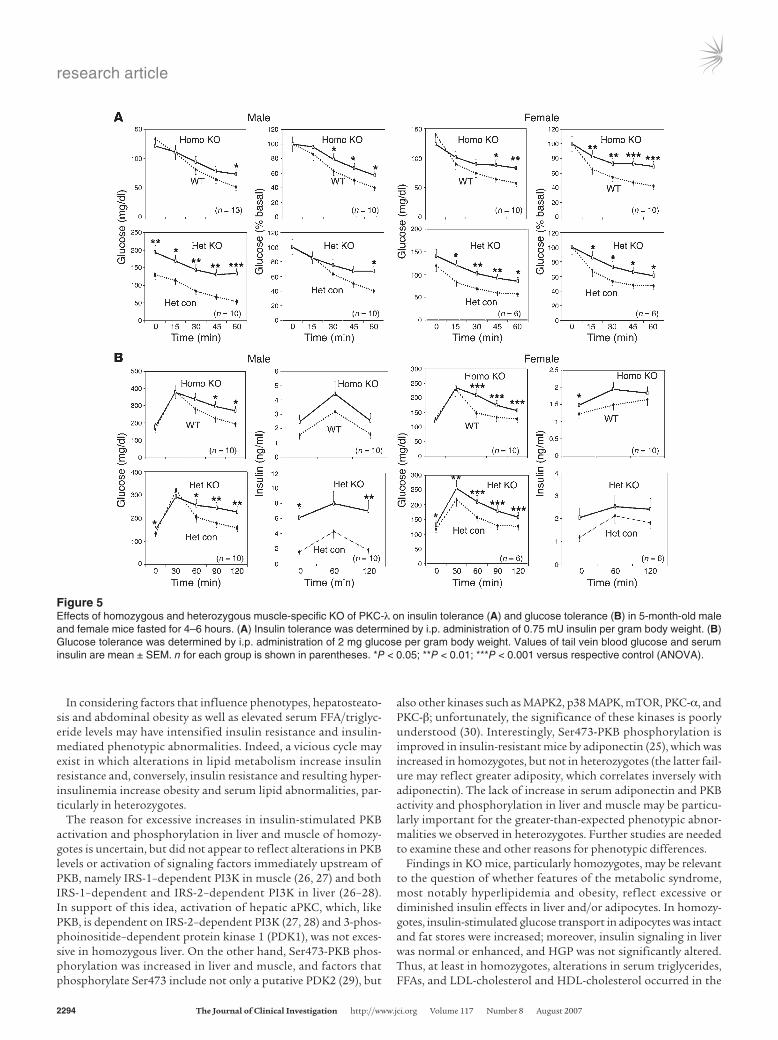
Serum glucose and insulin levels in KO mice. Even though insulin-stimulated glucose transport in muscle was markedly decreased,
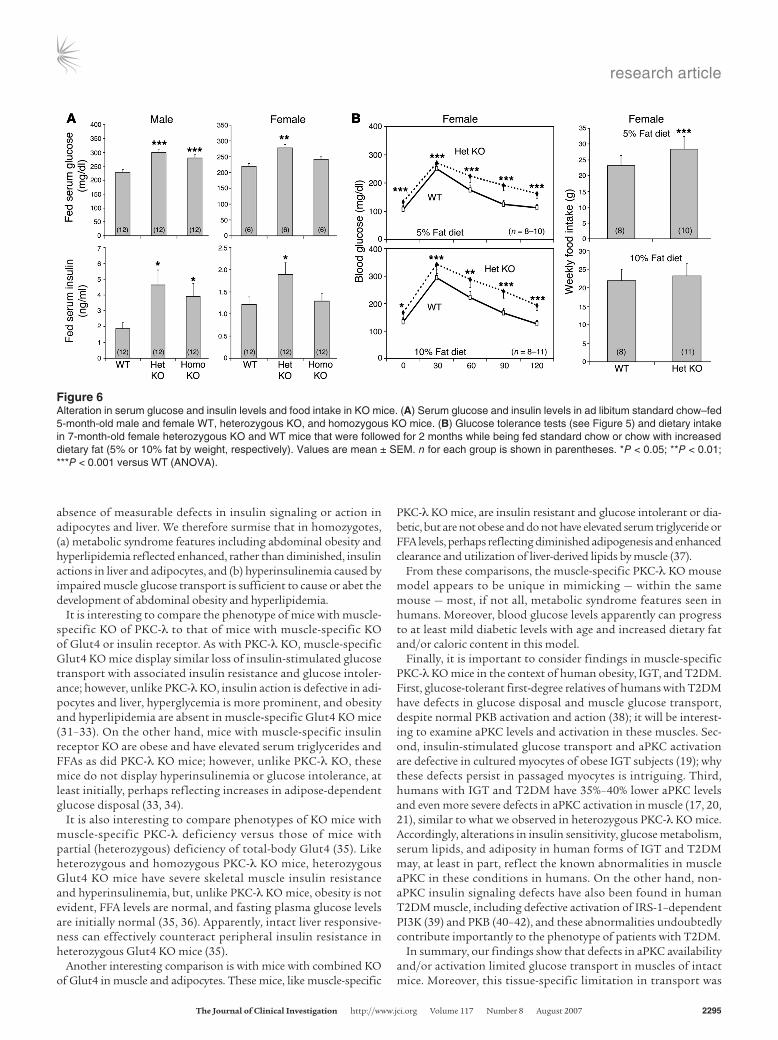
fasting (4–6 hours) blood and serum glucose levels in homozy-gotes were normal or only slightly increased (Figure 5). Nevertheless, serum glucose levels increased in ad libitum–fed male homozy-gotes (Figure 6A), and insulin tolerance and glucose tolerance were impaired in male and female homozygotes (Figure 5). Fur-thermore, serum insulin levels were increased in ad libitum–fed male homozygotes (Figure 6A) and were significantly higher or trended higher during glucose tolerance tests in male and female homozygotes (Figure 5B).
Surprisingly, heterozygotes manifested increases in serum glu-cose and insulin levels of ad libi-tum–fed mice (Figure 6A) as well as alterations in glucose and insu-lin tolerance (Figure 5) that were comparable to, or more severe
than, those observed in homozygotes. In addition, fasting blood glucose levels were mildly but significantly increased (~20%–25%) during insulin and glucose tolerance tests in heterozygotes, and serum insulin levels increased to a greater extent during glucose tolerance tests in heterozygotes (Figure 5). Also, modestly increas-ing dietary fat content from 5% to 10% for 2 months increased blood glucose levels in both WT and heterozygous KO mice, but differences remained apparent at all time points, including fasting levels, during glucose tolerance testing (Figure 6B). Moreover, food intake increased by 20%, a significant difference, in heterozygotes consuming standard chow. Dietary intake in homozygotes was not appreciably different from that of WT mice (data not shown). In summary, heterozygotes apparently developed an obesity/diabetes syndrome that was abetted by dietary excess.
Interestingly, serum glucose and insulin levels were higher in male KO mice relative to female KO mice (Figures 5 and 6), where-as abdominal obesity and serum lipid abnormalities were at least as prominent in female KO mice (see Serum glucose and insulin levels in KO mice). The reasons for these differences were unclear, as we did not discern sex-related differences in muscle glucose uptake or insulin signaling to PKB and aPKC in liver or to PKB in muscle.
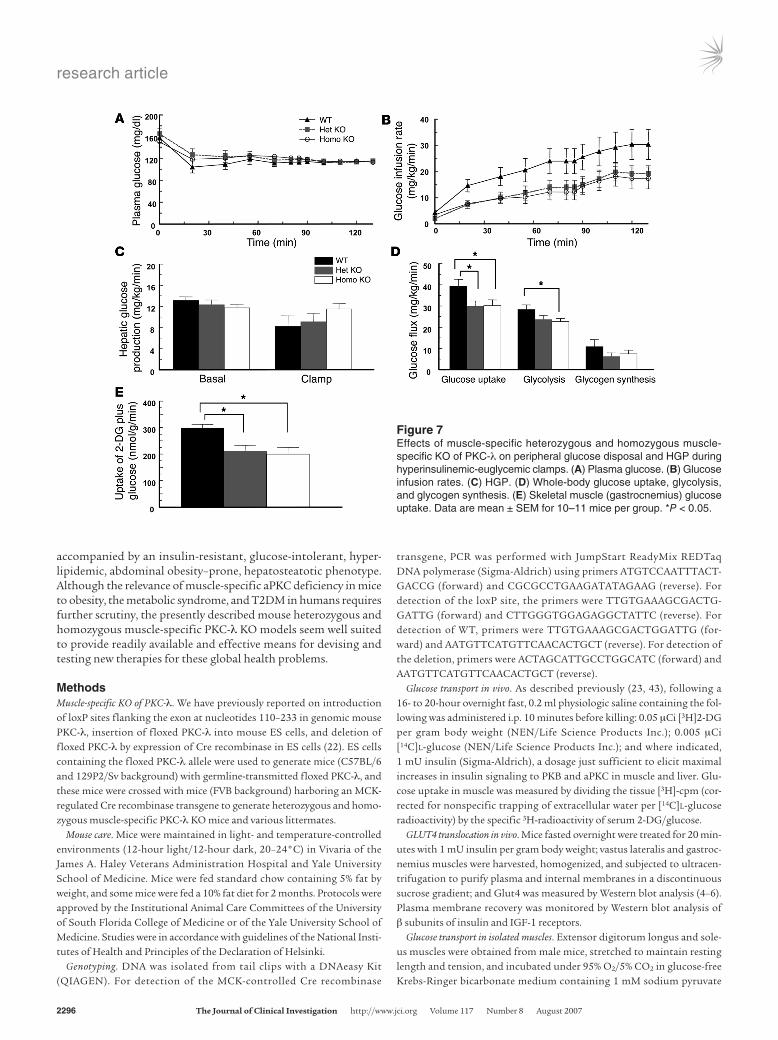
Peripheral and hepatic insulin sensitivity and resistance in hyperinsu-linemic euglycemic clamp studies. At the time of the clamp, mean fasting plasma glucose levels were not significantly different among the WT, heterozygous KO, and homozygous KO groups (Figure 7A). To evaluate the effects of muscle-specific deficien-cy of PKC-λ on insulin-stimulated glucose metabolism in vivo, 2-hour hyperinsulinemic-euglycemic clamps were conducted in conscious male mice. During the clamp, insulin was infused at a constant rate (18 pmol/kg/min) to raise plasma insulin with-in a physiological range, and plasma glucose was clamped at approximately 115 mg/dl (Figure 7A). Glucose infusion rates in heterozygous and homozygous KO mice needed to maintain eug-lycemia were identical, but consistently lower than that needed in WT mice (Figure 7B). This whole-body insulin resistance was predominantly accounted for by decreases in insulin-stimulated
Figure 2Effects of homozygous and heterozygous muscle-specific KO of PKC-λ on levels of insulin-sensitive signaling factors and glucose transporters in skeletal and heart muscle. Muscles were obtained from mice treated as described in Figure 1, A–D. Shown are representative immunoblots of muscle factors from basal and insulin-stimulated WT, heterozygous control, homozygous KO, and heterozygous KO mice. In A, VL and heart muscle of WT and homozygous KO mice, treated with or without insulin were compared. In B, VL and heart muscle of WT and heterozygous KO mice were compared. p-, phosphorylated. See Figure 1 for comparison of aPKC levels amongst groups.
research article
2292 TheJournalofClinicalInvestigation http://www.jci.org Volume 117 Number 8 August 2007
whole-body glucose uptake and muscle glucose uptake of 25% and 30%, respectively (Figure 7, D and E). Hepatic glucose pro-duction (HGP) during basal and insulin treatment periods did not differ significantly between groups (Figure 7C).
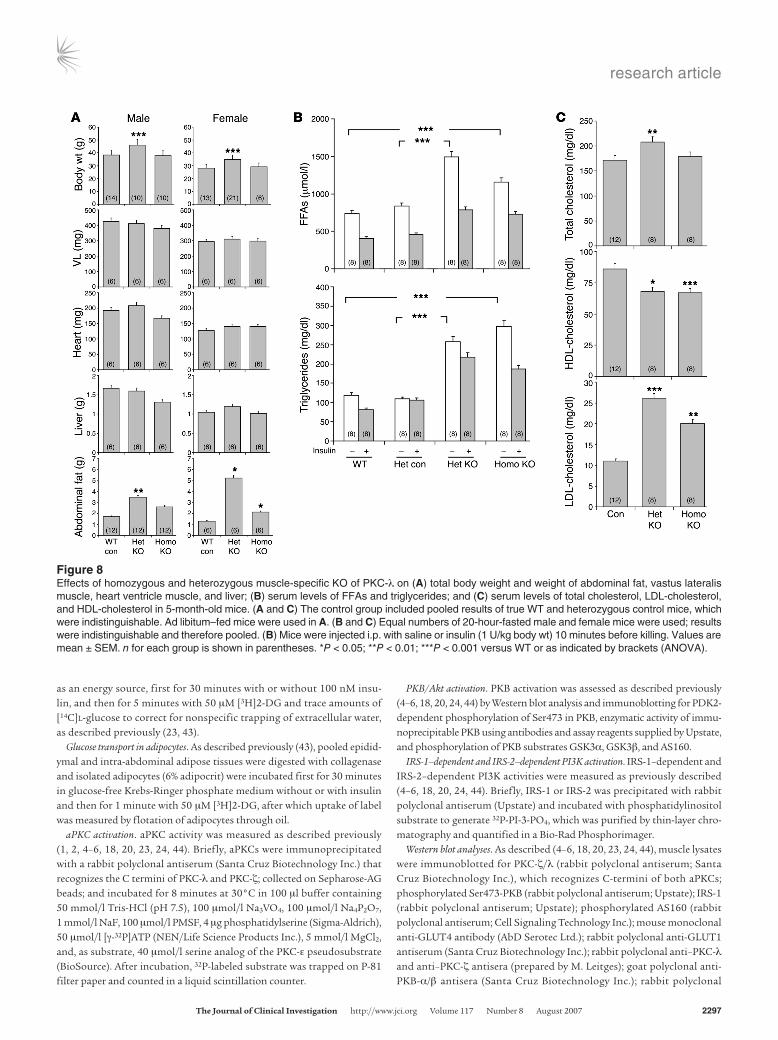
Alterations in abdominal fat and body weight in KO mice. Paralleling alterations in serum glucose and insulin levels, abdominal fat content and total body weight increased more in heterozygous KO mice than in homozygous KO mice (Figure 8A). In contrast, weights of vastus lateralis and heart muscles and livers were not significantly altered in KO mice (Figure 8A).
Alterations in serum lipid levels in KO mice. Following a 20-hour fast, serum FFA levels increased by about 40% in homozygous KO mice and about 90% in heterozygous KO mice, perhaps reflect-ing abdominal obesity. Fasting serum triglyceride levels were also increased, but unlike FFA levels, increases were comparable in homozygotes and heterozygotes (Figure 8B). Insulin acutely diminished FFA levels, but differences between WT and KO mice remained apparent (Figure 8B). Serum total cholesterol levels increased in heterozygous KO mice, and there were reciprocal alterations in LDL-cholesterol and HDL-cholesterol (increase and decrease, respectively) that were comparable in heterozygotes and homozygotes (Figure 8C).
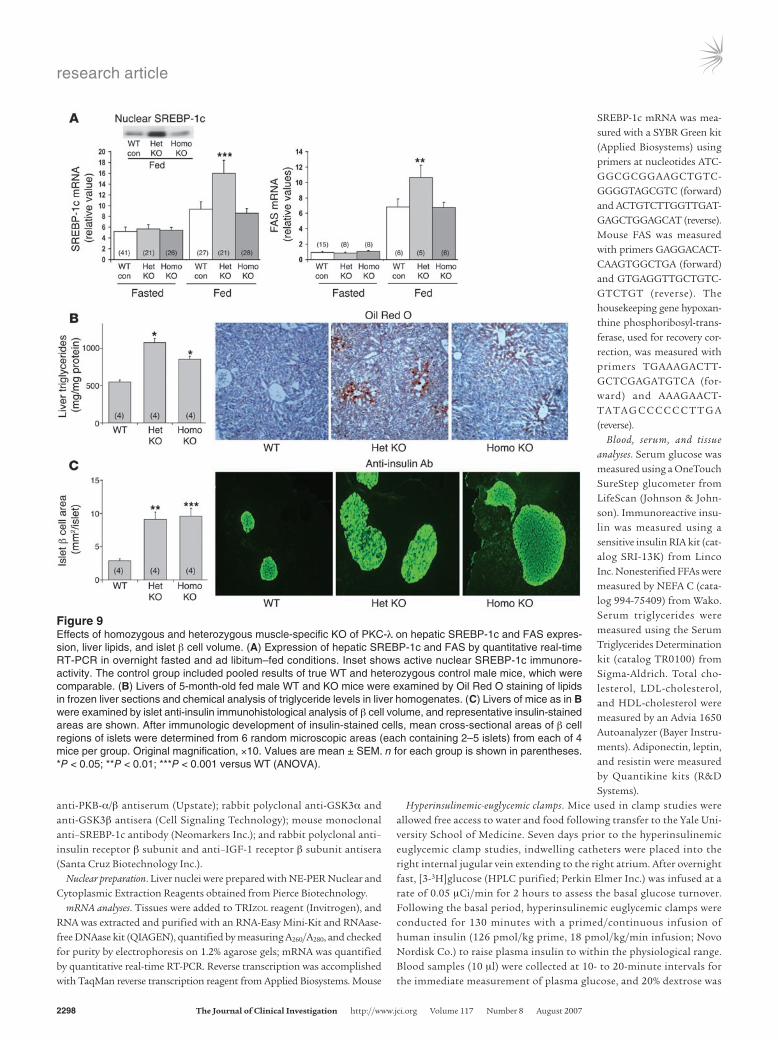
Alterations in hepatic lipid metabolism and hepatosteatosis in KO mice. Along with greater abdominal obesity and hyperlipidemia in hetero-zygotes, expression of hepatic SREBP-1c and fatty acid synthase (FAS) — which, together with other SREBP-1c–dependent enzymes, regulate lipid synthesis — was increased to a greater extent in fed heterozygotes than in homozygotes and WT mice (Figure 9A). Increases in SREBP-1c mRNA in fed heterozygotes were accompanied by increases in the active nuclear SREBP-1c fragment (Figure 9A, inset).
In addition to increased expression of hepatic lipid-synthesizing enzymes, fat droplet and triglyceride contents were increased in livers of homozygous and heterozygous KO mice, even in those consuming a low-fat diet (5% by weight; Figure 9B); here again, hepatosteatosis was more pronounced in heterozygotes.
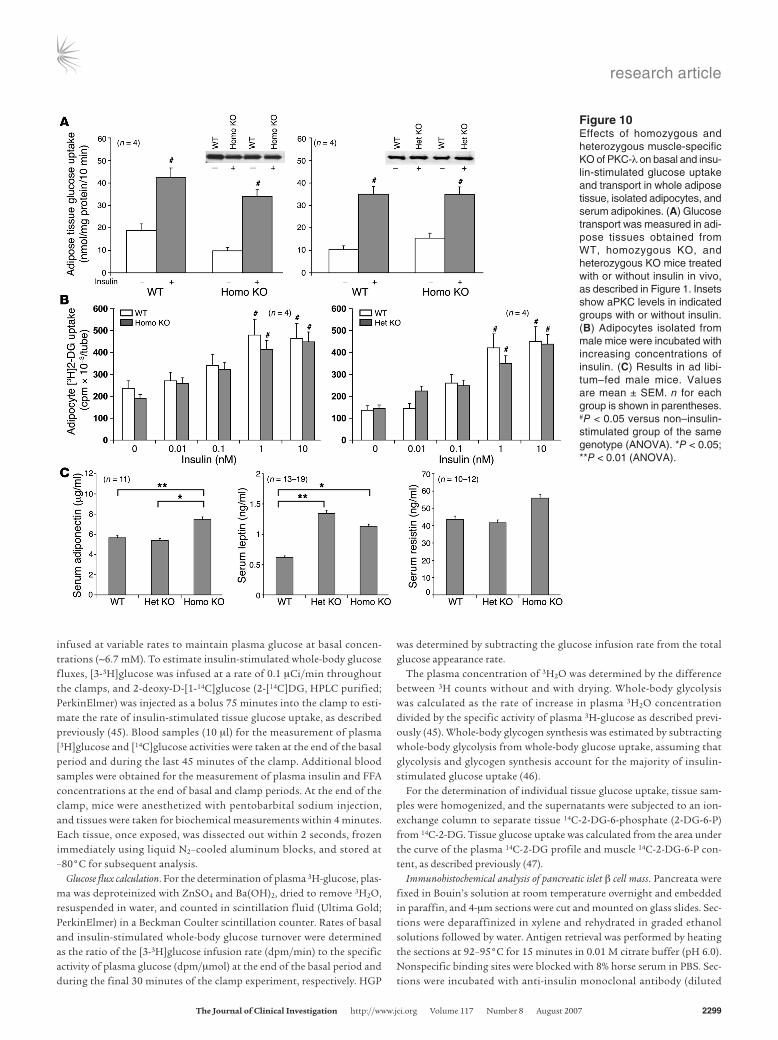
Intact glucose transport in adipose tissue and adipocytes of KO mice. Total aPKC levels were normal in adipose tissues of mice with muscle-specific PKC-λ KO (Figure 10A). Moreover, insulin-stimu-lated glucose uptake and transport was intact in whole adipose tissue studied in vivo (Figure 10A) and in isolated adipocytes (Fig-ure 10B) of homozygous and heterozygous KO mice. Conversely, insulin-stimulated glucose transport in adipocytes of mice with adipocyte-specific PKC-λ KO was markedly impaired (our unpub-lished observations).
Serum adipokines. In association with increased abdominal adipos-ity, serum leptin levels increased in heterozygous and homozygous KO mice (Figure 10C). On the other hand, whereas serum resistin levels were not significantly altered, serum adiponectin levels were increased in homozygotes, but not in heterozygotes (Figure 10C).
Islet β cell mass. Islet β cell mass was markedly expanded in hetero-zygotes and homozygotes (Figure 9C). This hypertrophy/hyperpla-sia presumably occurred in response to the systemic insulin resis-tance and was responsible for hyperinsulinemia in KO mice.
DiscussionThe present findings provide compelling evidence that aPKCs are required for insulin-stimulated glucose transport in mouse mus-cle. This seems clear, not only from studies of glucose transport in vivo and in vitro, but also from phenotypic abnormalities of mice with homozygous muscle-specific PKC-λ KO. Abnormalities in glucose metabolism and expansion of islet β cell mass and resul-
Figure 3Insulin signaling in muscle of homozygous and heterozygous KO mice. (A) Effects of homozygous and heterozygous muscle-specific KO of PKC-λ on basal and in vivo insulin-stimulated activities of aPKC, PKB, and IRS-1–dependent PI3K in vastus lateralis muscles of homo-zygous KO versus WT and heterozygous KO versus heterozygous control mice. Experiments were conducted as described in Figure 1, A–D. Insets show representative autoradiograms of basal (–) and insulin-stimulated (+) IRS-1–dependent PI3K (IRS-1/PI3K) activity, i.e., 32P-PI-3-PO4 resolved by thin-layer chromatography. (B) Effects of PKC-λ KO on in vitro PIP3-stimulated activity in aPKC immuno-precipitates obtained from basal (not stimulated by insulin) vastus lateralis muscles of heterozygous control and heterozygous KO mice. Note that absolute values of kinase assays varied considerably in dif-ferent assays (e.g., aPKC values herein), most likely reflecting inter-assay differences of ATP-specific activity and/or enzyme recoveries or activities in immunoprecipitates; thus, absolute values can only be compared within the same assay. Values are mean ± SEM. n for each group is shown in parentheses. #P < 0.05; ##P < 0.01; ###P < 0.001 versus non–insulin-stimulated group of the same genotype (ANOVA). *P < 0.05; ***P < 0.001 (ANOVA).
research article
TheJournalofClinicalInvestigation http://www.jci.org Volume 117 Number 8 August 2007 2293
tant hyperinsulinemia in homozygotes could not be explained by impaired actions of insulin in liver and adipocytes, and therefore can reasonably be attributed to muscle aPKC deficiency.
Here, we showed a requirement for aPKC in insulin-stimulat-ed glucose transport in mouse muscle by knocking out PKC-λ, rather than PKC-ζ. We have also examined PKC-ζ KO mice (this KO is not embryonic lethal in mice), and, in contrast to the mus-cle-specific PKC-λ KO mice, there was no substantial change in either total aPKC levels or insulin-stimulated glucose transport in muscle (R.V. Farese and M. Leitges, unpublished observations). Because PKC-λ is the major aPKC in mouse muscle and PKC-ζ is a minor component (6), it is not surprising that depletion of PKC-λ, but not PKC-ζ, inhibited insulin-stimulated glucose transport in mouse muscle. On the other hand, PKC-λ and PKC-ζ can function interchangeably in insulin-stimulated glucose transport (5, 22); in addition, siRNA-mediated knockdown of PKC-ζ, but not PKC-λ, inhibits insulin-stimulated glucose transport in rat-derived L6 myotubes, which are rich in PKC-ζ and have little or no PKC-λ (5). Also note that expression of PKC-λ rescues glucose transport in L6 myotubes in which PKC-ζ is depleted; conversely, expression of PKC-ζ rescues glucose transport in mouse-derived adipocytes in which PKC-λ is depleted (5). The fact that both aPKCs can func-tion interchangeably in glucose transport presumably reflects
evolutionary conservation of important functional domains in PKC-λ and PKC-ζ needed for glucose transport and other essen-tial biological functions.
Despite marked losses of PKC-λ, there were no compensa-tory increases in PKC-ζ levels in the muscle of KO mice. Also, although we were unable to measure separate enzyme activities of PKC-ζ and PKC-λ, the marked loss of total aPKC activity in muscle of KO mice confirmed that the activity of PKC-ζ was not compensatorily increased.
The fact that PKB activation and AS160 phosphorylation were intact or enhanced in muscles of PKC-λ KO mice is important, as it indicates that aPKC, as well as PKB, is required for insulin-stimulated GLUT4 translocation and subsequent glucose trans-port. Given the complexity of the translocation process, it is not surprising that more than one insulin-sensitive protein kinase was operative in regulating this process.
It was surprising to find that phenotypic abnormalities were as prominent, or more so, in heterozygous KO mice than in homo-zygous KO mice. However, we found several factors that may have contributed importantly to phenotypic differences. First, insulin-stimulated hepatic PKB activity, which diminishes as hyperglyce-mia (diabetes) ensues in rodent models (24), trended downward in heterozygotes, in contrast to the marked increases in homozy-gotes. Second, as in liver, insulin-stimulated PKB activation was enhanced in muscles of homozygotes, but not heterozygotes, pos-sibly enhancing muscle glucose metabolism. Third, feeding-depen-dent increases in expression and nuclear levels of SREBP-1c (which transactivates multiple lipid-synthesizing enzymes, including FAS) were greater in heterozygotes and may have abetted the develop-ment of obesity and lipid abnormalities. Fourth, levels of serum FFA — which adversely alter HGP, insulin sensitivity, and glucose tolerance — were higher in heterozygotes. Fifth, correlating with abdominal obesity and hyperlipidemia, hepatosteatosis was greater in heterozygotes, and these lipid factors may diminish insulin sen-sitivity. Sixth, remaining PKC-λ in heterozygote muscle was poorly responsive to PIP3, presumably impairing glucose disposal beyond that attributable to partial aPKC loss. Seventh, dietary intake was increased in heterozygotes, but not in homozygotes; further stud-ies are needed to determine whether hypothalamic centers control-ling appetite and energy consumption are altered, particularly in heterozygotes. Eighth, serum adiponectin levels were increased in homozygotes, but not in heterozygotes, and this adipokine acti-vates 5′-AMP–dependent protein kinase and enhances insulin sig-naling (including PKB activation/phosphorylation) and actions in muscle and liver (25). However, whether adiponectin favorably influenced muscle and liver PKB activation and hepatic SREBP-1c expression in homozygotes, and why adiponectin secretion was increased in homozygotes but not in heterozygotes, are unclear.
Figure 4Effects of homozygous and heterozygous muscle-specific KO of PKC-λ on basal and insulin-stimulated activities of aPKC, PKB, IRS-1–depen-dent PI3K, and IRS-2–dependent PI3K in liver. Experiments were performed as described in Figure 1, A–D. Insets show representative immunoblots of hepatic aPKC and phosphorylated Ser473-PKB as well as autoradiograms of IRS-1–dependent PI3K activity with or with-out insulin, i.e., 32P-PI-3-PO4 resolved by thin-layer chromatography. Values are mean ± SEM. n for each group is shown in parentheses. #P < 0.05; ##P < 0.01; ###P < 0.001 versus non–insulin-stimulated group of the same genotype (ANOVA). *P < 0.05 (ANOVA).
research article
2294 TheJournalofClinicalInvestigation http://www.jci.org Volume 117 Number 8 August 2007
In considering factors that influence phenotypes, hepatosteato-sis and abdominal obesity as well as elevated serum FFA/triglyc-eride levels may have intensified insulin resistance and insulin-mediated phenotypic abnormalities. Indeed, a vicious cycle may exist in which alterations in lipid metabolism increase insulin resistance and, conversely, insulin resistance and resulting hyper-insulinemia increase obesity and serum lipid abnormalities, par-ticularly in heterozygotes.
The reason for excessive increases in insulin-stimulated PKB activation and phosphorylation in liver and muscle of homozy-gotes is uncertain, but did not appear to reflect alterations in PKB levels or activation of signaling factors immediately upstream of PKB, namely IRS-1–dependent PI3K in muscle (26, 27) and both IRS-1–dependent and IRS-2–dependent PI3K in liver (26–28). In support of this idea, activation of hepatic aPKC, which, like PKB, is dependent on IRS-2–dependent PI3K (27, 28) and 3-phos-phoinositide–dependent protein kinase 1 (PDK1), was not exces-sive in homozygous liver. On the other hand, Ser473-PKB phos-phorylation was increased in liver and muscle, and factors that phosphorylate Ser473 include not only a putative PDK2 (29), but
also other kinases such as MAPK2, p38 MAPK, mTOR, PKC-α, and PKC-β; unfortunately, the significance of these kinases is poorly understood (30). Interestingly, Ser473-PKB phosphorylation is improved in insulin-resistant mice by adiponectin (25), which was increased in homozygotes, but not in heterozygotes (the latter fail-ure may reflect greater adiposity, which correlates inversely with adiponectin). The lack of increase in serum adiponectin and PKB activity and phosphorylation in liver and muscle may be particu-larly important for the greater-than-expected phenotypic abnor-malities we observed in heterozygotes. Further studies are needed to examine these and other reasons for phenotypic differences.
Findings in KO mice, particularly homozygotes, may be relevant to the question of whether features of the metabolic syndrome, most notably hyperlipidemia and obesity, reflect excessive or diminished insulin effects in liver and/or adipocytes. In homozy-gotes, insulin-stimulated glucose transport in adipocytes was intact and fat stores were increased; moreover, insulin signaling in liver was normal or enhanced, and HGP was not significantly altered. Thus, at least in homozygotes, alterations in serum triglycerides, FFAs, and LDL-cholesterol and HDL-cholesterol occurred in the
Figure 5Effects of homozygous and heterozygous muscle-specific KO of PKC-λ on insulin tolerance (A) and glucose tolerance (B) in 5-month-old male and female mice fasted for 4–6 hours. (A) Insulin tolerance was determined by i.p. administration of 0.75 mU insulin per gram body weight. (B) Glucose tolerance was determined by i.p. administration of 2 mg glucose per gram body weight. Values of tail vein blood glucose and serum insulin are mean ± SEM. n for each group is shown in parentheses. *P < 0.05; **P < 0.01; ***P < 0.001 versus respective control (ANOVA).
research article
TheJournalofClinicalInvestigation http://www.jci.org Volume 117 Number 8 August 2007 2295
absence of measurable defects in insulin signaling or action in adipocytes and liver. We therefore surmise that in homozygotes, (a) metabolic syndrome features including abdominal obesity and hyperlipidemia reflected enhanced, rather than diminished, insulin actions in liver and adipocytes, and (b) hyperinsulinemia caused by impaired muscle glucose transport is sufficient to cause or abet the development of abdominal obesity and hyperlipidemia.
It is interesting to compare the phenotype of mice with muscle-specific KO of PKC-λ to that of mice with muscle-specific KO of Glut4 or insulin receptor. As with PKC-λ KO, muscle-specific Glut4 KO mice display similar loss of insulin-stimulated glucose transport with associated insulin resistance and glucose intoler-ance; however, unlike PKC-λ KO, insulin action is defective in adi-pocytes and liver, hyperglycemia is more prominent, and obesity and hyperlipidemia are absent in muscle-specific Glut4 KO mice (31–33). On the other hand, mice with muscle-specific insulin receptor KO are obese and have elevated serum triglycerides and FFAs as did PKC-λ KO mice; however, unlike PKC-λ KO, these mice do not display hyperinsulinemia or glucose intolerance, at least initially, perhaps reflecting increases in adipose-dependent glucose disposal (33, 34).
It is also interesting to compare phenotypes of KO mice with muscle-specific PKC-λ deficiency versus those of mice with partial (heterozygous) deficiency of total-body Glut4 (35). Like heterozygous and homozygous PKC-λ KO mice, heterozygous Glut4 KO mice have severe skeletal muscle insulin resistance and hyperinsulinemia, but, unlike PKC-λ KO mice, obesity is not evident, FFA levels are normal, and fasting plasma glucose levels are initially normal (35, 36). Apparently, intact liver responsive-ness can effectively counteract peripheral insulin resistance in heterozygous Glut4 KO mice (35).
Another interesting comparison is with mice with combined KO of Glut4 in muscle and adipocytes. These mice, like muscle-specific
PKC-λ KO mice, are insulin resistant and glucose intolerant or dia-betic, but are not obese and do not have elevated serum triglyceride or FFA levels, perhaps reflecting diminished adipogenesis and enhanced clearance and utilization of liver-derived lipids by muscle (37).
From these comparisons, the muscle-specific PKC-λ KO mouse model appears to be unique in mimicking — within the same mouse — most, if not all, metabolic syndrome features seen in humans. Moreover, blood glucose levels apparently can progress to at least mild diabetic levels with age and increased dietary fat and/or caloric content in this model.
Finally, it is important to consider findings in muscle-specific PKC-λ KO mice in the context of human obesity, IGT, and T2DM. First, glucose-tolerant first-degree relatives of humans with T2DM have defects in glucose disposal and muscle glucose transport, despite normal PKB activation and action (38); it will be interest-ing to examine aPKC levels and activation in these muscles. Sec-ond, insulin-stimulated glucose transport and aPKC activation are defective in cultured myocytes of obese IGT subjects (19); why these defects persist in passaged myocytes is intriguing. Third, humans with IGT and T2DM have 35%–40% lower aPKC levels and even more severe defects in aPKC activation in muscle (17, 20, 21), similar to what we observed in heterozygous PKC-λ KO mice. Accordingly, alterations in insulin sensitivity, glucose metabolism, serum lipids, and adiposity in human forms of IGT and T2DM may, at least in part, reflect the known abnormalities in muscle aPKC in these conditions in humans. On the other hand, non-aPKC insulin signaling defects have also been found in human T2DM muscle, including defective activation of IRS-1–dependent PI3K (39) and PKB (40–42), and these abnormalities undoubtedly contribute importantly to the phenotype of patients with T2DM.
In summary, our findings show that defects in aPKC availability and/or activation limited glucose transport in muscles of intact mice. Moreover, this tissue-specific limitation in transport was
Figure 6Alteration in serum glucose and insulin levels and food intake in KO mice. (A) Serum glucose and insulin levels in ad libitum standard chow–fed 5-month-old male and female WT, heterozygous KO, and homozygous KO mice. (B) Glucose tolerance tests (see Figure 5) and dietary intake in 7-month-old female heterozygous KO and WT mice that were followed for 2 months while being fed standard chow or chow with increased dietary fat (5% or 10% fat by weight, respectively). Values are mean ± SEM. n for each group is shown in parentheses. *P < 0.05; **P < 0.01; ***P < 0.001 versus WT (ANOVA).
research article
2296 TheJournalofClinicalInvestigation http://www.jci.org Volume 117 Number 8 August 2007
accompanied by an insulin-resistant, glucose-intolerant, hyper-lipidemic, abdominal obesity–prone, hepatosteatotic phenotype. Although the relevance of muscle-specific aPKC deficiency in mice to obesity, the metabolic syndrome, and T2DM in humans requires further scrutiny, the presently described mouse heterozygous and homozygous muscle-specific PKC-λ KO models seem well suited to provide readily available and effective means for devising and testing new therapies for these global health problems.
MethodsMuscle-specific KO of PKC-λ. We have previously reported on introduction of loxP sites flanking the exon at nucleotides 110–233 in genomic mouse PKC-λ, insertion of floxed PKC-λ into mouse ES cells, and deletion of floxed PKC-λ by expression of Cre recombinase in ES cells (22). ES cells containing the floxed PKC-λ allele were used to generate mice (C57BL/6 and 129P2/Sv background) with germline-transmitted floxed PKC-λ, and these mice were crossed with mice (FVB background) harboring an MCK-regulated Cre recombinase transgene to generate heterozygous and homo-zygous muscle-specific PKC-λ KO mice and various littermates.
Mouse care. Mice were maintained in light- and temperature-controlled environments (12-hour light/12-hour dark, 20–24°C) in Vivaria of the James A. Haley Veterans Administration Hospital and Yale University School of Medicine. Mice were fed standard chow containing 5% fat by weight, and some mice were fed a 10% fat diet for 2 months. Protocols were approved by the Institutional Animal Care Committees of the University of South Florida College of Medicine or of the Yale University School of Medicine. Studies were in accordance with guidelines of the National Insti-tutes of Health and Principles of the Declaration of Helsinki.
Genotyping. DNA was isolated from tail clips with a DNAeasy Kit (QIAGEN). For detection of the MCK-controlled Cre recombinase
transgene, PCR was performed with JumpStart ReadyMix REDTaq DNA polymerase (Sigma-Aldrich) using primers ATGTCCAATTTACT-GACCG (forward) and CGCGCCTGAAGATATAGAAG (reverse). For detection of the loxP site, the primers were TTGTGAAAGCGACTG-GATTG (forward) and CTTGGGTGGAGAGGCTATTC (reverse). For detection of WT, primers were TTGTGAAAGCGACTGGATTG (for-ward) and AATGTTCATGTTCAACACTGCT (reverse). For detection of the deletion, primers were ACTAGCATTGCCTGGCATC (forward) and AATGTTCATGTTCAACACTGCT (reverse).
Glucose transport in vivo. As described previously (23, 43), following a 16- to 20-hour overnight fast, 0.2 ml physiologic saline containing the fol-lowing was administered i.p. 10 minutes before killing: 0.05 μCi [3H]2-DG per gram body weight (NEN/Life Science Products Inc.); 0.005 μCi [14C]l-glucose (NEN/Life Science Products Inc.); and where indicated, 1 mU insulin (Sigma-Aldrich), a dosage just sufficient to elicit maximal increases in insulin signaling to PKB and aPKC in muscle and liver. Glu-cose uptake in muscle was measured by dividing the tissue [3H]-cpm (cor-rected for nonspecific trapping of extracellular water per [14C]l-glucose radioactivity) by the specific 3H-radioactivity of serum 2-DG/glucose.
GLUT4 translocation in vivo. Mice fasted overnight were treated for 20 min-utes with 1 mU insulin per gram body weight; vastus lateralis and gastroc-nemius muscles were harvested, homogenized, and subjected to ultracen-trifugation to purify plasma and internal membranes in a discontinuous sucrose gradient; and Glut4 was measured by Western blot analysis (4–6). Plasma membrane recovery was monitored by Western blot analysis of β subunits of insulin and IGF-1 receptors.
Glucose transport in isolated muscles. Extensor digitorum longus and sole-us muscles were obtained from male mice, stretched to maintain resting length and tension, and incubated under 95% O2/5% CO2 in glucose-free Krebs-Ringer bicarbonate medium containing 1 mM sodium pyruvate
Figure 7Effects of muscle-specific heterozygous and homozygous muscle-specific KO of PKC-λ on peripheral glucose disposal and HGP during hyperinsulinemic-euglycemic clamps. (A) Plasma glucose. (B) Glucose infusion rates. (C) HGP. (D) Whole-body glucose uptake, glycolysis, and glycogen synthesis. (E) Skeletal muscle (gastrocnemius) glucose uptake. Data are mean ± SEM for 10–11 mice per group. *P < 0.05.
research article
TheJournalofClinicalInvestigation http://www.jci.org Volume 117 Number 8 August 2007 2297
as an energy source, first for 30 minutes with or without 100 nM insu-lin, and then for 5 minutes with 50 μM [3H]2-DG and trace amounts of [14C]l-glucose to correct for nonspecific trapping of extracellular water, as described previously (23, 43).
Glucose transport in adipocytes. As described previously (43), pooled epidid-ymal and intra-abdominal adipose tissues were digested with collagenase and isolated adipocytes (6% adipocrit) were incubated first for 30 minutes in glucose-free Krebs-Ringer phosphate medium without or with insulin and then for 1 minute with 50 μM [3H]2-DG, after which uptake of label was measured by flotation of adipocytes through oil.
aPKC activation. aPKC activity was measured as described previously (1, 2, 4–6, 18, 20, 23, 24, 44). Briefly, aPKCs were immunoprecipitated with a rabbit polyclonal antiserum (Santa Cruz Biotechnology Inc.) that recognizes the C termini of PKC-λ and PKC-ζ; collected on Sepharose-AG beads; and incubated for 8 minutes at 30°C in 100 μl buffer containing 50 mmol/l Tris-HCl (pH 7.5), 100 μmol/l Na3VO4, 100 μmol/l Na4P2O7, 1 mmol/l NaF, 100 μmol/l PMSF, 4 μg phosphatidylserine (Sigma-Aldrich), 50 μmol/l [γ-32P]ATP (NEN/Life Science Products Inc.), 5 mmol/l MgCl2, and, as substrate, 40 μmol/l serine analog of the PKC-ε pseudosubstrate (BioSource). After incubation, 32P-labeled substrate was trapped on P-81 filter paper and counted in a liquid scintillation counter.
PKB/Akt activation. PKB activation was assessed as described previously (4–6, 18, 20, 24, 44) by Western blot analysis and immunoblotting for PDK2-dependent phosphorylation of Ser473 in PKB, enzymatic activity of immu-noprecipitable PKB using antibodies and assay reagents supplied by Upstate, and phosphorylation of PKB substrates GSK3α, GSK3β, and AS160.
IRS-1–dependent and IRS-2–dependent PI3K activation. IRS-1–dependent and IRS-2–dependent PI3K activities were measured as previously described (4–6, 18, 20, 24, 44). Briefly, IRS-1 or IRS-2 was precipitated with rabbit polyclonal antiserum (Upstate) and incubated with phosphatidylinositol substrate to generate 32P-PI-3-PO4, which was purified by thin-layer chro-matography and quantified in a Bio-Rad Phosphorimager.
Western blot analyses. As described (4–6, 18, 20, 23, 24, 44), muscle lysates were immunoblotted for PKC-ζ/λ (rabbit polyclonal antiserum; Santa Cruz Biotechnology Inc.), which recognizes C-termini of both aPKCs; phosphorylated Ser473-PKB (rabbit polyclonal antiserum; Upstate); IRS-1 (rabbit polyclonal antiserum; Upstate); phosphorylated AS160 (rabbit polyclonal antiserum; Cell Signaling Technology Inc.); mouse monoclonal anti-GLUT4 antibody (AbD Serotec Ltd.); rabbit polyclonal anti-GLUT1 antiserum (Santa Cruz Biotechnology Inc.); rabbit polyclonal anti–PKC-λ and anti–PKC-ζ antisera (prepared by M. Leitges); goat polyclonal anti-PKB-α/β antisera (Santa Cruz Biotechnology Inc.); rabbit polyclonal
Figure 8Effects of homozygous and heterozygous muscle-specific KO of PKC-λ on (A) total body weight and weight of abdominal fat, vastus lateralis muscle, heart ventricle muscle, and liver; (B) serum levels of FFAs and triglycerides; and (C) serum levels of total cholesterol, LDL-cholesterol, and HDL-cholesterol in 5-month-old mice. (A and C) The control group included pooled results of true WT and heterozygous control mice, which were indistinguishable. Ad libitum–fed mice were used in A. (B and C) Equal numbers of 20-hour-fasted male and female mice were used; results were indistinguishable and therefore pooled. (B) Mice were injected i.p. with saline or insulin (1 U/kg body wt) 10 minutes before killing. Values are mean ± SEM. n for each group is shown in parentheses. *P < 0.05; **P < 0.01; ***P < 0.001 versus WT or as indicated by brackets (ANOVA).
research article
2298 TheJournalofClinicalInvestigation http://www.jci.org Volume 117 Number 8 August 2007
anti-PKB-α/β antiserum (Upstate); rabbit polyclonal anti-GSK3α and anti-GSK3β antisera (Cell Signaling Technology); mouse monoclonal anti–SREBP-1c antibody (Neomarkers Inc.); and rabbit polyclonal anti–insulin receptor β subunit and anti–IGF-1 receptor β subunit antisera (Santa Cruz Biotechnology Inc.).
Nuclear preparation. Liver nuclei were prepared with NE-PER Nuclear and Cytoplasmic Extraction Reagents obtained from Pierce Biotechnology.
mRNA analyses. Tissues were added to TRIzol reagent (Invitrogen), and RNA was extracted and purified with an RNA-Easy Mini-Kit and RNAase-free DNAase kit (QIAGEN), quantified by measuring A260/A280, and checked for purity by electrophoresis on 1.2% agarose gels; mRNA was quantified by quantitative real-time RT-PCR. Reverse transcription was accomplished with TaqMan reverse transcription reagent from Applied Biosystems. Mouse
SREBP-1c mRNA was mea-sured with a SYBR Green kit (Applied Biosystems) using primers at nucleotides ATC-GGCGCGGAAGCTGTC-GGGGTAGCGTC (forward) and ACTGTCTTGGTTGAT-GAGCTGGAGCAT (reverse). Mouse FAS was measured with primers GAGGACACT-CAAGTGGCTGA (forward) and GTGAGGTTGCTGTC-GTCTGT (reverse). The housekeeping gene hypoxan-thine phosphoribosyl-trans-ferase, used for recovery cor-rection, was measured with primers TGAAAGACTT-GCTCGAGATGTCA (for-ward) and AAAGAACT-T A T A G C C C C C C T T G A (reverse).
Blood, serum, and tissue analyses. Serum glucose was measured using a OneTouch SureStep glucometer from LifeScan (Johnson & John-son). Immunoreactive insu-lin was measured using a sensitive insulin RIA kit (cat-alog SRI-13K) from Linco Inc. Nonesterified FFAs were measured by NEFA C (cata-log 994-75409) from Wako. Serum triglycerides were measured using the Serum Triglycerides Determination kit (catalog TR0100) from Sigma-Aldrich. Total cho-lesterol, LDL-cholesterol, and HDL-cholesterol were measured by an Advia 1650 Autoanalyzer (Bayer Instru-ments). Adiponectin, leptin, and resistin were measured by Quantikine kits (R&D Systems).
Hyperinsulinemic-euglycemic clamps. Mice used in clamp studies were allowed free access to water and food following transfer to the Yale Uni-versity School of Medicine. Seven days prior to the hyperinsulinemic euglycemic clamp studies, indwelling catheters were placed into the right internal jugular vein extending to the right atrium. After overnight fast, [3-3H]glucose (HPLC purified; Perkin Elmer Inc.) was infused at a rate of 0.05 μCi/min for 2 hours to assess the basal glucose turnover. Following the basal period, hyperinsulinemic euglycemic clamps were conducted for 130 minutes with a primed/continuous infusion of human insulin (126 pmol/kg prime, 18 pmol/kg/min infusion; Novo Nordisk Co.) to raise plasma insulin to within the physiological range. Blood samples (10 μl) were collected at 10- to 20-minute intervals for the immediate measurement of plasma glucose, and 20% dextrose was
Figure 9Effects of homozygous and heterozygous muscle-specific KO of PKC-λ on hepatic SREBP-1c and FAS expres-sion, liver lipids, and islet β cell volume. (A) Expression of hepatic SREBP-1c and FAS by quantitative real-time RT-PCR in overnight fasted and ad libitum–fed conditions. Inset shows active nuclear SREBP-1c immunore-activity. The control group included pooled results of true WT and heterozygous control male mice, which were comparable. (B) Livers of 5-month-old fed male WT and KO mice were examined by Oil Red O staining of lipids in frozen liver sections and chemical analysis of triglyceride levels in liver homogenates. (C) Livers of mice as in B were examined by islet anti-insulin immunohistological analysis of β cell volume, and representative insulin-stained areas are shown. After immunologic development of insulin-stained cells, mean cross-sectional areas of β cell regions of islets were determined from 6 random microscopic areas (each containing 2–5 islets) from each of 4 mice per group. Original magnification, ×10. Values are mean ± SEM. n for each group is shown in parentheses. *P < 0.05; **P < 0.01; ***P < 0.001 versus WT (ANOVA).
research article
TheJournalofClinicalInvestigation http://www.jci.org Volume 117 Number 8 August 2007 2299
infused at variable rates to maintain plasma glucose at basal concen-trations (~6.7 mM). To estimate insulin-stimulated whole-body glucose fluxes, [3-3H]glucose was infused at a rate of 0.1 μCi/min throughout the clamps, and 2-deoxy-D-[1-14C]glucose (2-[14C]DG, HPLC purified; PerkinElmer) was injected as a bolus 75 minutes into the clamp to esti-mate the rate of insulin-stimulated tissue glucose uptake, as described previously (45). Blood samples (10 μl) for the measurement of plasma [3H]glucose and [14C]glucose activities were taken at the end of the basal period and during the last 45 minutes of the clamp. Additional blood samples were obtained for the measurement of plasma insulin and FFA concentrations at the end of basal and clamp periods. At the end of the clamp, mice were anesthetized with pentobarbital sodium injection, and tissues were taken for biochemical measurements within 4 minutes. Each tissue, once exposed, was dissected out within 2 seconds, frozen immediately using liquid N2–cooled aluminum blocks, and stored at –80°C for subsequent analysis.
Glucose flux calculation. For the determination of plasma 3H-glucose, plas-ma was deproteinized with ZnSO4 and Ba(OH)2, dried to remove 3H2O, resuspended in water, and counted in scintillation fluid (Ultima Gold; PerkinElmer) in a Beckman Coulter scintillation counter. Rates of basal and insulin-stimulated whole-body glucose turnover were determined as the ratio of the [3-3H]glucose infusion rate (dpm/min) to the specific activity of plasma glucose (dpm/μmol) at the end of the basal period and during the final 30 minutes of the clamp experiment, respectively. HGP
was determined by subtracting the glucose infusion rate from the total glucose appearance rate.
The plasma concentration of 3H2O was determined by the difference between 3H counts without and with drying. Whole-body glycolysis was calculated as the rate of increase in plasma 3H2O concentration divided by the specific activity of plasma 3H-glucose as described previ-ously (45). Whole-body glycogen synthesis was estimated by subtracting whole-body glycolysis from whole-body glucose uptake, assuming that glycolysis and glycogen synthesis account for the majority of insulin-stimulated glucose uptake (46).
For the determination of individual tissue glucose uptake, tissue sam-ples were homogenized, and the supernatants were subjected to an ion-exchange column to separate tissue 14C-2-DG-6-phosphate (2-DG-6-P) from 14C-2-DG. Tissue glucose uptake was calculated from the area under the curve of the plasma 14C-2-DG profile and muscle 14C-2-DG-6-P con-tent, as described previously (47).
Immunohistochemical analysis of pancreatic islet β cell mass. Pancreata were fixed in Bouin’s solution at room temperature overnight and embedded in paraffin, and 4-μm sections were cut and mounted on glass slides. Sec-tions were deparaffinized in xylene and rehydrated in graded ethanol solutions followed by water. Antigen retrieval was performed by heating the sections at 92–95°C for 15 minutes in 0.01 M citrate buffer (pH 6.0). Nonspecific binding sites were blocked with 8% horse serum in PBS. Sec-tions were incubated with anti-insulin monoclonal antibody (diluted
Figure 10Effects of homozygous and heterozygous muscle-specific KO of PKC-λ on basal and insu-lin-stimulated glucose uptake and transport in whole adipose tissue, isolated adipocytes, and serum adipokines. (A) Glucose transport was measured in adi-pose tissues obtained from WT, homozygous KO, and heterozygous KO mice treated with or without insulin in vivo, as described in Figure 1. Insets show aPKC levels in indicated groups with or without insulin. (B) Adipocytes isolated from male mice were incubated with increasing concentrations of insulin. (C) Results in ad libi-tum–fed male mice. Values are mean ± SEM. n for each group is shown in parentheses. #P < 0.05 versus non–insulin-stimulated group of the same genotype (ANOVA). *P < 0.05; **P < 0.01 (ANOVA).
research article
2300 TheJournalofClinicalInvestigation http://www.jci.org Volume 117 Number 8 August 2007
1:5,000; Sigma-Aldrich) for 60 minutes at room temperature. Sections were washed in PBS and incubated with biotinylated goat anti-mouse IgG for 30 minutes at room temperature. Sections were washed in PBS, incubated with streptavidin–fluorescein isothiocyanate for 30 minutes at room temperature, and then washed with PBS. Coverslips were mounted with Vectashield (Vector Laboratories). A Nikon TE2000-U fluorescent microscope, a CCD camera (CoolSNAPES; Photometrics Inc.), and Image-Pro Express software (version 5.1; Media Cybernetics) were used to visual-ize and evaluate stained sections.
Statistics. Data are expressed as mean ± SEM. Statistical differences between 2 groups were determined by Student’s t test; differences between 3 or more groups were determined by ANOVA (Sigma-Aldrich). A P value less than 0.05 was considered significant.
AcknowledgmentsThis work was supported by funds from the Department of Vet-erans Affairs Merit Review Program, by NIH grants DK 38079 (to R.V. Farese) and DK 30136 (to C.R. Kahn), and by Deutsche Forsc-hungsgemeinschaft Sta314/2-1 and KE246/7-2 (to M. Leitges).
Received for publication January 4, 2007, and accepted in revised form May 8, 2007.
Address correspondence to: Robert V. Farese, ACOS-151, James A. Haley Veterans Hospital, 13000 Bruce B. Downs Blvd., Tampa, Florida 33612, USA. Phone: (813) 972-7662; Fax: (813) 972-7623; E-mail: [email protected].
1. Bandyopadhyay, G., et al. 2007. Activation of pro-tein kinase C (α, β and ζ) by insulin in 3T3/L1 cells. Transfection studies suggest a role for PKC-ζ in glucose transport. J. Biol. Chem. 272:2551–2558.
2. Standaert, M.L., et al. 1997. PKC-ζ as a downstream effector of PI 3-kinase during insulin stimulation in rat adipocytes. Potential role in glucose trans-port. J. Biol. Chem. 272:30075–30082.
3. Kotani, K., et al. 1998. Requirement of atypical protein kinase C lambda for insulin stimulation of glucose uptake but not for Akt activation in 3T3-L1 adipocytes. Mol. Cell. Biol. 18:6971–6982.
4. Bandyopadhyay, G., et al. 2002. PKC-ζ mediates insulin effects on glucose transport in cultured preadipocyte-derived human adipocytes. J. Clin. Endocrinol. Metab. 87:716–723.
5. Sajan, M.P., Standaert, M.L., and Farese, R.V. 2006. Repletion of atypical protein kinase C following RNAi-mediated depletion restores insulin-stimulated glucose transport. J. Biol. Chem. 281:17466–17473.
6. Bandyopadhyay, G., Kanoh, Y., Sajan, M.P., Stan-daert, M.L., and Farese, R.V. 2000. Effects of adenoviral gene transfer of wild-type, constitutively active, and kinase-defective protein kinase C-λ on insulin-stimulated glucose transport in L6 myo-tubes. Endocrinology. 141:4120–4127.
7. Condorelli, G., et al. 2001. Protein kinase C (PKC)-alpha activation inhibits PKC-zeta and mediates the action of PED/PEA-15 on glucose transport in the L6 skeletal muscle cells. Diabetes. 50:1244–1250.
8. Ugi, S., et al. 2004. Protein phosphatase 2A nega-tively regulates insulin’s metabolic signaling path-way by inhibiting Akt (protein kinase B) activity in 3T3-L1 adipocytes. Mol. Cell. Biol. 24:8778–8789.
9. Kohn, A.D., Summers, S.A., Birnbaum, M.J., and Roth, R.A. 1996. Expression of a constitutively active Akt Ser/Thr kinase in 3T3-L1 adipocytes stimulates glucose uptake and glucose transporter 4 translocation. J. Biol. Chem. 271:31372–31378.
10. Tanti, J., et al. 1997. Potential role of protein kinase B in glucose transporter 4 translocation in adipo-cytes. Endocrinology. 138:2005–2009.
11. Wang, Q., et al. 1999. Protein kinase B/Akt par-ticipates in GLUT4 translocation by insulin in L6 myoblasts. Mol. Cell. Biol. 19:4008–4018.
12. Hill, M.M., et al. 1999. A role for protein kinase Bbeta/Akt2 in insulin-stimulated GLUT4 translo-cation in adipocytes. Mol. Cell. Biol. 19:7771–7781.
13. Cho, H., Thorvaldsen, J.L., Chu, Q., Feng, F., and Birnbaum, M.J. 2001. Akt1/PKBalpha is required for normal growth but dispensable for mainte-nance of glucose homeostasis in mice. J. Biol. Chem. 276:38349–38352.
14. Cho, H., et al. 2001. Insulin resistance and a diabetes mellitus-like syndrome in mice lacking the protein kinase Akt2 (PKB beta). Science. 292:1728–1731.
15. Matsumoto, M., et al. 2003. PKCλ in liver medi-ates insulin-induced SREBP-1c expression and determines both hepatic lipid content and over-all insulin sensitivity. J. Clin. Invest. 112:935–944.
doi:10.1172/JCI200318816. 16. Hashimoto, N., et al. 2005. PKC regulates glucose-
induced insulin secretion through modulation of gene expression in pancreatic β cells. J. Clin. Invest. 115:138–145. doi:10.1172/JCI200522232.
17. Kim, Y.-B., Kotani, K., Ciaraldi, T.P., Henry, R.R., and Kahn, B.B. 2003. Insulin-stimulated protein kinase C lambda/zeta activity is reduced in skeletal muscle of humans with obesity and type 2 diabetes: reversal with weight reduction. Diabetes. 52:1935–1942.
18. Beeson, M., et al. 2004. Defective activation of protein kinase C-zeta in muscle by insulin and phosphatidylinositol-3,4,5-(PO4)3 in obesity and polycystic ovary syndrome. Metabolic Syndrome and Related Disorders. 2:49–56.
19. Vollenweider, P., Menard, B., and Nicod, P. 2002. Insulin resistance, defective insulin receptor sub-strate 2-associated phosphatidylinositol-3’ kinase activation, and impaired atypical protein kinase C (zeta/lambda) activation in myotubes from obese patients with impaired glucose tolerance Diabetes. 51:1052–1059.
20. Beeson, M., et al. 2003. Activation of protein kinase C-ζ by insulin and phosphatidylinositol-3,4,5-(PO4)3 is defective in muscle in type 2 diabetes and impaired glucose tolerance. Amelioration by rosi-glitazone and exercise. Diabetes. 52:1926–1934.
21. Bandopadhyay, G., Yu, J.G., Ofrecio, J., and Olefsky, J.M. 2005. Increased p85/55/50 expression and decreased phosphotidylinositol 3-kinase activity in insulin-resistant human skeletal muscle. Diabetes. 54:2351–2359.
22. Bandyopadhyay, G., et al. 2004. Protein kinase C-λ knockout in embryonic stem cells and adipocytes impairs insulin-stimulated glucose transport. Mol. Endocrinol. 18:373–383.
23. Kanoh, Y., et al. 2003. Defective activation of atypi-cal protein kinase C zeta and lambda by insulin and phosphatidylinositol-3,4,5-(PO4)3 in skel-etal muscles of rats following high-fat feeding and streptozotocin-induced diabetes. Endocrinology. 144:947–954.
24. Standaert, M.L., et al. 2004. Insulin-induced activa-tion of atypical protein kinase C, but not protein kinase B, is maintained in diabetic (ob/ob and Goto-Kakazaki) liver. Contrasting insulin signaling patterns in liver versus muscle define phenotypes of type 2 diabetic and high-fat-induced insulin-resistant states. J. Biol. Chem. 279:24929–24934.
25. Yamauchi, T., et al. 2001. The fat-derived hormone adiponectin reverses insulin resistance associ-ated with both lipoatrophy and obesity. Nat. Med. 7:941–946.
26. Ueki, K., et al. 2000. Restored insulin sensitivity in IRS-1–deficient mice treated by adenovirus-medi-ated gene therapy. J. Clin. Invest. 105:1437–1445.
27. Sajan, M.P., Standaert, M.L., Miura, A., Kahn, C.R., and Farese, R.V. 2004. Tissue-specific differences in activation of atypical protein kinase C and protein kinase B in muscle, liver, and adipocytes of insulin
receptor substrate-1 knockout mice. Mol. Endocri-nol. 18:2513–2521.
28. Valverde, A.M., et al. 2003. Molecular mechanisms of insulin resistance in IRS-2-deficient hepatocytes. Diabetes. 52:2239–2248.
29. Sarbassov, D.D., Guertin, D.A., Ali, S.M., and Saba-tini, D.M. 2005. Phosphorylation and regulation of Akt/PKB by the rictor-mTOR complex. Science. 307:1098–1101.
30. Dong, L.Q., and Liu, F. 2005. PDK2: the miss-ing piece in the receptor tyrosine kinase signal-ing pathway. Am. J. Physiol. Endocrinol. Metab. 289:E187–E196.
31. Zisman, A., et al. 2000. Targeted disruption of the glucose transporter 4 selectively in muscle causes insulin resistance and glucose intolerance. Nat. Med. 6:924–928.
32. Kim, J.K., et al. 2001. Glucose toxicity and the devel-opment of diabetes in mice with muscle-specific inactivation of GLUT4. J. Clin. Invest. 108:153–160. doi:10.1172/JCI200110294.
33. Minokoshi, Y., Kahn, C.R., and Kahn, B.B. 2003. Tissue-specific ablation of the GLUT4 glucose transporter or the insulin receptor challenges assumptions about insulin action and glucose homeostasis. J. Biol. Chem. 278:33609–33612.
34. Bruning, J.C., et al. 1998. A muscle-specific insulin receptor knockout exhibits features of the meta-bolic syndrome of NIDDM without altering glu-cose tolerance. Mol. Cell. 2:559–569.
35. Rossetti, L., et al. 1997. Peripheral but not hepatic insulin resistance in mice with one disrupted allele of the glucose transporter type 4 (GLUT4) gene. J. Clin. Invest. 100:1831–1839.
36. Li, J., Houseknecht, K.L., Steinbit, A.E., Katz, E.B., and Charron, M.J. 2000. Reduced glucose uptake precedes insulin signaling defects in adipocytes from heterozygous GLUT4 knockout mice. FASEB J. 14:1117–1125.
37. Kotani, K., Peroni, O.D., Minokoshi, Y., Boss, O., and Kahn, B.B. 2004. GLUT4 glucose transporter defi-ciency increases hepatic lipid production and periph-eral lipid utilization. J. Clin. Invest. 114:1666–1676. doi:10.1172/JCI200421341.
38. Karlsson, H.K.R., Ahlsen, M., Zierath, J.R., Wall-berg-Nenriksson, H., and Koistenin, H.A. 2006. Insulin signaling and glucose transport in skeletal muscle from first-degree relatives of type 2 diabetic patients. Diabetes. 55:1283–1288.
39. Bjornholm, M., Kawano, Y., Lehtihet, M., and Zier-ath, J.R. 1997. Insulin receptor substrate-1 phosphor-ylation and phosphatidylinositol 3-kinase activity in skeletal muscle from NIDDM subjects after in vivo insulin stimulation. Diabetes. 46:524–527.
40. Brozinick, J.T., Roberts, B.R., and Dohm, D.L. 2003. Defective signaling through Akt-2 and -3 but not Akt-1 is reduced in insulin-resistant skeletal mus-cle. Diabetes. 52:935–941.
41. Krook, A., Roth, R.A., Jiang, X.J., and Zierath, J.R. 1998. Insulin-stimulated Akt activity is reduced in
research article
TheJournalofClinicalInvestigation http://www.jci.org Volume 117 Number 8 August 2007 2301
skeletal muscle from NIDDM subjects. Diabetes. 47:1281–1286.
42. Karlsson, H.K.R., et al. 2005. Insulin-stimulated phosphorylation of the Akt substrate AS160 is impaired in skeletal muscle of type 2 diabetic sub-jects. Diabetes. 54:1692–1697.
43. Standaert, M.L., et al. 1999. Effects of knockout of the protein kinase C beta gene on glucose transport and glucose homeostasis. Endocrinology.
140:4470–4477. 44. Casaubon, L., et al. 2006. Contrasting insulin dose-
dependent defects in activation of atypical protein kinase C and protein kinase B/Akt in muscles of obese diabetic humans. Diabetologia. 49:3000–3008.
45. Samuel, V.T., et al. 2006. Targeting foxo1 in mice using antisense oligonucleotide improves hepatic and peripheral insulin action. Diabetes. 55:2042–2050.
46. Rossetti, L., and Giaccari, A. 1990. Relative con-tribution of glycogen synthesis and glycolysis to insulin-mediated glucose uptake. A dose-response euglycemic clamp study in normal and diabetic rats. J. Clin. Invest. 85:1785–1792.
47. Youn, J.H., and Buchanan, T.A. 1993. Fasting does not impair insulin-stimulated glucose uptake but alters intracellular glucose metabolism in con-scious rats. Diabetes. 42:757–763.