THE 4.5 μm FULL-ORBIT PHASE CURVE OF THE HOT …showman/publications/zellem-etal-2014.pdf · the...
9
The Astrophysical Journal, 790:53 (9pp), 2014 July 20 doi:10.1088/0004-637X/790/1/53 C 2014. The American Astronomical Society. All rights reserved. Printed in the U.S.A. THE 4.5 μm FULL-ORBIT PHASE CURVE OF THE HOT JUPITER HD 209458b Robert T. Zellem 1 , Nikole K. Lewis 2 ,11 , Heather A. Knutson 3 , Caitlin A. Griffith 1 , Adam P. Showman 1 , Jonathan J. Fortney 4 , Nicolas B. Cowan 5 , Eric Agol 6 , Adam Burrows 7 , David Charbonneau 8 , Drake Deming 9 , Gregory Laughlin 4 , and Jonathan Langton 10 1 Lunar and Planetary Laboratory, University of Arizona, 1629 East University Boulevard, Tucson, AZ 85721, USA; [email protected] 2 Department of Earth, Atmospheric and Planetary Sciences, Massachusetts Institute of Technology, 77 Massachusetts Avenue, Cambridge, MA 02139, USA 3 Division of Geological and Planetary Sciences, MC 170-25 1200 East California Boulevard, Pasadena, CA 91125, USA 4 Department of Astronomy and Astrophysics, University of California, Santa Cruz, 1156 High Street, Santa Cruz, CA 95064, USA 5 Department of Earth and Planetary Sciences, Northwestern University, Technological Institute, 2145 Sheridan Road, Evanston, IL 60208, USA 6 Astronomy Department, University of Washington, Physics-Astronomy Building, 3910 15th Avenue NE, Seattle, WA 98195, USA 7 Department of Astrophysical Sciences, Princeton University, 4 Ivy Lane, Peyton Hall, Princeton University, Princeton, NJ 08544, USA 8 Harvard-Smithsonian Center for Astrophysics, 60 Garden Street MS-16, Cambridge, MA 02138, USA 9 Department of Astronomy, University of Maryland, College Park, MD 20742, USA 10 Physics Department, Principia College, 1 Maybeck Place, Elsah, IL 62028, USA Received 2014 March 20; accepted 2014 June 2; published 2014 July 2 ABSTRACT The hot Jupiter HD 209458b is particularly amenable to detailed study as it is among the brightest transiting exoplanet systems currently known (V-mag = 7.65; K-mag = 6.308) and has a large planet-to-star contrast ratio. HD 209458b is predicted to be in synchronous rotation about its host star with a hot spot that is shifted eastward of the substellar point by superrotating equatorial winds. Here we present the first full-orbit observations of HD 209458b, in which its 4.5 μm emission was recorded with Spitzer/IRAC. Our study revises the previous 4.5 μm measurement of HD 209458b’s secondary eclipse emission downward by ∼35% to 0.1391% +0.0072% −0.0069% , changing our interpretation of the properties of its dayside atmosphere. We find that the hot spot on the planet’s dayside is shifted eastward of the substellar point by 40. ◦ 9 ± 6. ◦ 0, in agreement with circulation models predicting equatorial superrotation. HD 209458b’s dayside (T bright = 1499 ± 15 K) and nightside (T bright = 972 ± 44 K) emission indicate a day-to- night brightness temperature contrast smaller than that observed for more highly irradiated exoplanets, suggesting that the day-to-night temperature contrast may be partially a function of the incident stellar radiation. The observed phase curve shape deviates modestly from global circulation model predictions potentially due to disequilibrium chemistry or deficiencies in the current hot CH 4 line lists used in these models. Observations of the phase curve at additional wavelengths are needed in order to determine the possible presence and spatial extent of a dayside temperature inversion, as well as to improve our overall understanding of this planet’s atmospheric circulation. Key words: atmospheric effects – methods: numerical – planets and satellites: general – planets and satellites: individual (HD 209458b) – techniques: photometric Online-only material: color figures, machine-readable table 1. INTRODUCTION Of the more than 1100 transiting exoplanets discovered to date, over 150 are gas giant planets known as “hot Jupiters” that have near-Jupiter masses (0.5 M Jupiter M 5 M Jupiter ) and that orbit very close to their host stars (semi-major axis a 0.1 AU). These transiting exoplanets are predicted to be tidally locked (e.g., MacDonald 1964; Peale 1974) so that one hemisphere always points toward its host star while the other is in perpetual night. The resulting day-to-night temperature contrast is predicted to drive fast ∼1 km s −1 winds, which transfer heat from the dayside to the nightside hemisphere thereby shifting the substellar hotspot and decreasing the day- to-night temperature contrast (e.g., Showman & Guillot 2002; Cooper & Showman 2005, 2006; Showman 2008; Showman et al. 2008b, 2009; Langton & Laughlin 2007, 2008; Dobbs- Dixon & Lin 2008). One of the best methods to directly constrain the nature of the atmospheric circulation patterns on these planets is to continuously monitor their infrared (IR) emission to character- ize the full-orbit phase curve. Such observations yield longi- tudinal disk variations, which can then be transformed into a 11 Sagan Fellow. longitudinal temperature profile (Cowan & Agol 2008) to mea- sure the redistribution of heat. The Spitzer Space Telescope is the only platform currently capable of making mid- to far-IR full-orbit observations due to its stability, continuous viewing capability, and access to longer wavelengths than the Hubble Space Telescope (Harrington et al. 2006; Cowan et al. 2007, 2012; Knutson et al. 2007, 2012; Lewis et al. 2013; Maxted et al. 2013). In this paper, we present new phase curve observations of the hot Jupiter HD 209458b, which has a particularly favorable planet–star radius ratio (R p /R s = 0.12086 ± 0.00010; Torres et al. 2008) and orbits a bright star (V-mag = 7.65; K-mag = 6.308). HD 209458 is a relatively quiet G-type star (e.g., Charbonneau et al. 2000; Knutson et al. 2010), which has been shown to vary by less than ∼0.002 mag at visible wavelengths over a period of 58 days (Rowe et al. 2008). This stability aids in the interpretation of its measured phase curve, as the star can be assumed to remain constant at the level of our measurements. Radial velocity and secondary eclipse observations indicate that this planet has a circular orbit (Henry et al. 2000; Mazeh et al. 2000; Deming et al. 2005; Laughlin et al. 2005; Winn et al. 2005; Wittenmyer et al. 2005; Kipping 2008; Southworth 2008; Torres et al. 2008; Crossfield et al. 2012), and is therefore likely to be in a synchronous rotation state. 1
Transcript of THE 4.5 μm FULL-ORBIT PHASE CURVE OF THE HOT …showman/publications/zellem-etal-2014.pdf · the...
The Astrophysical Journal, 790:53 (9pp), 2014 July 20 doi:10.1088/0004-637X/790/1/53C© 2014. The American Astronomical Society. All rights reserved. Printed in the U.S.A.
THE 4.5 μm FULL-ORBIT PHASE CURVE OF THE HOT JUPITER HD 209458b
Robert T. Zellem1, Nikole K. Lewis2,11, Heather A. Knutson3, Caitlin A. Griffith1, Adam P. Showman1,Jonathan J. Fortney4, Nicolas B. Cowan5, Eric Agol6, Adam Burrows7, David Charbonneau8, Drake Deming9,
Gregory Laughlin4, and Jonathan Langton101 Lunar and Planetary Laboratory, University of Arizona, 1629 East University Boulevard, Tucson, AZ 85721, USA; [email protected]
2 Department of Earth, Atmospheric and Planetary Sciences, Massachusetts Institute of Technology, 77 Massachusetts Avenue, Cambridge, MA 02139, USA3 Division of Geological and Planetary Sciences, MC 170-25 1200 East California Boulevard, Pasadena, CA 91125, USA
4 Department of Astronomy and Astrophysics, University of California, Santa Cruz, 1156 High Street, Santa Cruz, CA 95064, USA5 Department of Earth and Planetary Sciences, Northwestern University, Technological Institute, 2145 Sheridan Road, Evanston, IL 60208, USA
6 Astronomy Department, University of Washington, Physics-Astronomy Building, 3910 15th Avenue NE, Seattle, WA 98195, USA7 Department of Astrophysical Sciences, Princeton University, 4 Ivy Lane, Peyton Hall, Princeton University, Princeton, NJ 08544, USA
8 Harvard-Smithsonian Center for Astrophysics, 60 Garden Street MS-16, Cambridge, MA 02138, USA9 Department of Astronomy, University of Maryland, College Park, MD 20742, USA
10 Physics Department, Principia College, 1 Maybeck Place, Elsah, IL 62028, USAReceived 2014 March 20; accepted 2014 June 2; published 2014 July 2
ABSTRACT
The hot Jupiter HD 209458b is particularly amenable to detailed study as it is among the brightest transitingexoplanet systems currently known (V-mag = 7.65; K-mag = 6.308) and has a large planet-to-star contrast ratio.HD 209458b is predicted to be in synchronous rotation about its host star with a hot spot that is shifted eastward of thesubstellar point by superrotating equatorial winds. Here we present the first full-orbit observations of HD 209458b,in which its 4.5 μm emission was recorded with Spitzer/IRAC. Our study revises the previous 4.5 μm measurementof HD 209458b’s secondary eclipse emission downward by ∼35% to 0.1391%+0.0072%
−0.0069%, changing our interpretationof the properties of its dayside atmosphere. We find that the hot spot on the planet’s dayside is shifted eastward ofthe substellar point by 40.◦9 ± 6.◦0, in agreement with circulation models predicting equatorial superrotation.HD 209458b’s dayside (Tbright = 1499 ± 15 K) and nightside (Tbright = 972 ± 44 K) emission indicate a day-to-night brightness temperature contrast smaller than that observed for more highly irradiated exoplanets, suggestingthat the day-to-night temperature contrast may be partially a function of the incident stellar radiation. The observedphase curve shape deviates modestly from global circulation model predictions potentially due to disequilibriumchemistry or deficiencies in the current hot CH4 line lists used in these models. Observations of the phase curveat additional wavelengths are needed in order to determine the possible presence and spatial extent of a daysidetemperature inversion, as well as to improve our overall understanding of this planet’s atmospheric circulation.
Key words: atmospheric effects – methods: numerical – planets and satellites: general –planets and satellites: individual (HD 209458b) – techniques: photometric
Online-only material: color figures, machine-readable table
1. INTRODUCTION
Of the more than 1100 transiting exoplanets discovered todate, over 150 are gas giant planets known as “hot Jupiters”that have near-Jupiter masses (0.5 MJupiter � M � 5 MJupiter)and that orbit very close to their host stars (semi-major axisa � 0.1 AU). These transiting exoplanets are predicted to betidally locked (e.g., MacDonald 1964; Peale 1974) so that onehemisphere always points toward its host star while the otheris in perpetual night. The resulting day-to-night temperaturecontrast is predicted to drive fast ∼1 km s−1 winds, whichtransfer heat from the dayside to the nightside hemispherethereby shifting the substellar hotspot and decreasing the day-to-night temperature contrast (e.g., Showman & Guillot 2002;Cooper & Showman 2005, 2006; Showman 2008; Showmanet al. 2008b, 2009; Langton & Laughlin 2007, 2008; Dobbs-Dixon & Lin 2008).
One of the best methods to directly constrain the natureof the atmospheric circulation patterns on these planets is tocontinuously monitor their infrared (IR) emission to character-ize the full-orbit phase curve. Such observations yield longi-tudinal disk variations, which can then be transformed into a
11 Sagan Fellow.
longitudinal temperature profile (Cowan & Agol 2008) to mea-sure the redistribution of heat. The Spitzer Space Telescope isthe only platform currently capable of making mid- to far-IRfull-orbit observations due to its stability, continuous viewingcapability, and access to longer wavelengths than the HubbleSpace Telescope (Harrington et al. 2006; Cowan et al. 2007,2012; Knutson et al. 2007, 2012; Lewis et al. 2013; Maxtedet al. 2013).
In this paper, we present new phase curve observations ofthe hot Jupiter HD 209458b, which has a particularly favorableplanet–star radius ratio (Rp/Rs = 0.12086 ± 0.00010; Torreset al. 2008) and orbits a bright star (V-mag = 7.65; K-mag =6.308). HD 209458 is a relatively quiet G-type star (e.g.,Charbonneau et al. 2000; Knutson et al. 2010), which has beenshown to vary by less than ∼0.002 mag at visible wavelengthsover a period of 58 days (Rowe et al. 2008). This stability aidsin the interpretation of its measured phase curve, as the star canbe assumed to remain constant at the level of our measurements.Radial velocity and secondary eclipse observations indicate thatthis planet has a circular orbit (Henry et al. 2000; Mazeh et al.2000; Deming et al. 2005; Laughlin et al. 2005; Winn et al.2005; Wittenmyer et al. 2005; Kipping 2008; Southworth 2008;Torres et al. 2008; Crossfield et al. 2012), and is therefore likelyto be in a synchronous rotation state.
1
The Astrophysical Journal, 790:53 (9pp), 2014 July 20 Zellem et al.
HD 209458b’s IR dayside emission has been measured dur-ing secondary eclipse, when the planet passes behind its hoststar, with two IRTF/SpeX K- and L-band eclipses (Richardsonet al. 2003), one Spitzer/MIPS 24 μm eclipse (Deming et al.2005), two Spitzer/IRS 7–13.2 μm eclipses (Richardson et al.2007), two Spitzer/IRS 7.46–15.25 μm eclipses (Swainet al. 2008), one eclipse simultaneously observed at the fourSpitzer/IRAC passbands (Knutson et al. 2008), one Hubble/NICMOS 1.5–2.5 μm eclipse (Swain et al. 2009), and threeSpitzer/MIPS eclipses (Crossfield et al. 2012). Multiple stud-ies have used these emission data to constrain HD 209458b’sdayside composition and thermal profile (e.g., Burrows et al.2007; Fortney et al. 2008; Madhusudhan & Seager 2009; Lineet al. 2014). The current consensus is that this planet’s day-side emission spectrum is best-matched by models with a tem-perature inversion, possibly from TiO and VO absorption, twomolecules typical of cooler stellar atmospheres (Burrows et al.2007; Knutson et al. 2008; Fortney et al. 2008). However, TiOand VO have yet to be conclusively detected (Desert et al. 2008).Some groups have also argued that TiO would likely be lost tocold traps in the planet’s interior and on the nightside (Showmanet al. 2009; Spiegel et al. 2009; Parmentier et al. 2013).
Phase-curve measurements indicate a planet’s longitudinalbrightness temperature variations, allowing for the measure-ment of heat redistribution from the dayside to nightside.HD 209458b, with an equivalent temperature of 1450 K (as-suming a zero albedo) is comparatively cooler than most ofthe other hot Jupiters for which temperature contrasts havebeen measured: HAT-P-2b (Lewis et al. 2013), HD 149026b(Knutson et al. 2009a), HAT-P-7b (Borucki et al. 2009), WASP-18b (Maxted et al. 2013), and WASP-12b (Cowan et al. 2012)(see Figure 1 in Perez-Becker & Showman 2013). Thus mea-surements of HD 209458b’s day-to-night temperature contrastenable further exploration of the theory that this contrast isdriven by insolation (Perez-Becker & Showman 2013). In addi-tion, the phase curve determines whether HD 209458b, likeother hot Jupiters (e.g., HD 189733b; Knutson et al. 2007,2009b, 2012), has a hot spot shifted eastward of the substel-lar point. Such a shift would indicate equatorial superrotation,as first predicted by the global circulation model (GCM) ofShowman & Guillot (2002).
Here we analyze post-cryogenic Spitzer Space Telescope(Werner et al. 2004) IRAC2 (Fazio et al. 2004) full-orbitIR observations of HD 209458b. Our observations probeHD 209458b’s dynamical processes by measuring its 4.5 μmdayside emission, location of its hot spot, and day-to-nighttemperature contrast. Previous secondary eclipse data were ob-tained in a non-standard observing mode in which Spitzer cycledcontinuously between the four IRAC subarrays (Knutson et al.2008). This mode enabled coverage of all four bands during asingle eclipse event but with one-fifth the effective cadence ofthe now standard staring mode observations (e.g., Knutson et al.2012; Lewis et al. 2013). Here we observe continuously in oneIRAC band alone, resulting in a higher cadence. We thereforeexpect that our new observations will allow for a more precise es-timate of the 4.5 μm eclipse depth. Our full-orbit data also sam-ples HD 209458b’s phase curve and measures for the first timeits nightside emission. A previous 24 μm full-orbit phase curvewas corrupted by instrumental sensitivity variations (Crossfieldet al. 2012). From these data, we compare the hot spot offset,day–night flux differences, and secondary eclipse emissionsderived here for HD 209458b with GCMs that predict thesevalues.
2. OBSERVATIONS
The observations were taken between 2010 January 1720:55:24.4 UT and 2010 January 21 21:28:42.0 UT, resultingin 96.55 hr of data. They begin shortly before secondaryeclipse, continue through primary transit, and end shortlyafter secondary eclipse. To minimize readout time and therebymaximize image cadence, the subarray mode was used in which32 × 32 pixel images were stored as sets of 64 in a single FITSdatacube with a single image header. By assuming uniformspacing in time, the mid-exposure time for each image iscalculated from the header keywords MBJD_OBS (start of thefirst image in each cube), AINTBEG (integration begin), andATIMEEND (integration end). Effectively, the image spacing is0.4 s. We report our timing measurements using BJD_UTC.
2.1. IRAC2 4.5 μm Photometry
The sky background is estimated in each image by firstmasking out the target star with a 10 pixel radius. 3σ outliersare then trimmed over three iterations to remove hot pixels andcosmic ray hits from the set of 64 measurements at that pixelposition from a given data cube. The filtered background countsare fit with a Gaussian function. This count is then subtractedfrom each image.
We determine the x- and y-position of HD 209458 in eachimage using a flux-weighting methodology similar to a centroidthat employs a five-pixel-radius circular aperture (e.g., Knutsonet al. 2008). We find the latter method results in a more stableposition estimate than the center of a two-dimensional Gaussianfit, and a correspondingly smaller scatter in our final photometry,in good agreement with our previous results for Spitzer 4.5 μmphase curve observations of HD 189733b (Knutson et al.2012) and HAT-P-2 (Lewis et al. 2013). We first calculate ourphotometry using a fixed circular aperture with radii equal to2.0, 2.1, 2.2, 2.3, 2.4, 2.5, 2.6, 2.7, 2.8, 2.9, 3.0, 3.5, 4.0, 4.5,and 5.0 pixels.
We also explore apertures that scale according to the noisepixel parameter β, which is defined in Section 2.2.2 (IRACImage Quality) of the IRAC instrument handbook as
β = (∑
Ii)2
∑ (I 2i
) (1)
in which Ii is the intensity in a given pixel i. The noise pixel pa-rameter is equal to one over the sharpness parameter S1, (Muller& Buffington 1974), and proportional to the full width at half-maximum of the stellar point-spread function squared (Mighell2005); for a more thorough discussion of the noise pixel param-eter, please see Appendix A of Lewis et al. (2013). We generatetwo additional aperture populations using the noise pixel param-eter:
√β×[0.6, 0.7, 0.8, 0.85, 0.9, 0.95, 1.0, 1.05, 1.1, 1.15, 1.2]
and√
β+[−0.8,−0.7,−0.6,−0.5,−0.4,−0.3,−0.2,−0.1, 0,0.1, 0.2, 0.3, 0.4]. We find that a fixed aperture size of 2.7 pix-els produces the smallest amount of scatter in the final residu-als, which is also consistent with our conclusions for previous4.5 μm phase curve observations (Knutson et al. 2012; Lewiset al. 2013).
Outliers in the measured flux, x- and y-positions of the target,or the noise pixel parameter β are removed by first discarding6σ outliers and then by using a moving median filter with awidth of 10 points and discarding outliers greater than 4σ . Afterapplying this filter, we found that there were two points in our
2
The Astrophysical Journal, 790:53 (9pp), 2014 July 20 Zellem et al.
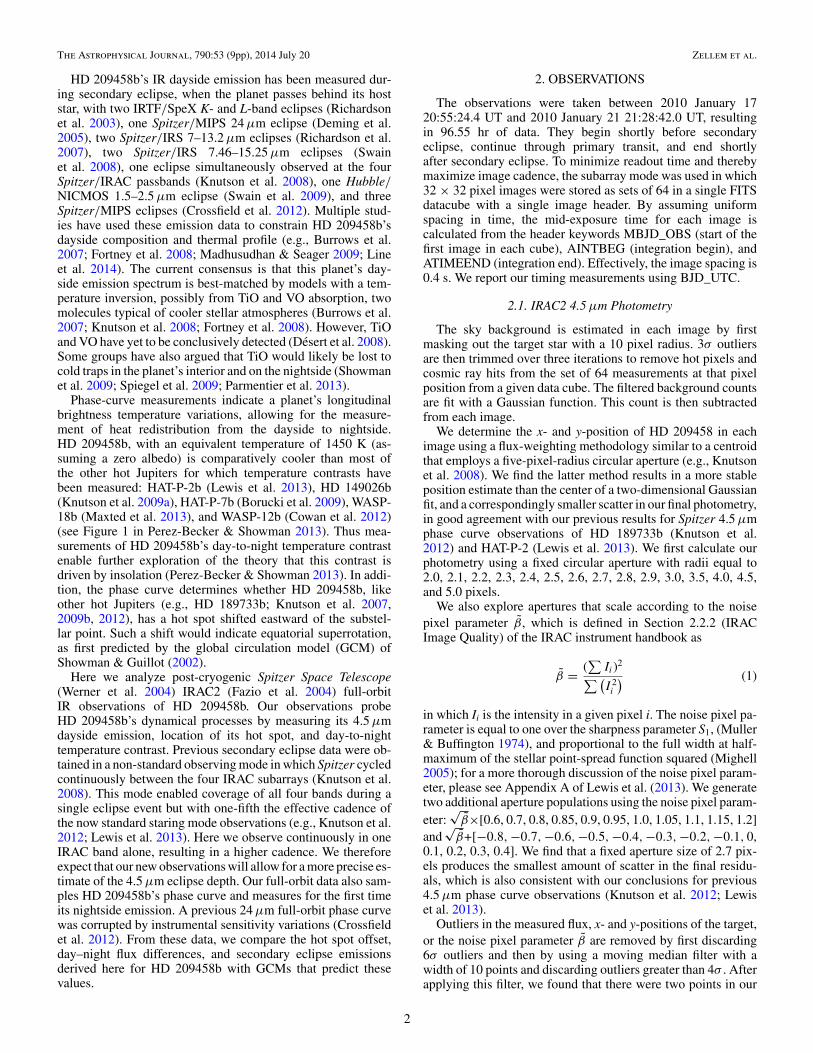
Table 1Photometric Data
JD (BJD_UTC − Raw, Filtered Photometry Final, Corrected Photometry
2455214) Relative Flux Uncertainty Relative Flux Uncertainty
0.413525 1.007950 0.008475 1.002779 0.0032010.413530 1.009589 0.008482 1.004326 0.0032010.413535 1.009016 0.008479 1.002103 0.0032010.413539 1.003937 0.008458 0.997562 0.0032010.413544 1.011562 0.008490 1.004216 0.0032010.413548 1.006882 0.008470 0.998892 0.0032010.413553 1.005686 0.008465 0.998323 0.0032010.413557 1.009775 0.008482 1.002209 0.0032010.413562 1.006700 0.008469 0.999762 0.0032010.413566 1.003509 0.008456 0.996224 0.003201
Note. Sample of the filtered, raw data (see Figure 1) and the final, correctedphotometry (see Figure 2).
(This table is available in its entirety in a machine-readable form in the onlinejournal. A portion is shown here for guidance regarding its form and content.)
observations (at BJD_UTC ≈ 2455214.9 and ≈2455217.29) inwhich the star displayed a sudden, sharp excursion in positiontypically lasting several minutes. These excursions are mostlikely the result of micrometoerite hits and we exclude themfrom our subsequent analysis. The two excluded segments ofthe light curve contain a total of 984 images, corresponding to0.13% of the total data set. This raw, filtered data is presentedin Table 1.
2.2. Flux Ramp Correction
Previous Spitzer/IRAC observations (e.g., Beerer et al. 2011;Todorov et al. 2012; Knutson et al. 2012; Lewis et al. 2013)note a ramp-like change in the observed flux at 4.5 μm, lastingapproximately one hour. Agol et al. (2010) examined a similareffect in the 8 μm bandpass and postulated that the effect mightbe due to a combination of thermal settling of the telescopeand charge-trapping in the array. This effect is mitigated bytrimming the first hour of data after the start of the observationand again after the downlink break (at phase ≈0.75). We thenfit the trimmed data with the ramp function given by Agol et al.(2010), as part of our global fit described in Section 2.3:
F ′/F = 1 + a1e−t/a2 + a3e
−t/a4 , (2)
in which F ′ is the flux with the ramp, F is the flux correctedfor the ramp, a1–a4 are the correction coefficients, and t is thetime. A Bayseian Information Criterion (BIC12; Schwarz 1978)analysis indicates that a ramp correction is unnecessary in orderto fit the trimmed data. We therefore leave this ramp function outof our subsequent analysis, consistent with our previous 4.5 μmphase curve analyses (Knutson et al. 2012; Lewis et al. 2013).
2.3. Spitzer/IRAC Decorrelation
Previous studies of transiting exoplanets find that the largesterror source in Spitzer/IRAC 3.6 and 4.5 μm data is due tointra-pixel sensitivity variations, which cause variations in thetelescope pointing to manifest as changes in the measured fluxfrom the target star (e.g., Charbonneau et al. 2008; Beaulieuet al. 2010; Ballard et al. 2010; Knutson et al. 2012; Lewiset al. 2013). This effect can be easily seen in our 4.5 μm full-orbit data (Figure 1) in which the raw flux tracks with the x-
12 BIC = χ2 + k ln(n), in which k is the number of free parameters and n is thenumber of datapoints in the fit.
-0.6 -0.4 -0.2 0.0 0.2 0.4 0.6Orbital Phase
14.0
14.2
14.4
14.6
14.8
15.0
y-po
sitio
n
14.5
14.6
14.7
14.8
14.9
x-po
sitio
n
0.96
0.98
1.00
1.02
1.04
Rel
ativ
e F
lux
Figure 1. Raw Spitzer/IRAC2 4.5 μm full-orbit photometry of the exoplanetHD 209458b (top), its x-position (middle), and y-position on the array (bottom)vs. the orbital phase after filtering. All frames are binned by 400 data points(≈2.5 minutes). The gap in the data is due to spacecraft downlink. The raw fluxis highly correlated with the x- and y-positions on the array, which we removehere with a pixel-mapping Gaussian detrending method (see Section 2.3).
and y-positions on the detector. We de-trend the data using apixel-mapping Gaussian weight decorrelation method (Ballardet al. 2010; Knutson et al. 2012; Lewis et al. 2013) in whicheach photometric measurement is corrected by its 50 nearestneighbors in x-, y-, and β-space (see Equation (2) in Knutsonet al. 2012). We find, consistent with Lewis et al. (2013), thatinclusion of the noise pixel parameter β terms increases thescatter in our final solutions. We therefore use the followingsimplified version of this correction instead:
Fmeas,j = F0,j
n∑i=0
e−(xi−xj )2/2σ 2x,j × e−(yi−yj )2/2σ 2
y,j , (3)
in which Fmeas,j is the measured flux in the jth image; F0,j
is the intrinsic flux; xj and yj are the measured x-position andy-position; and σx,j and σy,j are the standard deviations of thex and y vectors over the full range in i (0 to n, where n = 50nearest neighbors). The 50 nearest neighbors to the jth image aredetermined via
di,j =√
(xi − xj )2 + (yi − yj )2, (4)
in which di,j is the distance vector between the jth image and theith image; xi and xj are the measured x-positions of the ith and jth
images, respectively; and yi and yj are the measured y-positionsof the ith and jth images, respectively. As a first-order estimation,we set the uncertainties on individual flux values equal to thestandard deviation of the normalized residuals (SDNR) of theraw flux divided by the Gaussian weight (see Equation (3)).
We employ a Levenburg–Marquardt least-squares mini-mization via the Interactive Data Language mpfit function(Markwardt 2009) to solve simultaneously for the best-fit transit,secondary eclipse, and phase curve functions while optimizingthe corresponding pixel map at each step in our minimization.
3
The Astrophysical Journal, 790:53 (9pp), 2014 July 20 Zellem et al.
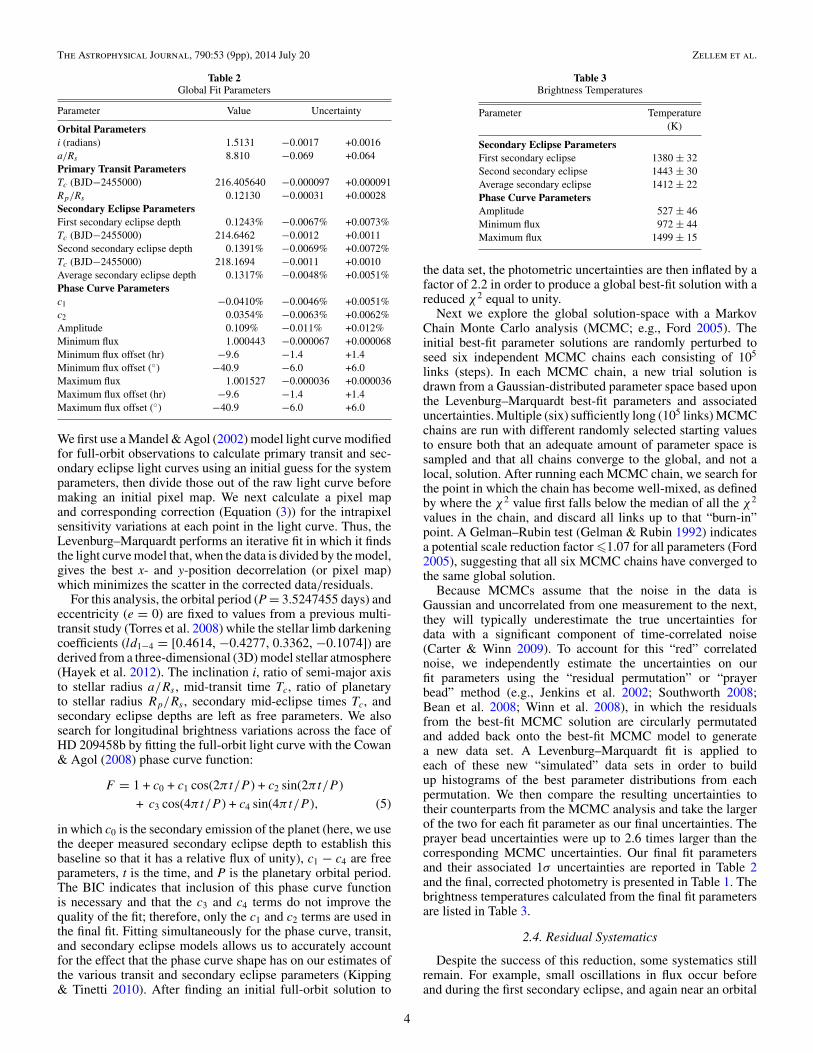
Table 2Global Fit Parameters
Parameter Value Uncertainty
Orbital Parametersi (radians) 1.5131 −0.0017 +0.0016a/Rs 8.810 −0.069 +0.064Primary Transit ParametersTc (BJD−2455000) 216.405640 −0.000097 +0.000091Rp/Rs 0.12130 −0.00031 +0.00028Secondary Eclipse ParametersFirst secondary eclipse depth 0.1243% −0.0067% +0.0073%Tc (BJD−2455000) 214.6462 −0.0012 +0.0011Second secondary eclipse depth 0.1391% −0.0069% +0.0072%Tc (BJD−2455000) 218.1694 −0.0011 +0.0010Average secondary eclipse depth 0.1317% −0.0048% +0.0051%Phase Curve Parametersc1 −0.0410% −0.0046% +0.0051%c2 0.0354% −0.0063% +0.0062%Amplitude 0.109% −0.011% +0.012%Minimum flux 1.000443 −0.000067 +0.000068Minimum flux offset (hr) −9.6 −1.4 +1.4Minimum flux offset (◦) −40.9 −6.0 +6.0Maximum flux 1.001527 −0.000036 +0.000036Maximum flux offset (hr) −9.6 −1.4 +1.4Maximum flux offset (◦) −40.9 −6.0 +6.0
We first use a Mandel & Agol (2002) model light curve modifiedfor full-orbit observations to calculate primary transit and sec-ondary eclipse light curves using an initial guess for the systemparameters, then divide those out of the raw light curve beforemaking an initial pixel map. We next calculate a pixel mapand corresponding correction (Equation (3)) for the intrapixelsensitivity variations at each point in the light curve. Thus, theLevenburg–Marquardt performs an iterative fit in which it findsthe light curve model that, when the data is divided by the model,gives the best x- and y-position decorrelation (or pixel map)which minimizes the scatter in the corrected data/residuals.
For this analysis, the orbital period (P = 3.5247455 days) andeccentricity (e = 0) are fixed to values from a previous multi-transit study (Torres et al. 2008) while the stellar limb darkeningcoefficients (ld1−4 = [0.4614, −0.4277, 0.3362, −0.1074]) arederived from a three-dimensional (3D) model stellar atmosphere(Hayek et al. 2012). The inclination i, ratio of semi-major axisto stellar radius a/Rs , mid-transit time Tc, ratio of planetaryto stellar radius Rp/Rs , secondary mid-eclipse times Tc, andsecondary eclipse depths are left as free parameters. We alsosearch for longitudinal brightness variations across the face ofHD 209458b by fitting the full-orbit light curve with the Cowan& Agol (2008) phase curve function:
F = 1 + c0 + c1 cos(2πt/P ) + c2 sin(2πt/P )
+ c3 cos(4πt/P ) + c4 sin(4πt/P ), (5)
in which c0 is the secondary emission of the planet (here, we usethe deeper measured secondary eclipse depth to establish thisbaseline so that it has a relative flux of unity), c1 − c4 are freeparameters, t is the time, and P is the planetary orbital period.The BIC indicates that inclusion of this phase curve functionis necessary and that the c3 and c4 terms do not improve thequality of the fit; therefore, only the c1 and c2 terms are used inthe final fit. Fitting simultaneously for the phase curve, transit,and secondary eclipse models allows us to accurately accountfor the effect that the phase curve shape has on our estimates ofthe various transit and secondary eclipse parameters (Kipping& Tinetti 2010). After finding an initial full-orbit solution to
Table 3Brightness Temperatures
Parameter Temperature(K)
Secondary Eclipse ParametersFirst secondary eclipse 1380 ± 32Second secondary eclipse 1443 ± 30Average secondary eclipse 1412 ± 22Phase Curve ParametersAmplitude 527 ± 46Minimum flux 972 ± 44Maximum flux 1499 ± 15
the data set, the photometric uncertainties are then inflated by afactor of 2.2 in order to produce a global best-fit solution with areduced χ2 equal to unity.
Next we explore the global solution-space with a MarkovChain Monte Carlo analysis (MCMC; e.g., Ford 2005). Theinitial best-fit parameter solutions are randomly perturbed toseed six independent MCMC chains each consisting of 105
links (steps). In each MCMC chain, a new trial solution isdrawn from a Gaussian-distributed parameter space based uponthe Levenburg–Marquardt best-fit parameters and associateduncertainties. Multiple (six) sufficiently long (105 links) MCMCchains are run with different randomly selected starting valuesto ensure both that an adequate amount of parameter space issampled and that all chains converge to the global, and not alocal, solution. After running each MCMC chain, we search forthe point in which the chain has become well-mixed, as definedby where the χ2 value first falls below the median of all the χ2
values in the chain, and discard all links up to that “burn-in”point. A Gelman–Rubin test (Gelman & Rubin 1992) indicatesa potential scale reduction factor �1.07 for all parameters (Ford2005), suggesting that all six MCMC chains have converged tothe same global solution.
Because MCMCs assume that the noise in the data isGaussian and uncorrelated from one measurement to the next,they will typically underestimate the true uncertainties fordata with a significant component of time-correlated noise(Carter & Winn 2009). To account for this “red” correlatednoise, we independently estimate the uncertainties on ourfit parameters using the “residual permutation” or “prayerbead” method (e.g., Jenkins et al. 2002; Southworth 2008;Bean et al. 2008; Winn et al. 2008), in which the residualsfrom the best-fit MCMC solution are circularly permutatedand added back onto the best-fit MCMC model to generatea new data set. A Levenburg–Marquardt fit is applied toeach of these new “simulated” data sets in order to buildup histograms of the best parameter distributions from eachpermutation. We then compare the resulting uncertainties totheir counterparts from the MCMC analysis and take the largerof the two for each fit parameter as our final uncertainties. Theprayer bead uncertainties were up to 2.6 times larger than thecorresponding MCMC uncertainties. Our final fit parametersand their associated 1σ uncertainties are reported in Table 2and the final, corrected photometry is presented in Table 1. Thebrightness temperatures calculated from the final fit parametersare listed in Table 3.
2.4. Residual Systematics
Despite the success of this reduction, some systematics stillremain. For example, small oscillations in flux occur beforeand during the first secondary eclipse, and again near an orbital
4
The Astrophysical Journal, 790:53 (9pp), 2014 July 20 Zellem et al.
-0.6 -0.4 -0.2 0.0 0.2 0.4 0.6Orbital Phase
0.9995
1.0000
1.0005
1.0010
1.0015
1.0020
Rel
ativ
e F
lux
0.980
0.985
0.990
0.995
1.000
1.005R
elat
ive
Flu
x
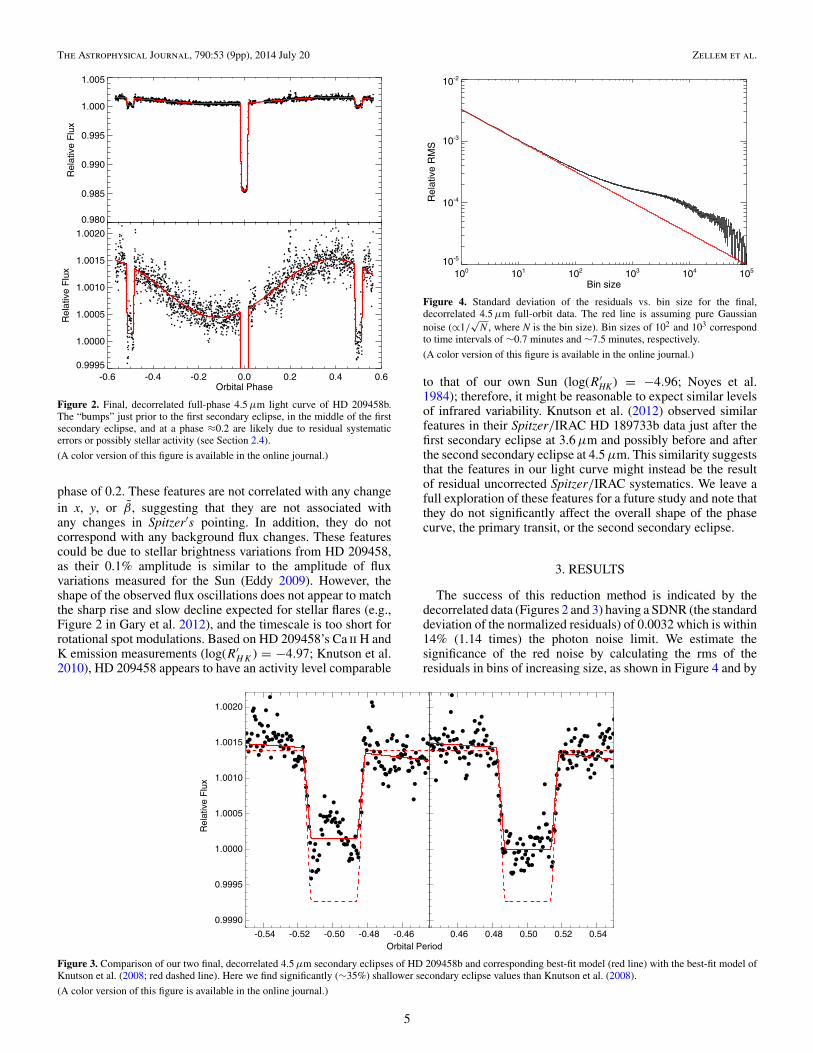
Figure 2. Final, decorrelated full-phase 4.5 μm light curve of HD 209458b.The “bumps” just prior to the first secondary eclipse, in the middle of the firstsecondary eclipse, and at a phase ≈0.2 are likely due to residual systematicerrors or possibly stellar activity (see Section 2.4).
(A color version of this figure is available in the online journal.)
phase of 0.2. These features are not correlated with any changein x, y, or β, suggesting that they are not associated withany changes in Spitzer′s pointing. In addition, they do notcorrespond with any background flux changes. These featurescould be due to stellar brightness variations from HD 209458,as their 0.1% amplitude is similar to the amplitude of fluxvariations measured for the Sun (Eddy 2009). However, theshape of the observed flux oscillations does not appear to matchthe sharp rise and slow decline expected for stellar flares (e.g.,Figure 2 in Gary et al. 2012), and the timescale is too short forrotational spot modulations. Based on HD 209458’s Ca ii H andK emission measurements (log(R′
HK ) = −4.97; Knutson et al.2010), HD 209458 appears to have an activity level comparable
100 101 102 103 104 105
Bin size
10-5
10-4
10-3
10-2
Rel
ativ
e R
MS
Figure 4. Standard deviation of the residuals vs. bin size for the final,decorrelated 4.5 μm full-orbit data. The red line is assuming pure Gaussiannoise (∝1/
√N , where N is the bin size). Bin sizes of 102 and 103 correspond
to time intervals of ∼0.7 minutes and ∼7.5 minutes, respectively.
(A color version of this figure is available in the online journal.)
to that of our own Sun (log(R′HK) = −4.96; Noyes et al.
1984); therefore, it might be reasonable to expect similar levelsof infrared variability. Knutson et al. (2012) observed similarfeatures in their Spitzer/IRAC HD 189733b data just after thefirst secondary eclipse at 3.6 μm and possibly before and afterthe second secondary eclipse at 4.5 μm. This similarity suggeststhat the features in our light curve might instead be the resultof residual uncorrected Spitzer/IRAC systematics. We leave afull exploration of these features for a future study and note thatthey do not significantly affect the overall shape of the phasecurve, the primary transit, or the second secondary eclipse.
3. RESULTS
The success of this reduction method is indicated by thedecorrelated data (Figures 2 and 3) having a SDNR (the standarddeviation of the normalized residuals) of 0.0032 which is within14% (1.14 times) the photon noise limit. We estimate thesignificance of the red noise by calculating the rms of theresiduals in bins of increasing size, as shown in Figure 4 and by
-0.54 -0.52 -0.50 -0.48 -0.46
0.9990
0.9995
1.0000
1.0005
1.0010
1.0015
1.0020
Rel
ativ
e F
lux
0.46 0.48 0.50 0.52 0.54Orbital Period
Figure 3. Comparison of our two final, decorrelated 4.5 μm secondary eclipses of HD 209458b and corresponding best-fit model (red line) with the best-fit model ofKnutson et al. (2008; red dashed line). Here we find significantly (∼35%) shallower secondary eclipse values than Knutson et al. (2008).
(A color version of this figure is available in the online journal.)
5
The Astrophysical Journal, 790:53 (9pp), 2014 July 20 Zellem et al.
using the Equation from Gillon et al. (2006):
σ 2N = σ 2
w
N+ σ 2
r , (6)
where σN is the measured uncertainty for a bin size N, σw is thewhite noise and assumed to be equal to the SDNR, and σr is thered noise. Using Equation (6), we estimate the contribution ofthe red noise on relevant timescales. This value is 2.7% of thetotal scatter in the relative flux corresponding to a 2.7 increase inthe total noise in the 1 hr bins, the timescales of eclipse ingressand egress. Our final global solutions and their 1σ uncertaintiesare listed in Table 2. The best-fit planet–star radius ratio isRp/Rs = 0.12130+0.00028
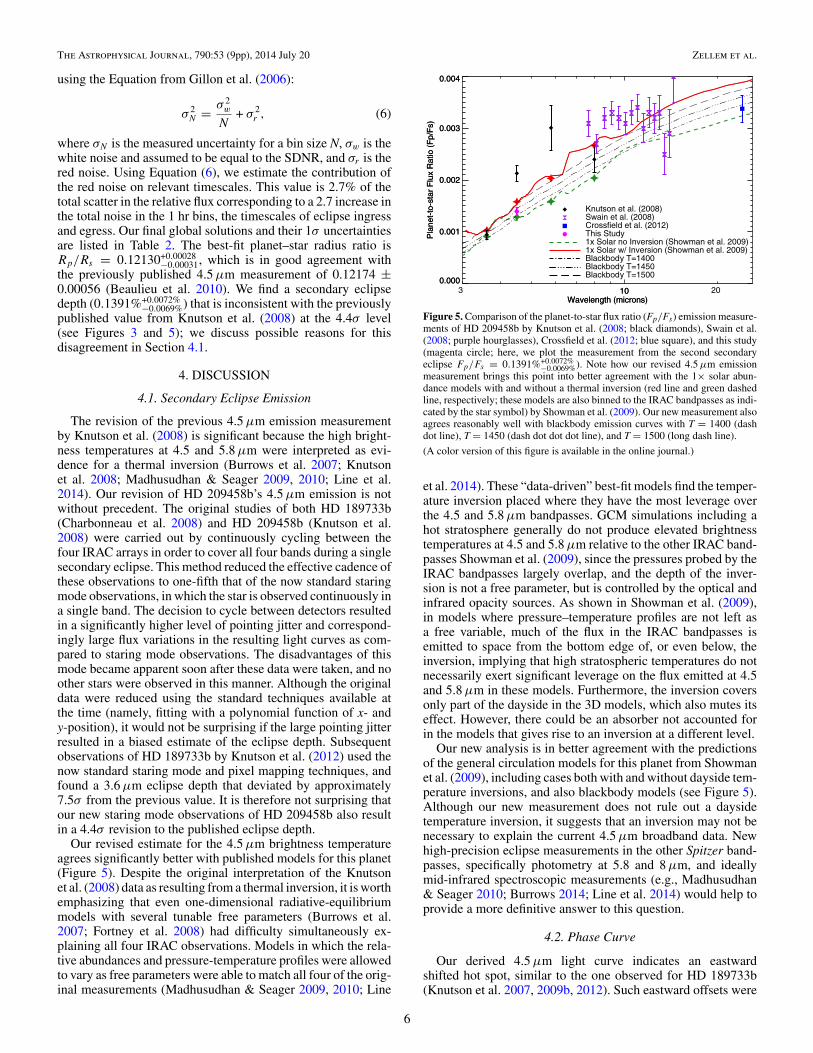
−0.00031, which is in good agreement withthe previously published 4.5 μm measurement of 0.12174 ±0.00056 (Beaulieu et al. 2010). We find a secondary eclipsedepth (0.1391%+0.0072%
−0.0069%) that is inconsistent with the previouslypublished value from Knutson et al. (2008) at the 4.4σ level(see Figures 3 and 5); we discuss possible reasons for thisdisagreement in Section 4.1.
4. DISCUSSION
4.1. Secondary Eclipse Emission
The revision of the previous 4.5 μm emission measurementby Knutson et al. (2008) is significant because the high bright-ness temperatures at 4.5 and 5.8 μm were interpreted as evi-dence for a thermal inversion (Burrows et al. 2007; Knutsonet al. 2008; Madhusudhan & Seager 2009, 2010; Line et al.2014). Our revision of HD 209458b’s 4.5 μm emission is notwithout precedent. The original studies of both HD 189733b(Charbonneau et al. 2008) and HD 209458b (Knutson et al.2008) were carried out by continuously cycling between thefour IRAC arrays in order to cover all four bands during a singlesecondary eclipse. This method reduced the effective cadence ofthese observations to one-fifth that of the now standard staringmode observations, in which the star is observed continuously ina single band. The decision to cycle between detectors resultedin a significantly higher level of pointing jitter and correspond-ingly large flux variations in the resulting light curves as com-pared to staring mode observations. The disadvantages of thismode became apparent soon after these data were taken, and noother stars were observed in this manner. Although the originaldata were reduced using the standard techniques available atthe time (namely, fitting with a polynomial function of x- andy-position), it would not be surprising if the large pointing jitterresulted in a biased estimate of the eclipse depth. Subsequentobservations of HD 189733b by Knutson et al. (2012) used thenow standard staring mode and pixel mapping techniques, andfound a 3.6 μm eclipse depth that deviated by approximately7.5σ from the previous value. It is therefore not surprising thatour new staring mode observations of HD 209458b also resultin a 4.4σ revision to the published eclipse depth.
Our revised estimate for the 4.5 μm brightness temperatureagrees significantly better with published models for this planet(Figure 5). Despite the original interpretation of the Knutsonet al. (2008) data as resulting from a thermal inversion, it is worthemphasizing that even one-dimensional radiative-equilibriummodels with several tunable free parameters (Burrows et al.2007; Fortney et al. 2008) had difficulty simultaneously ex-plaining all four IRAC observations. Models in which the rela-tive abundances and pressure-temperature profiles were allowedto vary as free parameters were able to match all four of the orig-inal measurements (Madhusudhan & Seager 2009, 2010; Line
10Wavelength (microns)
0.000
0.001
0.002
0.003
0.004
Pla
net-
to-s
tar
Flu
x R
atio
(F
p/F
s)
10Wavelength (microns)
0.000
0.001
0.002
0.003
0.004
Pla
net-
to-s
tar
Flu
x R
atio
(F
p/F
s)
Knutson et al. (2008)Swain et al. (2008)Crossfield et al. (2012)This Study1x Solar no Inversion (Showman et al. 2009)1x Solar w/ Inversion (Showman et al. 2009)Blackbody T=1400Blackbody T=1450Blackbody T=1500
3 20
Figure 5. Comparison of the planet-to-star flux ratio (Fp/Fs) emission measure-ments of HD 209458b by Knutson et al. (2008; black diamonds), Swain et al.(2008; purple hourglasses), Crossfield et al. (2012; blue square), and this study(magenta circle; here, we plot the measurement from the second secondaryeclipse Fp/Fs = 0.1391%+0.0072%
−0.0069%). Note how our revised 4.5 μm emissionmeasurement brings this point into better agreement with the 1× solar abun-dance models with and without a thermal inversion (red line and green dashedline, respectively; these models are also binned to the IRAC bandpasses as indi-cated by the star symbol) by Showman et al. (2009). Our new measurement alsoagrees reasonably well with blackbody emission curves with T = 1400 (dashdot line), T = 1450 (dash dot dot dot line), and T = 1500 (long dash line).
(A color version of this figure is available in the online journal.)
et al. 2014). These “data-driven” best-fit models find the temper-ature inversion placed where they have the most leverage overthe 4.5 and 5.8 μm bandpasses. GCM simulations including ahot stratosphere generally do not produce elevated brightnesstemperatures at 4.5 and 5.8 μm relative to the other IRAC band-passes Showman et al. (2009), since the pressures probed by theIRAC bandpasses largely overlap, and the depth of the inver-sion is not a free parameter, but is controlled by the optical andinfrared opacity sources. As shown in Showman et al. (2009),in models where pressure–temperature profiles are not left asa free variable, much of the flux in the IRAC bandpasses isemitted to space from the bottom edge of, or even below, theinversion, implying that high stratospheric temperatures do notnecessarily exert significant leverage on the flux emitted at 4.5and 5.8 μm in these models. Furthermore, the inversion coversonly part of the dayside in the 3D models, which also mutes itseffect. However, there could be an absorber not accounted forin the models that gives rise to an inversion at a different level.
Our new analysis is in better agreement with the predictionsof the general circulation models for this planet from Showmanet al. (2009), including cases both with and without dayside tem-perature inversions, and also blackbody models (see Figure 5).Although our new measurement does not rule out a daysidetemperature inversion, it suggests that an inversion may not benecessary to explain the current 4.5 μm broadband data. Newhigh-precision eclipse measurements in the other Spitzer band-passes, specifically photometry at 5.8 and 8 μm, and ideallymid-infrared spectroscopic measurements (e.g., Madhusudhan& Seager 2010; Burrows 2014; Line et al. 2014) would help toprovide a more definitive answer to this question.
4.2. Phase Curve
Our derived 4.5 μm light curve indicates an eastwardshifted hot spot, similar to the one observed for HD 189733b(Knutson et al. 2007, 2009b, 2012). Such eastward offsets were
6
The Astrophysical Journal, 790:53 (9pp), 2014 July 20 Zellem et al.
-0.6 -0.4 -0.2 0.0 0.2 0.4 0.6Orbital Phase
0.9995
1.0000
1.0005
1.0010
1.0015
1.0020
1.0025
Rel
ativ
e F
lux
Best-fit Model1x Solar no Inversion1x Solar w/ Inversion3x Solar w/ Inversion
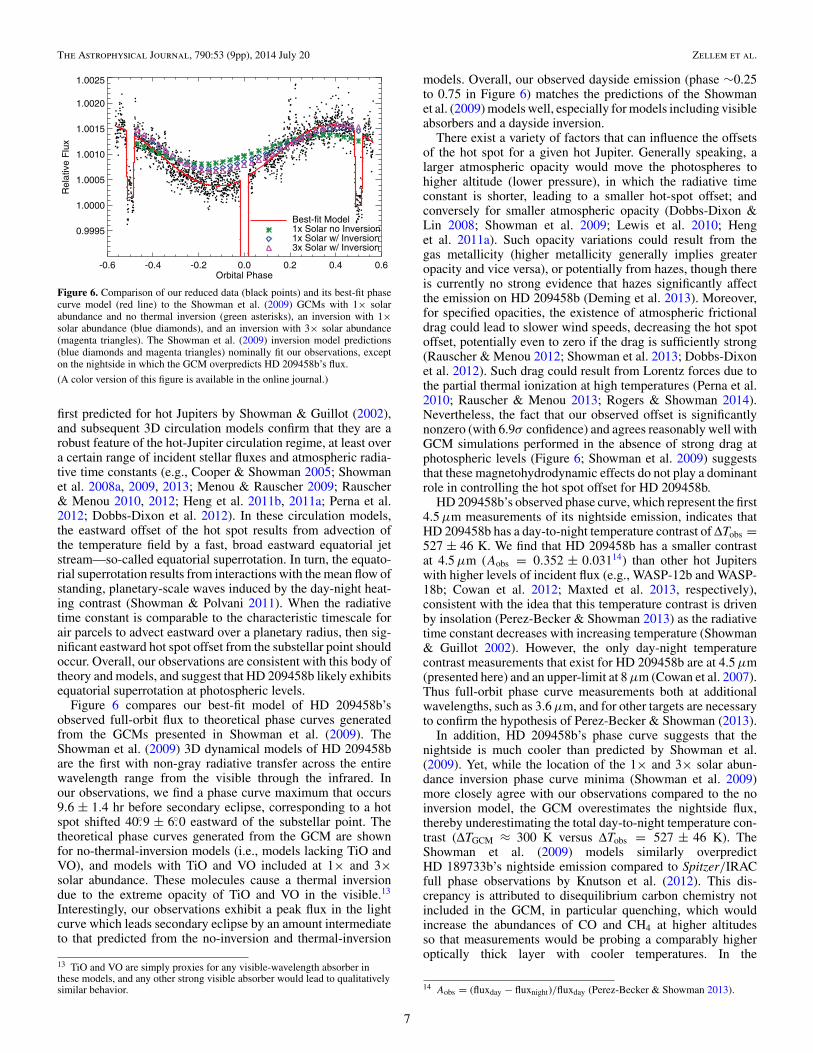
Figure 6. Comparison of our reduced data (black points) and its best-fit phasecurve model (red line) to the Showman et al. (2009) GCMs with 1× solarabundance and no thermal inversion (green asterisks), an inversion with 1×solar abundance (blue diamonds), and an inversion with 3× solar abundance(magenta triangles). The Showman et al. (2009) inversion model predictions(blue diamonds and magenta triangles) nominally fit our observations, excepton the nightside in which the GCM overpredicts HD 209458b’s flux.
(A color version of this figure is available in the online journal.)
first predicted for hot Jupiters by Showman & Guillot (2002),and subsequent 3D circulation models confirm that they are arobust feature of the hot-Jupiter circulation regime, at least overa certain range of incident stellar fluxes and atmospheric radia-tive time constants (e.g., Cooper & Showman 2005; Showmanet al. 2008a, 2009, 2013; Menou & Rauscher 2009; Rauscher& Menou 2010, 2012; Heng et al. 2011b, 2011a; Perna et al.2012; Dobbs-Dixon et al. 2012). In these circulation models,the eastward offset of the hot spot results from advection ofthe temperature field by a fast, broad eastward equatorial jetstream—so-called equatorial superrotation. In turn, the equato-rial superrotation results from interactions with the mean flow ofstanding, planetary-scale waves induced by the day-night heat-ing contrast (Showman & Polvani 2011). When the radiativetime constant is comparable to the characteristic timescale forair parcels to advect eastward over a planetary radius, then sig-nificant eastward hot spot offset from the substellar point shouldoccur. Overall, our observations are consistent with this body oftheory and models, and suggest that HD 209458b likely exhibitsequatorial superrotation at photospheric levels.
Figure 6 compares our best-fit model of HD 209458b’sobserved full-orbit flux to theoretical phase curves generatedfrom the GCMs presented in Showman et al. (2009). TheShowman et al. (2009) 3D dynamical models of HD 209458bare the first with non-gray radiative transfer across the entirewavelength range from the visible through the infrared. Inour observations, we find a phase curve maximum that occurs9.6 ± 1.4 hr before secondary eclipse, corresponding to a hotspot shifted 40.◦9 ± 6.◦0 eastward of the substellar point. Thetheoretical phase curves generated from the GCM are shownfor no-thermal-inversion models (i.e., models lacking TiO andVO), and models with TiO and VO included at 1× and 3×solar abundance. These molecules cause a thermal inversiondue to the extreme opacity of TiO and VO in the visible.13
Interestingly, our observations exhibit a peak flux in the lightcurve which leads secondary eclipse by an amount intermediateto that predicted from the no-inversion and thermal-inversion
13 TiO and VO are simply proxies for any visible-wavelength absorber inthese models, and any other strong visible absorber would lead to qualitativelysimilar behavior.
models. Overall, our observed dayside emission (phase ∼0.25to 0.75 in Figure 6) matches the predictions of the Showmanet al. (2009) models well, especially for models including visibleabsorbers and a dayside inversion.
There exist a variety of factors that can influence the offsetsof the hot spot for a given hot Jupiter. Generally speaking, alarger atmospheric opacity would move the photospheres tohigher altitude (lower pressure), in which the radiative timeconstant is shorter, leading to a smaller hot-spot offset; andconversely for smaller atmospheric opacity (Dobbs-Dixon &Lin 2008; Showman et al. 2009; Lewis et al. 2010; Henget al. 2011a). Such opacity variations could result from thegas metallicity (higher metallicity generally implies greateropacity and vice versa), or potentially from hazes, though thereis currently no strong evidence that hazes significantly affectthe emission on HD 209458b (Deming et al. 2013). Moreover,for specified opacities, the existence of atmospheric frictionaldrag could lead to slower wind speeds, decreasing the hot spotoffset, potentially even to zero if the drag is sufficiently strong(Rauscher & Menou 2012; Showman et al. 2013; Dobbs-Dixonet al. 2012). Such drag could result from Lorentz forces due tothe partial thermal ionization at high temperatures (Perna et al.2010; Rauscher & Menou 2013; Rogers & Showman 2014).Nevertheless, the fact that our observed offset is significantlynonzero (with 6.9σ confidence) and agrees reasonably well withGCM simulations performed in the absence of strong drag atphotospheric levels (Figure 6; Showman et al. 2009) suggeststhat these magnetohydrodynamic effects do not play a dominantrole in controlling the hot spot offset for HD 209458b.
HD 209458b’s observed phase curve, which represent the first4.5 μm measurements of its nightside emission, indicates thatHD 209458b has a day-to-night temperature contrast of ΔTobs =527 ± 46 K. We find that HD 209458b has a smaller contrastat 4.5 μm (Aobs = 0.352 ± 0.03114) than other hot Jupiterswith higher levels of incident flux (e.g., WASP-12b and WASP-18b; Cowan et al. 2012; Maxted et al. 2013, respectively),consistent with the idea that this temperature contrast is drivenby insolation (Perez-Becker & Showman 2013) as the radiativetime constant decreases with increasing temperature (Showman& Guillot 2002). However, the only day-night temperaturecontrast measurements that exist for HD 209458b are at 4.5 μm(presented here) and an upper-limit at 8 μm (Cowan et al. 2007).Thus full-orbit phase curve measurements both at additionalwavelengths, such as 3.6 μm, and for other targets are necessaryto confirm the hypothesis of Perez-Becker & Showman (2013).
In addition, HD 209458b’s phase curve suggests that thenightside is much cooler than predicted by Showman et al.(2009). Yet, while the location of the 1× and 3× solar abun-dance inversion phase curve minima (Showman et al. 2009)more closely agree with our observations compared to the noinversion model, the GCM overestimates the nightside flux,thereby underestimating the total day-to-night temperature con-trast (ΔTGCM ≈ 300 K versus ΔTobs = 527 ± 46 K). TheShowman et al. (2009) models similarly overpredictHD 189733b’s nightside emission compared to Spitzer/IRACfull phase observations by Knutson et al. (2012). This dis-crepancy is attributed to disequilibrium carbon chemistry notincluded in the GCM, in particular quenching, which wouldincrease the abundances of CO and CH4 at higher altitudesso that measurements would be probing a comparably higheroptically thick layer with cooler temperatures. In the
14 Aobs = (fluxday − fluxnight)/fluxday (Perez-Becker & Showman 2013).
7
The Astrophysical Journal, 790:53 (9pp), 2014 July 20 Zellem et al.
HD 209458b abundance profiles of Showman et al. (2009) andMoses et al. (2011), the vertical CO abundance profile is drivenby chemical equilibrium, resulting in a relatively constant mix-ing ratio from 10 to 10−8 bars. Therefore vertical quenchingof CO would have a minimal effect on its abundance profile,suggesting that vertical quenching of CO is likely not the cul-prit for HD 209458b’s cooler observed nightside. However, theMoses et al. (2011) abundance profiles of CH4 suggest thatvertical quenching can increase the CH4 abundance by nearlyan order of magnitude from 1 to 10−5 bars compared to theequilibrium-driven Showman et al. (2009) profiles. This addi-tional CH4 could potentially help radiate heat and result in anoverall cooler nightside than predicted by the GCM. To de-termine if quenched CH4 is causing the nightside cooling, weare in the process of measuring HD 209458b’s full-orbit phasecurve at 3.6 μm, which overlaps the CH4 ν3 band. Analyses ofthese data with future GCM studies, which include both non-equilibrium chemistry and new hot CH4 line lists (Yurchenko &Tennyson 2014), will better constrain the properties of these twocarbon-bearing species and the nightside cooling mechanism.
5. CONCLUSIONS
Here we present the first measurements of HD 209458b’s4.5 μm full-orbit phase curve using Spitzer/IRAC. Our dataindicate 0.69σ agreement with a previous primary transit depthby Beaulieu et al. (2010) and revise HD 209458b’s secondaryeclipse emission measurement by Knutson et al. (2010) down-ward by ∼35%, potentially weakening the evidence for a day-side temperature inversion. The phase-curve observations sug-gest both a hot spot shifted eastward of the substellar point anda day-to-night temperature contrast smaller than that of morehighly irradiated hot Jupiters, suggesting that this contrast maybe driven by the incident stellar flux. The shape of the phasecurve, specifically the location and brightness temperature ofthe hot spot, suggests that HD 209458b could have a daysideinversion at a pressure level that is between that predicted bynon-inversion models and that predicted by TiO and VO inducedthermal inversion models (�0.008 bar) (Showman et al. 2009).However, new GCMs that include non-equilibrium chemistryand hot CH4 lines (Yurchenko & Tennyson 2014) are neces-sary not only to confirm this hypothesis but also determinewhy HD 209458b’s nightside is cooler than previously pre-dicted. Thus, while we cannot draw any strong conclusions onHD 209458b’s thermal inversion, we hope to better constrainthe existence of a thermal inversion with upcoming full-orbitphase curve observations at 3.6 μm and eclipse mapping at both3.6 and 4.5 μm.
R.Z. and C.A.G. are supported by the NASA PlanetaryAtmospheres Program.
N.K.L. performed this work in part under contract with theCalifornia Institute of Technology (Caltech) funded by NASAthrough the Sagan Fellowship Program executed by the NASAExoplanet Science Institute.
A.P.S. is supported by the NASA Origins program.R.Z. would like to thank Travis Barman, Ian J. M. Crossfield,
Julien de Wit, Davin Flateau, Joe Giacalone, Tiffany Kataria,Michael R. Line, Julianne I. Moses, Kyle A. Pearson, EmilyRauscher, Tamara M. Rogers, David K. Sing, and Mark R. Swainfor their helpful discussions.
We would like to thank the two referees for their helpfulcomments and suggestions.
REFERENCES
Agol, E., Cowan, N. B., Knutson, H. A., et al. 2010, ApJ, 721, 1861Ballard, S., Charbonneau, D., Deming, D., et al. 2010, PASP, 122, 1341Bean, J. L., Benedict, G. F., Charbonneau, D., et al. 2008, A&A, 486, 1039Beaulieu, J. P., Kipping, D. M., Batista, V., et al. 2010, MNRAS, 409, 963Beerer, I. M., Knutson, H. A., Burrows, A., et al. 2011, ApJ, 727, 23Borucki, W. J., Koch, D., Jenkins, J., et al. 2009, Sci, 325, 709Burrows, A., Hubeny, I., Budaj, J., Knutson, H. A., & Charbonneau, D.
2007, ApJL, 668, L171Burrows, A. S. 2014, PNAS, in pressCarter, J. A., & Winn, J. N. 2009, ApJ, 704, 51Charbonneau, D., Brown, T. M., Latham, D. W., & Mayor, M. 2000, ApJL,
529, L45Charbonneau, D., Knutson, H. A., Barman, T., et al. 2008, ApJ, 686, 1341Cooper, C. S., & Showman, A. P. 2005, ApJL, 629, L45Cooper, C. S., & Showman, A. P. 2006, ApJ, 649, 1048Cowan, N. B., & Agol, E. 2008, ApJL, 678, L129Cowan, N. B., Agol, E., & Charbonneau, D. 2007, MNRAS, 379, 641Cowan, N. B., Machalek, P., Croll, B., et al. 2012, ApJ, 747, 82Crossfield, I. J. M., Knutson, H., Fortney, J., et al. 2012, ApJ, 752, 81Deming, D., Seager, S., Richardson, L. J., & Harrington, J. 2005, Natur,
434, 740Deming, D., Wilkins, A., McCullough, P., et al. 2013, ApJ, 774, 95Desert, J.-M., Vidal-Madjar, A., Lecavelier Des Etangs, A., et al. 2008, A&A,
492, 585Dobbs-Dixon, I., Agol, E., & Burrows, A. 2012, ApJ, 751, 87Dobbs-Dixon, I., & Lin, D. N. C. 2008, ApJ, 673, 513Eddy, J. A. 2009, The Sun, the Earth and Near-Earth Space: A Guide to the
Sun-Earth System (Washington, DC: NASA)Fazio, G. G., Hora, J. L., Allen, L. E., et al. 2004, ApJS, 154, 10Ford, E. B. 2005, AJ, 129, 1706Fortney, J. J., Lodders, K., Marley, M. S., & Freedman, R. S. 2008, ApJ,
678, 1419Gary, B. L., Hebb, L. H., Foote, J. L., et al. 2012, SASS, 31, 17Gelman, A., & Rubin, D. B. 1992, StaSc, 7, 457Gillon, M., Pont, F., Moutou, C., et al. 2006, A&A, 459, 249Harrington, J., Hansen, B. M., Luszcz, S. H., et al. 2006, Sci, 314, 623Hayek, W., Sing, D., Pont, F., & Asplund, M. 2012, A&A, 539, A102Heng, K., Frierson, D. M. W., & Phillipps, P. J. 2011a, MNRAS, 418, 2669Heng, K., Menou, K., & Phillipps, P. J. 2011b, MNRAS, 413, 2380Henry, G. W., Marcy, G. W., Butler, R. P., & Vogt, S. S. 2000, ApJL,
529, L41Jenkins, J. M., Caldwell, D. A., & Borucki, W. J. 2002, ApJ, 564, 495Kipping, D. M. 2008, MNRAS, 389, 1383Kipping, D. M., & Tinetti, G. 2010, MNRAS, 407, 2589Knutson, H. A., Charbonneau, D., Allen, L. E., Burrows, A., & Megeath, S. T.
2008, ApJ, 673, 526Knutson, H. A., Charbonneau, D., Allen, L. E., et al. 2007, Natur, 447, 183Knutson, H. A., Charbonneau, D., Cowan, N. B., et al. 2009a, ApJ, 703, 769Knutson, H. A., Charbonneau, D., Cowan, N. B., et al. 2009b, ApJ, 690, 822Knutson, H. A., Howard, A. W., & Isaacson, H. 2010, ApJ, 720, 1569Knutson, H. A., Lewis, N., Fortney, J. J., et al. 2012, ApJ, 754, 22Langton, J., & Laughlin, G. 2007, ApJL, 657, L113Langton, J., & Laughlin, G. 2008, ApJ, 674, 1106Laughlin, G., Marcy, G. W., Vogt, S. S., Fischer, D. A., & Butler, R. P.
2005, ApJL, 629, L121Lewis, N. K., Knutson, H. A., Showman, A. P., et al. 2013, ApJ, 766, 95Lewis, N. K., Showman, A. P., Fortney, J. J., et al. 2010, ApJ, 720, 344Line, M. R., Knutson, H., Wolf, A. S., & Yung, Y. L. 2014, ApJ, 783, 70MacDonald, G. J. F. 1964, RvGSP, 2, 467Madhusudhan, N., & Seager, S. 2009, ApJ, 707, 24Madhusudhan, N., & Seager, S. 2010, ApJ, 725, 261Mandel, K., & Agol, E. 2002, ApJL, 580, L171Markwardt, C. B. 2009, in ASP Conf. Ser. 411, Astron. Data Analysis Software
and Syst. XVIII, ed. D. A. Bohlender, D. Durand, & P. Dowler (SanFrancisco, CA: ASP), 251
Maxted, P. F. L., Anderson, D. R., Doyle, A. P., et al. 2013, MNRAS, 428, 2645Mazeh, T., Naef, D., Torres, G., et al. 2000, ApJL, 532, L55Menou, K., & Rauscher, E. 2009, ApJ, 700, 887Mighell, K. J. 2005, MNRAS, 361, 861Moses, J. I., Visscher, C., Fortney, J. J., et al. 2011, ApJ, 737, 15Muller, R. A., & Buffington, A. 1974, JOSA, 64, 1200Noyes, R. W., Hartmann, L. W., Baliunas, S. L., Duncan, D. K., & Vaughan,
A. H. 1984, ApJ, 279, 763Parmentier, V., Showman, A. P., & Lian, Y. 2013, A&A, 558, A91Peale, S. J. 1974, AJ, 79, 722
8
The Astrophysical Journal, 790:53 (9pp), 2014 July 20 Zellem et al.
Perez-Becker, D., & Showman, A. P. 2013, ApJ, 776, 134Perna, R., Heng, K., & Pont, F. 2012, ApJ, 751, 59Perna, R., Menou, K., & Rauscher, E. 2010, ApJ, 719, 1421Rauscher, E., & Menou, K. 2010, ApJ, 714, 1334Rauscher, E., & Menou, K. 2012, ApJ, 750, 96Rauscher, E., & Menou, K. 2013, ApJ, 764, 103Richardson, L. J., Deming, D., Horning, K., Seager, S., & Harrington, J.
2007, Natur, 445, 892Richardson, L. J., Deming, D., & Seager, S. 2003, ApJ, 597, 581Rogers, T. M., & Showman, A. P. 2014, ApJL, 782, L4Rowe, J. F., Matthews, J. M., Seager, S., et al. 2008, ApJ, 689, 1345Schwarz, E. 1978, AnSta, 6, 461Showman, A. P. 2008, Natur, 452, 296Showman, A. P., Cooper, C. S., Fortney, J. J., & Marley, M. S. 2008a, ApJ,
682, 559Showman, A. P., Cooper, C. S., Fortney, J. J., & Marley, M. S. 2008b, ApJ,
682, 559
Showman, A. P., Fortney, J. J., Lewis, N. K., & Shabram, M. 2013, ApJ,762, 24
Showman, A. P., Fortney, J. J., Lian, Y., et al. 2009, ApJ, 699, 564Showman, A. P., & Guillot, T. 2002, A&A, 385, 166Showman, A. P., & Polvani, L. M. 2011, ApJ, 738, 71Southworth, J. 2008, MNRAS, 386, 1644Spiegel, D. S., Silverio, K., & Burrows, A. 2009, ApJ, 699, 1487Swain, M. R., Bouwman, J., Akeson, R. L., Lawler, S., & Beichman, C. A.
2008, ApJ, 674, 482Swain, M. R., Tinetti, G., Vasisht, G., et al. 2009, ApJ, 704, 1616Todorov, K. O., Deming, D., Knutson, H. A., et al. 2012, ApJ, 746, 111Torres, G., Winn, J. N., & Holman, M. J. 2008, ApJ, 677, 1324Werner, M. W., Roellig, T. L., Low, F. J., et al. 2004, ApJS, 154, 1Winn, J. N., Holman, M. J., Torres, G., et al. 2008, ApJ, 683, 1076Winn, J. N., Noyes, R. W., Holman, M. J., et al. 2005, ApJ, 631, 1215Wittenmyer, R. A., Welsh, W. F., Orosz, J. A., et al. 2005, ApJ, 632, 1157Yurchenko, S. N., & Tennyson, J. 2014, MNRAS, 440, 1649
9


![The Origin of [C ii] 157 μm Emission in a Five-component … · 2017. 6. 6. · 7 Department of Physics and Astronomy, University College London ... San Diego, CA 92110, USA 11 Spitzer](https://static.fdocument.org/doc/165x107/60c2b53c5ea1ee092717ff90/the-origin-of-c-ii-157-m-emission-in-a-five-component-2017-6-6-7-department.jpg)