Team 12 Amelia House Paul Jaffa Johanna Miller Brian Ortega.
41
Team 12 Amelia House Paul Jaffa Johanna Miller Brian Ortega
-
date post
22-Dec-2015 -
Category
Documents
-
view
220 -
download
3
Transcript of Team 12 Amelia House Paul Jaffa Johanna Miller Brian Ortega.

Team 12Amelia House
Paul JaffaJohanna MillerBrian Ortega
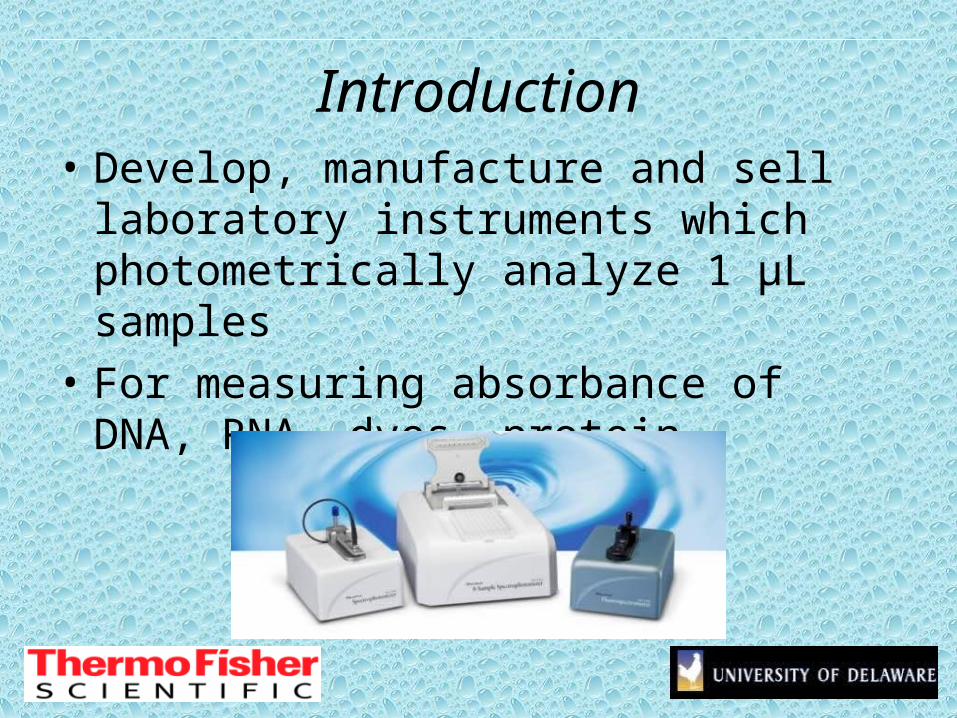
Introduction• Develop, manufacture and sell laboratory
instruments which photometrically analyze 1 μL samples
• For measuring absorbance of DNA, RNA, dyes, protein
Current Procedure• Fill syringe with product
• Use compressed air to dispense into 2mL vials
• Time consuming, significant waste, expensive
• Very viscous material

Objective
Project Goal
To design and develop a device that
will fill and label 2 mL vials with a
cleaning substance while eliminating
tedious tasks and to provide a more
efficient system
Project Scope
• Original scope intended for a completely automated system that:– Filled vials– Capped vials– Labeled vials
• Redefined scope as filling vials for project
Customer Wants
1. A higher output of vials 2. Easier to Fill the container than
Current Method (Syringe)3. Minimize Operator Handling Time4. Minimize the product waste 5. Fit on a Desk Top 6. Have a Labeling Process
Background Research
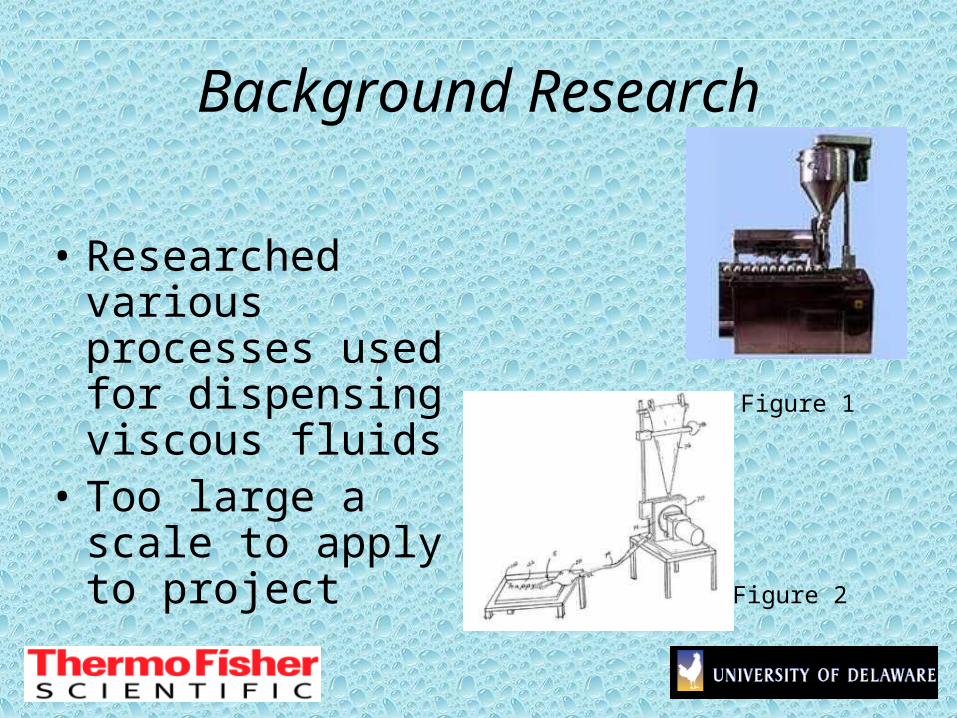
• Researched various processes used for dispensing viscous fluids
• Too large a scale to apply to project
Figure 1
Figure 2
Metrics and Target Values
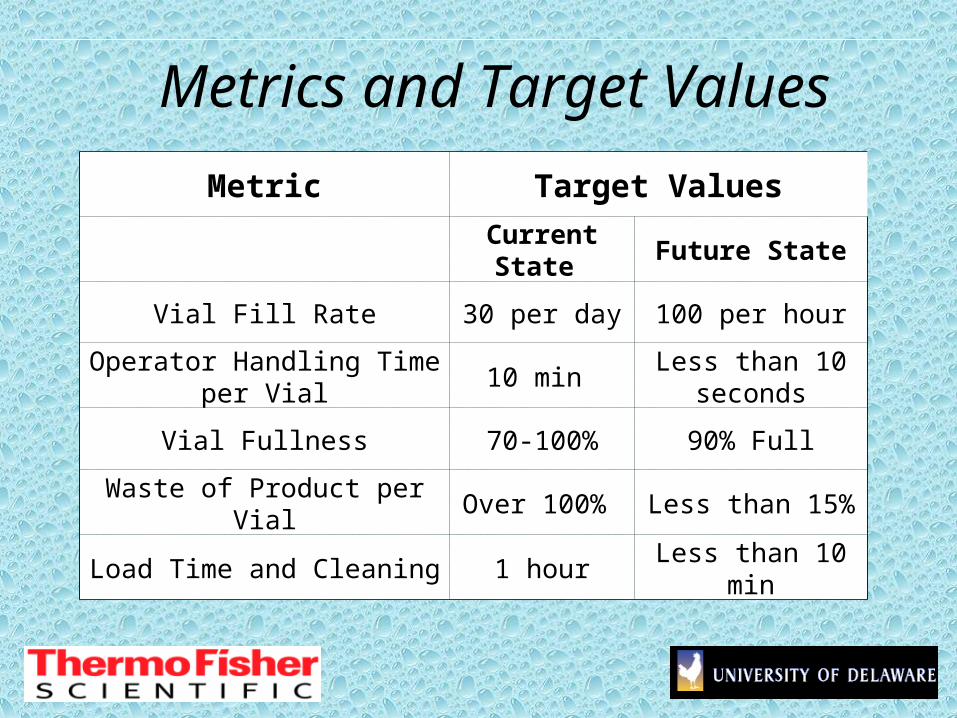
Metric Target Values
Current State Future State
Vial Fill Rate 30 per day 100 per hour
Operator Handling Time per Vial 10 min Less than 10 seconds
Vial Fullness 70-100% 90% Full
Waste of Product per Vial Over 100% Less than 15%
Load Time and Cleaning 1 hour Less than 10 min
Initial Concepts
• Implement gravity and pressure
• Utilize shipping container as pressure vessel
• Peristaltic pump
• Heating to reduce the viscosity of the product
Initial Concepts
• Implement gravity and pressure
• Utilize shipping container as pressure vessel
• Peristaltic pump
• Heating to reduce the viscosity of the product
Concept Selection & Description
•Heating is advantageous – proved by experimentation
• Viscosity at 70° F = 4500 mPa*s• Viscosity at 130° F = 100 mPa*s
•Gravity for dispensing•Controls through PLC and current LabView system
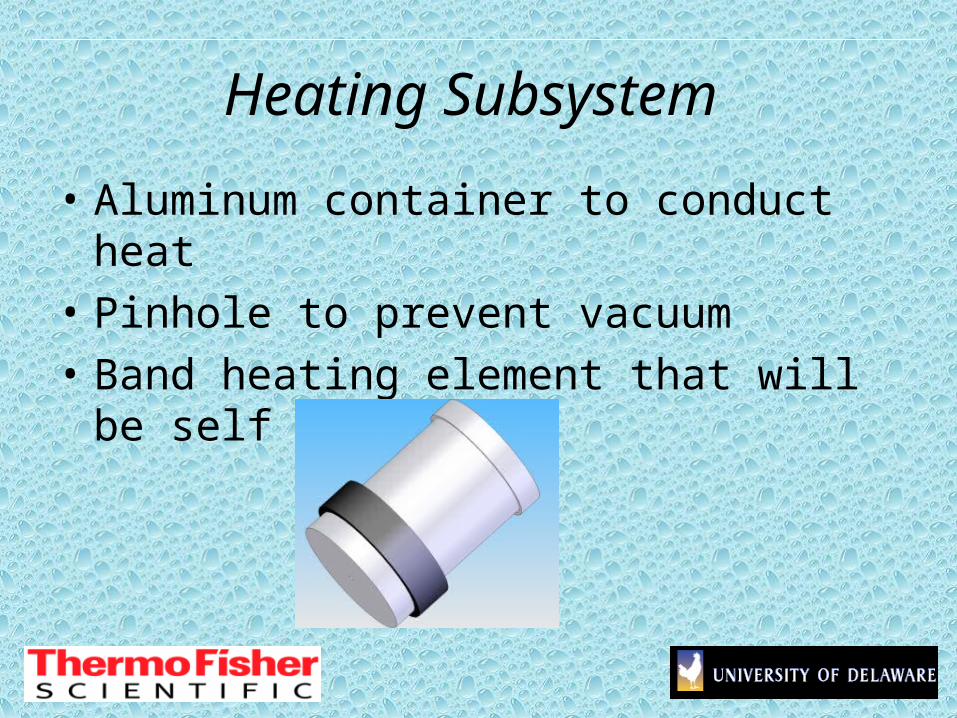
Heating Subsystem
• Aluminum container to conduct heat
• Pinhole to prevent vacuum
• Band heating element that will be self controlled
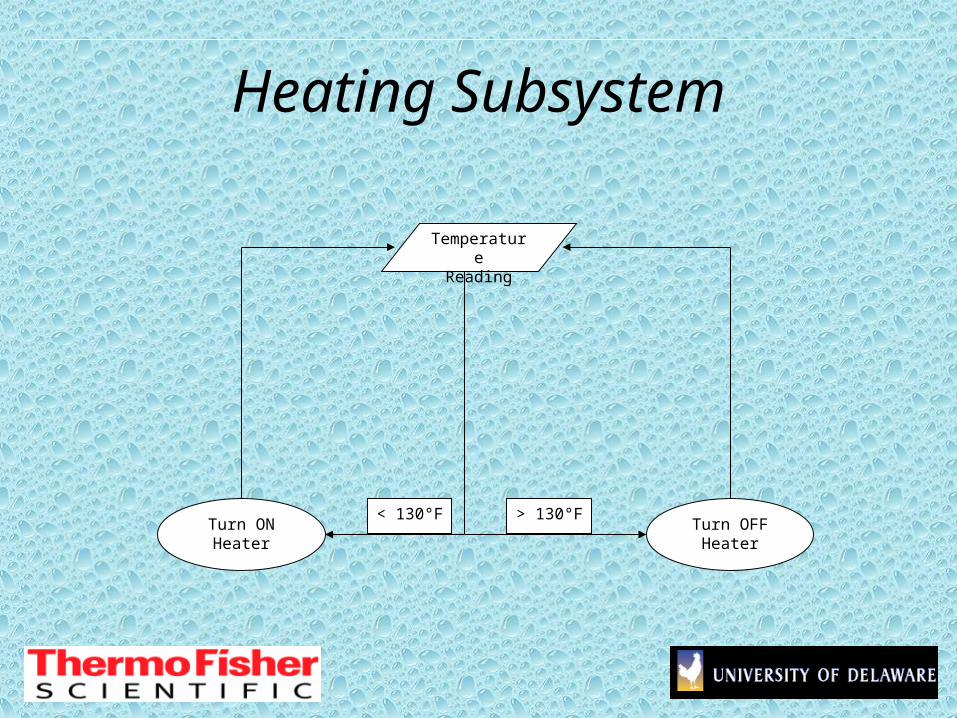
Heating Subsystem
TemperatureReading
< 130°F > 130°FTurn ONHeater
Turn OFFHeater
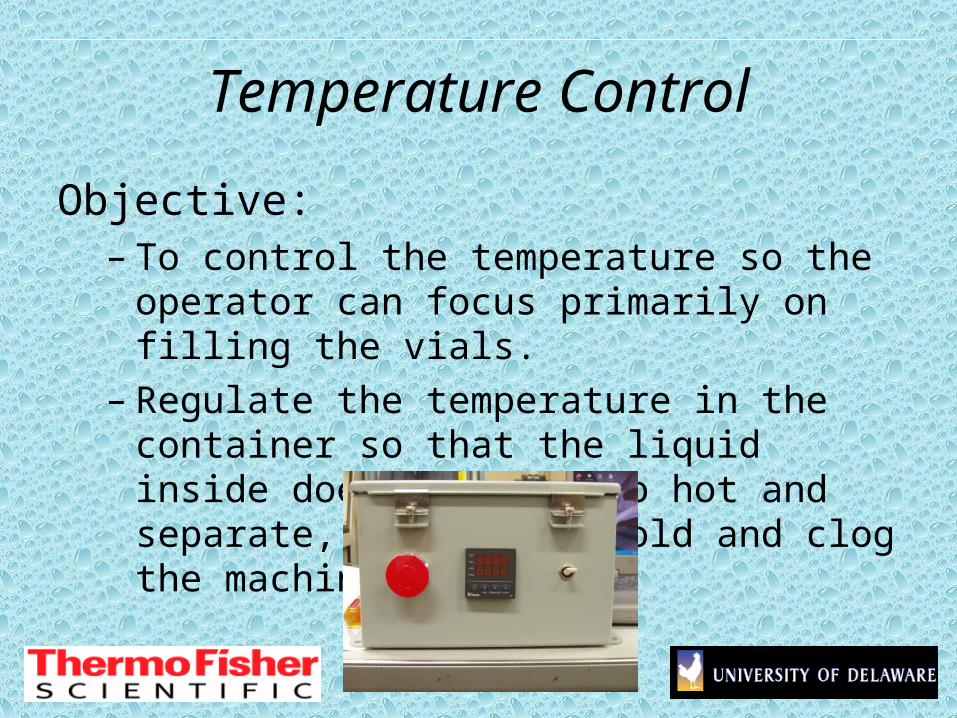
Temperature Control
Objective:– To control the temperature so the operator can
focus primarily on filling the vials.– Regulate the temperature in the container so that
the liquid inside does not get too hot and separate, or get too cold and clog the machine.
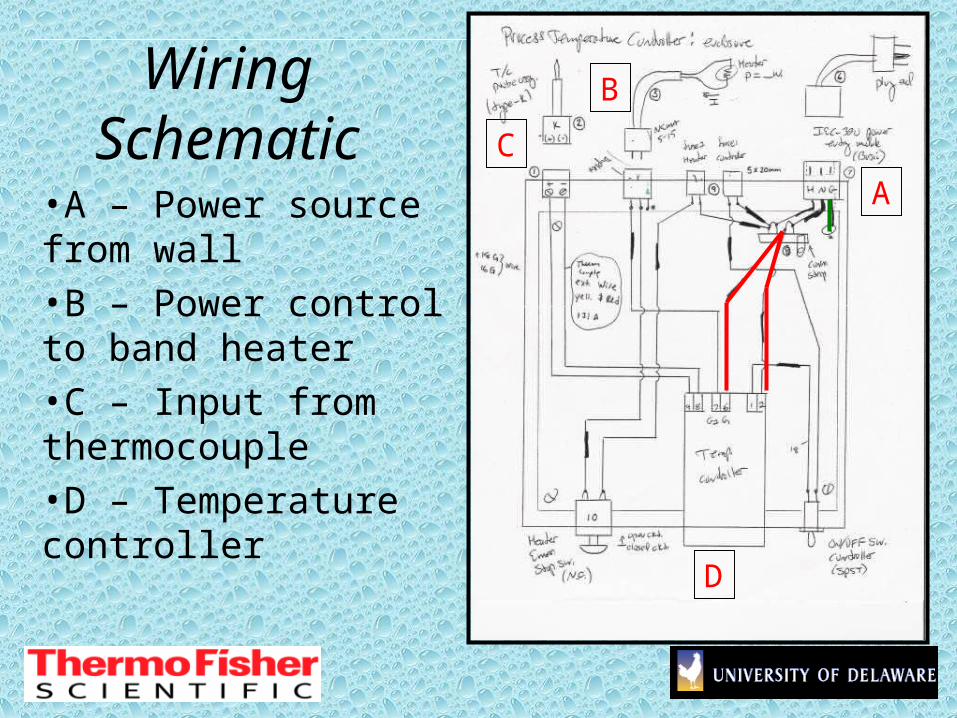
Wiring Schematic
•A – Power source from wall
•B – Power control to band heater
•C – Input from thermocouple
•D – Temperature controller
A
B
C
D
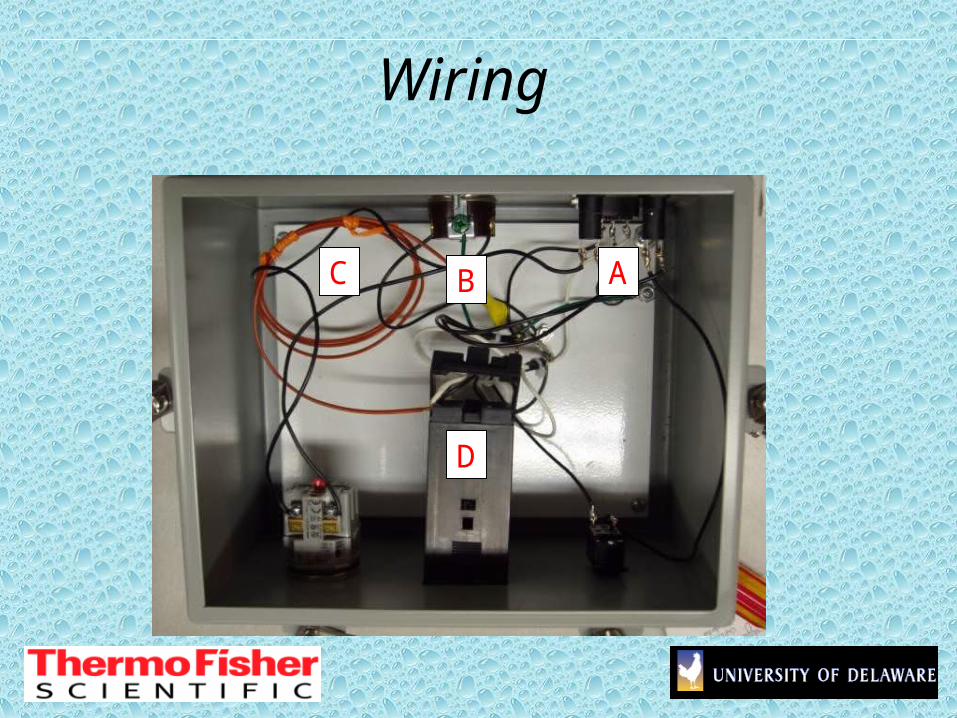
Wiring
ABC
D
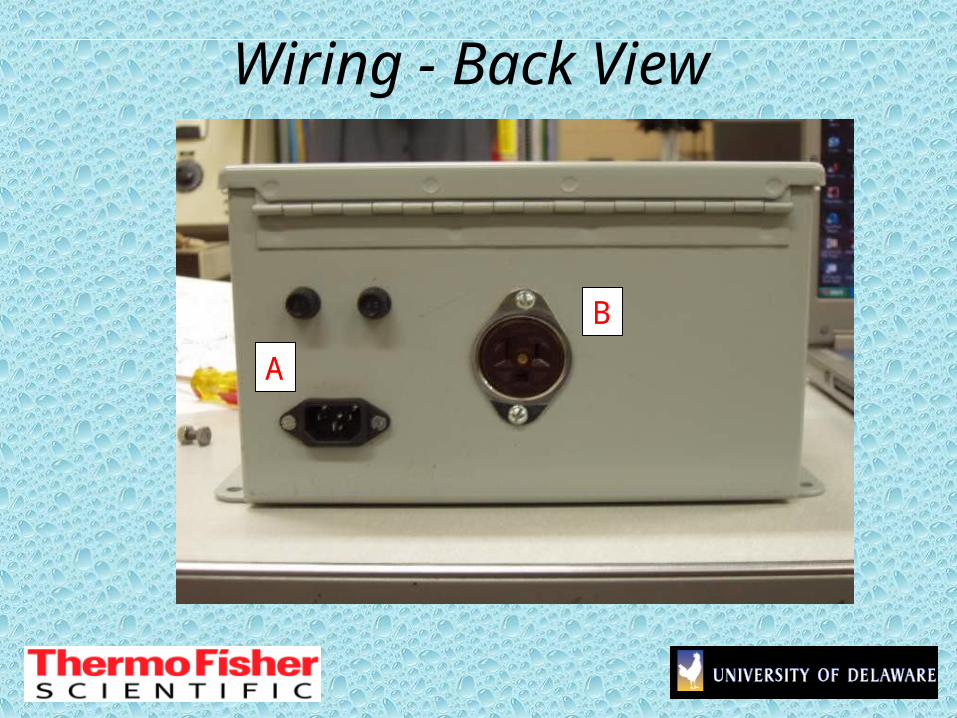
Wiring - Back View
A
B
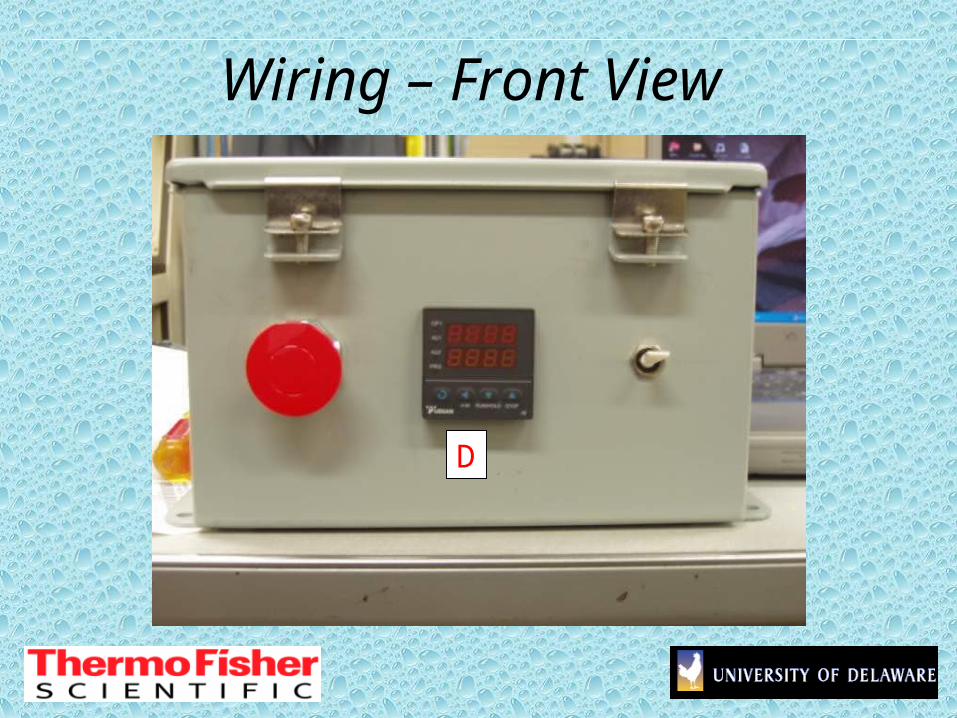
Wiring – Front View
D
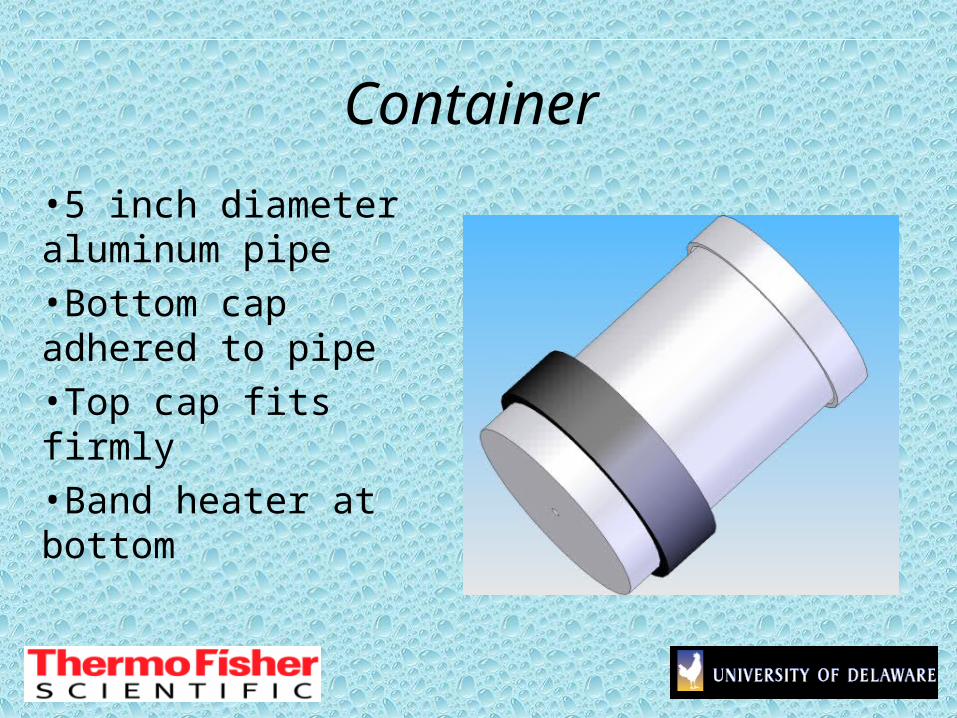
Container
•5 inch diameter aluminum pipe
•Bottom cap adhered to pipe
•Top cap fits firmly
•Band heater at bottom
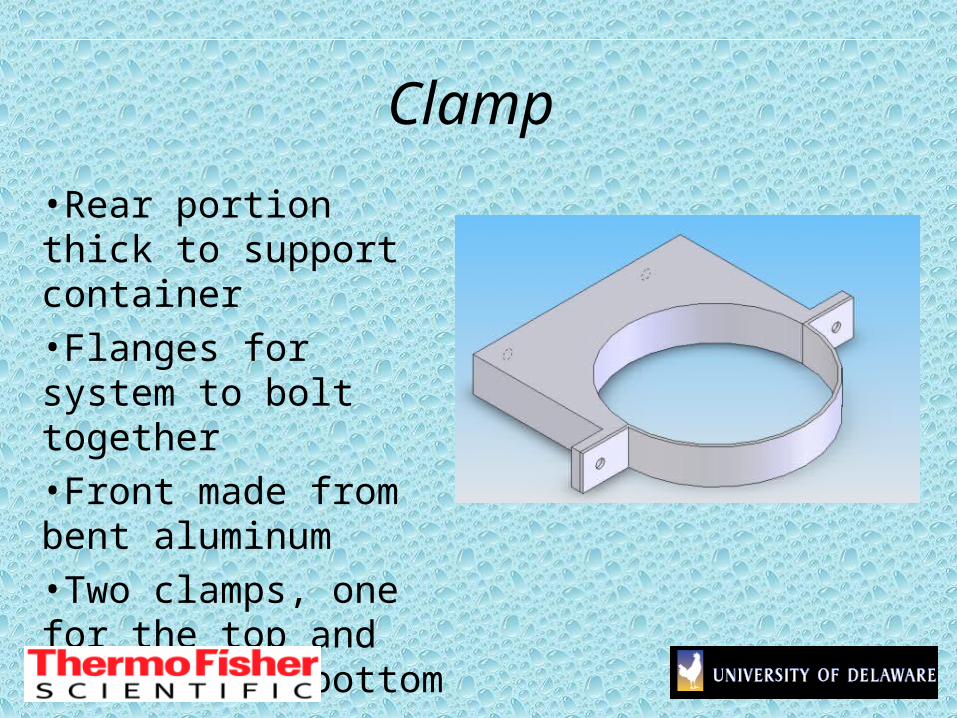
Clamp
•Rear portion thick to support container
•Flanges for system to bolt together
•Front made from bent aluminum
•Two clamps, one for the top and one for the bottom
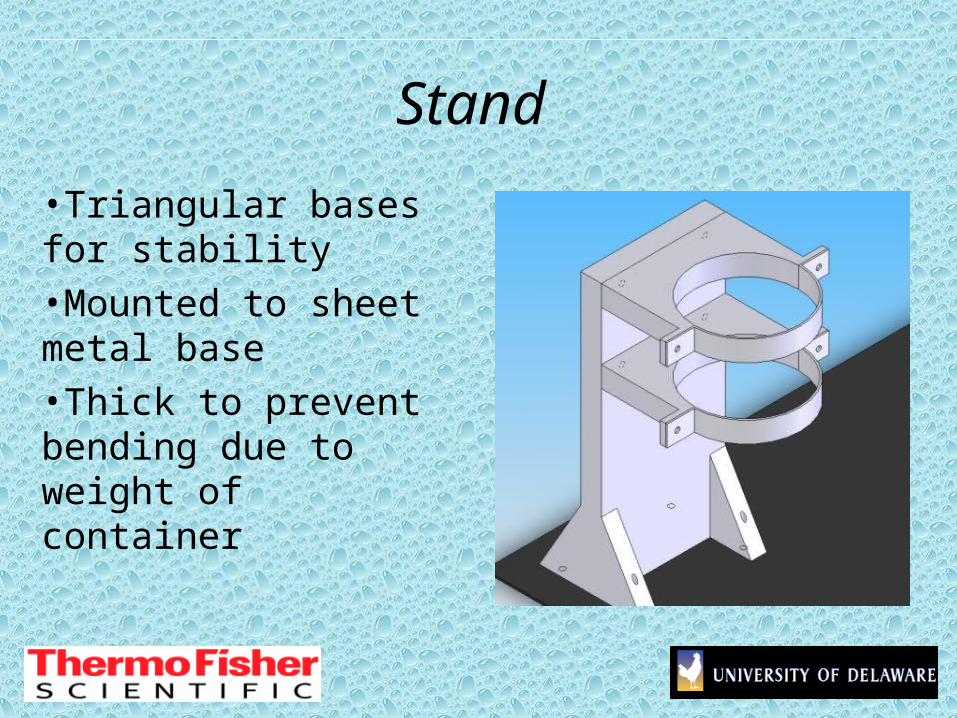
Stand
•Triangular bases for stability
•Mounted to sheet metal base
•Thick to prevent bending due to weight of container
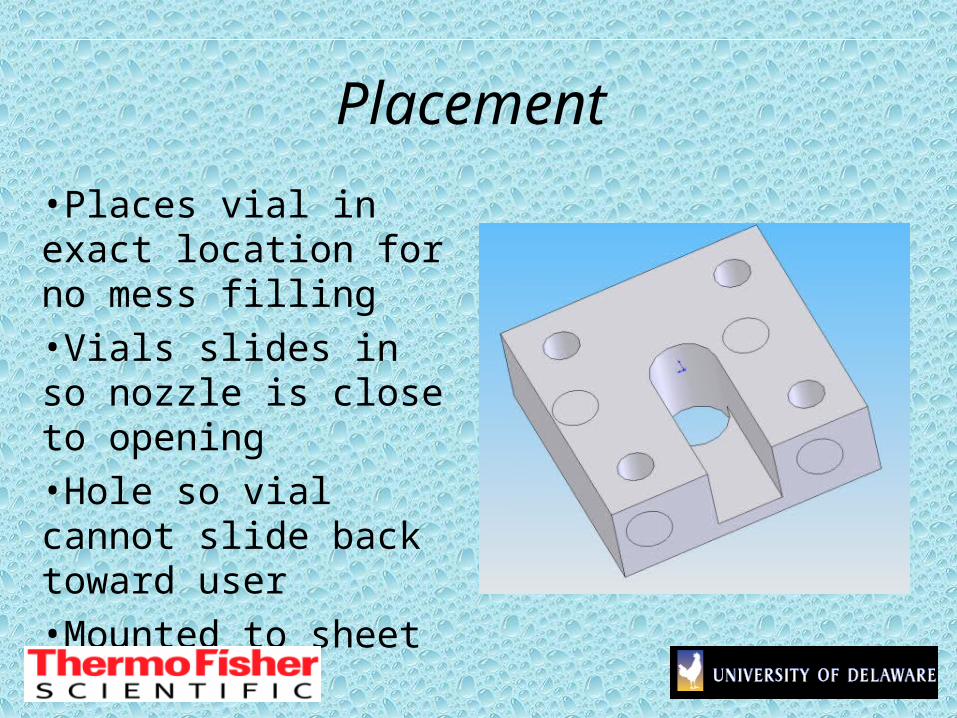
Placement
•Places vial in exact location for no mess filling
•Vials slides in so nozzle is close to opening
•Hole so vial cannot slide back toward user
•Mounted to sheet metal base
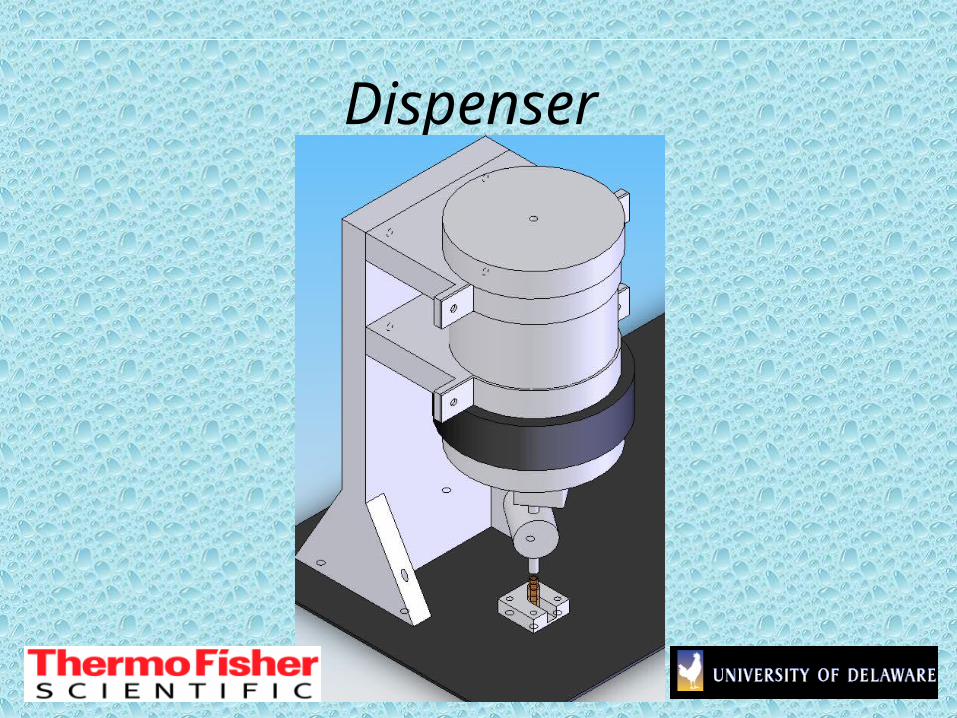
Dispenser
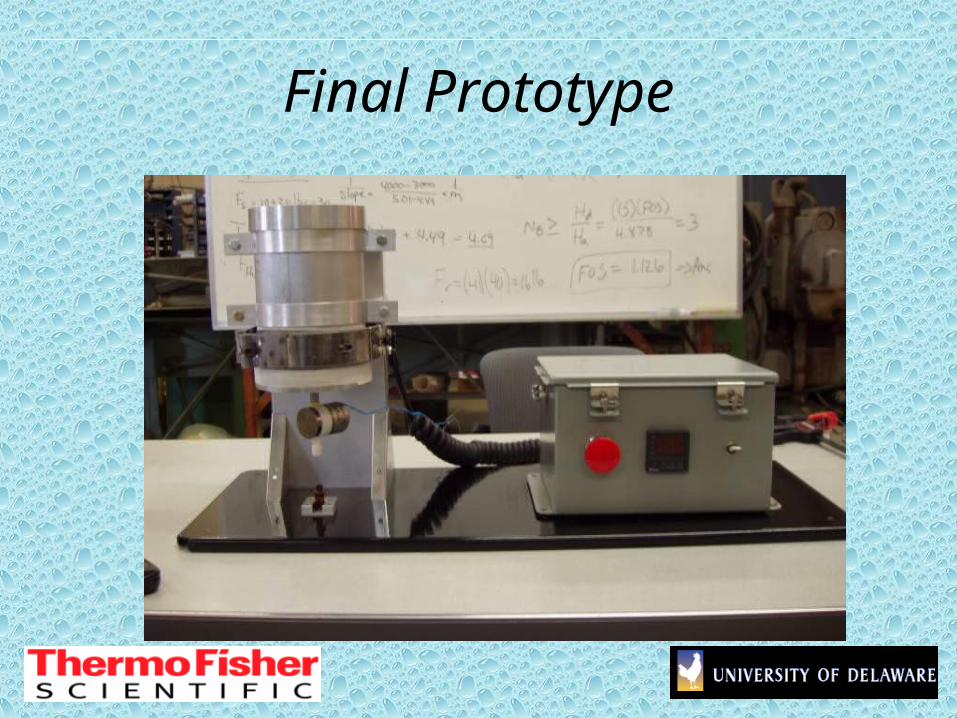
Final Prototype
Dispensing Subsystems
• Product placed in aluminum vat for dispensing
• Utilizes a valve and solenoid
• LabView Program developed to control valve

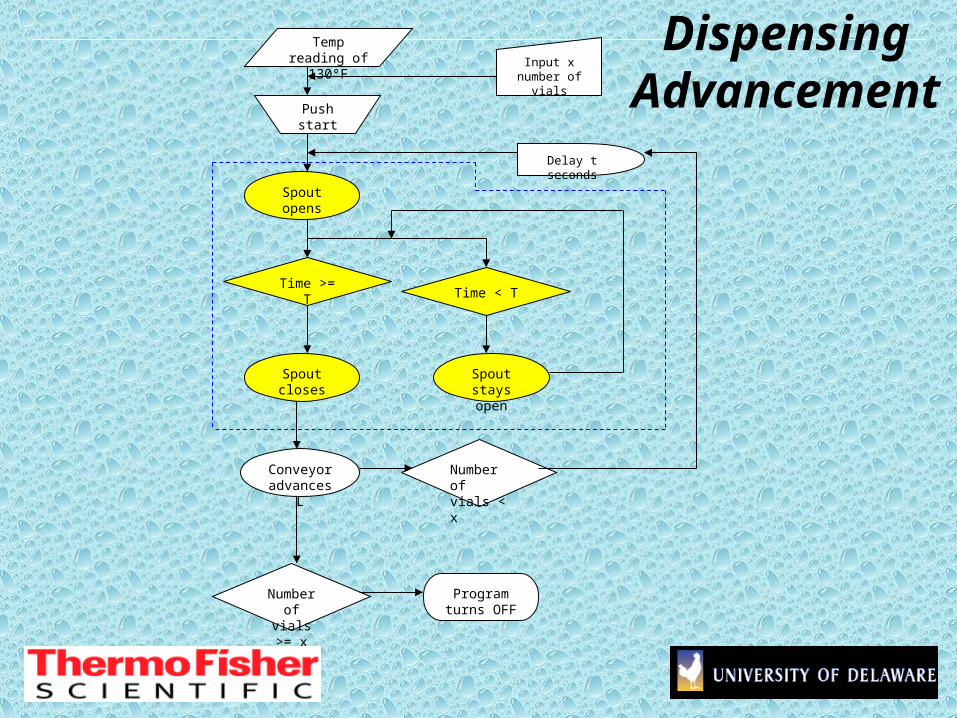
DispensingAdvancement
Temp reading of 130°F
Push start
Input x number of vials
Spout opens
Time < TTime >= T
Conveyor advances
L
Number of vials < x
Delay t seconds
Spout closes
Spout stays open
Number of vials
>= x
Program turns OFF
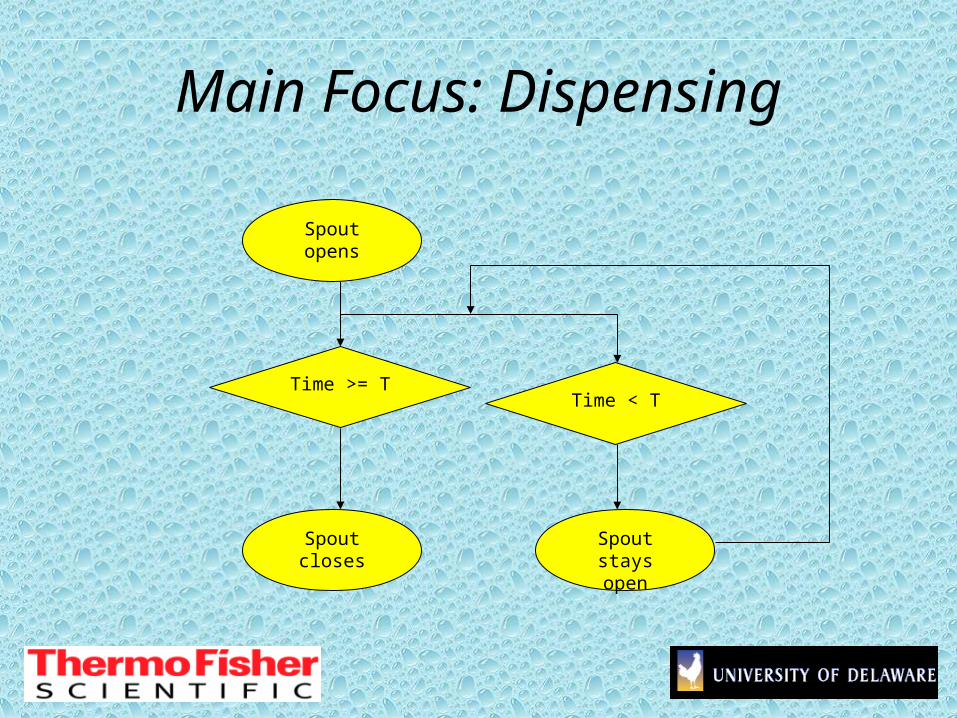
Main Focus: Dispensing
Spout opens
Time < TTime >= T
Spout closes Spout stays open
DispensingAdvancement
Temp reading of 130°F
Push start
Input x number of vials
Spout opens
Time < TTime >= T
Conveyor advances
L
Number of vials < x
Delay t seconds
Spout closes
Spout stays open
Number of vials
>= x
Program turns OFF
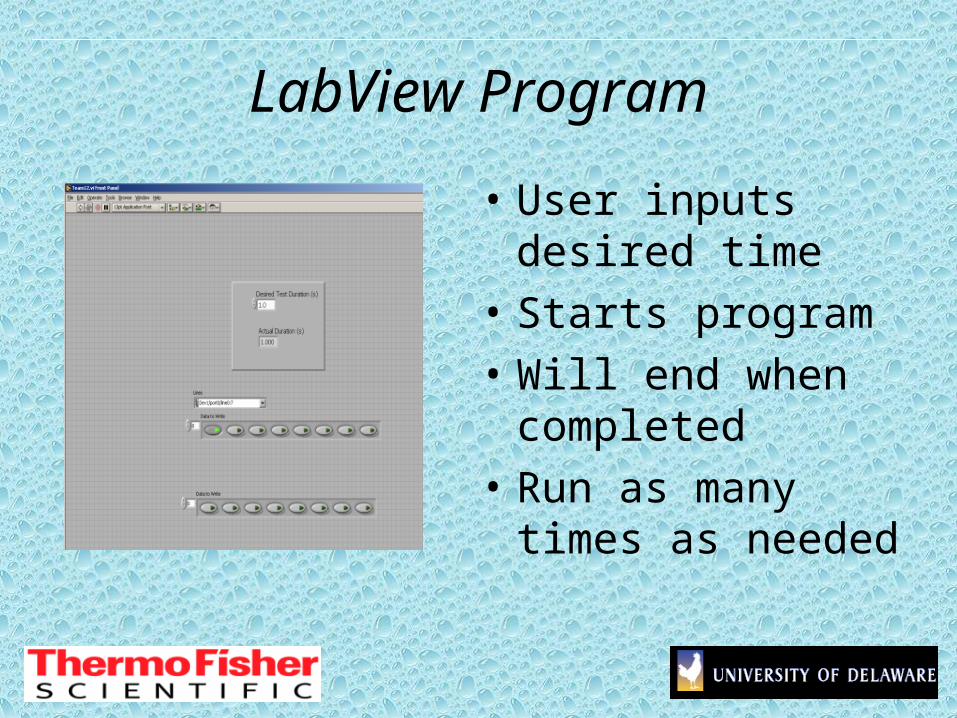
LabView Program
• User inputs desired time
• Starts program
• Will end when completed
• Run as many times as needed
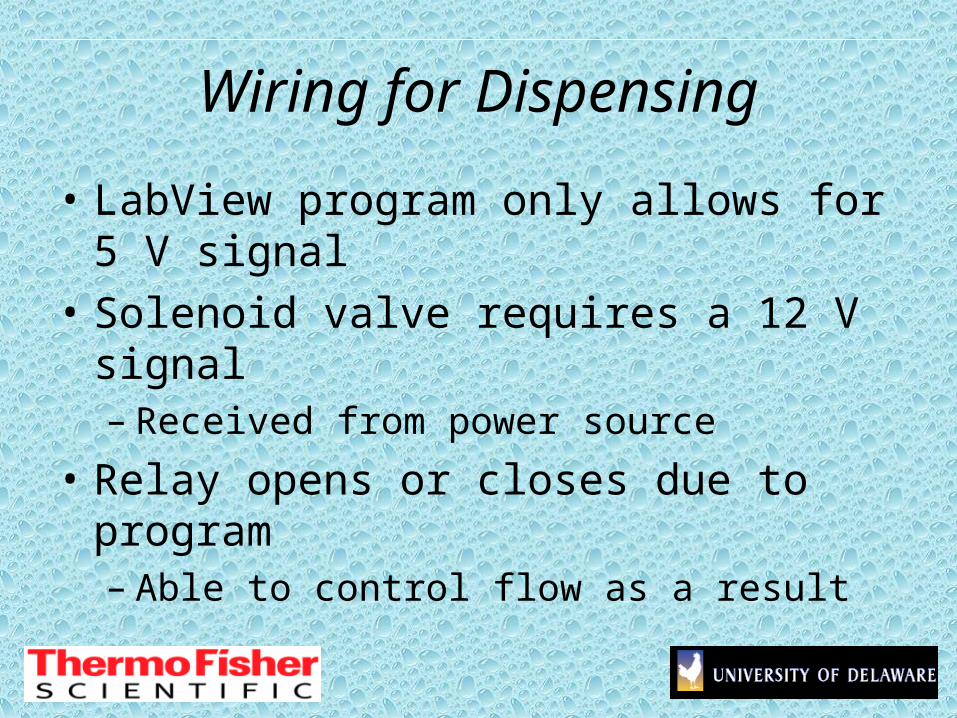
Wiring for Dispensing
• LabView program only allows for 5 V signal
• Solenoid valve requires a 12 V signal– Received from power source
• Relay opens or closes due to program– Able to control flow as a result
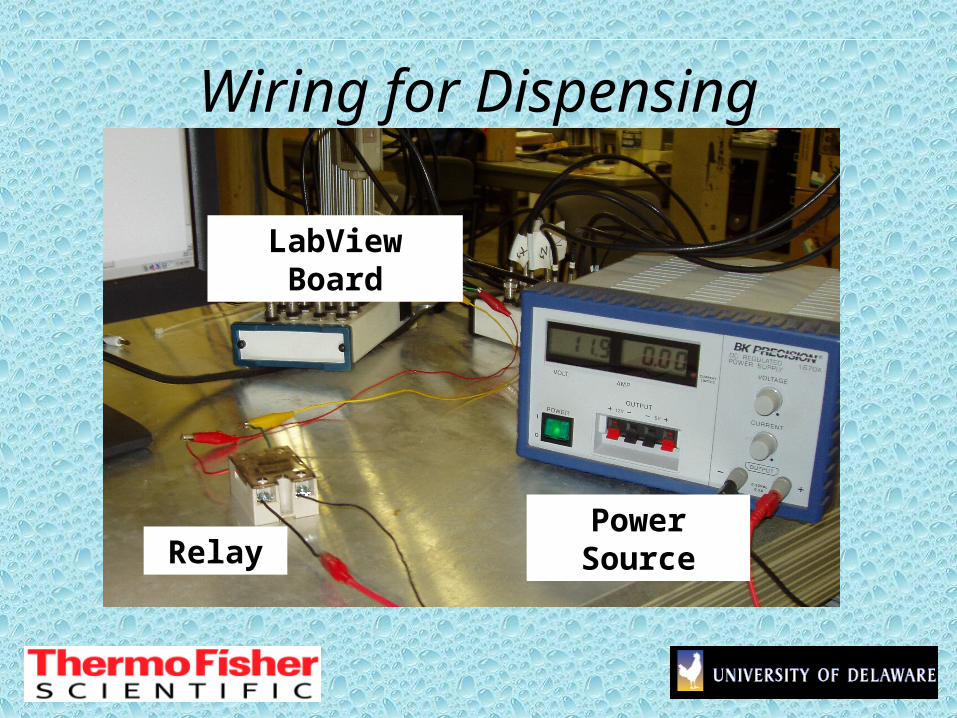
Wiring for Dispensing
Power SourceRelay
LabView Board
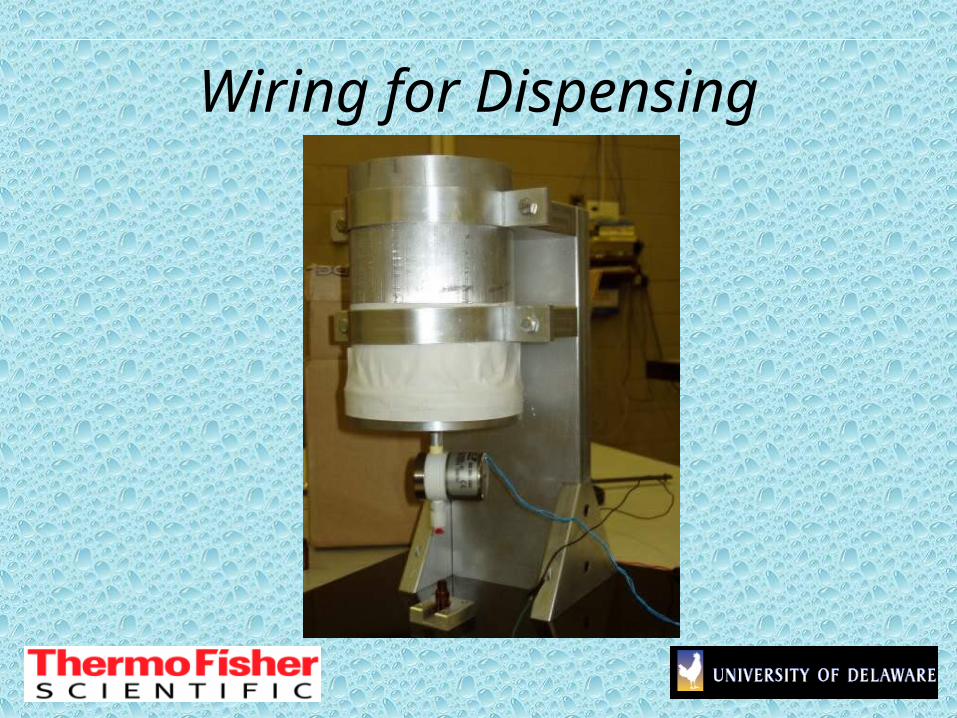
Wiring for Dispensing
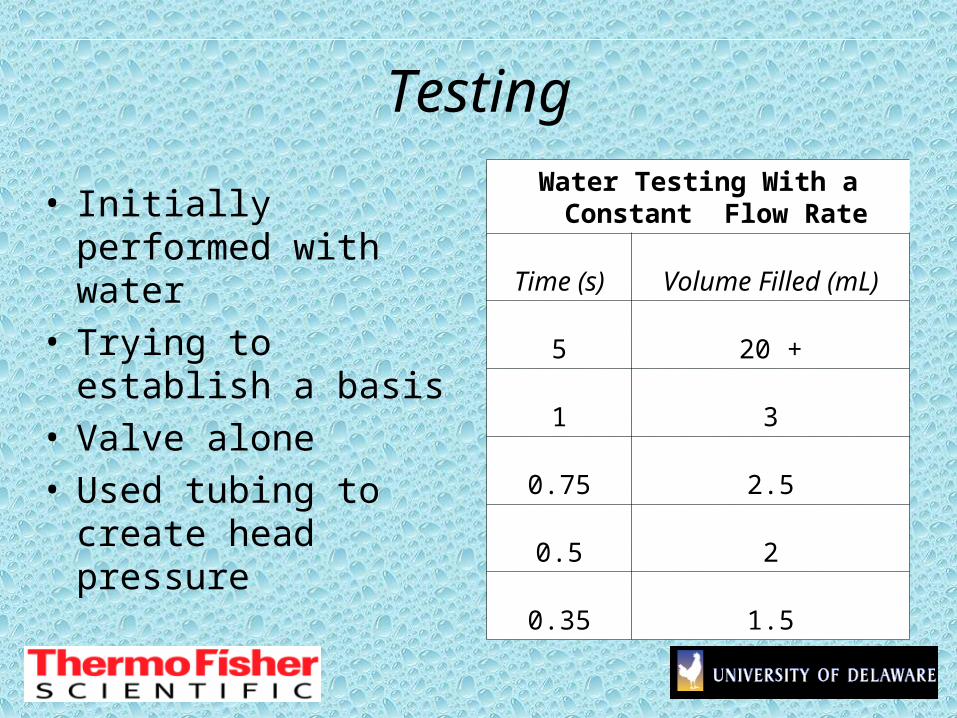
Testing
• Initially performed with water
• Trying to establish a basis
• Valve alone• Used tubing to create
head pressure
Water Testing With a Constant Flow Rate
Time (s) Volume Filled (mL)
5 20 +
1 3
0.75 2.5
0.5 2
0.35 1.5
Testing
• Testing determined that the valve suggested by the manufacturer did not yield desired results
• Plate vs. Pinch valve testing required– Current system is a plate valve
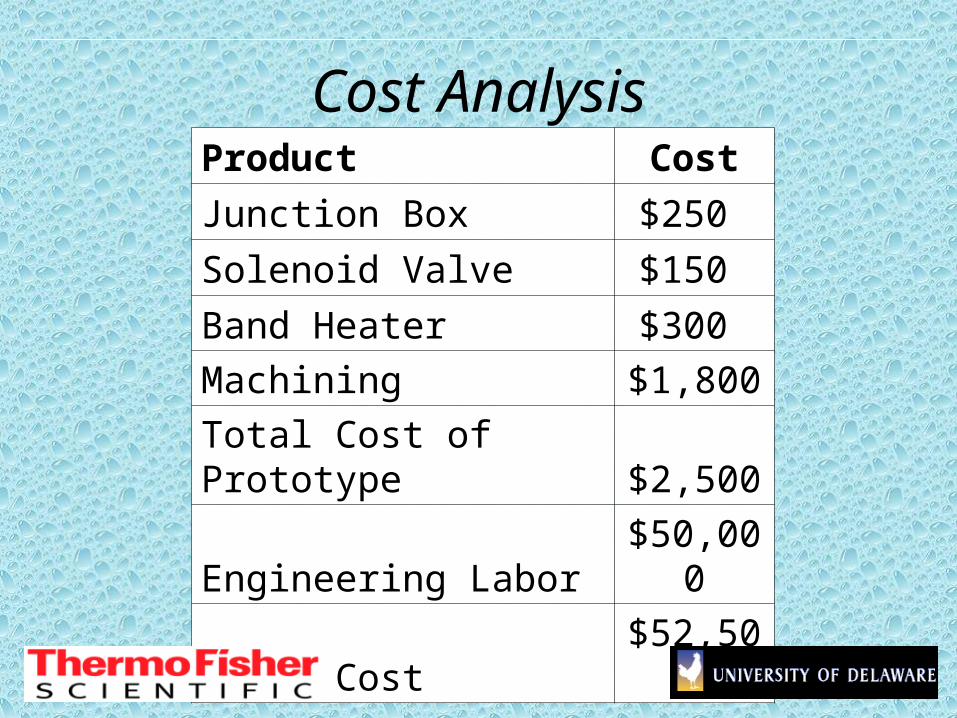
Cost AnalysisProduct Cost
Junction Box $250
Solenoid Valve $150
Band Heater $300
Machining $1,800
Total Cost of Prototype $2,500
Engineering Labor $50,000
Total Cost $52,500
Benefit to Customer
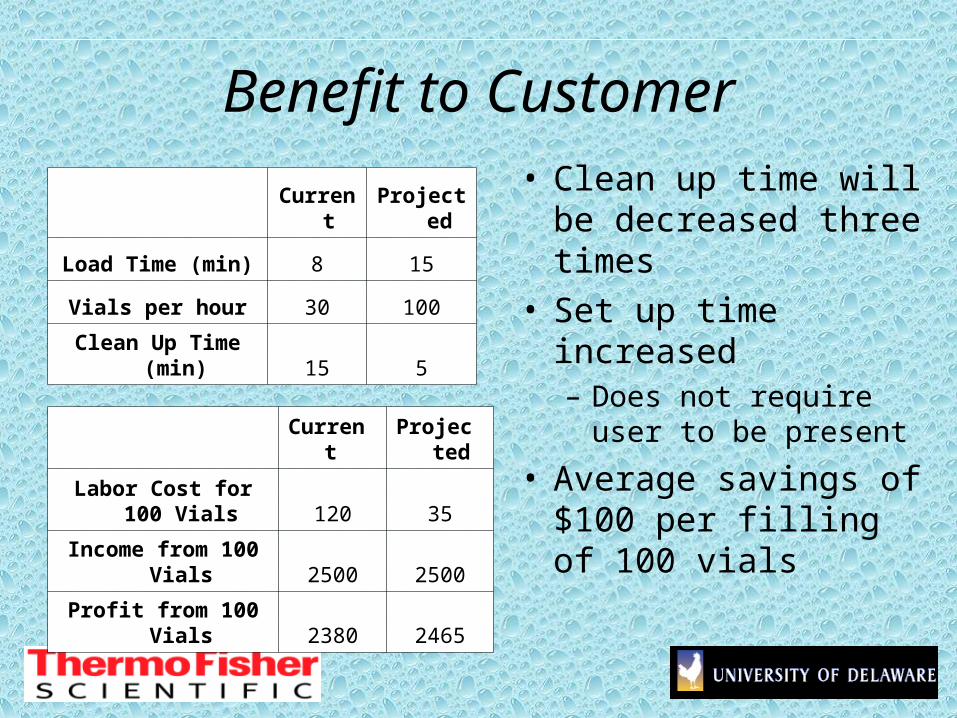
Current Projected
Load Time (min) 8 15
Vials per hour 30 100
Clean Up Time (min) 15 5
Current Projected
Labor Cost for 100 Vials 120 35
Income from 100 Vials 2500 2500
Profit from 100 Vials 2380 2465
• Clean up time will be decreased three times
• Set up time increased– Does not require user to
be present
• Average savings of $100 per filling of 100 vials
Benefit to Customer
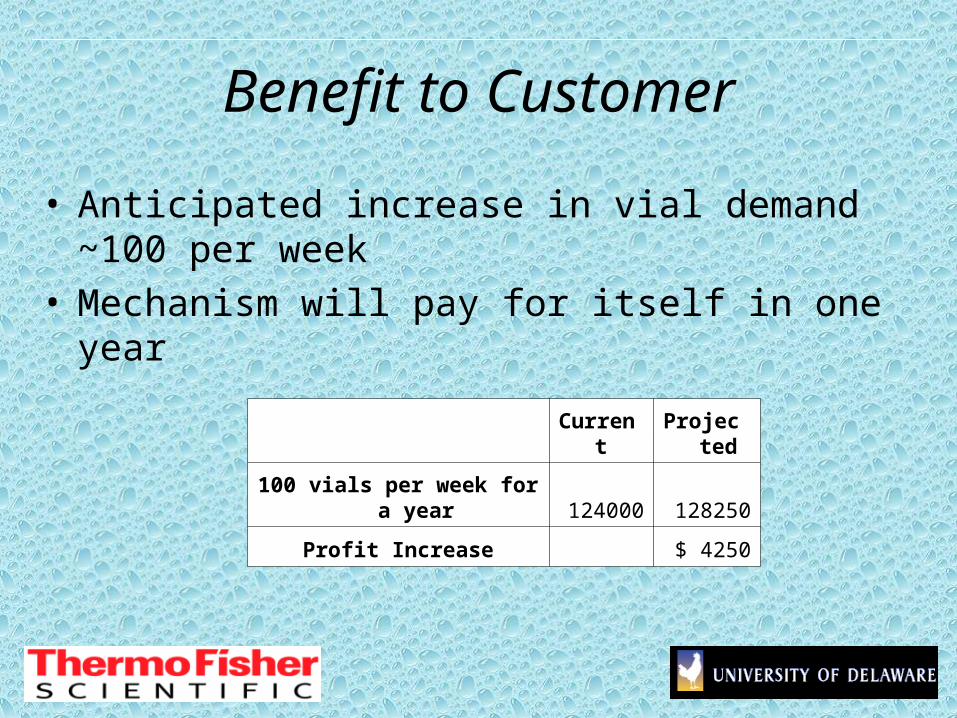
Current Projected
100 vials per week for a year 124000 128250
Profit Increase $ 4250
• Anticipated increase in vial demand ~100 per week• Mechanism will pay for itself in one year
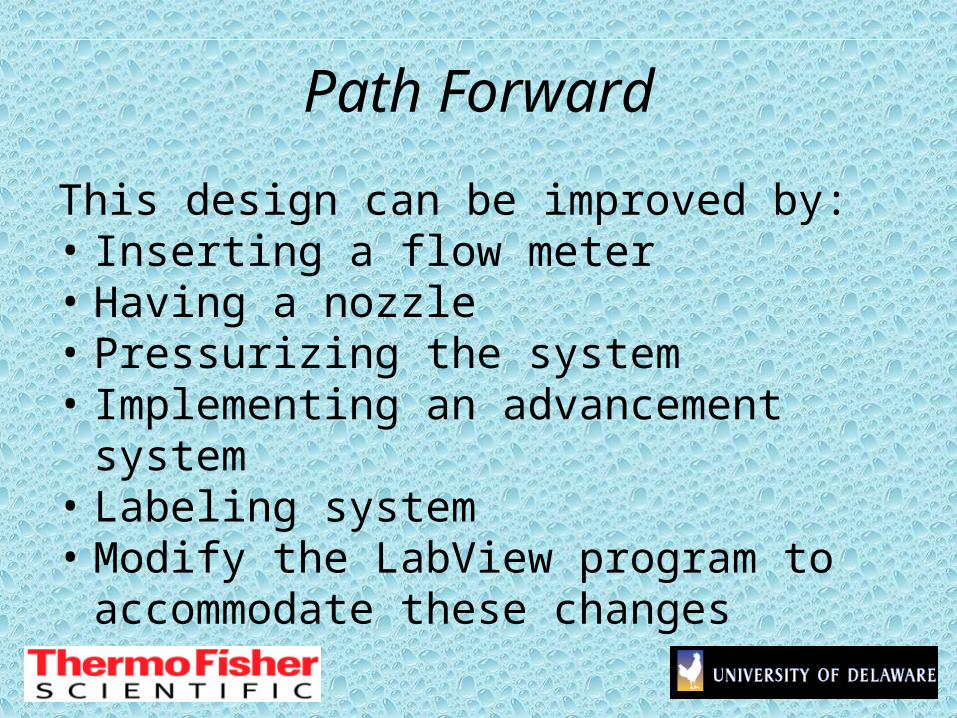
Path Forward
This design can be improved by:• Inserting a flow meter • Having a nozzle • Pressurizing the system• Implementing an advancement system • Labeling system• Modify the LabView program to
accommodate these changes
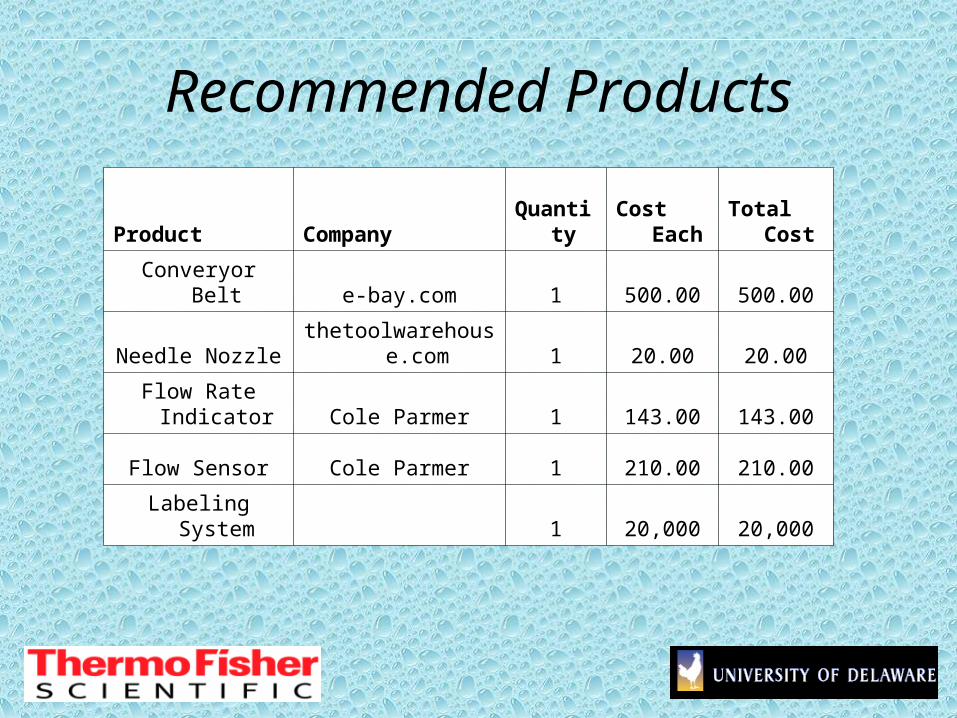
Recommended Products
Product Company Quantity Cost Each Total Cost
Converyor Belt e-bay.com 1 500.00 500.00
Needle Nozzle thetoolwarehouse.com 1 20.00 20.00
Flow Rate Indicator Cole Parmer 1 143.00 143.00
Flow Sensor Cole Parmer 1 210.00 210.00
Labeling System 1 20,000 20,000

Questions?