Syst. Biol. 56(1):1–16, 2007 ISSN: 1063-5157 print / 1076...
17
Syst. Biol. 56(1):1–16, 2007 Copyright c Society of Systematic Biologists ISSN: 1063-5157 print / 1076-836X online DOI: 10.1080/10635150601109759 From Phylogenetics to Phylogenomics: The Evolutionary Relationships of Insect Endosymbiotic γ -Proteobacteria as a Test Case I˜ NAKI COMAS ,ANDR ´ ES MOYA, AND FERNANDO GONZ ´ ALEZ-CANDELAS Institut Cavanilles de Biodiversitat i Biologia Evolutiva. Universitat de Val` encia, Valencia, Spain; E-mail: [email protected] (I.C.); [email protected] (A.M.); [email protected] (F.G.-C.) Abstract.—The increasing availability of complete genome sequences and the development of new, faster methods for phylogenetic reconstruction allow the exploration of the set of evolutionary trees for each gene in the genome of any species. This has led to the development of new phylogenomic methods. Here, we have compared different phylogenetic and phylogenomic methods in the analysis of the monophyletic origin of insect endosymbionts from the γ -Proteobacteria, a hotly debated issue with several recent, conflicting reports. We have obtained the phylogenetic tree for each of the 579 identified protein-coding genes in the genome of the primary endosymbiont of carpenter ants, Blochmannia floridanus, after determining their presumed orthologs in 20 additional Proteobacteria genomes. A reference phylogeny reflecting the monophyletic origin of insect endosymbionts was further confirmed with different approaches, which led us to consider it as the presumed species tree. Remarkably, only 43 individual genes produced exactly the same topology as this presumed species tree. Most discrepancies between this tree and those obtained from individual genes or by concatenation of different genes were due to the grouping of Xanthomonadales with β-Proteobacteria and not to uncertainties over the monophyly of insect endosymbionts. As previously noted, operational genes were more prone to reject the presumed species tree than those included in information-processing categories, but caution should be exerted when selecting genes for phylogenetic inference on the basis of their functional category assignment. We have obtained strong evidence in support of the monophyletic origin of γ -Proteobacteria insect endosymbionts by a combination of phylogenetic and phylogenomic methods. In our analysis, the use of concatenated genes has shown to be a valuable tool for analyzing primary phylogenetic signals coded in the genomes. Nevertheless, other phylogenomic methods such as supertree approaches were useful in revealing alternative phylogenetic signals and should be included in comprehensive phylogenomic studies. [Concatenate alignment; incongruence; microbial evolution; phylome; supermatrix alignment; supertree analysis.] The evolution of Bacteria is strongly influenced by the fluid nature of their genomes. Processes such as duplica- tion, gene gain and loss limit the inference of their evo- lutionary relationships. However, in the last decade the genomic revolution has represented not only a change in scale for the analysis of sequences but also for phylo- genetic inference. The phylogenomic approach, initially proposed as the application of phylogenetic analysis to help annotating complete genome sequences (Eisen, 1998), has transformed into the (possibly) most appropri- ate way to derive the phylogenetic history of organisms through genome-scale phylogenetic inference (O’Brien and Stanyon, 1999; Sicheritz-Pont´ en and Andersson, 2001; Eisen and Fraser, 2003). This leap from phylogenet- ics to phylogenomics has allowed avoiding some of the inherent problems in the inference of species trees from single gene phylogenies. However, it has also brought new issues in the reconstruction of species trees and even questioned the existence of such a single tree for all the genes in the genome of a bacterial species (Doolittle, 1999; Bapteste et al., 2005). The single-gene approach reached its peak with the use of ribosomal RNA sequences as phylogenetic mark- ers for microorganisms (Woese, 1987). These genes have been, and still are, a powerful tool in bacterial phylo- genetic analysis. Their properties as a good marker for phylogenetic inference, such as universal presence and evolutionary conservation, have enabled the proposal of a universal tree of life (Woese et al., 1990) and the clas- sification and reconstruction of evolutionary relation- ships for the three domains in the absence of genomic data (Woese and Fox, 1977). However, even ribosomal markers have been shown to be laterally transferred in some cases (Asai et al., 1999; Yap et al., 1999). The advantages of multiple gene approaches versus those based on single genes are a priori evident. In the- ory, we can evade the single gene evolutionary histo- ries in favor of a common “true” phylogenetic signal; it is possible to avoid problems derived from insuffi- cient sample size by addition of more sites from multiple genes or to compensate for biased base compositions. In practice, some of these problems will also affect phylo- genies reconstructed from large data sets, but others will be substantially reduced and/or easily diagnosed. Sev- eral alternative methods to single-gene tree phylogenies have been proposed recently (reviewed in Delsuc et al., 2005). These methods are based on different kinds of se- quence characters and genome structure, such as gene content (Snel et al., 1999; Gu et al., 2004; Huson and Steel, 2004), gene order (Wolf et al., 2001; Korbel et al., 2002; Belda et al., 2005), concatenated sequences (Brown et al., 2001; Rokas et al., 2003), or gene tree–based techniques (Bininda-Emonds et al., 2002; Bininda-Emonds, 2004b). In this article we focus on methods based on direct or indirect analyses of genomic sequence data. The concatenation approach has proven useful in many cases and its use is increasingly common (Bapteste et al., 2002; Rokas et al., 2003). The method has been justified in cases where single-gene phylogenetic sig- nals are insufficient (Herniou et al., 2001), when there is heterogeneity in the evolutionary rates (Bapteste et al., 2002; Gontcharov et al., 2004), or when a high influ- ence of nonstandard evolutionary patterns in the shap- ing of gene trees, such as horizontal gene transfer, is to 1
Transcript of Syst. Biol. 56(1):1–16, 2007 ISSN: 1063-5157 print / 1076...
Syst. Biol. 56(1):1–16, 2007Copyright c© Society of Systematic BiologistsISSN: 1063-5157 print / 1076-836X onlineDOI: 10.1080/10635150601109759
From Phylogenetics to Phylogenomics: The Evolutionary Relationships of InsectEndosymbiotic γ-Proteobacteria as a Test Case
INAKI COMAS, ANDRES MOYA, AND FERNANDO GONZALEZ-CANDELAS
Institut Cavanilles de Biodiversitat i Biologia Evolutiva. Universitat de Valencia, Valencia, Spain;E-mail: [email protected] (I.C.); [email protected] (A.M.); [email protected] (F.G.-C.)
Abstract.—The increasing availability of complete genome sequences and the development of new, faster methods forphylogenetic reconstruction allow the exploration of the set of evolutionary trees for each gene in the genome of anyspecies. This has led to the development of new phylogenomic methods. Here, we have compared different phylogeneticand phylogenomic methods in the analysis of the monophyletic origin of insect endosymbionts from the γ -Proteobacteria,a hotly debated issue with several recent, conflicting reports. We have obtained the phylogenetic tree for each of the 579identified protein-coding genes in the genome of the primary endosymbiont of carpenter ants, Blochmannia floridanus,after determining their presumed orthologs in 20 additional Proteobacteria genomes. A reference phylogeny reflecting themonophyletic origin of insect endosymbionts was further confirmed with different approaches, which led us to consider itas the presumed species tree. Remarkably, only 43 individual genes produced exactly the same topology as this presumedspecies tree. Most discrepancies between this tree and those obtained from individual genes or by concatenation of differentgenes were due to the grouping of Xanthomonadales with β-Proteobacteria and not to uncertainties over the monophyly ofinsect endosymbionts. As previously noted, operational genes were more prone to reject the presumed species tree than thoseincluded in information-processing categories, but caution should be exerted when selecting genes for phylogenetic inferenceon the basis of their functional category assignment. We have obtained strong evidence in support of the monophyletic originof γ -Proteobacteria insect endosymbionts by a combination of phylogenetic and phylogenomic methods. In our analysis, theuse of concatenated genes has shown to be a valuable tool for analyzing primary phylogenetic signals coded in the genomes.Nevertheless, other phylogenomic methods such as supertree approaches were useful in revealing alternative phylogeneticsignals and should be included in comprehensive phylogenomic studies. [Concatenate alignment; incongruence; microbialevolution; phylome; supermatrix alignment; supertree analysis.]
The evolution of Bacteria is strongly influenced by thefluid nature of their genomes. Processes such as duplica-tion, gene gain and loss limit the inference of their evo-lutionary relationships. However, in the last decade thegenomic revolution has represented not only a changein scale for the analysis of sequences but also for phylo-genetic inference. The phylogenomic approach, initiallyproposed as the application of phylogenetic analysisto help annotating complete genome sequences (Eisen,1998), has transformed into the (possibly) most appropri-ate way to derive the phylogenetic history of organismsthrough genome-scale phylogenetic inference (O’Brienand Stanyon, 1999; Sicheritz-Ponten and Andersson,2001; Eisen and Fraser, 2003). This leap from phylogenet-ics to phylogenomics has allowed avoiding some of theinherent problems in the inference of species trees fromsingle gene phylogenies. However, it has also broughtnew issues in the reconstruction of species trees and evenquestioned the existence of such a single tree for all thegenes in the genome of a bacterial species (Doolittle, 1999;Bapteste et al., 2005).
The single-gene approach reached its peak with theuse of ribosomal RNA sequences as phylogenetic mark-ers for microorganisms (Woese, 1987). These genes havebeen, and still are, a powerful tool in bacterial phylo-genetic analysis. Their properties as a good marker forphylogenetic inference, such as universal presence andevolutionary conservation, have enabled the proposal ofa universal tree of life (Woese et al., 1990) and the clas-sification and reconstruction of evolutionary relation-ships for the three domains in the absence of genomicdata (Woese and Fox, 1977). However, even ribosomal
markers have been shown to be laterally transferred insome cases (Asai et al., 1999; Yap et al., 1999).
The advantages of multiple gene approaches versusthose based on single genes are a priori evident. In the-ory, we can evade the single gene evolutionary histo-ries in favor of a common “true” phylogenetic signal;it is possible to avoid problems derived from insuffi-cient sample size by addition of more sites from multiplegenes or to compensate for biased base compositions. Inpractice, some of these problems will also affect phylo-genies reconstructed from large data sets, but others willbe substantially reduced and/or easily diagnosed. Sev-eral alternative methods to single-gene tree phylogenieshave been proposed recently (reviewed in Delsuc et al.,2005). These methods are based on different kinds of se-quence characters and genome structure, such as genecontent (Snel et al., 1999; Gu et al., 2004; Huson and Steel,2004), gene order (Wolf et al., 2001; Korbel et al., 2002;Belda et al., 2005), concatenated sequences (Brown et al.,2001; Rokas et al., 2003), or gene tree–based techniques(Bininda-Emonds et al., 2002; Bininda-Emonds, 2004b).In this article we focus on methods based on direct orindirect analyses of genomic sequence data.
The concatenation approach has proven useful inmany cases and its use is increasingly common (Baptesteet al., 2002; Rokas et al., 2003). The method has beenjustified in cases where single-gene phylogenetic sig-nals are insufficient (Herniou et al., 2001), when thereis heterogeneity in the evolutionary rates (Bapteste et al.,2002; Gontcharov et al., 2004), or when a high influ-ence of nonstandard evolutionary patterns in the shap-ing of gene trees, such as horizontal gene transfer, is to
1
2 SYSTEMATIC BIOLOGY VOL. 56
be expected (Brochier et al., 2002). This method increasesphylogenetic signal by joining the sequences from multi-ple genes, thus creating a supermatrix of characters, andgenerally recovers accepted (and presumably correct)phylogenies with highly supported nodes, thus evad-ing many of the above pitfalls (for instance, insufficientamounts of informative sites or particular gene histories)as far as the correct model of evolution is used, althoughit may not overcome problems associated to systematicbiases in the data (Phillips et al., 2004).
Contrary to the concatenation approach, consensusand supertree approaches have an indirect associationwith the genome sequence. The consensus method isbased on the integration of multiple source trees intoa single topology. When the initial data set does notinclude the same taxa in all the gene trees, then a su-pertree is constructed combining the overlapping topolo-gies (Bininda-Emonds, 2004a). All these methods haveproven useful for phylogenetic inference (Daubin et al.,2002; Rokas et al., 2003), but they have different possibleassociated errors. For instance, the strength of the super-matrix approach decreases when the number of sharedorthologous genes is low or when many of the genesconcatenated are influenced by horizontal gene trans-fer events or hidden paralogies (Daubin et al., 2002). Onthe other hand, a supertree approach has also its ownsources of problems. The use of wrong source trees, theindirect relationship with molecular data, taxon hetero-geneity among the trees, or lack of a universal method-ology for assessing the reliability of the nodes are amongthe most common problems encountered by consensusand supertree approaches (Gatesy et al., 2002; Creevey,2004; Bininda-Emonds, 2004a).
Our primary concerns in this work are to carry out acomparative analysis of different phylogenetic method-ologies and to derive, as far as possible, a presumedspecies tree for a group of Proteobacteria, although thislast concept itself is controversial for bacteria. Opinionsrange from those who consider nonvertical evolution-ary events, mainly horizontal gene transfer, as back-ground noise that, after appropriate filtering, still allowsto recover the true phylogenetic relationships amongthe species (Jain et al., 1999; Kurland et al., 2003) tothose who sustain the impossibility of describing bacteriagenome evolution through a single tree-like phylogeny(Doolittle, 1999; Creevey et al., 2004; Bapteste et al., 2005).We will not address directly this question in this work,although we will use the term “species tree” to refer tothat phylogenetic hypothesis that encompasses most ofthe vertically transmitted phylogenetic signal. To studythe evolution of bacteria we must identify the differentvertical and nonvertical phylogenetic signals; the former,if sufficiently strong, will be reflected in the species tree.
In this work, we have approached a conflicting issue inbacterial phylogenetics through the use of different phy-logenetic and phylogenomics methods. Apart from al-lowing the comparison of the problems and advantagesof the different methodologies employed, the particularset of Proteobacteria used in this study also poses someinteresting evolutionary questions. In particular, there
is an ongoing debate on whether bacterial endosym-bionts of insects from the gamma subdivision of Pro-teobacteria conform to a monophyletic group (Gil et al.,2003; Lerat et al., 2003; Canback et al., 2004) or they areparaphyletic and their grouping results from artefactsin the phylogeny reconstruction process (Charles et al.,2001; Herbeck et al., 2004; Belda et al., 2005). This studyinvestigates the evolutionary relationships of five γ -Proteobacteria endosymbionts, including the three Buch-nera strains sequenced so far. Several evolutionary fea-tures of these genomes, such as their high evolutionaryrates and low G+C content, and genome disintegrationled to different methodological problems (Moreira andPhilippe, 2000; Sanderson and Shaffer, 2002).
Our work is based on the determination of the phy-lome (Sicheritz-Ponten and Andersson, 2001)—the set ofphylogenetic trees for each protein-coding gene in thegenome—of Blochmannia floridanus (Gil et al., 2003), theprimary endosymbiont of carpenter ants. We have usedit as a starting point to explore the phylogenetic land-scape of γ -Proteobacteria. In this work we have usedan array of phylogenetic and phylogenomic techniquesto infer the phylogenetic relationships among 21 Pro-teobacteria. In consequence, we have analyzed severalphylogenetic hypotheses for these species through theexamination of the phylogenies derived from the setof protein-coding genes in Blochmannia and their com-parison with topologies obtained from the 16S rDNAand different phylogenomic methods. Our aim has beennot only to test alternative species tree hypotheses butalso to analyze the advantages and pitfalls associated toeach class of approximation. Additionally, we have at-tempted an approximation to the genomic core concept(Nesbø et al., 2001; Gil et al., 2004; Strobel and Arnold,2004) through the analysis of trees and sequences thathas allowed us to question the relevance of the informa-tional/operational gene distinction in phylogenetic in-ference and in the conformation of a potential bacterialcore set of genes.
MATERIALS AND METHODS
Genomes and Homologous Genes Selection
In this study we have used 21 complete genomesequences of Proteobacteria (Table 1) retrieved fromGenBank (Benson et al., 2004). We included threeβ-Proteobacteria, Neisseria meningitidis MC58, Neis-seria meningitidis Z2491, and Ralstonia solanacearum;one α-Proteobacteria, Rickettsia prowazekii; and 17 γ -Proteobacteria, including five insect endosymbionts: thethree Buchnera species sequenced so far, Wigglesworthiaglossinidia brevipalpis, and Blochmannia floridanus, whichis our initial genome. A complete and general scheme ofthe analyses carried out in this study and the relation-ships among them is presented in Figure 1.
The procedure to obtain the putative orthologs for eachgene in the Blochmannia floridanus genome started froman initial reference tree. Because it is not possible to becertain about the truly orthologous nature of a gene un-til the phylogenetic analysis is completed, we considered
2007 COMAS ET AL.—PHYLOGENOMICS AND THE EVOLUTION OF γ -PROTEOBACTERIA 3
TABLE 1. Complete genome sequences of Proteobacteria used in this study.
Species (strain) Accession no. Division Order
Rickettsia prowazekii NC 000963 α-Proteobacteria RickettsialesNeisseria meningitidis MC58 NC 003112 β-Proteobacteria NeisserialesNeisseria meningitidis Z2491 NC 003116 β-Proteobacteria NeisserialesRalstonia solanacearum NC 003295 β-Proteobacteria BulkholderialesBlochmannia floridanus NC 005061 γ -Proteobacteria EnterobacterialesBuchnera aphidicola BPI NC 004545 γ -Proteobacteria EnterobacterialesBuchnera aphidicola SGI NC 004061 γ -Proteobacteria EnterobacterialesBuchnera sp. APS NC 002528 γ -Proteobacteria EnterobacterialesEscherichia coli K12 NC 000913 γ -Proteobacteria EnterobacterialesEscherichia coli O157:H7 EDL933 NC 002655 γ -Proteobacteria EnterobacterialesHaemophilus influenzae Rd NC 000907 γ -Proteobacteria PasteurellalesPasteurella multocida NC 002663 γ -Proteobacteria PasteurellalesPseudomonas aeruginosa NC 002516 γ -Proteobacteria PseudomonadalesSalmonella enterica subsp. enterica serovar Typhi NC 003198 γ -Proteobacteria EnterobacterialesSalmonella typhimurium LT2 NC 003197 γ -Proteobacteria EnterobacterialesVibrio cholerae NC 002505 γ -Proteobacteria VibrionalesWigglesworthia glossinidia brevipalpis NC 004344 γ -Proteobacteria EnterobacterialesXanthomonas axonopodis pv. citri strain 306 NC 003919 γ -Proteobacteria XanthomonadalesXanthomonas campestris pv. campestris strain ATCC 33913 NC 003902 γ -Proteobacteria XanthomonadalesXylella fastidiosa NC 002488 γ -Proteobacteria XanthomonadalesYersinia pestis KIM NC 004088 γ -Proteobacteria Enterobacteriales
the homologous genes found in the procedure describedbelow as putative orthologs, which may eventually be-come true orthologs, paralogs, or xenologs, dependingon their inferred evolutionary history. The reference treewas obtained as described in Gil et al. (2003). Briefly,we obtained the orthologs for 60 informational genes
FIGURE 1. General diagram of the different methodologies used for assessing the phylome of Blochmannia floridanus as well as the phyloge-nomic analyses and testing. 1sKH: one-sided Kishino-Hasegawa test; SH: Shimodaira-Hasegawa test; ELW: expected likelihood weight test;MRP: matrix representation using parsimony; dfit: most similar supertree; qfit: maximum quartet fit; sfit: maximum splits fit.
present in all the genomes considered. Protein sequenceswere aligned with CLUSTALW 1.8 (Thompson et al.,1994) and processed with GBLOCKS (Castresana, 2000)with default parameters to eliminate areas of uncertainhomology or low phylogenetic content before concate-nation. The resulting concatenate was used to obtain a
4 SYSTEMATIC BIOLOGY VOL. 56
maximum likelihood tree using the quartet method im-plemented in TREEPUZZLE 5.1 (Schmidt et al., 2002)with the following options: JTT model of substitution(Jones et al., 1992), proportion of invariant sites (I)estimated from the data, eight discrete categories toapproximate a gamma distribution accounting for evo-lutionary rate heterogeneity across sites (G), empiricalamino acids frequencies (F), and 4000 puzzling steps. Wealso obtained phylogenetic trees by Bayesian inferenceusing MrBayes 3.0 (Ronquist and Huelsenbeck, 2003)(JTT+I+F+G and 100,000 generations). This tree is anexpanded version of the tree reported in Gil et al. (2003)with additional sequences from the non–γ - Proteobacte-ria genomes. With this reference tree, we assigned eachgenome to one of nine different groups (see Fig. 2) in or-der to reduce the BLAST database and to speed up andrefine the searches (see below).
The B. floridanus genome contains 579 annotated pro-tein coding genes (Gil et al., 2003) and each of these wasused as query for a BLASTP (Altschul et al., 1997) search
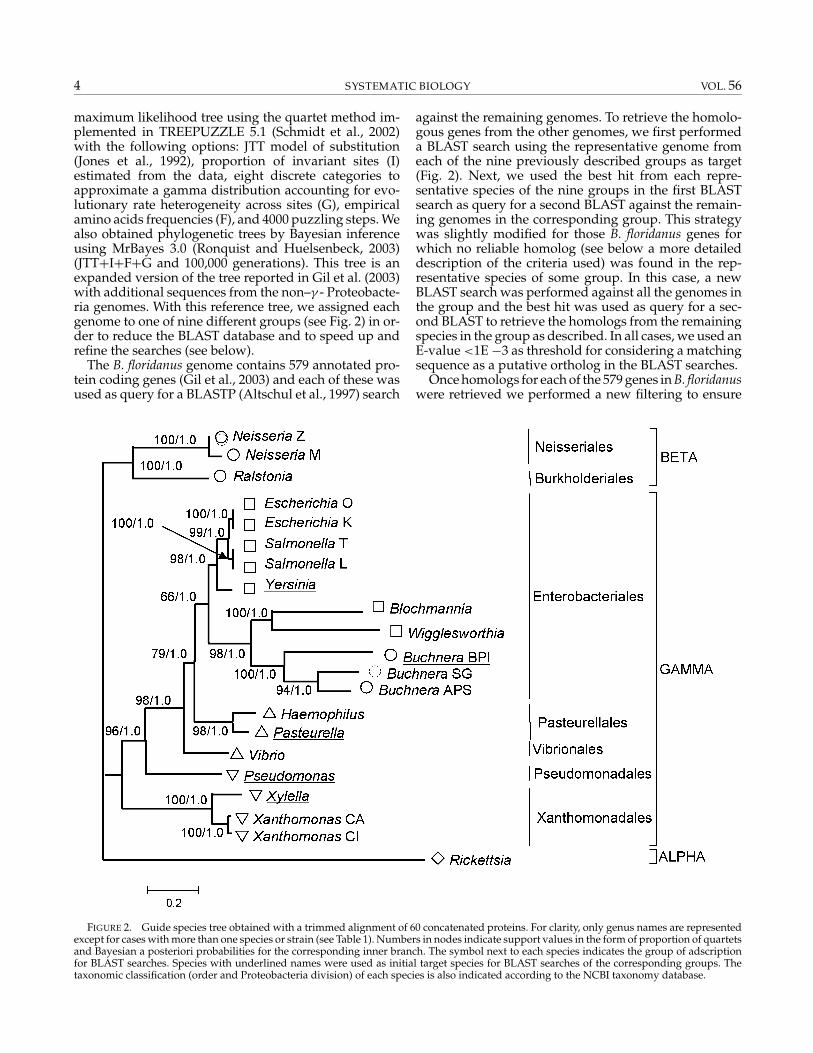
FIGURE 2. Guide species tree obtained with a trimmed alignment of 60 concatenated proteins. For clarity, only genus names are representedexcept for cases with more than one species or strain (see Table 1). Numbers in nodes indicate support values in the form of proportion of quartetsand Bayesian a posteriori probabilities for the corresponding inner branch. The symbol next to each species indicates the group of adscriptionfor BLAST searches. Species with underlined names were used as initial target species for BLAST searches of the corresponding groups. Thetaxonomic classification (order and Proteobacteria division) of each species is also indicated according to the NCBI taxonomy database.
against the remaining genomes. To retrieve the homolo-gous genes from the other genomes, we first performeda BLAST search using the representative genome fromeach of the nine previously described groups as target(Fig. 2). Next, we used the best hit from each repre-sentative species of the nine groups in the first BLASTsearch as query for a second BLAST against the remain-ing genomes in the corresponding group. This strategywas slightly modified for those B. floridanus genes forwhich no reliable homolog (see below a more detaileddescription of the criteria used) was found in the rep-resentative species of some group. In this case, a newBLAST search was performed against all the genomes inthe group and the best hit was used as query for a sec-ond BLAST to retrieve the homologs from the remainingspecies in the group as described. In all cases, we used anE-value <1E −3 as threshold for considering a matchingsequence as a putative ortholog in the BLAST searches.
Once homologs for each of the 579 genes in B. floridanuswere retrieved we performed a new filtering to ensure
2007 COMAS ET AL.—PHYLOGENOMICS AND THE EVOLUTION OF γ -PROTEOBACTERIA 5
that these genes corresponded to putative orthologs.We first proceeded to obtain a multiple alignment andthe corresponding gene tree as described below. Withthis information we considered five different criteriafor each case: annotation (coincidence in functional an-notation), multiple alignment (similarity extended overthe complete sequence and not a short fragment), genetree (strong conflict with the reference tree), BLAST sig-nificance, and information from the Microbial GenomeDatabase for Comparative Analysis (Uchiyama, 2003).Homologous genes were accepted as putative orthologsafter simultaneous consideration of all these five crite-ria. Because these are independent, they allowed us toanalyze orthology in the absence of a good annotationor when the position in the gene tree was unexpected.Should we have based strictly and only on annotation orposition in the gene tree, then we would have biased thedata set towards genes with the most congruent phylo-genies or best annotations. In most cases the identifica-tion of putative orthologs was easy. In the most difficultcases, which corresponded to nonannotated proteins orto very divergent gene trees from the usually acceptedspecies phylogenies, we considered as putative orthologsthose genes that were supported by at least three of theabove mentioned criteria. This resulted in a set of 200genes in B. floridanus with reliable orthologs in all ofthe other 20 genomes considered. We will refer to thissubset as the ‘200-gene’ data set. Whenever possible,and in order to test the effect of missing data, we per-formed the analyses described below with the remaininggenes with reliable orthologs missing from at least onegenome (‘379-gene’ data set) and also with the completeset of coding genes in the B. floridanus genome (‘579-gene’data set).
Obtaining the Phylome of Blochmannia floridanusAfter obtaining putative orthologs for each protein
of the B. floridanus genome we proceeded to obtain itsphylome, the set of phylogenetic trees for each proteincoding gene. The alignment for each set of homologousproteins was obtained using CLUSTALW 1.8 (Thompsonet al., 1994) and the result was trimmed with GBLOCKS(Castresana, 2000) using default parameters. The max-imum likelihood tree for each multiple alignment wasinferred with the program PHYML 2.1b (Guindon andGascuel, 2003) as it implements one of the fastest andmost accurate algorithms for heuristic searches. For allthe alignments we used JTT + I + G + F as model and pa-rameters of evolution. Some of the initial alignments andtrees were modified based on the a posteriori selectionof homologs explained above. We decided not to obtainsupport values by bootstrap resampling to save compu-tation time and not to bias the analysis towards the bestsupported topologies.
We used four phylogenetic approaches to obtaina 16S rDNA topology for the 21 species: maximumparsimony (MP), maximum likelihood (ML), and twodifferent distances with the neighbor-joining (NJ) algo-rithm (Saitou and Nei, 1987). MP analysis was performed
using PAUP∗4b10 (Swofford, 2002) with heuristicsearch based in tree-bisection-reconnection (TBR) asbranch-swapping algorithm and 1000-replicate to assessbootstrap support values. The best model for ML infer-ence was selected using the ModelTest program (Posadaand Crandall, 1998) following the Akaike informationcriterion (AIC) and implemented in PHYML 2.1b with500 bootstrap replicates. For NJ we used two models thatcould handle heterogeneous base composition amonglineages. Firstly we used MEGA 3 (Kumar et al., 2004)to implement the LogDet distance modified by Tamuraand Kumar (Tamura and Kumar, 2002) to account forsubstitution pattern heterogeneity. Secondly we usedPHYLO WIN (Galtier et al., 1996), implementing theGaltier and Gouy distance (Galtier and Gouy, 1995) forreducing nucleotide bias. A 1000-replicate bootstrap wascarried out for both NJ analyses.
Phylogenomic Analysis
We used three different approaches for phylogenomicanalysis. Concatenated sequences, consensus trees, andsupertrees were used to explore the phylogenetic land-scape of γ -Proteobacteria.
Concatenates.—The analysis of concatenates was basedon the subset of putative orthologous genes sharedby the 21 genomes, the ‘200-gene’ data set. We con-catenated the GBLOCKS-trimmed alignments of theseproteins and analyzed the resulting alignment using sev-eral methods. PAUP∗4b10 (Swofford, 2002) was usedfor parsimony analysis with stepwise addition and treebisection-reconnection for heuristic search and 500 boot-strap replicates. PHYML and TREEPUZZLE were usedfor maximum likelihood inference. Due to computa-tional limitations, we had to reduce the number ofparameters in the evolutionary models. In the analy-sis with TREEPUZZLE we used a JTT model with fourgamma categories and 4000 puzzling steps. The JTTmodel of substitution with estimated proportion of in-variant sites and 100 bootstrap replicates was used forinference with PHYML.
We also used this alignment of the ‘200-gene’ data setto explore the possible influence of heterogeneous basecomposition in the retrieval of the different identifiedclades, especially those involving endosymbiotic bacte-ria. We removed from the alignment those positions thatincluded the amino acids most strongly affected by nu-cleotide bias (FYMINK) (Singer and Hickey, 2000). Withthis data set we carried out a Bayesian analysis using Mr-Bayes 3.0 (Ronquist and Huelsenbeck, 2003) (four chains,1,000,000 generations, 10% of burn-in) and a maximumlikelihood analysis with PHYML (500 bootstrap pseudo-replicates) with the same evolutionary model describedabove (JTT+I).
Finally, we obtained a concatenate tree using all avail-able sequences (‘579-gene’ data set) by setting as “miss-ing character” those amino acids that corresponded toa protein not present in any of the 21 genomes. It wasanalyzed with TREEPUZZLE using the JTT model ofsubstitution with invariants estimated form the data set.
6 SYSTEMATIC BIOLOGY VOL. 56
Alternative, more complete methods were not feasibledue to computational limitations.
Consensus Trees.—A majority rule consensus treewas obtained with the program CONSENSE from thePHYLIP package (Felsenstein, 2005) with the gene treesfrom the ‘200-gene’ data set.
Supertrees.—For the ‘200-gene’ data set and for the setof gene trees with an incomplete number of genomes rep-resented we used a supertree approach (Sanderson et al.,1998). A supertree integrates all the topological informa-tion present in the source gene trees. In this case, weapplied supertree reconstruction to three different datasets: (i) genes present in all the genomes (‘200-gene’ dataset, the same set for which we obtained a consensus tree);(ii) genes missing in at least one genome (‘379-genes’ dataset); and (iii) to the complete phylome (‘579-gene’ dataset). We applied the different optimization algorithmsimplemented in program CLANN (Phillips et al., 2004;Creevey and McInerney, 2005) to our data set. The mostcommonly applied method in supertree reconstruction ismatrix representation using parsimony (MRP) (Loomisand Smith, 1990; Baum, 1992; Ragan, 1992). This methodconsiders each node of the source trees as a binary char-acter, assigning a “1” to the taxa contained in the clade,defined by the internal node, a “0” for the taxa not presentin this clade, and a “?” for the taxa not present in thetree. The resulting matrix is analyzed by parsimony. Theother methods implemented and used in our work weremost similar supertree method (dfit), maximum quar-tet fit (qfit), and maximum split fit (sfit) (Creevey andMcInerney, 2005). They are based in the optimization ofdistances between nodes, shared quartets, or shared par-titions between the supertrees proposed by the heuristicsearch and the source trees, respectively.
Nonparametric bootstrap by sampling with replace-ment over gene trees was used to obtain an indicativemeasure of the support of the derived clades in each su-pertree from the corresponding data. Support for eachnode in the supertrees was evaluated from 100 pseu-doreplicate samples for each data set used to derive thesupertrees.
Presumed Species Tree versus Gene Trees:Likelihood-Based Test of Topologies
Likelihood-based tests of competing phylogenetic hy-pothesis were carried out once we obtained the completephylome of B. floridanus. For each alignment we com-pared the topologies of the presumed species tree and thecorresponding gene tree by means of three different testsimplemented in TREEPUZZLE (Schmidt et al., 2002):the one-side Kishino-Hasegawa test (1sKH) (Kishinoand Hasegawa, 1989; Goldman et al., 2000), Shimodaira-Hasegawa test (SH) (Shimodaira and Hasegawa, 1999),and the expected likelihood weight test (ELW) (Strimmerand Rambaut, 2002). For the two former tests, the nullhypothesis assumes that the difference between the like-lihoods associated to each topology is not significantlydifferent from zero. The first test to be described was
the KH test, but its validity when one of the competinghypotheses was derived from the alignment has beenquestioned (Goldman et al., 2000). In this study we usedthe one-sided version of the test because the gene tree isthe maximum likelihood tree and therefore we expectedits likelihood to always be higher or equal than the like-lihood associated to the species tree. In any case we haveused it for comparative purposes and not as the referencetest because of its problems with multiple comparisonscorrections. The SH test is a multiple hypotheses con-trast. Even though it is not free from errors (Goldmanet al., 2000), it overcomes some of the problems associ-ated with the KH test. We used it as our reference testfor examining the rejection of the presumed species treeby each gene alignment. For both tests the resampling-estimated log likelihood (RELL) bootstrapping methodwith 1000 replicates was used. The ELW test is an alter-native way of topology testing. It creates a confidenceset of phylogenies that could include (acceptance) or not(rejection) our presumed species tree topology. The usualα = 0.05 level was used to delimit the acceptance/rejection region.
RESULTS
Reference Tree and Search for Homologs
The construction of a phylogenetic tree for a set ofspecies from their genome sequences needs, as a startingpoint, a phylogeny on which to accept or reject whichgene should be used for this kind of analysis on the basisof their true orthology. This is a circular question thatwe have approached by obtaining an initial or referencetree, testing its reliability, and then using it as benchmarkfor further decisions. For this, we started by obtainingthe phylogenetic tree from a subset of conserved proteincoding gene usually accepted as providing the mostrobust, reliable phylogenies when concatenated (Jainet al., 1999).
The concatenation of 60 informational gene after theirindependent alignment and trimming of residues of un-certain homology resulted in an alignment with 8067amino acid positions. Figure 2 shows the phylogenetictree obtained by maximum likelihood and Bayesian in-ference methods. This reference tree was identical to theone reported in Gil et al. (2003) except for the additionof four genomes from Proteobacteria in the α- and β-divisions. The tree reflected monophyly not only for thethree Buchnera species but also for a wider group in-cluding the other insect endosymbionts, Blochmannia andWigglesworthia. This group is a sister clade to the YESS(Yersinia-Escherichia-Shigella-Salmonella) cluster. Due toits concordance with the accepted taxonomy, the highsupport values for the nodes and the fact that it recoversthe monophyly of Buchnera species, we considered thisas a good reference tree for the ensuing BLAST searches.We further verified that this tree was obtained in mostcases after concatenation of 60 random gene chosenamong those present in the 21 genomes (results notshown).
2007 COMAS ET AL.—PHYLOGENOMICS AND THE EVOLUTION OF γ -PROTEOBACTERIA 7
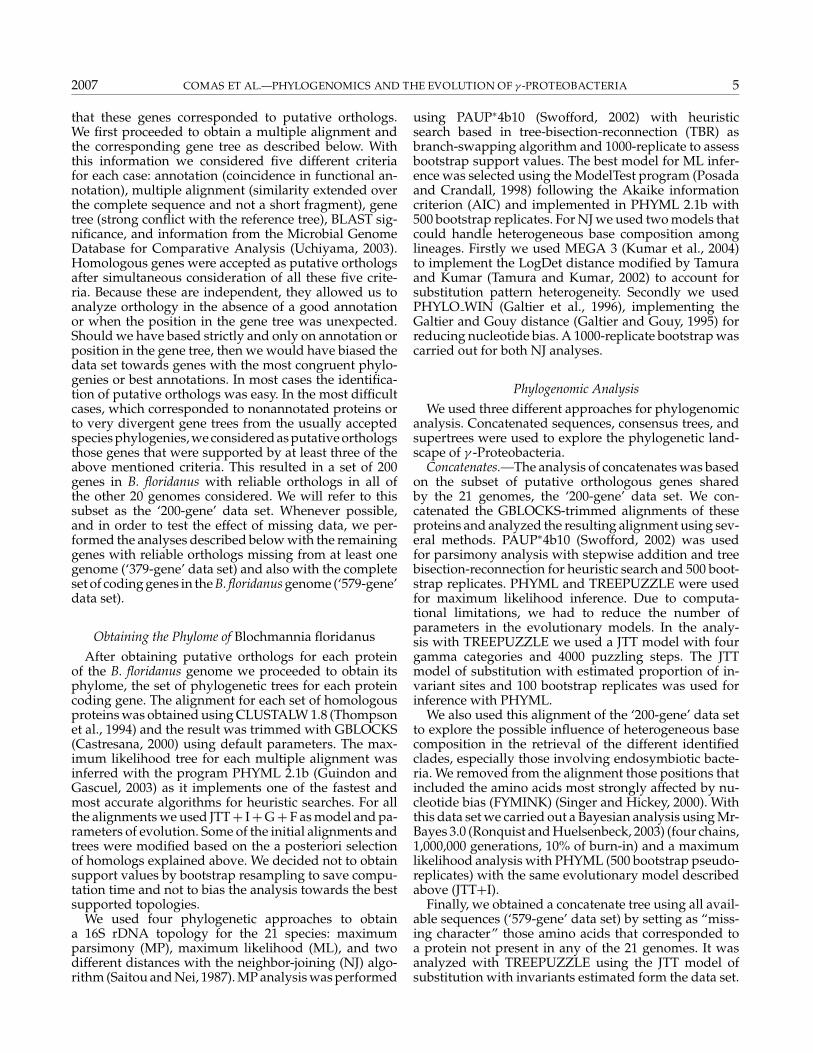
FIGURE 3. Histogram summarizing the distribution of putative orthologs for each protein coding gene (579 proteins of known function) inthe Blochmannia floridanus genome among the 21 genomes considered in this study. Note that 15 gene from last column (those present in all thespecies) were considered of dubious orthology and were analyzed in the 379-gene data set.
The similarity searches for homologs in the 21 genomesresulted in 215 protein coding gene present in all of them.After their initial multiple alignment and phylogenetictree reconstruction, we proceeded to verify their reliabil-ity as putative orthologs according to the criteria indi-cated above. This resulted in the exclusion of 15 proteinswith doubtful orthology for at least one γ -Proteobacteriaspecies different from the insect endosymbionts, thusconforming a 200-gene data set. However, in order toanalyze the complete B. floridanus phylome, we includedthese 15 proteins present in 21 taxa but with doubtful or-thology for all of them into the data set of proteins absentfrom at least one taxon. Therefore, this set was composedof 379 gene (‘379-gene’ data set) with a heterogeneousdistribution of presence in the different genomes, sum-marized in Figure 3. Each protein was present on aver-age in 16 of the 21 genomes. Nearly 60% of the proteinswere present in at least 16 genomes and only 14% in lessthan 10. A table with the distribution of B. floridanus pro-tein coding gene in the other 20 genomes is available assupplementary information from the Systematic Biologywebsite at http://systematicbiology.org.
The Phylome of B. floridanus and the 16S rDNA Tree
We obtained all the phylogenetic trees derived fromthe set of protein coding gene of B. floridanus as explainedin Materials and Methods. In the analysis of the ‘200-gene’ data set, we identified only three gene (rpoC, pheT,and mopA) with the same topology (Robinson-Fouldsdistance = 0) than the reference tree (Table 2). In the ‘379-gene’ data set, we found 40 gene whose topology wasfully congruent with that of the reference tree, althoughthis number reduced to 29 when only those present in atleast 11 species were considered.
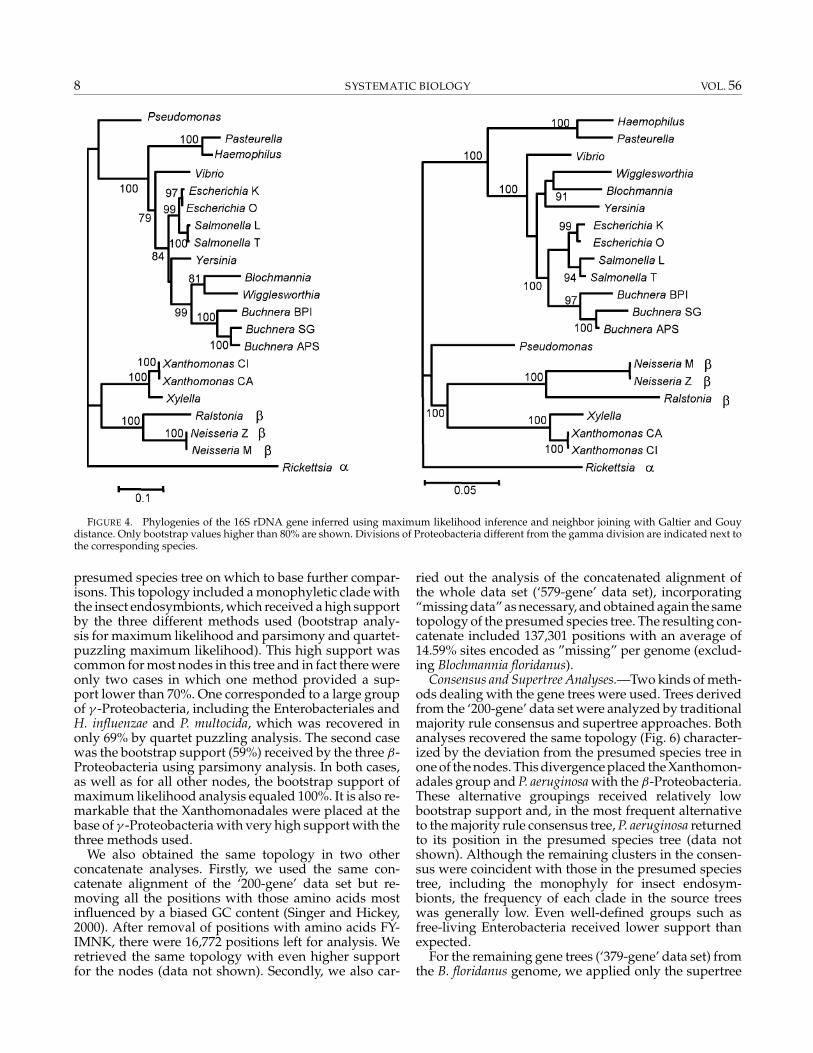
Apart from trees based on protein sequences, we ob-tained the tree based on the 16S rDNA. The four meth-ods used (see Materials and Methods) resulted in placingXanthomonadales in the β-Proteobacteria branch. Forthe endosymbiotic bacteria almost all methods retrieveda monophyletic group (see Fig. 4 ML tree), although forthe Galtier and Gouy distance this relationship was para-phyletic (see Fig. 4 NJ tree). Other taxa like Vibrio choleraeor Pseudomonas aeruginosa also had a variable position de-pending on the model or method used (Fig. 4 and datanot shown).
Phylogenomic Analysis
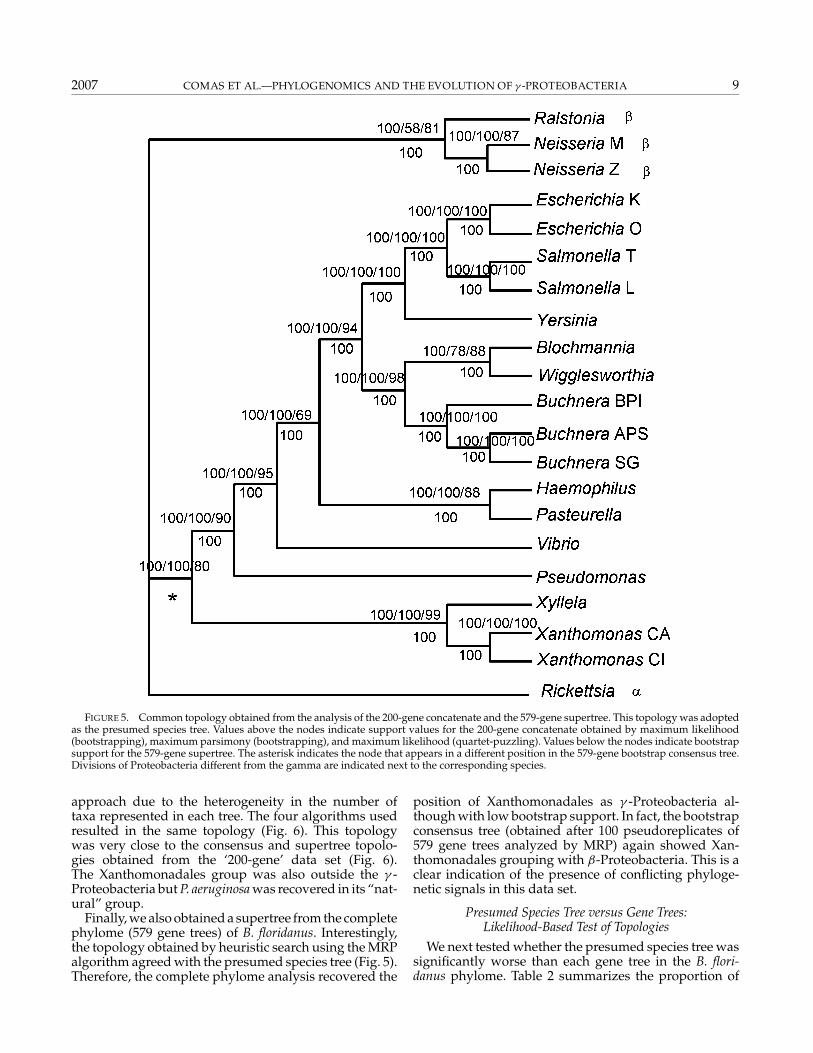
Concatenation Analysis.—We obtained an alignmentof 52,029 amino acid positions, 40,576 of which werevariable and 32921 parsimony informative, from theconcatenation of the ‘200-gene’ data set. The phyloge-netic analysis resulted in a common topology for all thereconstruction methods used, with high support val-ues for most of the nodes and methods (Fig. 5). Thistopology agreed with the reference tree established bythe preliminary analysis (see above) and the phyloge-netic reconstruction in Gil et al. (2003) as well as themost commonly accepted phylogenetic history for thesespecies. In consequence, we adopted this topology as the
TABLE 2. Summary of tests for topologies. For each test (1sKH, one-sided Kishino-Hasegawa; SH, Shimodaira-Hasegawa; EWL, expected-weighted likelihoods) percentage of cases in which the species treetopology was rejected is presented. The last column indicates the num-ber of cases in which the species and gene tree topologies are identical.
Group 1sKH (%) SH (%) ELW (%) No. of Genes
ALL (579 gene) 30.4 29.5 31.4 4321 spp. (200 gene) 30.5 29 32 3<21 spp.(379 gene) 30.3 29.8 31.1 40
8 SYSTEMATIC BIOLOGY VOL. 56
FIGURE 4. Phylogenies of the 16S rDNA gene inferred using maximum likelihood inference and neighbor joining with Galtier and Gouydistance. Only bootstrap values higher than 80% are shown. Divisions of Proteobacteria different from the gamma division are indicated next tothe corresponding species.
presumed species tree on which to base further compar-isons. This topology included a monophyletic clade withthe insect endosymbionts, which received a high supportby the three different methods used (bootstrap analy-sis for maximum likelihood and parsimony and quartet-puzzling maximum likelihood). This high support wascommon for most nodes in this tree and in fact there wereonly two cases in which one method provided a sup-port lower than 70%. One corresponded to a large groupof γ -Proteobacteria, including the Enterobacteriales andH. influenzae and P. multocida, which was recovered inonly 69% by quartet puzzling analysis. The second casewas the bootstrap support (59%) received by the three β-Proteobacteria using parsimony analysis. In both cases,as well as for all other nodes, the bootstrap support ofmaximum likelihood analysis equaled 100%. It is also re-markable that the Xanthomonadales were placed at thebase of γ -Proteobacteria with very high support with thethree methods used.
We also obtained the same topology in two otherconcatenate analyses. Firstly, we used the same con-catenate alignment of the ‘200-gene’ data set but re-moving all the positions with those amino acids mostinfluenced by a biased GC content (Singer and Hickey,2000). After removal of positions with amino acids FY-IMNK, there were 16,772 positions left for analysis. Weretrieved the same topology with even higher supportfor the nodes (data not shown). Secondly, we also car-
ried out the analysis of the concatenated alignment ofthe whole data set (‘579-gene’ data set), incorporating“missing data” as necessary, and obtained again the sametopology of the presumed species tree. The resulting con-catenate included 137,301 positions with an average of14.59% sites encoded as ”missing” per genome (exclud-ing Blochmannia floridanus).
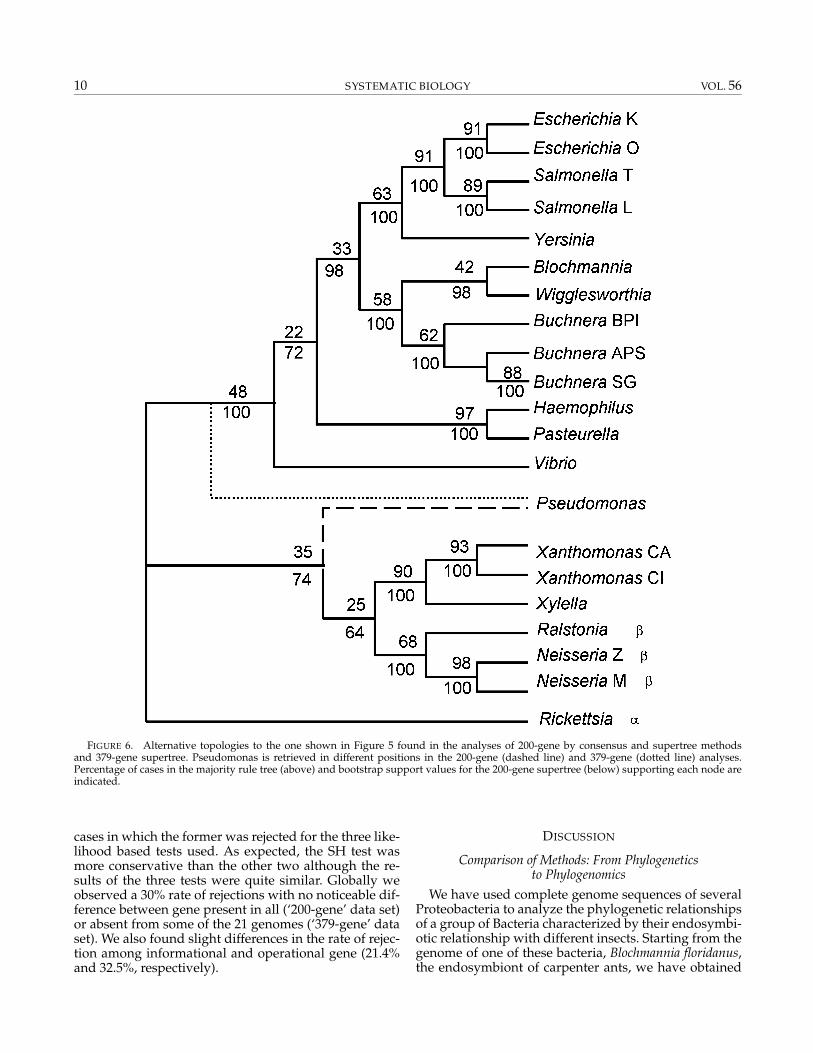
Consensus and Supertree Analyses.—Two kinds of meth-ods dealing with the gene trees were used. Trees derivedfrom the ‘200-gene’ data set were analyzed by traditionalmajority rule consensus and supertree approaches. Bothanalyses recovered the same topology (Fig. 6) character-ized by the deviation from the presumed species tree inone of the nodes. This divergence placed the Xanthomon-adales group and P. aeruginosa with the β-Proteobacteria.These alternative groupings received relatively lowbootstrap support and, in the most frequent alternativeto the majority rule consensus tree, P. aeruginosa returnedto its position in the presumed species tree (data notshown). Although the remaining clusters in the consen-sus were coincident with those in the presumed speciestree, including the monophyly for insect endosym-bionts, the frequency of each clade in the source treeswas generally low. Even well-defined groups such asfree-living Enterobacteria received lower support thanexpected.
For the remaining gene trees (‘379-gene’ data set) fromthe B. floridanus genome, we applied only the supertree
2007 COMAS ET AL.—PHYLOGENOMICS AND THE EVOLUTION OF γ -PROTEOBACTERIA 9
FIGURE 5. Common topology obtained from the analysis of the 200-gene concatenate and the 579-gene supertree. This topology was adoptedas the presumed species tree. Values above the nodes indicate support values for the 200-gene concatenate obtained by maximum likelihood(bootstrapping), maximum parsimony (bootstrapping), and maximum likelihood (quartet-puzzling). Values below the nodes indicate bootstrapsupport for the 579-gene supertree. The asterisk indicates the node that appears in a different position in the 579-gene bootstrap consensus tree.Divisions of Proteobacteria different from the gamma are indicated next to the corresponding species.
approach due to the heterogeneity in the number oftaxa represented in each tree. The four algorithms usedresulted in the same topology (Fig. 6). This topologywas very close to the consensus and supertree topolo-gies obtained from the ‘200-gene’ data set (Fig. 6).The Xanthomonadales group was also outside the γ -Proteobacteria but P. aeruginosa was recovered in its “nat-ural” group.
Finally, we also obtained a supertree from the completephylome (579 gene trees) of B. floridanus. Interestingly,the topology obtained by heuristic search using the MRPalgorithm agreed with the presumed species tree (Fig. 5).Therefore, the complete phylome analysis recovered the
position of Xanthomonadales as γ -Proteobacteria al-though with low bootstrap support. In fact, the bootstrapconsensus tree (obtained after 100 pseudoreplicates of579 gene trees analyzed by MRP) again showed Xan-thomonadales grouping with β-Proteobacteria. This is aclear indication of the presence of conflicting phyloge-netic signals in this data set.
Presumed Species Tree versus Gene Trees:Likelihood-Based Test of Topologies
We next tested whether the presumed species tree wassignificantly worse than each gene tree in the B. flori-danus phylome. Table 2 summarizes the proportion of
10 SYSTEMATIC BIOLOGY VOL. 56
FIGURE 6. Alternative topologies to the one shown in Figure 5 found in the analyses of 200-gene by consensus and supertree methodsand 379-gene supertree. Pseudomonas is retrieved in different positions in the 200-gene (dashed line) and 379-gene (dotted line) analyses.Percentage of cases in the majority rule tree (above) and bootstrap support values for the 200-gene supertree (below) supporting each node areindicated.
cases in which the former was rejected for the three like-lihood based tests used. As expected, the SH test wasmore conservative than the other two although the re-sults of the three tests were quite similar. Globally weobserved a 30% rate of rejections with no noticeable dif-ference between gene present in all (‘200-gene’ data set)or absent from some of the 21 genomes (‘379-gene’ dataset). We also found slight differences in the rate of rejec-tion among informational and operational gene (21.4%and 32.5%, respectively).
DISCUSSION
Comparison of Methods: From Phylogeneticsto Phylogenomics
We have used complete genome sequences of severalProteobacteria to analyze the phylogenetic relationshipsof a group of Bacteria characterized by their endosymbi-otic relationship with different insects. Starting from thegenome of one of these bacteria, Blochmannia floridanus,the endosymbiont of carpenter ants, we have obtained
2007 COMAS ET AL.—PHYLOGENOMICS AND THE EVOLUTION OF γ -PROTEOBACTERIA 11
the phylogenetic trees for every protein coding gene inthis species, by using single-gene, standard phylogeneticmethods, and we have also analyzed this data set withphylogenomic approaches.
Single-gene phylogenies are representative of tradi-tional phylogenetic analyses. They have several advan-tages over multigene approaches. Taxon sampling iswidest and the acquisition of raw data in the laboratoryand from public databases is easy and cheap. However,our analysis with 16S rDNA exemplifies the low robust-ness of this marker for phylogenetic reconstruction, be-cause different topologies were obtained when the evo-lutionary model or reconstruction method were changed(see also Herbeck et al., 2004). Furthermore, the analysisof the B. floridanus phylome has revealed the presence ofa large number of different topologies from single genetrees in agreement with other studies (Canback et al.,2004). As a case in point, only three of the gene present inall genomes had exactly the same topology than the pre-sumed species tree obtained by the concatenate analysis(Fig. 5). This high variability in reconstructed topologiesis the result of limitations in the phylogenetic methods,sampling error due to the limited length of single-genealignments, the action of evolutionary forces, and modelmisspecification that may result in single-gene phylo-genies not coincident with the presumed species tree.Therefore, the topological heterogeneity obtained by us-ing a single-gene approach, both for the 16S rDNA andthe phylome, does not justify in most cases their use inthe inference of the evolutionary relationships amongspecies, especially when whole genome data are avail-able. However, still very often these are the only kindof data available for phylogenetic analysis. In this case,congruence with the known taxonomy and convergencewith other phylogenetic markers available are reassuringbut incongruence does not necessarily mean that a wholenew evolutionary history has to be envisioned. Further-more, the joint analysis of many single-gene phylogeniesprovides a better, more accurate picture of the evolu-tionary history of the whole genome, in which differ-ent evolutionary trajectories may be revealed once noisyand/or unreliable signals are identified and consideredappropriately.
On the other hand, phylogenomic methods, whichcan be divided in supermatrix, consensus, and su-pertree approaches, have their own problems (Bininda-Emonds and Sanderson, 2001; Bininda-Emonds et al.,2002; Bininda-Emonds, 2004b). Although the concate-nates are most useful for retrieving a main phylogeneticsignal, techniques based on the analysis of underlyinggene phylogenies may reveal the divergent signals en-coded in the single gene that are usually ignored by con-catenate analysis ( see Gatesy and Baker, 2005).
In this study we have used the traditional consen-sus (with the ‘200-gene’ data set) and supertree (withthe ‘200-gene,’ ‘379-gene,’ and ‘579-gene’ data sets) ap-proaches. Except for the complete phylome supertree,all the methods agreed in placing the Xanthomonadaleswith the β-Proteobacteria due to the high incidence ofgene phylogenies with this placement instead of the
expected gamma placement. This case has been stud-ied in detail elsewhere (Comas et al., 2006a). Deviationsin supertrees from the presumed species tree could arisefrom two methodological sources: errors due to hetero-geneity in the taxa used for analysis or from differencesin their most common topological position in the individ-ual trees (Creevey, 2004). However, the former problemcan be excluded in this case because we have workedwith a very homogeneous data set and the conflictingresult appears even in the two analyses based on the ‘200-gene’ trees that are common to all the genomes consid-ered. Thus, the three different supertree analyses (‘200-gene,’ ‘379-gene,’ and ‘579-gene’) have revealed a largeamount of conflicting signals in these gene about the phy-logenetic positioning of Xanthomonadales. This group isalso the one responsible for most discrepancies betweenthe consensus and supertree approaches, especially overthe support values of the nodes. It has to be noted thatconsensus trees are summaries of the observed cladesin the underlying gene trees, all obtained from the com-plete set of the same number of taxa, whereas supportvalues in a supertree analysis are not a mere recount ofobserved clades but a measure of the support, derivedfrom bootstrap resampling (Burleigh et al., 2006), thatthe source gene trees provide to their most compatibletopology.
Additionally, the use of supertrees is suitable for manysituations where supermatrix or consensus may be lim-ited or nonapplicable. For example, in cases where theevolutionary distance among taxa is very high andthe amount of shared genetic information is very low(Sanderson and Driskell, 2003), it is highly likely thatsparse data matrices are obtained, leading to concate-nate alignments with many missing characters and indi-vidual trees with incomplete sets of taxa. Furthermore,supertrees are useful in cases, such as this work, wheremore than one phylogenetic signal is present becausethey can reveal alternative signals appearing in singlegene phylogenies. Finally, supertrees stand as the bestchoice method when phylogenetic data sources are het-erogeneous; for instance, when combining morphologi-cal and molecular data based phylogenies.
The other phylogenomic method commonly used isconcatenation of shared sequences. With this approachwe derived a phylogenetic tree that was identical to thereference tree and in agreement with the most commonlyaccepted phylogeny for the taxa considered. This led usto adopt it as the “presumed species tree,” a hypothe-sis that received further support when alternative recon-struction methods were applied. But the concatenationapproach cannot be considered free from errors and/orbiases, the most important one being the assumptionthat a single, main phylogenetic signal exists and thatit will be revealed by the simultaneous consideration ofas many data as possible, regardless of their (evolution-ary) congruence in terms of history or mode of evolution(Daubin et al., 2002).
Further problems arise in the concatenation approachbecause the number of gene shared in all the genomesdecreases when the evolutionary distance between taxa
12 SYSTEMATIC BIOLOGY VOL. 56
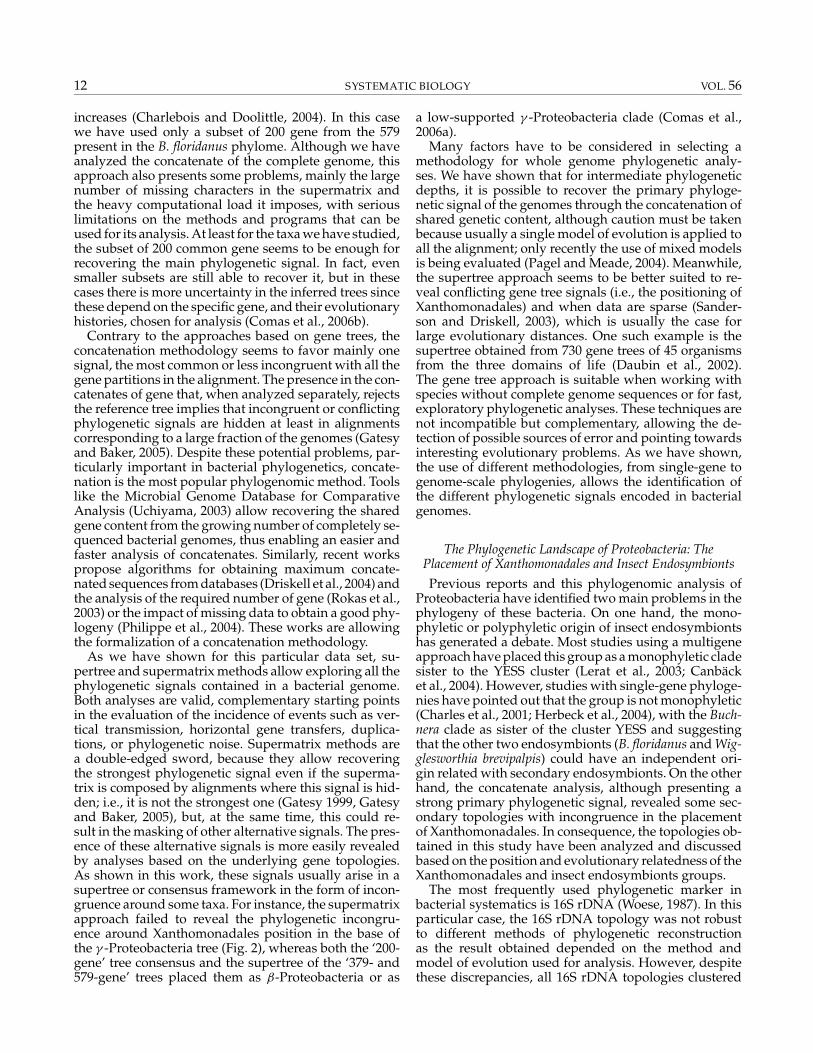
increases (Charlebois and Doolittle, 2004). In this casewe have used only a subset of 200 gene from the 579present in the B. floridanus phylome. Although we haveanalyzed the concatenate of the complete genome, thisapproach also presents some problems, mainly the largenumber of missing characters in the supermatrix andthe heavy computational load it imposes, with seriouslimitations on the methods and programs that can beused for its analysis. At least for the taxa we have studied,the subset of 200 common gene seems to be enough forrecovering the main phylogenetic signal. In fact, evensmaller subsets are still able to recover it, but in thesecases there is more uncertainty in the inferred trees sincethese depend on the specific gene, and their evolutionaryhistories, chosen for analysis (Comas et al., 2006b).
Contrary to the approaches based on gene trees, theconcatenation methodology seems to favor mainly onesignal, the most common or less incongruent with all thegene partitions in the alignment. The presence in the con-catenates of gene that, when analyzed separately, rejectsthe reference tree implies that incongruent or conflictingphylogenetic signals are hidden at least in alignmentscorresponding to a large fraction of the genomes (Gatesyand Baker, 2005). Despite these potential problems, par-ticularly important in bacterial phylogenetics, concate-nation is the most popular phylogenomic method. Toolslike the Microbial Genome Database for ComparativeAnalysis (Uchiyama, 2003) allow recovering the sharedgene content from the growing number of completely se-quenced bacterial genomes, thus enabling an easier andfaster analysis of concatenates. Similarly, recent workspropose algorithms for obtaining maximum concate-nated sequences from databases (Driskell et al., 2004) andthe analysis of the required number of gene (Rokas et al.,2003) or the impact of missing data to obtain a good phy-logeny (Philippe et al., 2004). These works are allowingthe formalization of a concatenation methodology.
As we have shown for this particular data set, su-pertree and supermatrix methods allow exploring all thephylogenetic signals contained in a bacterial genome.Both analyses are valid, complementary starting pointsin the evaluation of the incidence of events such as ver-tical transmission, horizontal gene transfers, duplica-tions, or phylogenetic noise. Supermatrix methods area double-edged sword, because they allow recoveringthe strongest phylogenetic signal even if the superma-trix is composed by alignments where this signal is hid-den; i.e., it is not the strongest one (Gatesy 1999, Gatesyand Baker, 2005), but, at the same time, this could re-sult in the masking of other alternative signals. The pres-ence of these alternative signals is more easily revealedby analyses based on the underlying gene topologies.As shown in this work, these signals usually arise in asupertree or consensus framework in the form of incon-gruence around some taxa. For instance, the supermatrixapproach failed to reveal the phylogenetic incongru-ence around Xanthomonadales position in the base ofthe γ -Proteobacteria tree (Fig. 2), whereas both the ‘200-gene’ tree consensus and the supertree of the ‘379- and579-gene’ trees placed them as β-Proteobacteria or as
a low-supported γ -Proteobacteria clade (Comas et al.,2006a).
Many factors have to be considered in selecting amethodology for whole genome phylogenetic analy-ses. We have shown that for intermediate phylogeneticdepths, it is possible to recover the primary phyloge-netic signal of the genomes through the concatenation ofshared genetic content, although caution must be takenbecause usually a single model of evolution is applied toall the alignment; only recently the use of mixed modelsis being evaluated (Pagel and Meade, 2004). Meanwhile,the supertree approach seems to be better suited to re-veal conflicting gene tree signals (i.e., the positioning ofXanthomonadales) and when data are sparse (Sander-son and Driskell, 2003), which is usually the case forlarge evolutionary distances. One such example is thesupertree obtained from 730 gene trees of 45 organismsfrom the three domains of life (Daubin et al., 2002).The gene tree approach is suitable when working withspecies without complete genome sequences or for fast,exploratory phylogenetic analyses. These techniques arenot incompatible but complementary, allowing the de-tection of possible sources of error and pointing towardsinteresting evolutionary problems. As we have shown,the use of different methodologies, from single-gene togenome-scale phylogenies, allows the identification ofthe different phylogenetic signals encoded in bacterialgenomes.
The Phylogenetic Landscape of Proteobacteria: ThePlacement of Xanthomonadales and Insect Endosymbionts
Previous reports and this phylogenomic analysis ofProteobacteria have identified two main problems in thephylogeny of these bacteria. On one hand, the mono-phyletic or polyphyletic origin of insect endosymbiontshas generated a debate. Most studies using a multigeneapproach have placed this group as a monophyletic cladesister to the YESS cluster (Lerat et al., 2003; Canbacket al., 2004). However, studies with single-gene phyloge-nies have pointed out that the group is not monophyletic(Charles et al., 2001; Herbeck et al., 2004), with the Buch-nera clade as sister of the cluster YESS and suggestingthat the other two endosymbionts (B. floridanus and Wig-glesworthia brevipalpis) could have an independent ori-gin related with secondary endosymbionts. On the otherhand, the concatenate analysis, although presenting astrong primary phylogenetic signal, revealed some sec-ondary topologies with incongruence in the placementof Xanthomonadales. In consequence, the topologies ob-tained in this study have been analyzed and discussedbased on the position and evolutionary relatedness of theXanthomonadales and insect endosymbionts groups.
The most frequently used phylogenetic marker inbacterial systematics is 16S rDNA (Woese, 1987). In thisparticular case, the 16S rDNA topology was not robustto different methods of phylogenetic reconstructionas the result obtained depended on the method andmodel of evolution used for analysis. However, despitethese discrepancies, all 16S rDNA topologies clustered
2007 COMAS ET AL.—PHYLOGENOMICS AND THE EVOLUTION OF γ -PROTEOBACTERIA 13
the Xanthomonadales with the β-Proteobacteria. Ascreening of the gene trees reveals that the three Xan-thomonadales usually conform to a monophyletic groupwhose placement in the Proteobacteria tree is unclear(see also Comas et al., 2006a).
As we have described, all the concatenate analysesrevealed a main phylogenetic signal in which the Xan-thomonadales are placed at the base of γ -Proteobacteria.However, a secondary phylogenetic signal was also ob-served. This signal also appeared in some single genephylogenies in which the Xanthomonadales were ex-cluded from the gamma clade. Therefore, although theuse of concatenates of different numbers of gene (60, 200,and 579) has allowed us to establish the main phyloge-netic signal, this approach also indicated the existenceof alternative signals through different analyses evalu-ating the support for the main topology. Obviously, thelarger the number of gene incorporating the alternativesignal, the higher the support for conflicting phylogenieswill be obtained.
Moreover, this secondary signal appeared morestrongly in the consensus and supertree analyses. Themajority rule consensus tree and the supertree of the 200common gene as well as the supertree obtained from theother 379 gene trees placed again the Xanthomonadaleswith the β-Proteobacteria. These methods are only indi-rectly related to the sequence data because they are basedon the gene trees derived from them. Because of this, theyreflect what was already hinted in the single-gene anal-ysis, that an important fraction of gene exclude the Xan-thomonadales from the gamma subtree, thus revealingthe existence of either nonvertical evolutionary events,or methodological problems, or both, in the placementof Xanthomonadales in the source trees (but see Comaset al., 2006a).
The evolutionary relationship of γ -Proteobacteria en-dosymbionts remains a controversial issue. The firstattempts to address this problem using single-genephylogenies produced conflicting results. For example,Heddi et al. (1998) and Schroder et al. (1996) supportedthe common ancestor hypothesis whereas Charles et al.(2001) defended a paraphyletic origin for insect en-dosymbionts. More recently, even with the availability ofgenomic data, the same conflicting results have been re-produced. Three other phylogenomic analyses supportthe common ancestor hypothesis: Gil et al. (2003) ob-tained this result after maximum likelihood and Bayesiananalyses of 61 conserved proteins involved in transla-tion; Lerat et al. (2003) obtained it from the common coreof proteins, those present in the common ancestor andnot involved in lateral transfers, for 13 γ -Proteobacteriaspecies including one Buchnera and one Wigglesworthiaspecies; and Canback et al. (2004) also examined the re-lationship of Proteobacteria including two Buchnera andW. brevipalpis using three different methods. These threestudies agree with ours in postulating a common an-cestor for the endosymbionts and placing them as sistergroup to the YESS cluster.
However, two other studies have reached differentconclusions: Herbeck et al. (2004) analyzed the 16S rDNA
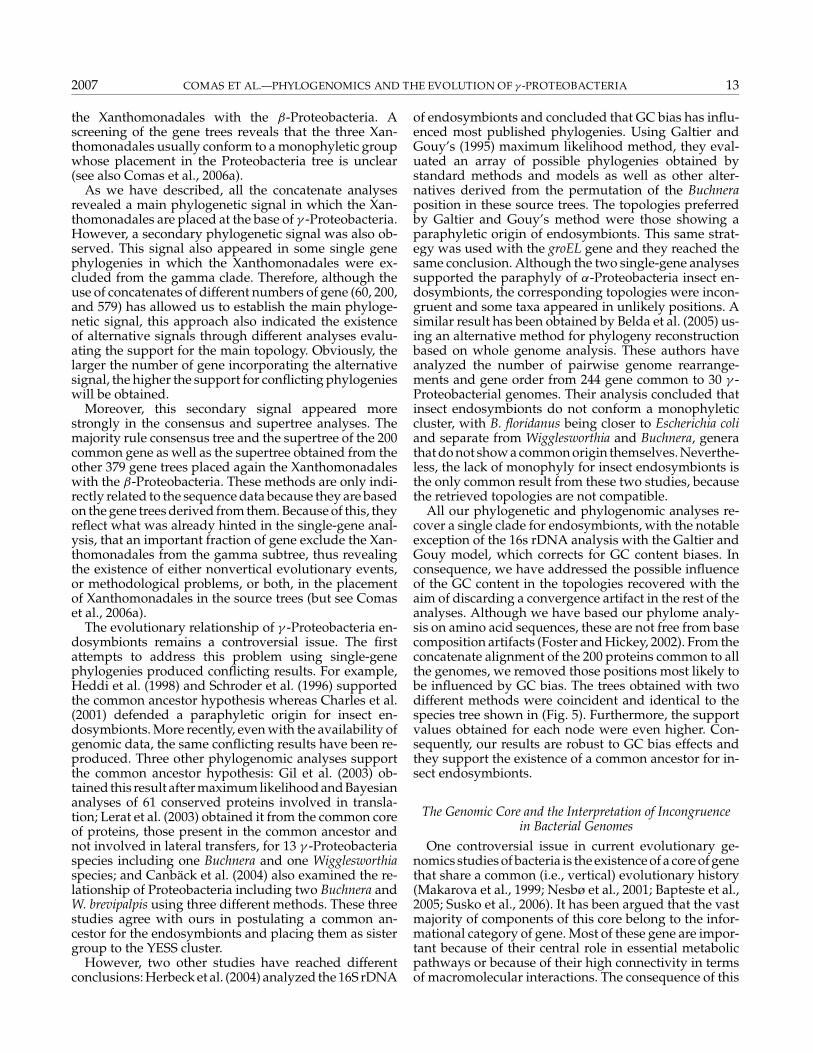
of endosymbionts and concluded that GC bias has influ-enced most published phylogenies. Using Galtier andGouy’s (1995) maximum likelihood method, they eval-uated an array of possible phylogenies obtained bystandard methods and models as well as other alter-natives derived from the permutation of the Buchneraposition in these source trees. The topologies preferredby Galtier and Gouy’s method were those showing aparaphyletic origin of endosymbionts. This same strat-egy was used with the groEL gene and they reached thesame conclusion. Although the two single-gene analysessupported the paraphyly of α-Proteobacteria insect en-dosymbionts, the corresponding topologies were incon-gruent and some taxa appeared in unlikely positions. Asimilar result has been obtained by Belda et al. (2005) us-ing an alternative method for phylogeny reconstructionbased on whole genome analysis. These authors haveanalyzed the number of pairwise genome rearrange-ments and gene order from 244 gene common to 30 γ -Proteobacterial genomes. Their analysis concluded thatinsect endosymbionts do not conform a monophyleticcluster, with B. floridanus being closer to Escherichia coliand separate from Wigglesworthia and Buchnera, generathat do not show a common origin themselves. Neverthe-less, the lack of monophyly for insect endosymbionts isthe only common result from these two studies, becausethe retrieved topologies are not compatible.
All our phylogenetic and phylogenomic analyses re-cover a single clade for endosymbionts, with the notableexception of the 16s rDNA analysis with the Galtier andGouy model, which corrects for GC content biases. Inconsequence, we have addressed the possible influenceof the GC content in the topologies recovered with theaim of discarding a convergence artifact in the rest of theanalyses. Although we have based our phylome analy-sis on amino acid sequences, these are not free from basecomposition artifacts (Foster and Hickey, 2002). From theconcatenate alignment of the 200 proteins common to allthe genomes, we removed those positions most likely tobe influenced by GC bias. The trees obtained with twodifferent methods were coincident and identical to thespecies tree shown in (Fig. 5). Furthermore, the supportvalues obtained for each node were even higher. Con-sequently, our results are robust to GC bias effects andthey support the existence of a common ancestor for in-sect endosymbionts.
The Genomic Core and the Interpretation of Incongruencein Bacterial Genomes
One controversial issue in current evolutionary ge-nomics studies of bacteria is the existence of a core of genethat share a common (i.e., vertical) evolutionary history(Makarova et al., 1999; Nesbø et al., 2001; Bapteste et al.,2005; Susko et al., 2006). It has been argued that the vastmajority of components of this core belong to the infor-mational category of gene. Most of these gene are impor-tant because of their central role in essential metabolicpathways or because of their high connectivity in termsof macromolecular interactions. The consequence of this
14 SYSTEMATIC BIOLOGY VOL. 56
division is that informational gene are less prone to hor-izontal gene transfer (HGT) than operational ones (Jainet al., 1999).
One remarkable result from our phylogenetic analy-ses is that a substantial fraction (21.4 %) of informationalgene reject the presumed species tree, whereas for op-erational ones the corresponding value is not too muchlarger (32.5%). To prove the existence of a genomic core,Daubin et al. (2002) also computed the Robinson-Fouldsdistances for all of gene trees pairs from an initial poolof 310 trees. Next, they represented these distances ina two-dimensional space by means of principal coordi-nates analysis and chose as a core those gene trees in thehighest density zone. Using this method they selected121 gene to establish their set of core gene. Their mostrelevant result is that nearly half of these gene were op-erational. Therefore, it seems that the division betweenoperational and informational gene is not adequate toexplain the existence of incongruences and of a core ofgene in bacterial genomes. These results call for somecaution when selecting gene for phylogenetic analysison the basis of their functional category assignment (seealso Comas et al., 2006b). In fact, in our concatenate anal-ysis we have shown that the presence of gene that rejectthe presumed species tree and the mixture of operationaland informational gene are not sufficient obstacles to re-cover the main evolutionary history of these species.
It is also relevant to note that most of the gene we haveanalyzed are present in the genomes as single-copy gene.This means that possible incongruences not related withmethodological problems between gene and presumedspecies trees for these gene must be classified as casesof nonorthologous gene displacement (horizontal genetransfer, hidden paralogies). Lerat et al. (2003) carried outa similar approach to estimate the incidence of incongru-ence in their data set of 206 common gene derived from13 γ -Proteobacteria and detected only two cases of HGT(but see Susko et al., 2006). The wider taxon samplingused in this analysis has led us to detect more cases ofincongruence with a similar number of gene trees.
However, it is worth noting that our topologies testsdo not address directly the question about the sourceof incongruence, which is analyzed in more detail else-where (Comas et al., 2006a) and is aimed only at revealingthe importance of considering the different phylogeneticsignals present in bacterial genomes. This study, whichis mainly centred on analyzing the evolutionary rela-tionships of endosymbionts, has not been designed tospecifically detect horizontal gene transfers. Endosym-bionts have not undergone gene exchange since theyestablished their close intracellular relationship with theinsect hosts (Akman et al., 2002; Tamas et al., 2002; Gilet al., 2003; van Ham et al., 2003). However, our anal-ysis has pointed towards taxa where phylogenetic in-congruence is particularly pervasive. A closer look toXanthomonadales (Comas et al. 2006a) has allowed dis-tinguishing between phylogenetic noise and nonverticalevolutionary events, and similar analyses (Beiko et al.,2005) might also be revealing of the complexities of theevolutionary processes in bacterial lineages.
ACKNOWLEDGEMENTS
We express our gratitude to the associate editor, Ron DeBry, and thereviewers, Amy Briskell and James McInerney, for their many valuablecomments and suggestions that have greatly helped us. This work hasbeen supported by projects BMC2003-00305 from Spanish Ministeriode Ciencia y Tecnologıa and Grupos 03/2004 from Generalitat Valencia.IC is recipient of a predoctoral fellowship from the Spanish Ministeriode Educacion y Ciencia.
REFERENCES
Akman, L., A. Yamashita, H. Watanabe, K. Oshima, T. Shiba, M. Hattori,et al. 2002. Genome sequence of the endocellular obligate symbiontof tsetse flies, Wigglesworthia glossinidia. Nat. Genet. 32:402–407.
Altschul, S. E., T. L. Madden, A. A. Schaffer, J. Zhang, W. Miller, and D. J.Lipman. 1997. Gapped BLAST and PSI-BLAST: A new generation ofprotein database search programs. Nucleic Acids Res. 25:3389–3402.
Asai, T., D. Zaporojets, C. Squires, and C. L. Squires. 1999. An Escherichiacoli strain with all chromosomal rRNA operons inactivated: Com-plete exchange of rRNA gene between bacteria. Proc. Natl. Acad. Sci.USA 96:1971–1976.
Bapteste, E., H. Brinkmann, J. A. Lee, D. V. Moore, C. W. Sensen, P.Gordon, et al. 2002. The analysis of 100 gene supports the groupingof three highly divergent amoebae: Dictyostelium, Entamoeba, andMastigamoeba. Proc. Natl. Acad. Sci. USA 99:1414–1419.
Bapteste, E., E. Susko, J. Leigh, D. Macleod, R. L. Charlebois, and W.F. Doolittle. 2005. Do orthologous gene phylogenies really supporttree-thinking? BMC Evol. Biol. 5:e33.
Baum, B. R. 1992. Combining trees as a way of combining data sets forphylogenetic inference, and the desirability of combining gene trees.Taxon 41:3–10.
Beiko, R. G., T. J. Harlow, and M. A. Ragan. 2005. Highways of genesharing in prokaryotes. Proc. Natl. Acad. Sci. USA 102:14332–14337.
Belda, E., A. Moya, and F. J. Silva. 2005. Genome rearrangement dis-tances and gene order phylogeny inγ -Proteobacteria. Mol. Biol. Evol.22:1456–1467.
Benson, D. A., I. Karsch-Mizrachi, D. J. Lipman, J. Ostell, and D. L.Wheeler. 2004. GenBank: Update Nucleic Acids Res. 32:D23–D26.
Bininda-Emonds, O. R. P. 2004a. New uses for old phylogenies. Pp. 3–14in Phylogenetic supertrees. combining information to reveal the treeof life (O. R. P. Bininda-Emonds, ed.) Kluwer Academic Publishers,Dordrecht.
Bininda-Emonds, O. R. P. 2004b. Trees versus characters and the su-pertree/supermatrix “paradox.” Syst. Biol. 53:356–359.
Bininda-Emonds, O. R. P., J. L. Gittleman, and M. A. Steel. 2002. The(super)tree of life: Procedures, problems, and prospects. Annu. Rev.Ecol. Syst. 33:265–289.
Bininda-Emonds, O. R. P., and M. J. Sanderson. 2001. Assessment of theaccuracy of matrix representation with parsimony analysis supertreeconstruction. Syst. Biol. 50:565–579.
Brochier, C., E. Bapteste, D. Moreira, and H. Philippe. 2002. Eubacterialphylogeny based on translational apparatus proteins. Trends Genet.18:1–5.
Brown, J. R., C. J. Douady, M. J. Italia, W. E. Marshall, and M. J. Stanhope.2001. Universal trees based on large combined protein sequence datasets. Nat. Genet. 28:281–285.
Burleigh, J., A. C. Driskell, and M. Sanderson. 2006. Supertree boot-strapping methods for assessing phylogenetic variation among genein genome-scale data sets. Syst. Biol. 55:426–440.
Canback, B., I. Tamas, and S. G. E. Andersson. 2004. A phylogenomicstudy of endosymbiotic bacteria. Mol. Biol. Evol. 21:1110–1122.
Castresana, J. 2000. Selection of conserved blocks from multiple align-ments for their use in phylogenetic analysis. Mol. Biol. Evol. 17:540–552.
Charlebois, R. L., and W. F. Doolittle. 2004. Computing prokaryotic geneubiquity: Rescuing the core from extinction. Genome Res. 14:2469–2477.
Charles, H., A. Heddi, and Y. Rahbe. 2001. A putative insect intracellu-lar endosymbiont stem clade, within the Enterobacteriaceae, inferredfrom phylogenetic analysis based on a heterogeneous model of DNAevolution. Comptes Rendus de l’Academie des Sciences, Series III–Sciences de la Vie 324:489–494.
2007 COMAS ET AL.—PHYLOGENOMICS AND THE EVOLUTION OF γ -PROTEOBACTERIA 15
Comas, I., A. Moya, R. K. Azad, J. G. Lawrence, and F. Gonzalez-Candelas. 2006a. The evolutionary origin of Xanthomonadalesgenomes and the nature of the horizontal gene transfer process. Mol.Biol. Evol. 23: 2049–2057.
Comas, I., A. Moya, and F. Gonzalez-Candelas. 2006b. Phylogeneticsignal and functional categories in Proteobacteria genomes. BMCEvol. Biol. In press.
Creevey, C. J. 2004. Clann: Construction of supertrees and ex-ploration of phylogenomic information from partially overlap-ping datasets. Program manual. Available at http://bioinf.may.ie/software/clann/.
Creevey, C. J., D. A. Fitzpatrick, G. K. Philip, R. J. Kinsella, M. J.O’Connell, M. M. Pentony, et al. 2004. Does a tree-like phylogenyonly exist at the tips in the prokaryotes? Proc. R. Soc. Lond. B271:2551–2558.
Creevey, C. J., and J. O. McInerney. 2005. Clann: Investigating phyloge-netic information through supertree analyses. Bioinformatics 21:390–392.
Daubin, V., M. Gouy, and G. Perriere. 2002. A phylogenomic approachto bacterial phylogeny: Evidence of a core of gene sharing a commonhistory. Genome Res. 12:1080–1090.
Delsuc, F., H. Brinkmann, and H. Philippe. 2005. Phylogenomics andthe reconstruction of the tree of life. Nat. Rev. Genet. 6:361–375.
Doolittle, W. F. 1999. Phylogenetic classification and the universal tree.Science 284:2124–2128.
Driskell, A. C., C. Ane, J. G. Burleigh, M. M. McMahon, B. C. O’Meara,and M. J. Sanderson. 2004. Prospects for building the tree of life fromlarge sequence databases. Science 306:1172–1174.
Eisen, J. A. 1998. Phylogenomics: Improving functional predictions foruncharacterized gene by evolutionary analysis. Genome Res. 8:163–167.
Eisen, J. A., and C. M. Fraser. 2003. Phylogenomics: Intersection ofevolution and genomics. Science 300:1706–1707.
Felsenstein, J. 2005. PHYLIP: Phylogenetic Inference Package. Release3.6. Department of Genome Sciences. University of Washington,Seattle.
Foster, P. G., and D. A. Hickey. 2002. Compositional bias may affectboth DNA-based and protein-based phylogenetic reconstructions.J. Mol. Evol. 48:284–290.
Galtier, N., and M. Gouy. 1995. Inferring phylogenies from DNA se-quences of unequal base compositions. Proc. Natl. Acad. Sci. USA92:11317–11321.
Galtier, N., M. Gouy, and C. Gautier. 1996. SEAVIEW and PHYLO WIN:Two graphic tools for sequence alignment and molecular phylogeny.Comp. Appl. Biosci. 12:543–548.
Gatesy, J., and R. H. Baker. 2005. Hidden likelihood support in genomicdata: Can forty-five wrongs make a right? Syst. Biol. 54:483–492.
Gatesy, J., C. Matthee, R. DeSalle, and C. Hayashi. 2002. Resolution ofa supertree/supermatrix paradox. Syst. Biol. 51:652–664.
Gatesy, J., M. Milinkovitch, V. Waddell, and M. Stanhope. 1999. Stabil-ity of cladistic relationships between Cetacea and higher-level artio-dactyl taxa. Syst. Biol. 48:6–20.
Gil, R., F. J. Silva, J. Pereto, and A. Moya. 2004. Determination of the coreof a minimal bacterial gene set. Microbiol. Mol. Biol. Rev. 68:518–537.
Gil, R., F. J. Silva, E. Zientz, F. Delmotte, F. Gonzalez-Candelas, A.Latorre, et al. 2003. The genome sequence of Blochmannia floridanus:Comparative analysis of reduced genomes. Proc. Natl. Acad. Sci.USA 100:9388–9393.
Goldman, N., J. P. Anderson, and A. G. Rodrigo. 2000. Likelihood-basedtests of topologies in phylogenetics. Syst. Biol. 49:652–670.
Gontcharov, A. A., B. Marin, and M. Melkonian. 2004. Are combinedanalysis better than single gene phylogenies? A case study usingSSU rDNA and rbcl sequence comparisons in the Zygnematophyceae(Streptophyta). Mol. Biol. Evol. 21:612–624.
Gu, X., and H. Zhang. 2004. Genome phylogenetic analysis based onextended gene contents. Mol. Biol. Evol. 21:1401–1408.
Guindon, S., and O. Gascuel. 2003. A simple, fast, and accurate algo-rithm to estimate large phylogenies by maximum likelihood. Syst.Biol. 52:696–704.
Heddi, A., H. Charles, C. Khatchadourian, G. Bonnot, and P. Nardon.1998. Molecular characterization of the principal symbiotic bacte-ria of the weevil Sitophilus oryzae: A peculiar G + C content of anendocytobiotic DNA. J. Mol. Evol. 47:52–61.
Herbeck, J. T., P. H. Degnan, and J. J. Wernegreen. 2004. Non-homogeneous model of sequence evolution indicates independentorigins of primary endosymbionts within the Enterobacteriales (γ -Proteobacteria). Mol. Biol. Evol. 22:520–532.
Herniou, E. A., T. Luque, X. Chen, J. M. Vlak, D. Winstanley, J. S. Cory,et al. 2001. Use of whole genome sequence data to infer Baculovirusphylogeny. J. Virol. 75:8117–8126.
Huson, D. H., and M. Steel. 2004. Phylogenetic trees based on genecontent. Bioinformatics 20:2044–2049.
Jain, R., M. C. Rivera, and J. A. Lake. 1999. Horizontal gene transferamong genomes: The complexity hypothesis. Proc. Natl. Acad. Sci.USA 96:3801–3806.
Jones, D. T., W. R. Taylor, and J. M. Thornton. 1992. The rapid generationof mutation data matrices from protein sequences. Comput. Appl.Biosci. 8:275–282.
Kishino, H., and M. Hasegawa. 1989. Evaluation of the maximum like-lihood estimate of the evolutionary tree topologies from DNA se-quence data, and the branching order in Hominoidea. J. Mol. Evol.29:170–179.
Korbel, J., B. Snel, M. Huynen, and P. Bork. 2002. SHOT: A web serverfor the construction of genome phylogenies. Trends Genet. 18:158–162.
Kumar, S., K. Tamura, and M. Nei. 2004. MEGA3: Integrated softwarefor molecular evolutionary genetics analysis and sequence align-ment. Brief Bioinformatics 5:150–163.
Kurland, C. G., B. Canback, and O. G. Berg. 2003. Horizontal genetransfer: A critical view. Proc. Natl. Acad. Sci. USA 100:9658–9662.
Lerat, E., V. Daubin, and N. Moran. 2003. From gene trees to organismalphylogeny in prokaryotes: The case of γ -proteobacteria. PLoS Biol.1:1–9.
Loomis, W. F., and D. W. Smith. 1990. Molecular phylogeny of Dic-tyostelium discodeum by protein sequence comparison. Proc. Natl.Acad. Sci. USA 87:9093–9097.
Makarova, K. S., L. Aravind, M. Y. Galperin, N. V. Grishin, R. L. Tatusov,Y. I. Wolf, et al. 1999. Comparative genomics of the Archaea (Eur-yarchaeota): evolution of conserved protein families, the stable core,and the variable shell. Genome Res. 9:608–628.
Moreira, D., and H. Philippe. 2000. Molecular phylogeny: Pitfalls andprogress. Int. Microbiol. 3:9–16.
Nesbø, C. L., Y. Boucher, and W. F. Doolittle. 2001. Defining the coreof nontransferable prokaryotic gene: The euryarchaeal core. J. Mol.Evol. 53:340–350.
O’Brien, S. J., and R. Stanyon. 1999. Phylogenomics: Ancestral primateviewed. Nature 402:365–366.
Pagel, M., and A. Meade. 2004. A phylogenetic mixture model fordetecting pattern-heterogeneity in gene sequence or character-statedata. Syst. Biol. 53:571–581.
Philippe, H., E. A. Snell, E. Bapteste, P. Lopez, P. W. H. Holland, and D.Casane. 2004. Phylogenomics of eukaryotes: Impact of missing dataon large alignments. Mol. Biol. Evol. 21:1740–1752.
Phillips, M. J., F. Delsuc, and D. Penny. 2004. Genome-scale phylogenyand the detection of systematic biases. Mol. Biol. Evol. 21:1455–1458.
Posada, D., and K. A. Crandall. 1998. ModelTest: Testing the model ofDNA substitution. Bioinformatics 14:917–918.
Ragan, M. A. 1992. Matrix representation in reconstructing phyloge-netic relationships among the eukaryotes. Biosystems 28:47–55.
Rokas, A., B. L. Williams, N. King, and S. B. Carroll. 2003. Genome-scaleapproaches to resolving incongruence in molecular phylogenies. Na-ture 425:798–804.
Ronquist, F., and J. P. Huelsenbeck. 2003. MrBayes 3: Bayesian phylo-genetic inference under mixed models. Bioinformatics 19:1572–1574.
Saitou, N., and M. Nei. 1987. The neighbor-joining method: A newmethod for reconstructing phylogenetic trees. Mol. Biol. Evol. 4:406–425.
Sanderson, M. J., and A. C. Driskell. 2003. The challenge of constructinglarge phylogenetic trees. Trends Plant Sci. 8:374–379.
Sanderson, M. J., A. Purvis, and C. Henze. 1998. Phyogenetic su-pertrees: Assembling the trees of life. Trends Ecol. Evol. 13:105–109.
Sanderson, M. J., and H. B. Shaffer. 2002. Troubleshooting molecularphylogenetic analyses. Annu. Rev. Ecol. Syst. 33:49–72.
Schmidt, H. A., K. Strimmer, M. Vingron, and A. von Haeseler. 2002.TREE-PUZZLE: Maximum likelihood phylogenetic analysis usingquartets and parallel computing. Bioinformatics 18:502–504.
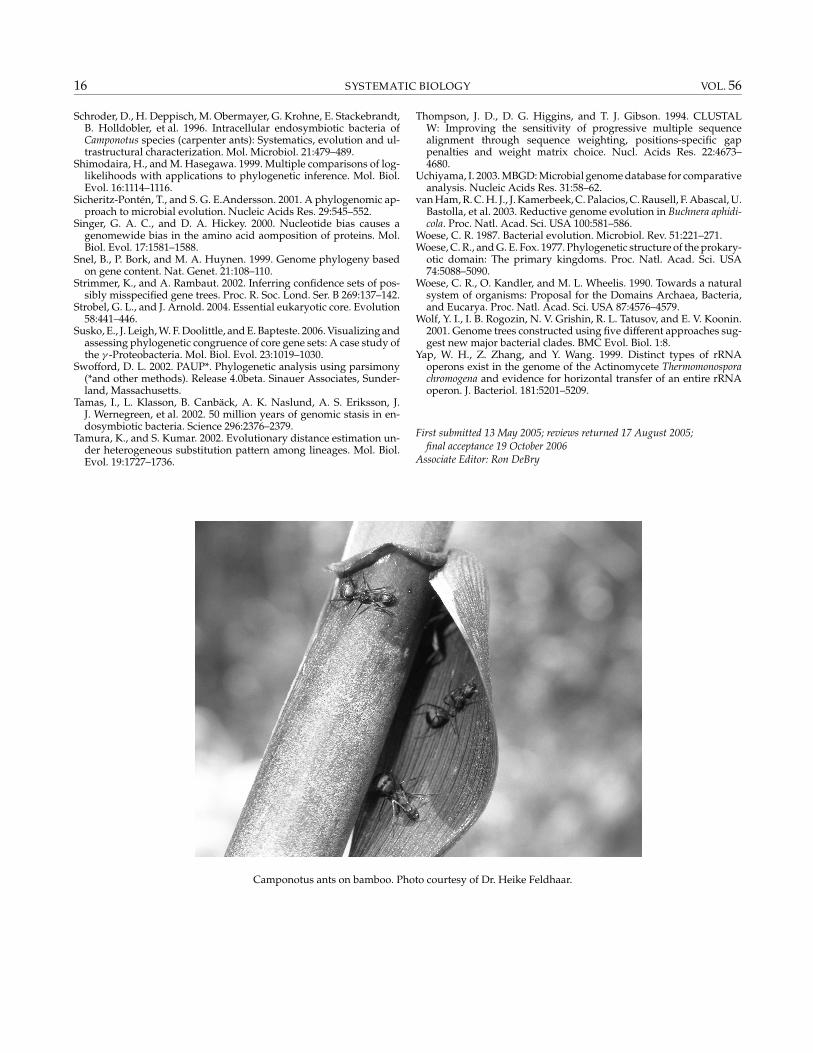
16 SYSTEMATIC BIOLOGY VOL. 56
Schroder, D., H. Deppisch, M. Obermayer, G. Krohne, E. Stackebrandt,B. Holldobler, et al. 1996. Intracellular endosymbiotic bacteria ofCamponotus species (carpenter ants): Systematics, evolution and ul-trastructural characterization. Mol. Microbiol. 21:479–489.
Shimodaira, H., and M. Hasegawa. 1999. Multiple comparisons of log-likelihoods with applications to phylogenetic inference. Mol. Biol.Evol. 16:1114–1116.
Sicheritz-Ponten, T., and S. G. E.Andersson. 2001. A phylogenomic ap-proach to microbial evolution. Nucleic Acids Res. 29:545–552.
Singer, G. A. C., and D. A. Hickey. 2000. Nucleotide bias causes agenomewide bias in the amino acid aomposition of proteins. Mol.Biol. Evol. 17:1581–1588.
Snel, B., P. Bork, and M. A. Huynen. 1999. Genome phylogeny basedon gene content. Nat. Genet. 21:108–110.
Strimmer, K., and A. Rambaut. 2002. Inferring confidence sets of pos-sibly misspecified gene trees. Proc. R. Soc. Lond. Ser. B 269:137–142.
Strobel, G. L., and J. Arnold. 2004. Essential eukaryotic core. Evolution58:441–446.
Susko, E., J. Leigh, W. F. Doolittle, and E. Bapteste. 2006. Visualizing andassessing phylogenetic congruence of core gene sets: A case study ofthe γ -Proteobacteria. Mol. Biol. Evol. 23:1019–1030.
Swofford, D. L. 2002. PAUP*. Phylogenetic analysis using parsimony(*and other methods). Release 4.0beta. Sinauer Associates, Sunder-land, Massachusetts.
Tamas, I., L. Klasson, B. Canback, A. K. Naslund, A. S. Eriksson, J.J. Wernegreen, et al. 2002. 50 million years of genomic stasis in en-dosymbiotic bacteria. Science 296:2376–2379.
Tamura, K., and S. Kumar. 2002. Evolutionary distance estimation un-der heterogeneous substitution pattern among lineages. Mol. Biol.Evol. 19:1727–1736.
Camponotus ants on bamboo. Photo courtesy of Dr. Heike Feldhaar.
Thompson, J. D., D. G. Higgins, and T. J. Gibson. 1994. CLUSTALW: Improving the sensitivity of progressive multiple sequencealignment through sequence weighting, positions-specific gappenalties and weight matrix choice. Nucl. Acids Res. 22:4673–4680.
Uchiyama, I. 2003. MBGD: Microbial genome database for comparativeanalysis. Nucleic Acids Res. 31:58–62.
van Ham, R. C. H. J., J. Kamerbeek, C. Palacios, C. Rausell, F. Abascal, U.Bastolla, et al. 2003. Reductive genome evolution in Buchnera aphidi-cola. Proc. Natl. Acad. Sci. USA 100:581–586.
Woese, C. R. 1987. Bacterial evolution. Microbiol. Rev. 51:221–271.Woese, C. R., and G. E. Fox. 1977. Phylogenetic structure of the prokary-
otic domain: The primary kingdoms. Proc. Natl. Acad. Sci. USA74:5088–5090.
Woese, C. R., O. Kandler, and M. L. Wheelis. 1990. Towards a naturalsystem of organisms: Proposal for the Domains Archaea, Bacteria,and Eucarya. Proc. Natl. Acad. Sci. USA 87:4576–4579.
Wolf, Y. I., I. B. Rogozin, N. V. Grishin, R. L. Tatusov, and E. V. Koonin.2001. Genome trees constructed using five different approaches sug-gest new major bacterial clades. BMC Evol. Biol. 1:8.
Yap, W. H., Z. Zhang, and Y. Wang. 1999. Distinct types of rRNAoperons exist in the genome of the Actinomycete Thermomonosporachromogena and evidence for horizontal transfer of an entire rRNAoperon. J. Bacteriol. 181:5201–5209.
First submitted 13 May 2005; reviews returned 17 August 2005;final acceptance 19 October 2006
Associate Editor: Ron DeBry