
Survey Quality Jim Condon NRAO, Charlottesville. Survey Qualities Leiden 2011 Feb 25 Point-source...
17
Survey Quality Jim Condon NRAO, Charlottesville
-
Upload
stewart-quinn -
Category
Documents
-
view
215 -
download
0
Transcript of Survey Quality Jim Condon NRAO, Charlottesville. Survey Qualities Leiden 2011 Feb 25 Point-source...
Survey Quality
Jim CondonNRAO, Charlottesville
Survey Qualities
Leiden 2011 Feb 25
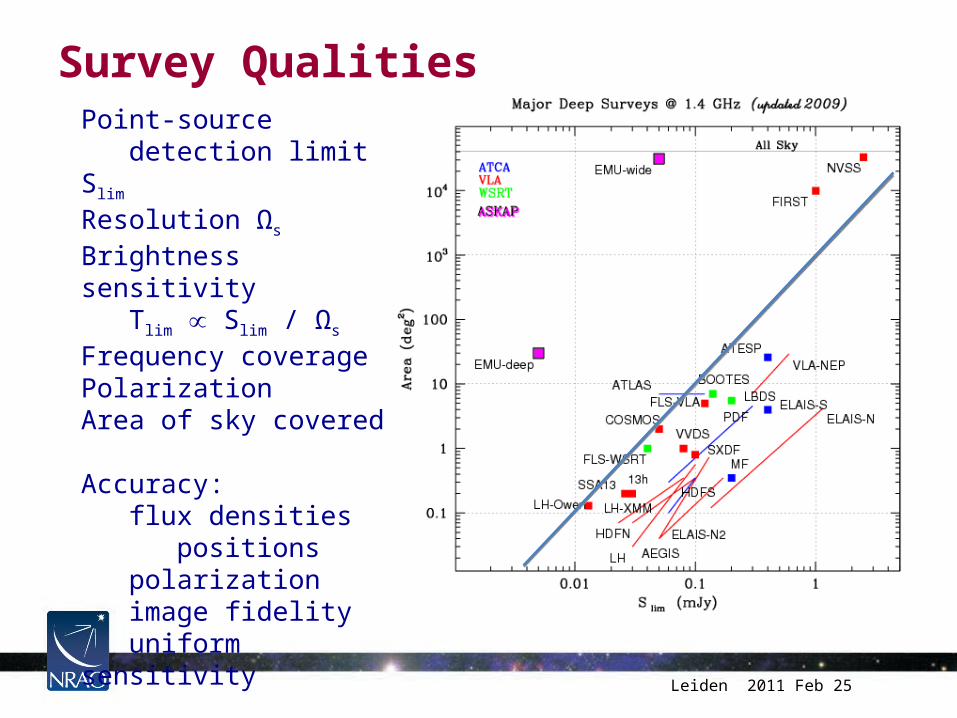
Point-source detection limit Slim
Resolution Ωs
Brightness sensitivity Tlim S∝ lim / Ωs
Frequency coveragePolarizationArea of sky covered
Accuracy:flux densities
positionspolarizationimage fidelityuniform sensitivity
Random and Systematic Errors
Leiden 2011 Feb 25
Radiometer equation: σ (B t)∝ -1/2
“Give me a lever long enough and a fulcrum on which to place it, and I shall move the world.” - Archimedes
But
V (B t)∝ +1/2
e.g., VNVSS/VEMU ~ 1/60
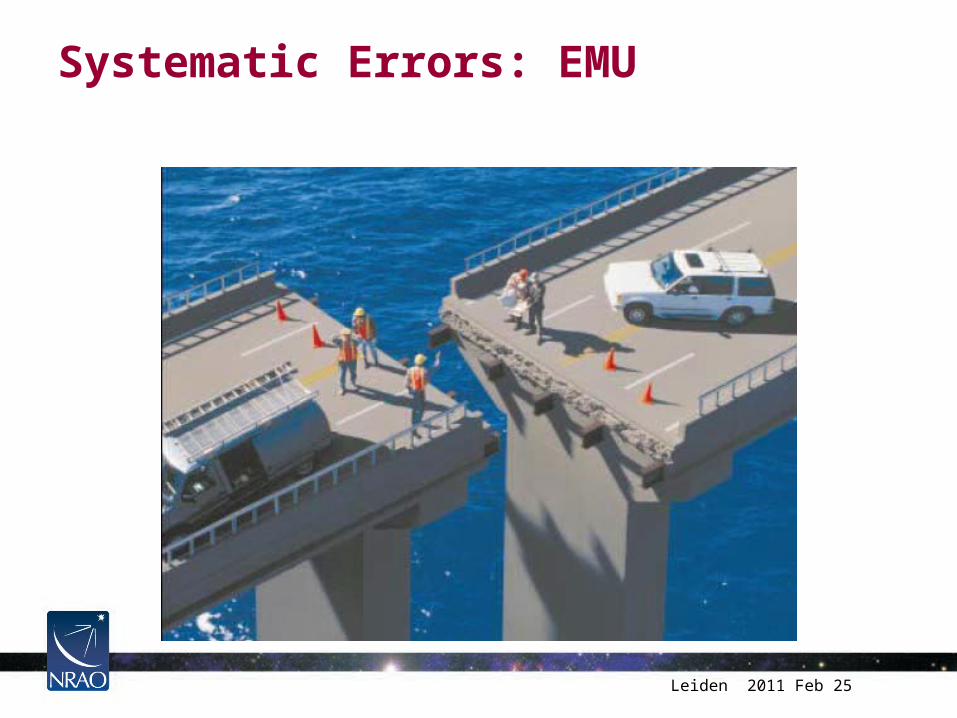
Systematic Errors: EMU
Leiden 2011 Feb 25
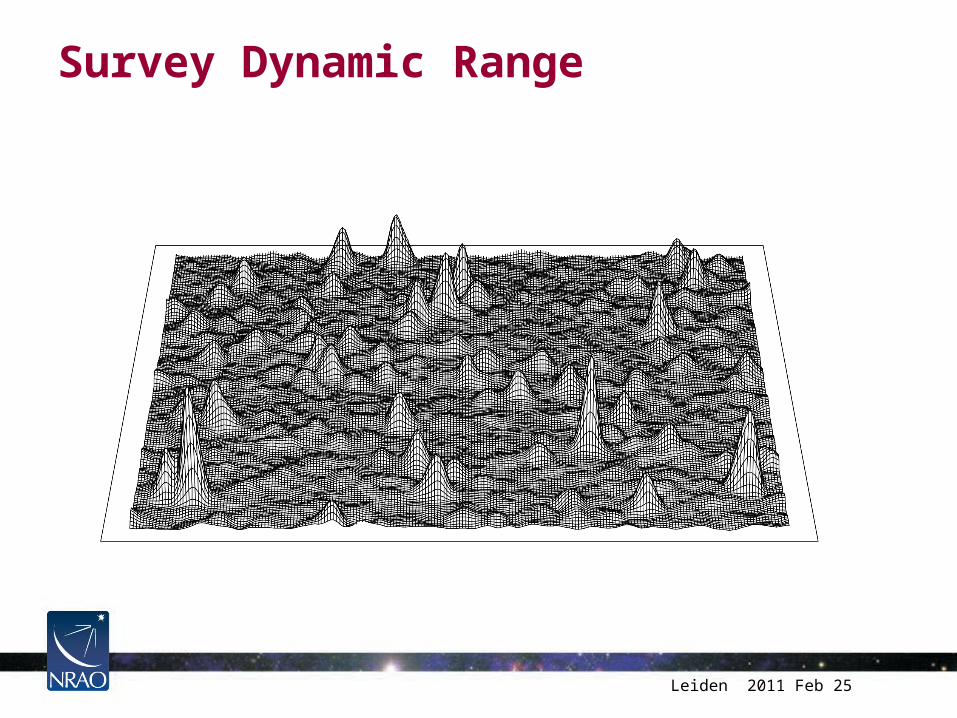
Survey Dynamic Range
Leiden 2011 Feb 25

Effective flux density in primary beam for calculating dynamic rangeMedian <Seff> ~ 0.16 Jy x ×Ω(deg2)
[Minimum Seff > 0.06 Jy x ×Ω(deg2)]
Ex: EMU σ~ 10 μJy so
DR ~ 16000 ~ 42 dbEx: SKA σ~ 9 nJy so
DR ~ 73 db
Leiden 2011 Feb 25

Calibration errors and dynamic rangeAssume that an image is dominated by a single strong source
Let ε = antenna-based rms intensity calibration error ΔS/SLet ϕ = antenna-based rms phase error (radians)
N = number of antennas M = number of independently calibrated observations
D < 2 M1/2 N / ε ex: M = 8, N = 36, ε ~ 0.01 → D < 20000D < M1/2 N / ϕ
(Perley 1988, in “Synthesis Imaging in Radio Astronomy”, p. 287)
SKA Workshop 2009 Feb 19
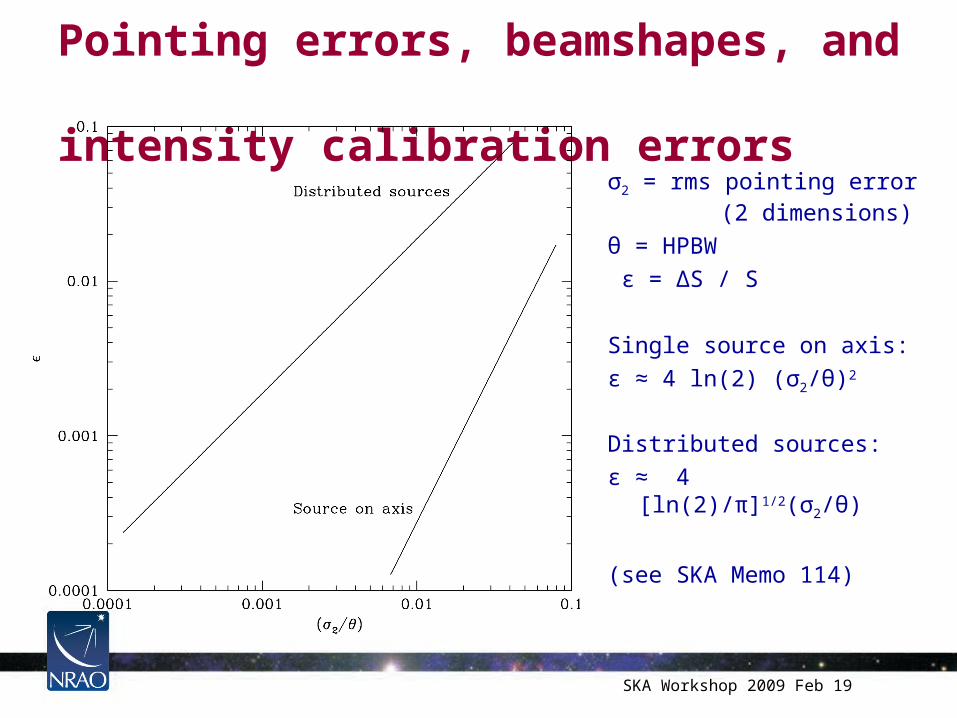
Pointing errors, beamshapes, and
intensity calibration errorsσ2 = rms pointing error
(2 dimensions)θ = HPBW ε = ΔS / S
Single source on axis: ε ≈ 4 ln(2) (σ2/θ)2
Distributed sources: ε ≈ 4 [ln(2)/π]1/2(σ2/θ)
(see SKA Memo 114)
SKA Workshop 2009 Feb 19
Calibration suggestions for SKA pathfinder surveys
• Grid map of strong unresolved source to fully sample the primary beam(s)
• Develop and test analysis package using real data in a small area of sky (6 months on 1 hour of data for the NVSS)
• Check results on faint sources using better reference images with slightly higher angular resolution; calculations alone are not reliable
• Calculate quantitative hardware requirements before it is too late– Antenna pointing accuracy (gravitational, thermal, wind)– Accuracy and stability of PAF primary beams– Pointing correction algorithms– PAF element weighting for “best” primary beams (highest
G/T? lowest sidelobes?)
Leiden 2011 Feb 25
Leiden 2011 Feb 25
Unexpected Errors
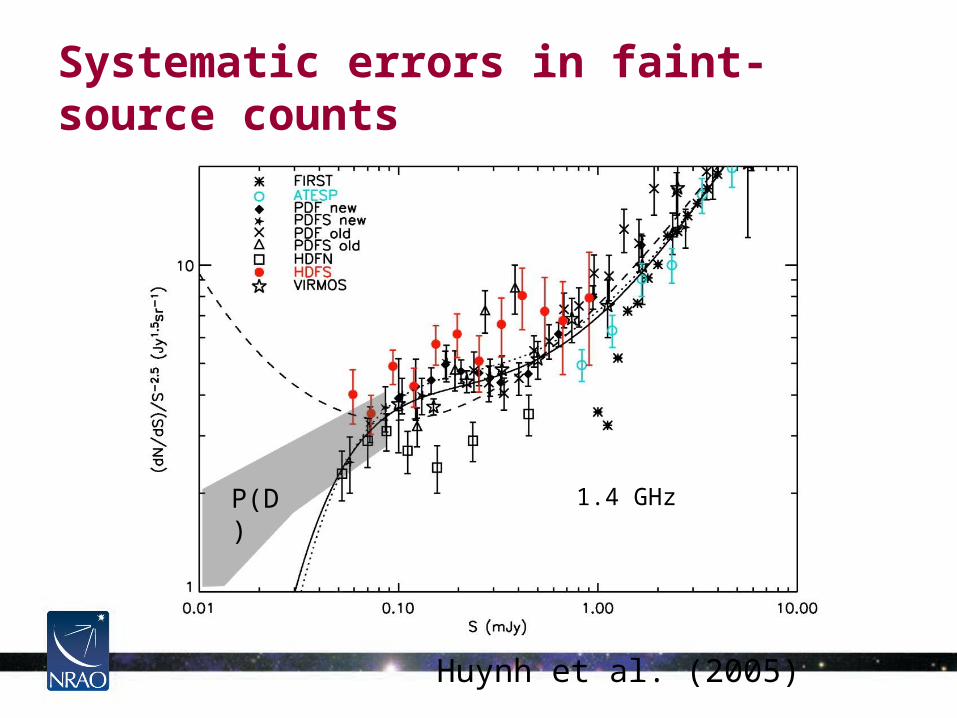
Systematic errors in faint-source counts
Huynh et al. (2005)
P(D) 1.4 GHz

More of the same
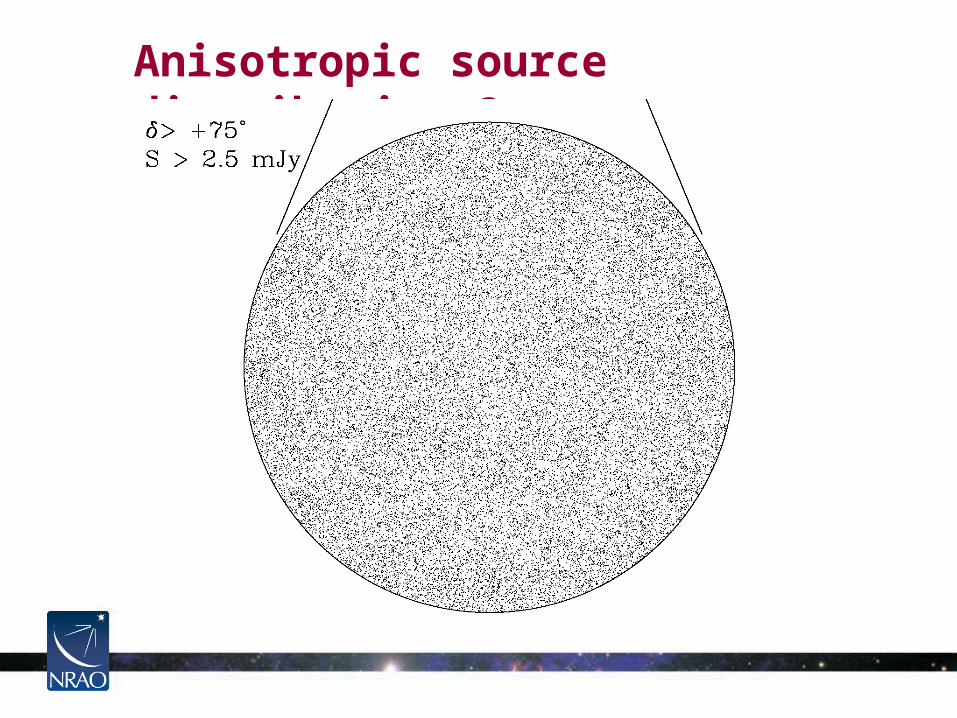
Anisotropic source distributions?
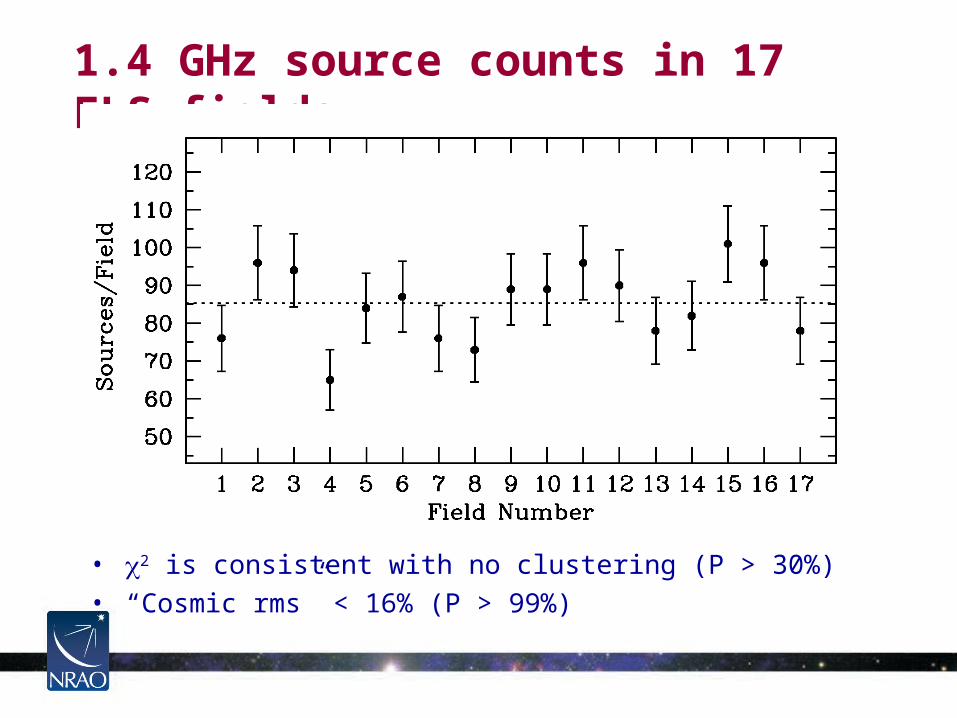
1.4 GHz source counts in 17 FLS fields
• 2 is consistent with no clustering (P > 30%)• “Cosmic rms” < 16% (P > 99%)
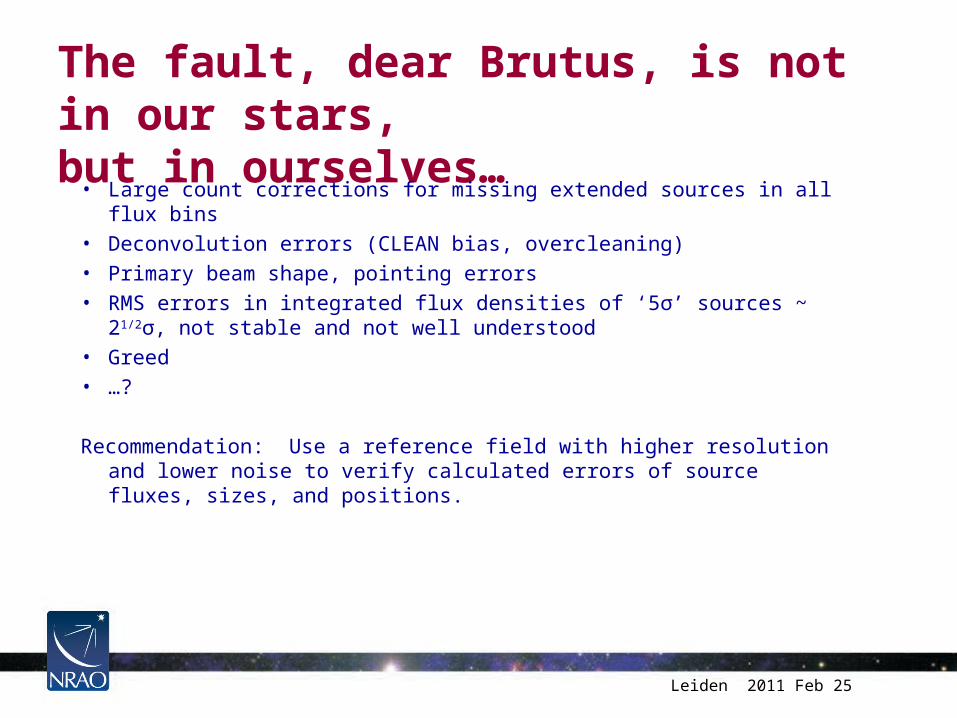
The fault, dear Brutus, is not in our stars,but in ourselves…
• Large count corrections for missing extended sources in all flux bins• Deconvolution errors (CLEAN bias, overcleaning)• Primary beam shape, pointing errors• RMS errors in integrated flux densities of ‘5σ’ sources ~ 21/2σ, not
stable and not well understood• Greed• …?
Recommendation: Use a reference field with higher resolution and lower noise to verify calculated errors of source fluxes, sizes, and positions.
Leiden 2011 Feb 25
Astronomical community:Don’t create a mob of angry villagers
Leiden 2011 Feb 25
All’s well that ends well
Leiden 2011 Feb 25
The whole astronomical community should benefit
“The NVSS team members have agreed to use only these electronically released results for their own research.”
Easily understood and uniform survey parameters(sensitivity, resolution, position accuracy, no holes,…)
Easy-to-use web site