Supplementary Materials for c-Abl Activation Plays a … · Validation of phospho-Y39 α-synuclein...
13
Supplementary Materials for c-Abl Activation Plays a Role in α -Synucleinopathy Induced Neurodegeneration Saurav Brahmachari, Preston Ge, Su Hyun Lee, Donghoon Kim, Senthilkumar S. Karuppagounder, Manoj Kumar, Xiaobo Mao, Yunjong Lee, Olga Pletnikova, Juan C. Troncoso, Valina L. Dawson, Ted M. Dawson, and Han Seok Ko *To whom correspondence may be addressed: Email: [email protected] or [email protected] This PDF file includes Supplemental Figures 1 to 9 Table S1, S2
Transcript of Supplementary Materials for c-Abl Activation Plays a … · Validation of phospho-Y39 α-synuclein...
Supplementary Materials for
c-Abl Activation Plays a Role in α-Synucleinopathy Induced Neurodegeneration
Saurav Brahmachari, Preston Ge, Su Hyun Lee, Donghoon Kim, Senthilkumar S. Karuppagounder, Manoj Kumar, Xiaobo Mao, Yunjong Lee, Olga Pletnikova, Juan C. Troncoso, Valina L. Dawson, Ted M. Dawson, and Han Seok Ko
*To whom correspondence may be addressed: Email: [email protected] or [email protected] This PDF file includes
Supplemental Figures 1 to 9 Table S1, S2
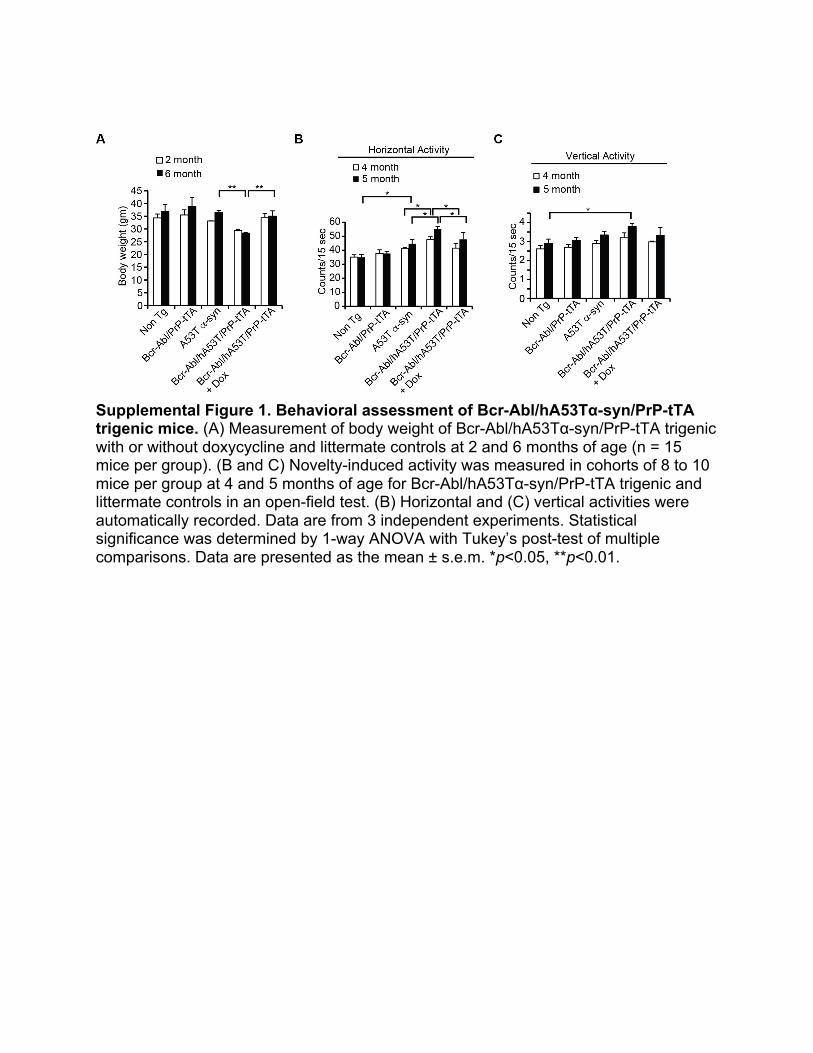
Supplemental Figure 1. Behavioral assessment of Bcr-Abl/hA53Tα-syn/PrP-tTA trigenic mice. (A) Measurement of body weight of Bcr-Abl/hA53Tα-syn/PrP-tTA trigenic with or without doxycycline and littermate controls at 2 and 6 months of age (n = 15 mice per group). (B and C) Novelty-induced activity was measured in cohorts of 8 to 10 mice per group at 4 and 5 months of age for Bcr-Abl/hA53Tα-syn/PrP-tTA trigenic and littermate controls in an open-field test. (B) Horizontal and (C) vertical activities were automatically recorded. Data are from 3 independent experiments. Statistical significance was determined by 1-way ANOVA with Tukey’s post-test of multiple comparisons. Data are presented as the mean ± s.e.m. *p<0.05, **p<0.01.
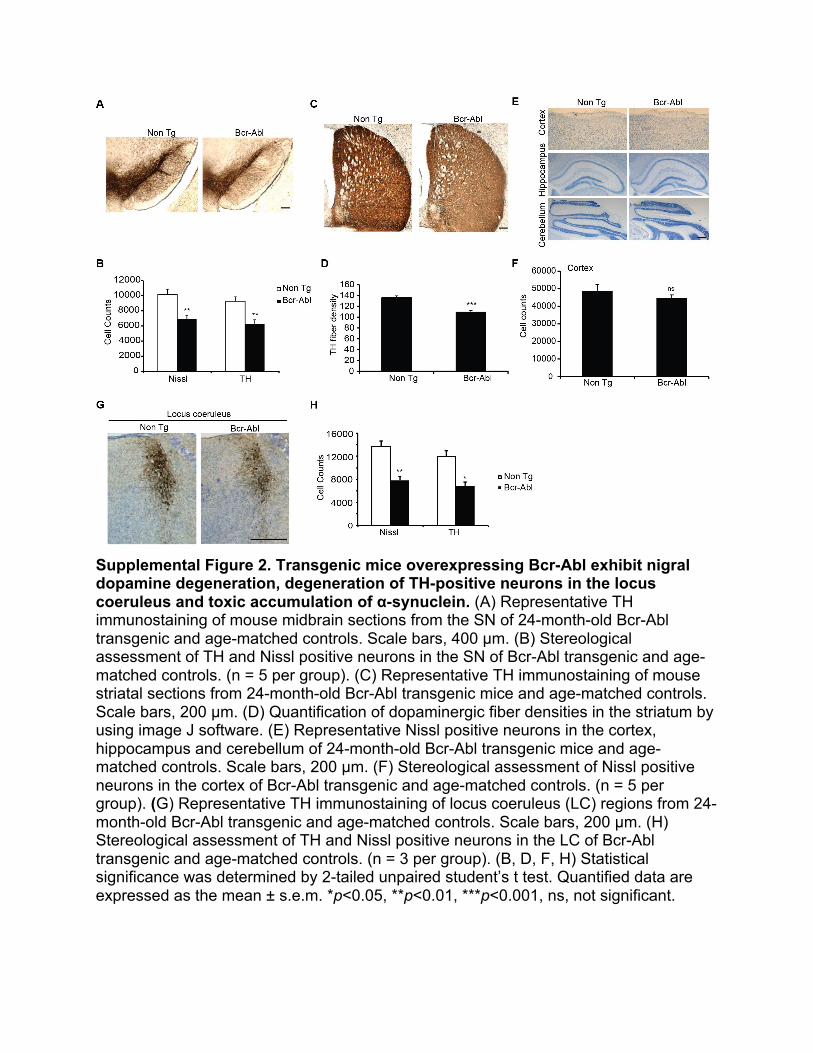
Supplemental Figure 2. Transgenic mice overexpressing Bcr-Abl exhibit nigral dopamine degeneration, degeneration of TH-positive neurons in the locus coeruleus and toxic accumulation of α-synuclein. (A) Representative TH immunostaining of mouse midbrain sections from the SN of 24-month-old Bcr-Abl transgenic and age-matched controls. Scale bars, 400 µm. (B) Stereological assessment of TH and Nissl positive neurons in the SN of Bcr-Abl transgenic and age-matched controls. (n = 5 per group). (C) Representative TH immunostaining of mouse striatal sections from 24-month-old Bcr-Abl transgenic mice and age-matched controls. Scale bars, 200 µm. (D) Quantification of dopaminergic fiber densities in the striatum by using image J software. (E) Representative Nissl positive neurons in the cortex, hippocampus and cerebellum of 24-month-old Bcr-Abl transgenic mice and age-matched controls. Scale bars, 200 µm. (F) Stereological assessment of Nissl positive neurons in the cortex of Bcr-Abl transgenic and age-matched controls. (n = 5 per group). (G) Representative TH immunostaining of locus coeruleus (LC) regions from 24-month-old Bcr-Abl transgenic and age-matched controls. Scale bars, 200 µm. (H) Stereological assessment of TH and Nissl positive neurons in the LC of Bcr-Abl transgenic and age-matched controls. (n = 3 per group). (B, D, F, H) Statistical significance was determined by 2-tailed unpaired student’s t test. Quantified data are expressed as the mean ± s.e.m. *p<0.05, **p<0.01, ***p<0.001, ns, not significant.
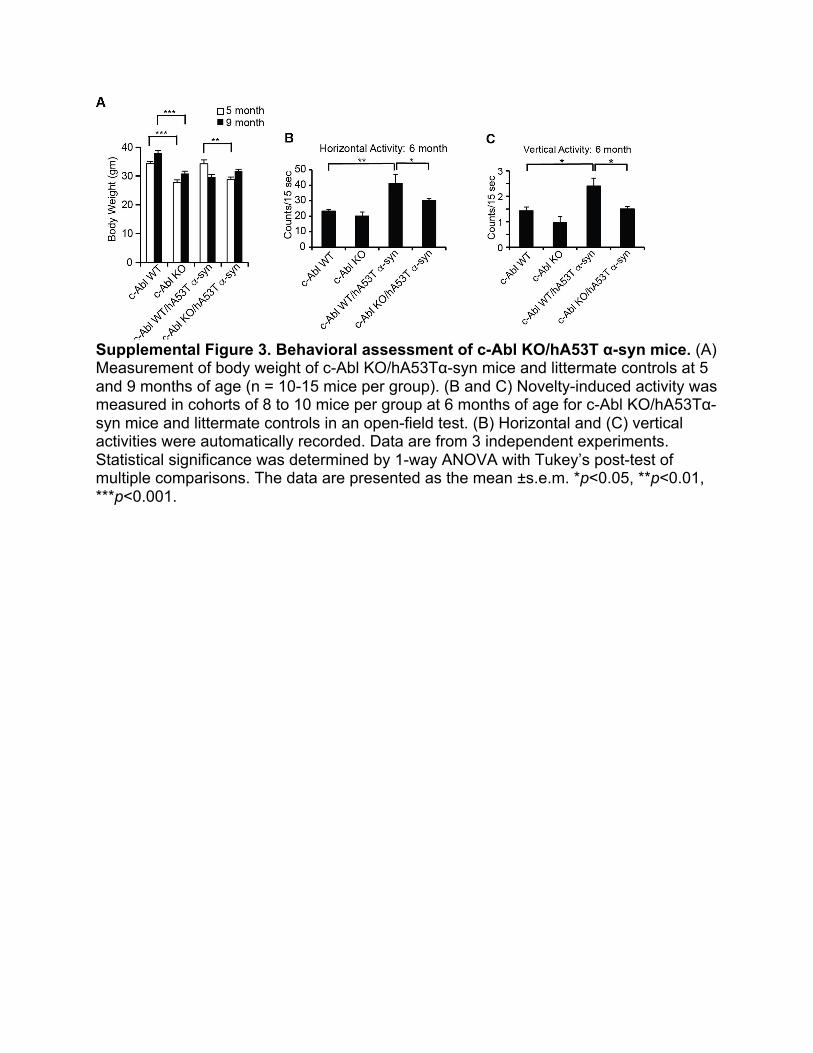
Supplemental Figure 3. Behavioral assessment of c-Abl KO/hA53T α-syn mice. (A) Measurement of body weight of c-Abl KO/hA53Tα-syn mice and littermate controls at 5 and 9 months of age (n = 10-15 mice per group). (B and C) Novelty-induced activity was measured in cohorts of 8 to 10 mice per group at 6 months of age for c-Abl KO/hA53Tα-syn mice and littermate controls in an open-field test. (B) Horizontal and (C) vertical activities were automatically recorded. Data are from 3 independent experiments. Statistical significance was determined by 1-way ANOVA with Tukey’s post-test of multiple comparisons. The data are presented as the mean ±s.e.m. *p<0.05, **p<0.01, ***p<0.001.
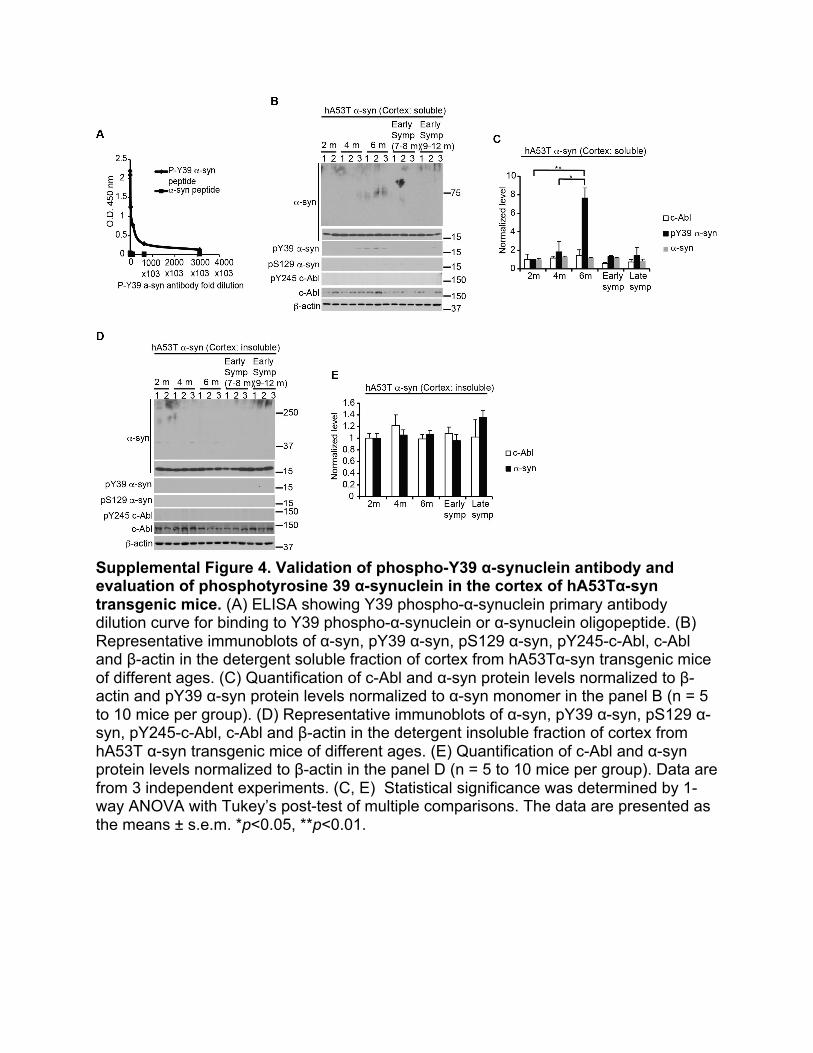
Supplemental Figure 4. Validation of phospho-Y39 α-synuclein antibody and evaluation of phosphotyrosine 39 α-synuclein in the cortex of hA53Tα-syn transgenic mice. (A) ELISA showing Y39 phospho-α-synuclein primary antibody dilution curve for binding to Y39 phospho-α-synuclein or α-synuclein oligopeptide. (B) Representative immunoblots of α-syn, pY39 α-syn, pS129 α-syn, pY245-c-Abl, c-Abl and β-actin in the detergent soluble fraction of cortex from hA53Tα-syn transgenic mice of different ages. (C) Quantification of c-Abl and α-syn protein levels normalized to β-actin and pY39 α-syn protein levels normalized to α-syn monomer in the panel B (n = 5 to 10 mice per group). (D) Representative immunoblots of α-syn, pY39 α-syn, pS129 α-syn, pY245-c-Abl, c-Abl and β-actin in the detergent insoluble fraction of cortex from hA53T α-syn transgenic mice of different ages. (E) Quantification of c-Abl and α-syn protein levels normalized to β-actin in the panel D (n = 5 to 10 mice per group). Data are from 3 independent experiments. (C, E) Statistical significance was determined by 1-way ANOVA with Tukey’s post-test of multiple comparisons. The data are presented as the means ± s.e.m. *p<0.05, **p<0.01.
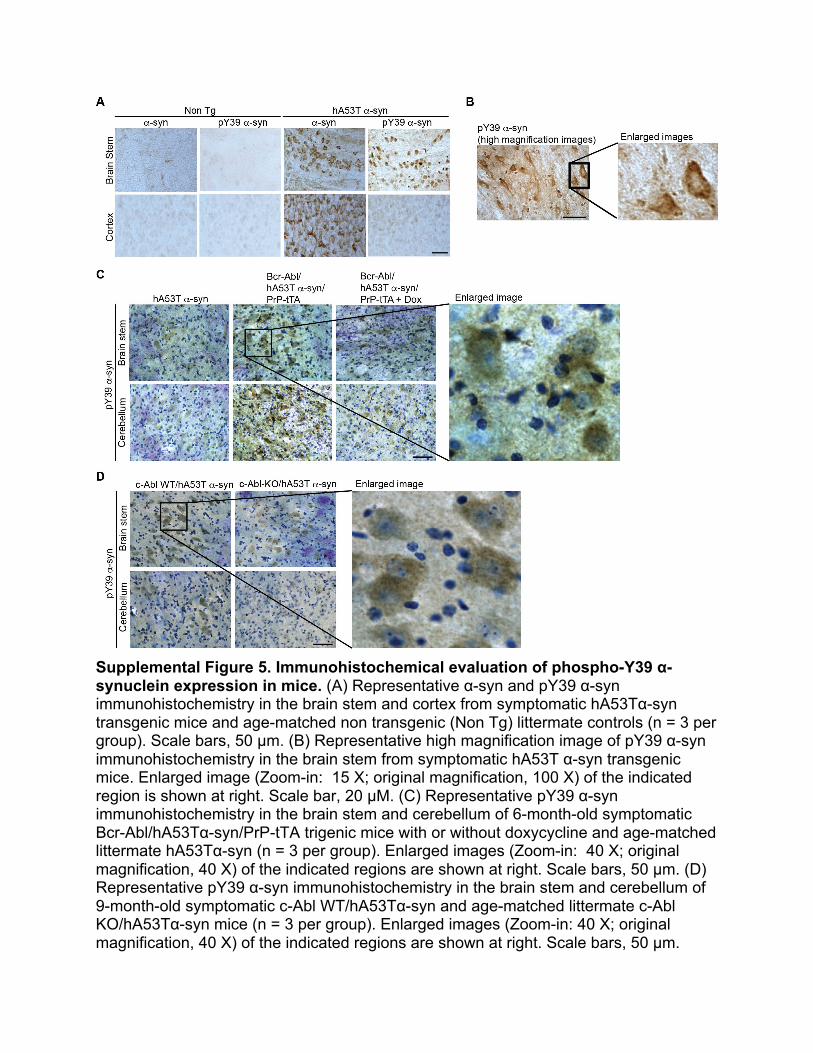
Supplemental Figure 5. Immunohistochemical evaluation of phospho-Y39 α-synuclein expression in mice. (A) Representative α-syn and pY39 α-syn immunohistochemistry in the brain stem and cortex from symptomatic hA53Tα-syn transgenic mice and age-matched non transgenic (Non Tg) littermate controls (n = 3 per group). Scale bars, 50 µm. (B) Representative high magnification image of pY39 α-syn immunohistochemistry in the brain stem from symptomatic hA53T α-syn transgenic mice. Enlarged image (Zoom-in: 15 X; original magnification, 100 X) of the indicated region is shown at right. Scale bar, 20 µM. (C) Representative pY39 α-syn immunohistochemistry in the brain stem and cerebellum of 6-month-old symptomatic Bcr-Abl/hA53Tα-syn/PrP-tTA trigenic mice with or without doxycycline and age-matched littermate hA53Tα-syn (n = 3 per group). Enlarged images (Zoom-in: 40 X; original magnification, 40 X) of the indicated regions are shown at right. Scale bars, 50 µm. (D) Representative pY39 α-syn immunohistochemistry in the brain stem and cerebellum of 9-month-old symptomatic c-Abl WT/hA53Tα-syn and age-matched littermate c-Abl KO/hA53Tα-syn mice (n = 3 per group). Enlarged images (Zoom-in: 40 X; original magnification, 40 X) of the indicated regions are shown at right. Scale bars, 50 µm.
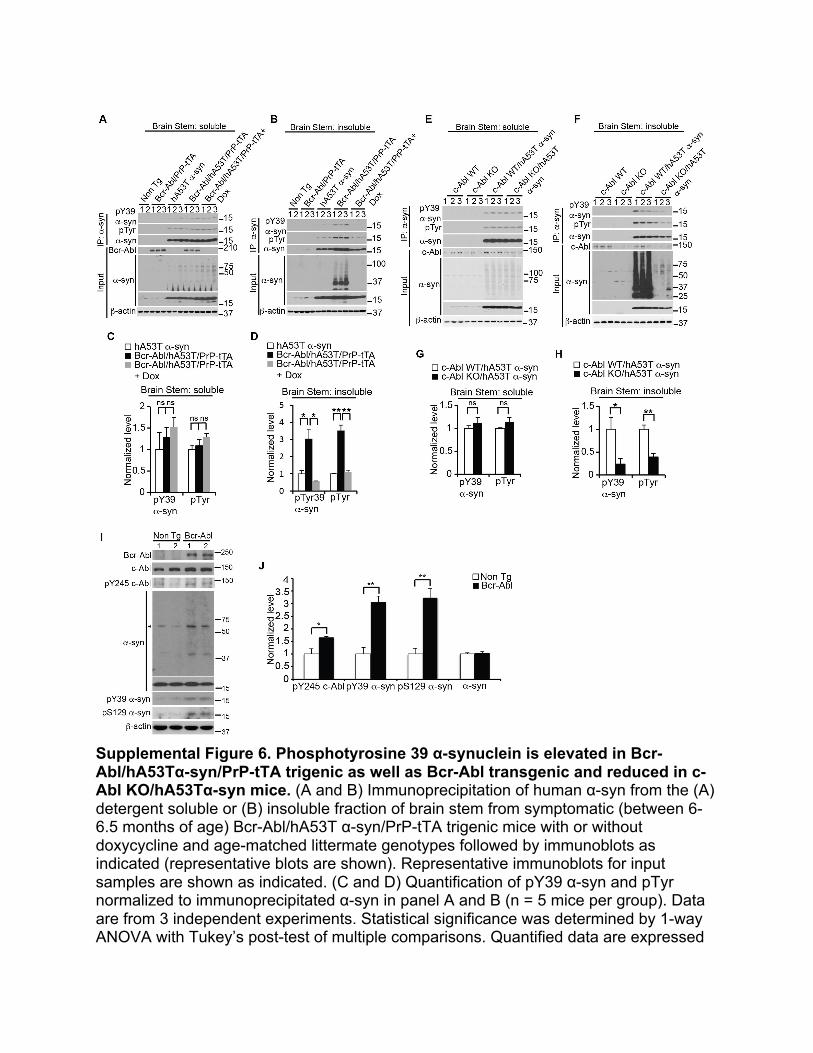
Supplemental Figure 6. Phosphotyrosine 39 α-synuclein is elevated in Bcr-Abl/hA53Tα-syn/PrP-tTA trigenic as well as Bcr-Abl transgenic and reduced in c-Abl KO/hA53Tα-syn mice. (A and B) Immunoprecipitation of human α-syn from the (A) detergent soluble or (B) insoluble fraction of brain stem from symptomatic (between 6-6.5 months of age) Bcr-Abl/hA53T α-syn/PrP-tTA trigenic mice with or without doxycycline and age-matched littermate genotypes followed by immunoblots as indicated (representative blots are shown). Representative immunoblots for input samples are shown as indicated. (C and D) Quantification of pY39 α-syn and pTyr normalized to immunoprecipitated α-syn in panel A and B (n = 5 mice per group). Data are from 3 independent experiments. Statistical significance was determined by 1-way ANOVA with Tukey’s post-test of multiple comparisons. Quantified data are expressed
as mean ± s.e.m. *p<0.05, **p<0.01, ns, not significant. (E and F) Immunoprecipitation of human α-syn from the (E) detergent soluble or (F) insoluble fraction of brain stem from symptomatic (between 9-10 months of age) c-Abl WT/hA53Tα-syn and age-matched littermate genotypes followed by immunoblots as indicated (representative blots are shown). Representative immunoblots for input samples are shown as indicated. (G and H) Quantification of pY39 α-syn and pTyr normalized to immunoprecipitated α-syn in panel E and F (n = 6 to 8 mice per group). (I) Representative immunoblots of indicated proteins in the ventral midbrain lysates from 24-month old Bcr-Abl transgenic mice and age-matched controls. (J) Quantification of pY245 c-Abl normalized to c-Abl, pY39 α-syn and pS129 α-syn normalized to α-syn monomer and α-syn monomer normalized to β-actin in panel I (n = 3 per group). Data are from 3 independent experiments. (G, H, J) Statistical significance was determined by 2-tailed unpaired Student’s t test. Quantified data are expressed as the mean ± s.e.m. *p<0.05, **p<0.01, ns, not significant.
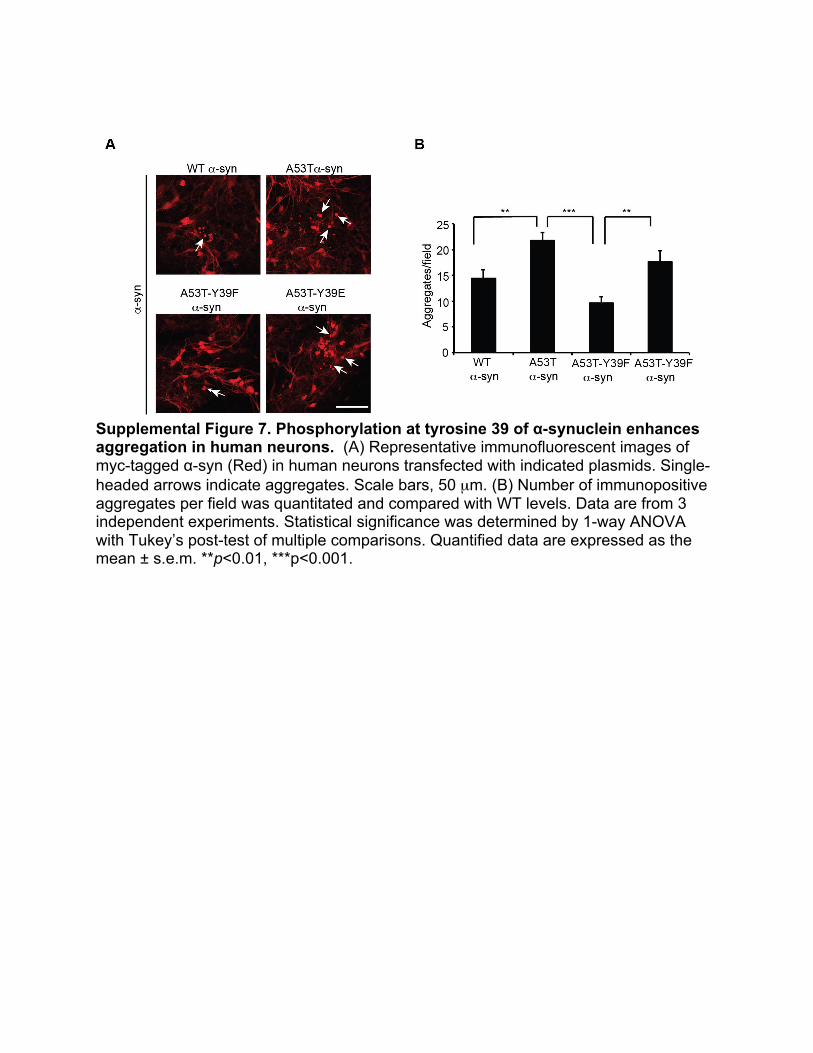
Supplemental Figure 7. Phosphorylation at tyrosine 39 of α-synuclein enhances aggregation in human neurons. (A) Representative immunofluorescent images of myc-tagged α-syn (Red) in human neurons transfected with indicated plasmids. Single-headed arrows indicate aggregates. Scale bars, 50 µm. (B) Number of immunopositive aggregates per field was quantitated and compared with WT levels. Data are from 3 independent experiments. Statistical significance was determined by 1-way ANOVA with Tukey’s post-test of multiple comparisons. Quantified data are expressed as the mean ± s.e.m. **p<0.01, ***p<0.001.
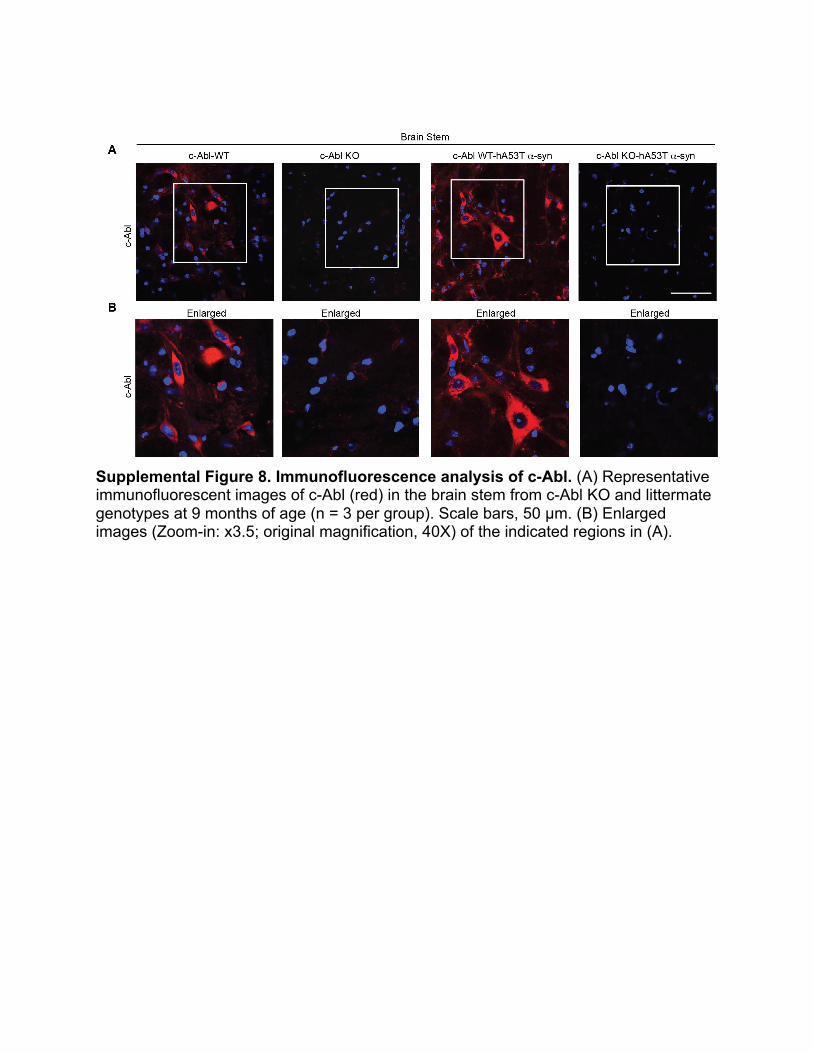
Supplemental Figure 8. Immunofluorescence analysis of c-Abl. (A) Representative immunofluorescent images of c-Abl (red) in the brain stem from c-Abl KO and littermate genotypes at 9 months of age (n = 3 per group). Scale bars, 50 µm. (B) Enlarged images (Zoom-in: x3.5; original magnification, 40X) of the indicated regions in (A).
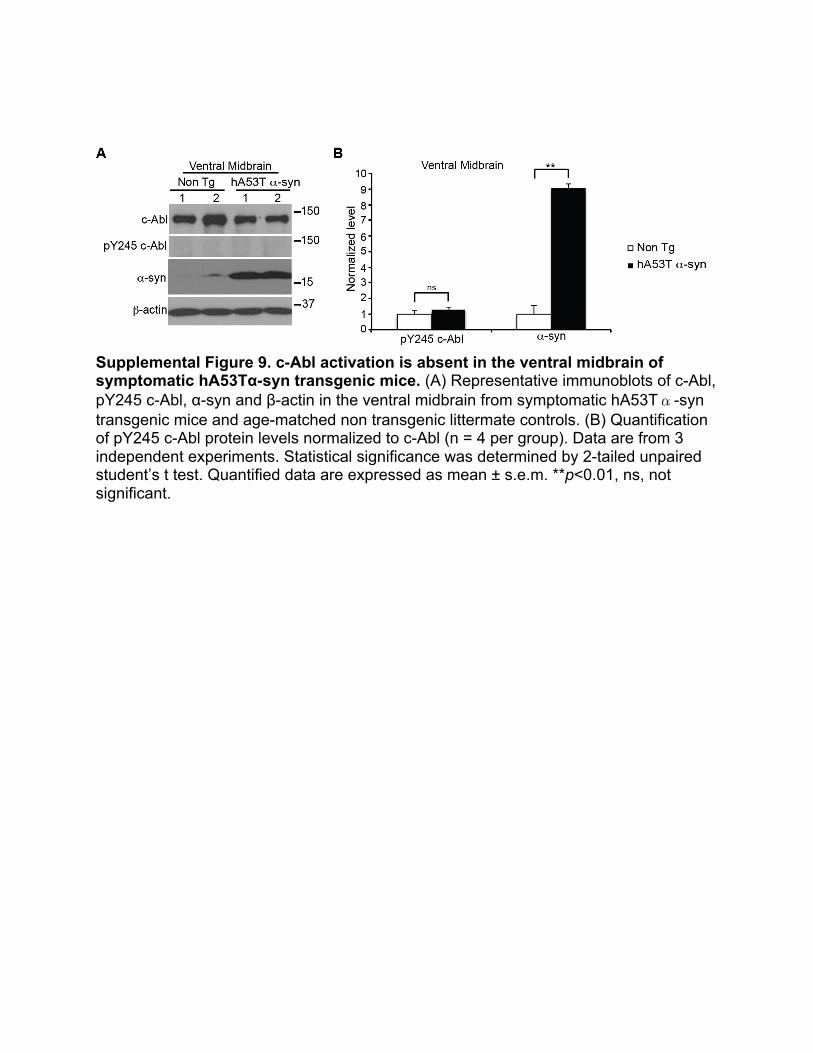
Supplemental Figure 9. c-Abl activation is absent in the ventral midbrain of symptomatic hA53Tα-syn transgenic mice. (A) Representative immunoblots of c-Abl, pY245 c-Abl, α-syn and β-actin in the ventral midbrain from symptomatic hA53Tα-syn transgenic mice and age-matched non transgenic littermate controls. (B) Quantification of pY245 c-Abl protein levels normalized to c-Abl (n = 4 per group). Data are from 3 independent experiments. Statistical significance was determined by 2-tailed unpaired student’s t test. Quantified data are expressed as mean ± s.e.m. **p<0.01, ns, not significant.


![Layout 1 (Page 1) - Antibodies, Proteins, Kits and … P WB Rb Hu 28225 ADAM17 P WB Rb Hu, Mm, Rt 2051 AKT (phospho S473) [14-6] M ICC, WB Rb Hu, Mm 27773 AKT (phospho T308) P ELISA,](https://static.fdocument.org/doc/165x107/5b0df7317f8b9af65e8e7090/layout-1-page-1-antibodies-proteins-kits-and-p-wb-rb-hu-28225-adam17-p-wb.jpg)