SUPPLEMENTARY INFORMATION - Nature · | 1 SUPPLEMENTARY INFORMATION doi:10.1038/nature10895 Mature...
13
WWW.NATURE.COM/NATURE | 1 SUPPLEMENTARY INFORMATION doi:10.1038/nature10895 Mature Okazaki fragment v Reb1 Polδ Fen1 CAF-1 PCNA Polδ Polδ Polδ CAF-1 Core histones Polδ i ii iii iv Mature Okazaki fragment vi Reb1 Mature Okazaki fragments vii Reb1 Figure S1. Model for nucleosome-mediated dissociation and recycling of Pol δ. (i) Following Okazaki fragment synthesis, a (H3H4)2 tetramer is rapidly deposited on the fragment; (ii-iii) during elongation of the subsequent fragment, Pol δ and associated nucleases can invade this nascent tetramer (which may have matured via the addition of H2A/H2B into a complete nucleosome). (iv) The polymerase experiences resistance that increases as a function of proximity to the nucleosome dyad, and is accordingly most likely to dissociate around this point. Repeated cycles (v) of such dissociation produce fragments sized similarly to the chromatin repeat, with termini statistically enriched around nucleosome dyads. (vi-viii) The transcription factors Abf1, Reb1 and Rap1 present ‘hard’ barriers that either cannot be invaded, or dissociate completely upon partial displacement by polymerase: these factors give rise to precisely located termini at a location corre- sponding to the edge of the transcription factor.
Transcript of SUPPLEMENTARY INFORMATION - Nature · | 1 SUPPLEMENTARY INFORMATION doi:10.1038/nature10895 Mature...
W W W. N A T U R E . C O M / N A T U R E | 1
SUPPLEMENTARY INFORMATIONdoi:10.1038/nature10895
MatureOkazaki fragment
v
Reb1
Polδ
Fen1CAF-1
PCNA
Polδ
Polδ
Polδ
CAF-1
Core histones
Polδ
i
ii
iii
iv
MatureOkazaki fragment
vi
Reb1
MatureOkazaki fragments
vii
Reb1
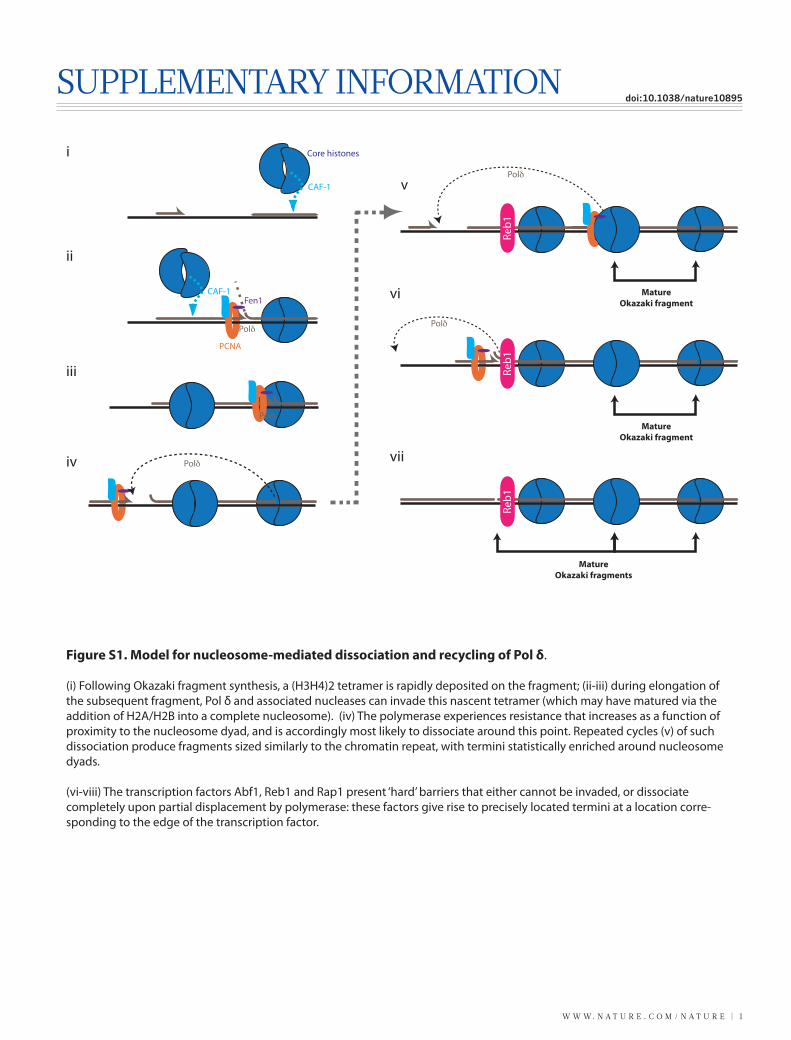
Figure S1. Model for nucleosome-mediated dissociation and recycling of Pol δ.
(i) Following Okazaki fragment synthesis, a (H3H4)2 tetramer is rapidly deposited on the fragment; (ii-iii) during elongation of the subsequent fragment, Pol δ and associated nucleases can invade this nascent tetramer (which may have matured via the addition of H2A/H2B into a complete nucleosome). (iv) The polymerase experiences resistance that increases as a function of proximity to the nucleosome dyad, and is accordingly most likely to dissociate around this point. Repeated cycles (v) of such dissociation produce fragments sized similarly to the chromatin repeat, with termini statistically enriched around nucleosome dyads.
(vi-viii) The transcription factors Abf1, Reb1 and Rap1 present ‘hard’ barriers that either cannot be invaded, or dissociate completely upon partial displacement by polymerase: these factors give rise to precisely located termini at a location corre-sponding to the edge of the transcription factor.
SUPPLEMENTARY INFORMATION
2 | W W W. N A T U R E . C O M / N A T U R E
RESEARCH
RNase H + oligo - α
-Pol
2α
-5S
rRN
A
125100
75
50
25
wt
cdc9-1
25˚C
Length(bp)
CsCl gradientFraction from Bottom
100200
>10,000
21 3 4 5 6 7 8 9...
GenomicDNA
SmallRNA
Uncleaved
Cleaved
a b c
1 21 2 3
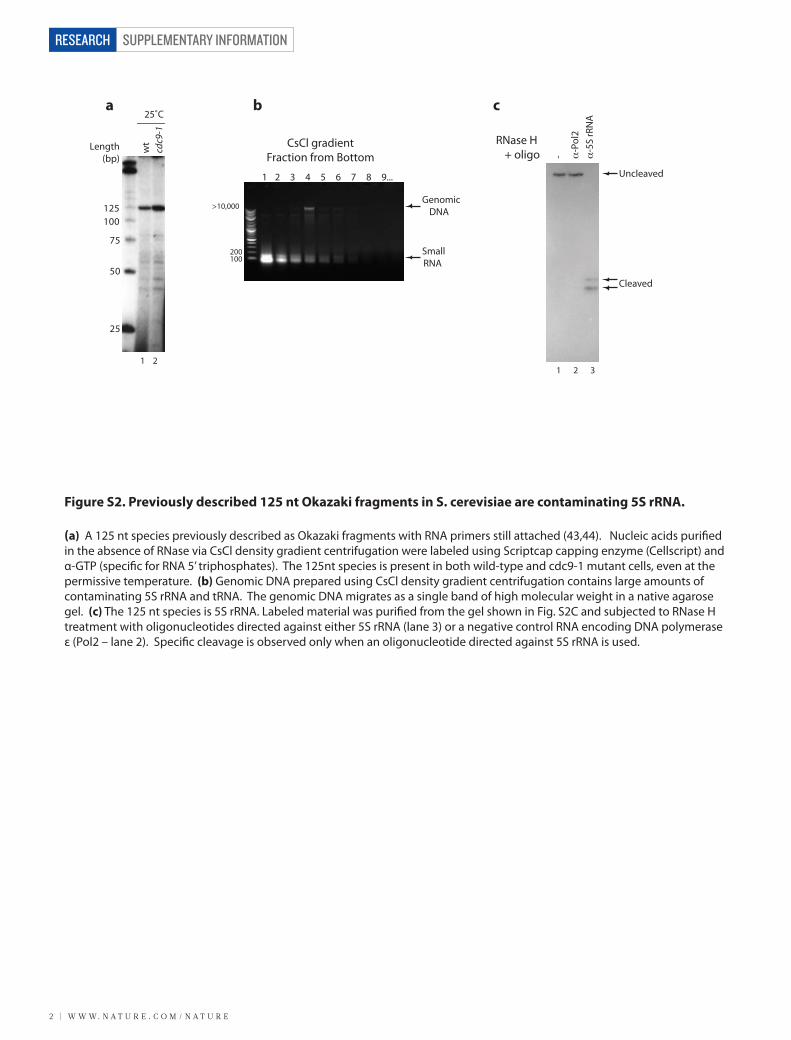
Figure S2. Previously described 125 nt Okazaki fragments in S. cerevisiae are contaminating 5S rRNA.
(a) A 125 nt species previously described as Okazaki fragments with RNA primers still attached (43,44). Nucleic acids puri�ed in the absence of RNase via CsCl density gradient centrifugation were labeled using Scriptcap capping enzyme (Cellscript) and α-GTP (speci�c for RNA 5’ triphosphates). The 125nt species is present in both wild-type and cdc9-1 mutant cells, even at the permissive temperature. (b) Genomic DNA prepared using CsCl density gradient centrifugation contains large amounts of contaminating 5S rRNA and tRNA. The genomic DNA migrates as a single band of high molecular weight in a native agarose gel. (c) The 125 nt species is 5S rRNA. Labeled material was puri�ed from the gel shown in Fig. S2C and subjected to RNase H treatment with oligonucleotides directed against either 5S rRNA (lane 3) or a negative control RNA encoding DNA polymerase ε (Pol2 – lane 2). Speci�c cleavage is observed only when an oligonucleotide directed against 5S rRNA is used.
W W W. N A T U R E . C O M / N A T U R E | 3
SUPPLEMENTARY INFORMATION RESEARCH
-- + + +Dox-repressible Cdc9
Genotype
150 min Dox treatment
WT
WT
lig4Δ
rad9
Δtof1Δ
200
100
400500
1000
300
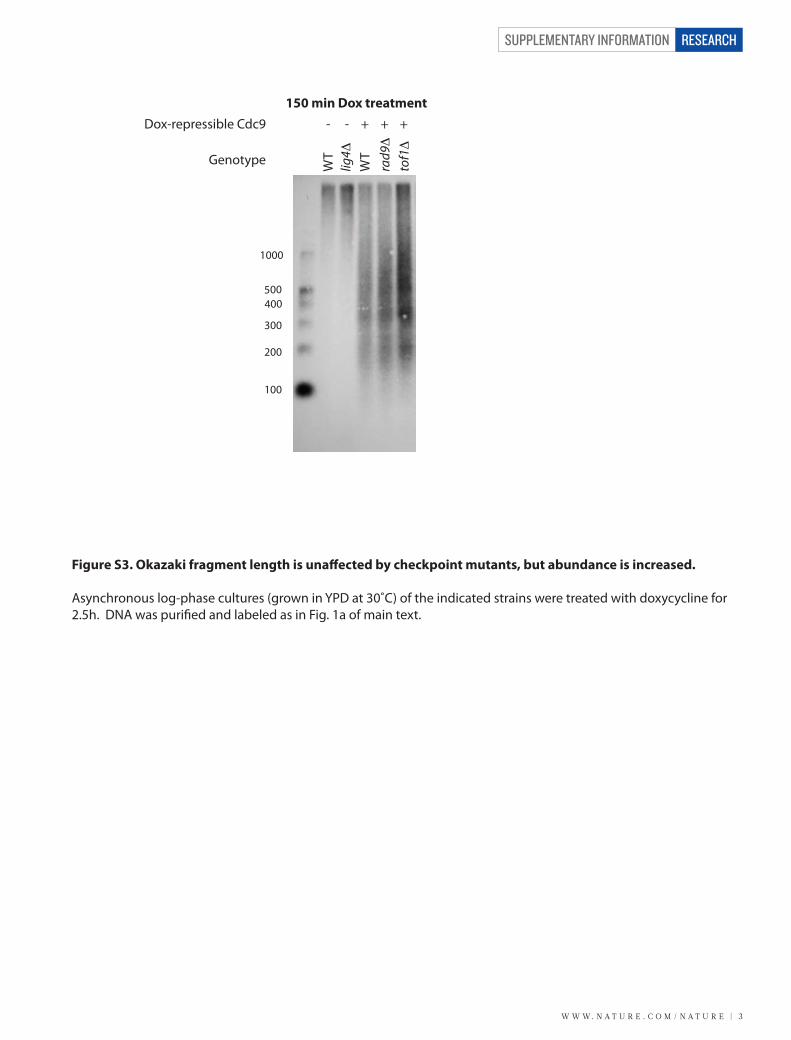
Figure S3. Okazaki fragment length is una�ected by checkpoint mutants, but abundance is increased.
Asynchronous log-phase cultures (grown in YPD at 30˚C) of the indicated strains were treated with doxycycline for 2.5h. DNA was puri�ed and labeled as in Fig. 1a of main text.
SUPPLEMENTARY INFORMATION
4 | W W W. N A T U R E . C O M / N A T U R E
RESEARCH
1. Initiation
• Purify OF-enriched DNA from 100-500 ml culture: denature at 95 ˚C,
• Bind to Source 15Q at pH12, 300 mM NaCl
• Elute with increasing NaCl (50 mM step gradient)
• Ethanol precipitate fractions of interest (800-900 mM NaCl)
• Ligate preannealed sequencing adaptors directly to purified ssDNA(T4 DNA ligase, overnight incubation at 16 ˚C)`
• Synthesise second strand (Taq DNA polymerase)• Purify from native 2.5% agarose gel (200-1000bp)• Amplify by PCR (16 cycles, KOD hot start)• Purify from two sequential 2.5% agarose gels (200-600bp)`
3’OH
5’p
3’OH
5’p
p
NNNNNN NNNNNN
3’OH
5’p
3. Ligation2. Extension/
strand displacement
5’
5’
Illumina Truseq primer 1with 5’ N6 ss overhang
Illumina Truseq primer 2with 3’ N6 ss overhang
3’
3’
M Inpu
t[NaCl]
800-900mM
100
200300400500
1000
size (nt)
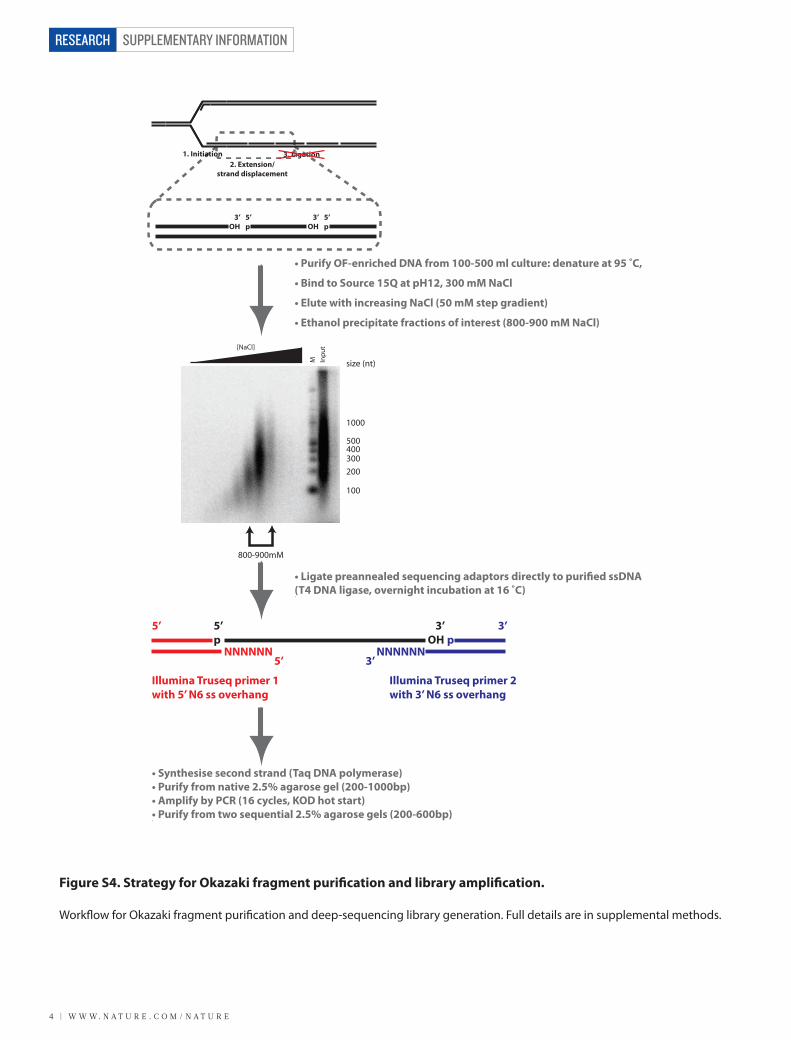
Figure S4. Strategy for Okazaki fragment purification and library amplification.
Work�ow for Okazaki fragment puri�cation and deep-sequencing library generation. Full details are in supplemental methods.
W W W. N A T U R E . C O M / N A T U R E | 5
SUPPLEMENTARY INFORMATION RESEARCH
Con�rmed origins
WT dataset 1
WT dataset 2
pol32Δ dataset 1
pol32Δ dataset 2
Watson strand hits
Crick strand hits
Watson strand hits
Crick strand hits
Watson strand hits
Crick strand hits
-20000 -10000 0 10000 20000-2
-1
0
1
2
Position relative to ACS (bp)(252 ACS from Eaton et al., 2010)
-20000 -10000 0 10000 20000-2
-1
0
1
2
-20000 -10000 0 10000 20000-2
-1
0
1
2
-20000 -10000 0 10000 20000-2
-1
0
1
2
Origin
Watson
Crick
Log2
wat
son:
cric
k
Position relative to ACS (bp)(252 ACS from Eaton et al., 2010)
Log2
wat
son:
cric
k
Position relative to ACS (bp)(252 ACS from Eaton et al., 2010)
Log2
wat
son:
cric
k
Position relative to ACS (bp)(252 ACS from Eaton et al., 2010)
Log2
wat
son:
cric
kWatson strand hits
Crick strand hits
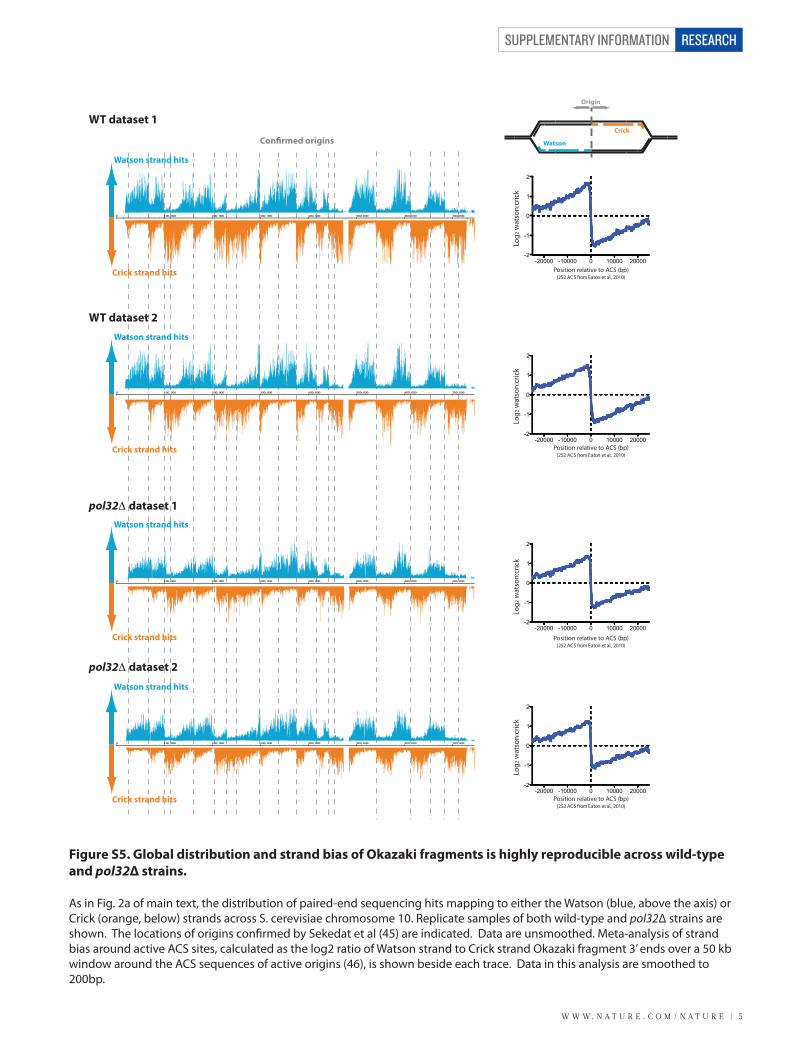
Figure S5. Global distribution and strand bias of Okazaki fragments is highly reproducible across wild-type and pol32Δ strains.
As in Fig. 2a of main text, the distribution of paired-end sequencing hits mapping to either the Watson (blue, above the axis) or Crick (orange, below) strands across S. cerevisiae chromosome 10. Replicate samples of both wild-type and pol32Δ strains are shown. The locations of origins con�rmed by Sekedat et al (45) are indicated. Data are unsmoothed. Meta-analysis of strand bias around active ACS sites, calculated as the log2 ratio of Watson strand to Crick strand Okazaki fragment 3’ ends over a 50 kb window around the ACS sequences of active origins (46), is shown beside each trace. Data in this analysis are smoothed to 200bp.
SUPPLEMENTARY INFORMATION
6 | W W W. N A T U R E . C O M / N A T U R E
RESEARCH
Length distribution of sequenced fragments, log scale (wt)
100 10000
200000
400000
600000
800000
1000000
Length (nt)
Cou
nt
(ii) WT dataset 2
(i) WT dataset 1
a b
c
All fragments over 100nt
Rel
ativ
e C
ount
-50 0 500.0
0.5
1.0
Monosome-sized Okazaki fragmentsNormal distribution: Mean=165, SD=15
-50 0 500.0
0.5
1.0
Position relative to nucleosome dyad (bp)(28832 best consensus centres; Jiang and Pugh, 2009)
Dinucleosome-sized Okazaki fragments(All fragments from 310-350 nt)
-50 0 500.0
0.5
1.0
Nucleosome occupancy(Kaplan et al. 2009)
5' end at position x
3' end at position x
All fragments over 100nt
Rel
ativ
e C
ount
-50 0 500.0
0.5
1.0
Monosome-sized Okazaki fragmentsNormal distribution: Mean=165, SD=15
Position relative to nucleosome dyad (bp)(28832 best consensus centres; Jiang and Pugh, 2009)
-50 0 500.0
0.5
1.0
Dinucleosome-sized Okazaki fragments(All fragments from 310-350 nt)
-50 0 500.0
0.5
1.0
Nucleosome occupancy(Kaplan et al. 2009)
5' end at position x
3' end at position x
Length distribution of sequenced fragments (wt)
0 100 200 300 400 5000
200000
400000
600000
800000
1000000
Length (nt)
Cou
nt
Dataset 1 [Figs 2-4, S6C(ii)] Dataset 2: [Fig S6C(ii)]
Monosome sample
Disome subset
Dataset 1 [Figs 2-4, S6C(ii)] Dataset 2: [Fig S6C(ii)]
Monosome sample
Disome subset
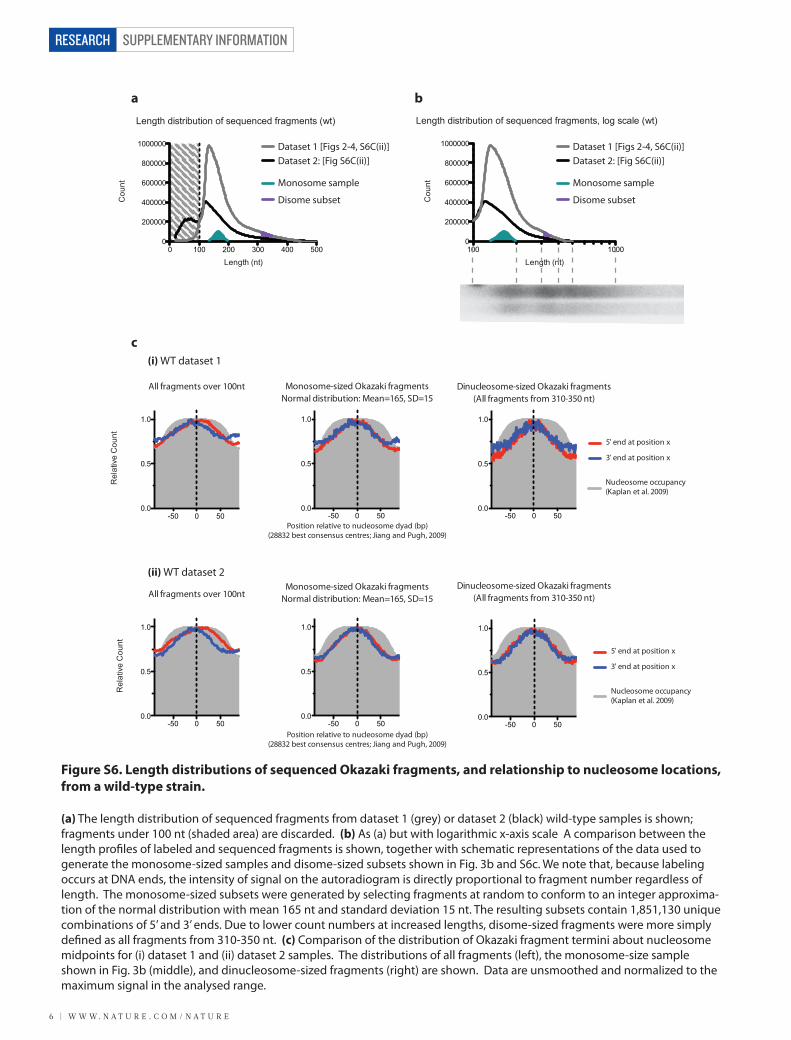
Figure S6. Length distributions of sequenced Okazaki fragments, and relationship to nucleosome locations, from a wild-type strain.
(a) The length distribution of sequenced fragments from dataset 1 (grey) or dataset 2 (black) wild-type samples is shown; fragments under 100 nt (shaded area) are discarded. (b) As (a) but with logarithmic x-axis scale A comparison between the length pro�les of labeled and sequenced fragments is shown, together with schematic representations of the data used to generate the monosome-sized samples and disome-sized subsets shown in Fig. 3b and S6c. We note that, because labeling occurs at DNA ends, the intensity of signal on the autoradiogram is directly proportional to fragment number regardless of length. The monosome-sized subsets were generated by selecting fragments at random to conform to an integer approxima-tion of the normal distribution with mean 165 nt and standard deviation 15 nt. The resulting subsets contain 1,851,130 unique combinations of 5’ and 3’ ends. Due to lower count numbers at increased lengths, disome-sized fragments were more simply de�ned as all fragments from 310-350 nt. (c) Comparison of the distribution of Okazaki fragment termini about nucleosome midpoints for (i) dataset 1 and (ii) dataset 2 samples. The distributions of all fragments (left), the monosome-size sample shown in Fig. 3b (middle), and dinucleosome-sized fragments (right) are shown. Data are unsmoothed and normalized to the maximum signal in the analysed range.
W W W. N A T U R E . C O M / N A T U R E | 7
SUPPLEMENTARY INFORMATION RESEARCH
a
TSS
b cOF synthesis
TSS
OF synthesis
Nucleosome occupancy(Whitehouse et al., 2007)
Abf1/Reb1/Rap1 occupancy(MacIsaac et al., 2006)
5' end at position x3' end at position x
-500 0 500
-0.8
-0.4
0.0
0.4
0.8
Position relative to TSS (bp)
Long
: Sh
ort L
og ra
tio
-500 0 5000
0.4
0.6
0.8
1.0
Position relative to TSS (bp)
Rela
tive
Coun
t
Fork
OF synthesis
Location of mature 3’ and 5’ ends
RNA primerFlap
(Degraded)
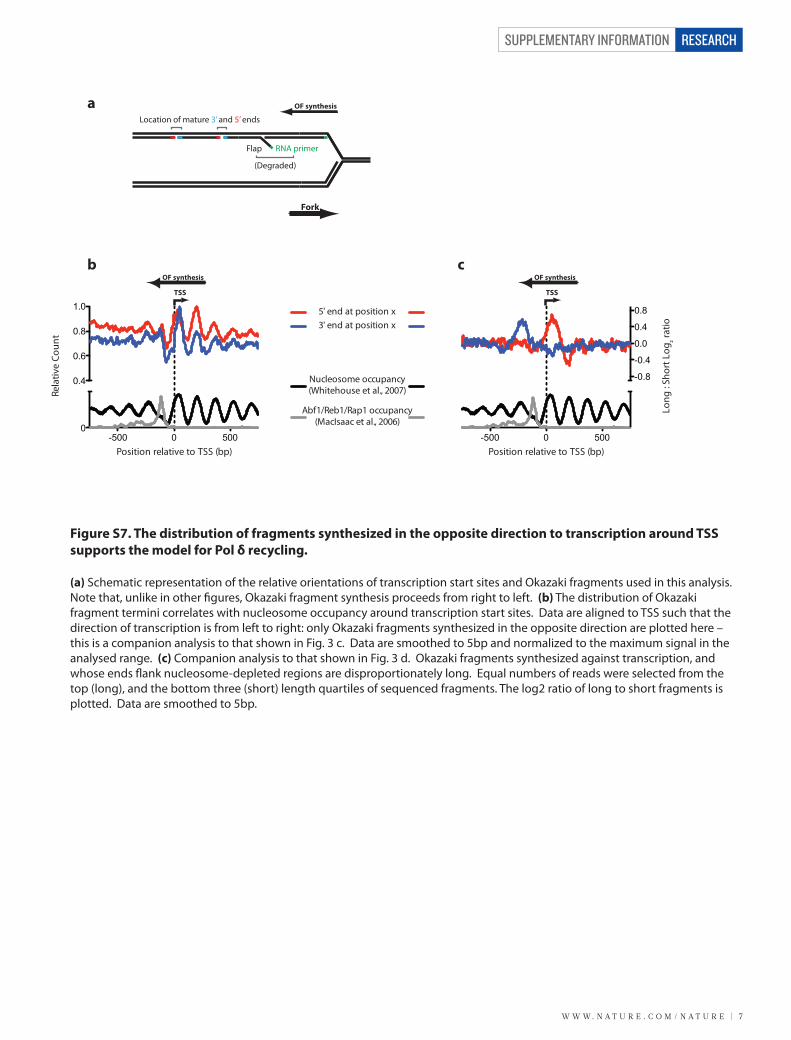
Figure S7. The distribution of fragments synthesized in the opposite direction to transcription around TSS supports the model for Pol δ recycling.
(a) Schematic representation of the relative orientations of transcription start sites and Okazaki fragments used in this analysis. Note that, unlike in other �gures, Okazaki fragment synthesis proceeds from right to left. (b) The distribution of Okazaki fragment termini correlates with nucleosome occupancy around transcription start sites. Data are aligned to TSS such that the direction of transcription is from left to right: only Okazaki fragments synthesized in the opposite direction are plotted here – this is a companion analysis to that shown in Fig. 3 c. Data are smoothed to 5bp and normalized to the maximum signal in the analysed range. (c) Companion analysis to that shown in Fig. 3 d. Okazaki fragments synthesized against transcription, and whose ends �ank nucleosome-depleted regions are disproportionately long. Equal numbers of reads were selected from the top (long), and the bottom three (short) length quartiles of sequenced fragments. The log2 ratio of long to short fragments is plotted. Data are smoothed to 5bp.
SUPPLEMENTARY INFORMATION
8 | W W W. N A T U R E . C O M / N A T U R E
RESEARCH
Bulk nucleosomes
Nicks at nucleosome dyadsPosition determined by nucleosome upstream of nick
Fen1
Pol α
Fixed distancefrom nucleosometo initiation site
PCNA
Bulk nucleosomes
NDRsNDRs
Nicks at nucleosome dyads Position determined by nucleosome at site of nick
Polδ
Chromatin is rapidlyreassembled behind the fork
Pol δ invades nascent nucleosomes,which facilitate its dissociation
Constant amountof strand displacement
synthesis by Pol δ
Fen1
PCNAPol α
Polδ
Predicted observations:
Few nicks at dyad of +1 nucleosome
Longest fragments from mid-NFR to +2 dyad
Nicks o�set from transcription factor binding sites
Nucleosome edgedirecting nick location
Relative probability of Pol δ dissociation
-3
-4 -3 -2 -1 +1 +2
Predicted observations:
Nicks at dyads of both +1 and -1 nucleosomes
Longest fragments span the NFR from -1 dyad to +1 dyad
Nicks enriched on replication-fork-proximal side of transcription factor binding sites
Nucleosome dyaddirecting nick location
Relative probability of Pol δ dissociation
-3 -2 -1 +1 +2 +3
-3 -2 -1 +1 +2 +3 -3 -2 -1 +1 +2 +3
CMG
CMG
Observed?Fig. 3C
Fig. 3D
Fig. 3C, 4
Fig. 3C
Fig. 3DFig. 3C, 4
Observed?
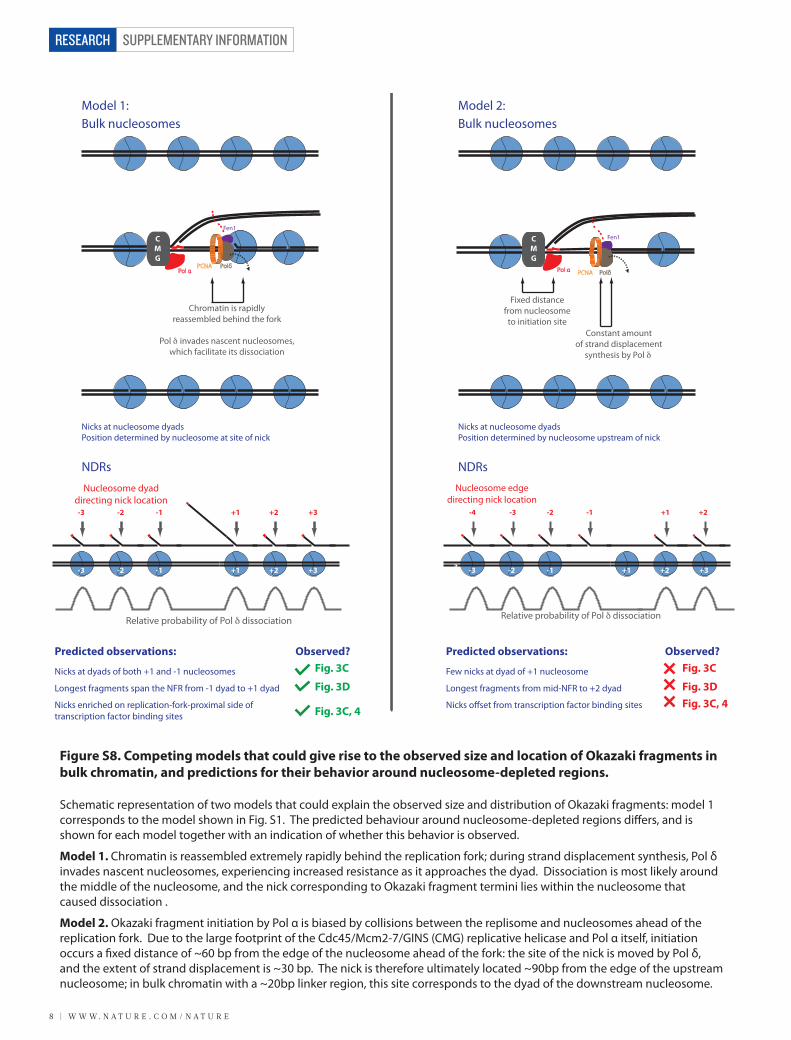
Figure S8. Competing models that could give rise to the observed size and location of Okazaki fragments in bulk chromatin, and predictions for their behavior around nucleosome-depleted regions.
Schematic representation of two models that could explain the observed size and distribution of Okazaki fragments: model 1 corresponds to the model shown in Fig. S1. The predicted behaviour around nucleosome-depleted regions di�ers, and is shown for each model together with an indication of whether this behavior is observed.
Model 1. Chromatin is reassembled extremely rapidly behind the replication fork; during strand displacement synthesis, Pol δ invades nascent nucleosomes, experiencing increased resistance as it approaches the dyad. Dissociation is most likely around the middle of the nucleosome, and the nick corresponding to Okazaki fragment termini lies within the nucleosome that caused dissociation .
Model 2. Okazaki fragment initiation by Pol α is biased by collisions between the replisome and nucleosomes ahead of the replication fork. Due to the large footprint of the Cdc45/Mcm2-7/GINS (CMG) replicative helicase and Pol α itself, initiation occurs a �xed distance of ~60 bp from the edge of the nucleosome ahead of the fork: the site of the nick is moved by Pol δ, and the extent of strand displacement is ~30 bp. The nick is therefore ultimately located ~90bp from the edge of the upstream nucleosome; in bulk chromatin with a ~20bp linker region, this site corresponds to the dyad of the downstream nucleosome.
Model 1: Model 2:
W W W. N A T U R E . C O M / N A T U R E | 9
SUPPLEMENTARY INFORMATION RESEARCH
aWT dataset 1
b
c
d
pol32Δ dataset 1
WT dataset 2
pol32Δ dataset 2
-50 0 500.0
0.5
1.0
Position relative to TF centre-50 0 50
0.0
0.5
1.0
Position relative to TF centre-50 0 50
0.0
0.5
1.0
Position relative to TF centre
-50 0 500.0
0.5
1.0
Position relative to TF centre
Rel
ativ
e co
unt
-50 0 500.0
0.5
1.0
Position relative to TF centre-50 0 50
0.0
0.5
1.0
Position relative to TF centre
-50 0 500.0
0.5
1.0
Position relative to TF centre
Rel
ativ
e co
unt
-50 0 500.0
0.5
1.0
Position relative to TF centre-50 0 50
0.0
0.5
1.0
Position relative to TF centre
-50 0 500.0
0.5
1.0
Position relative to TF centre
Rel
ativ
e co
unt
Rel
ativ
e co
unt
-50 0 500.0
0.5
1.0
Position relative to TF centre-50 0 50
0.0
0.5
1.0
Position relative to TF centre
-20 -10 0 10 200.0
0.5
1.0
Position relative to TF centre
5' end at position x3' end at position x
-20 -10 0 10 200.0
0.5
1.0
Position relative to TF centre
5' end at position x3' end at position x
-20 -10 0 10 200.0
0.5
1.0
Position relative to TF centre
5' end at position x3' end at position x
5' end at position x3' end at position x
-20 -10 0 10 200.0
0.5
1.0
Position relative to TF centre
5' end at position x3' end at position x
All TF binding sitesAll excluding
Abf1/Reb1/Rap1 Abf1/Reb1/Rap1 only
Abf1/Reb1/Rap1 only
Abf1/Reb1/Rap1 only
Abf1/Reb1/Rap1 only
Abf1/Reb1/Rap1High-resolution
Abf1/Reb1/Rap1High-resolution
Abf1/Reb1/Rap1High-resolution
Abf1/Reb1/Rap1High-resolution
All TF binding sitesAll excluding
Abf1/Reb1/Rap1
All TF binding sitesAll excluding
Abf1/Reb1/Rap1
All TF binding sitesAll excluding
Abf1/Reb1/Rap1
OF synthesis
OF synthesis
OF synthesis
OF synthesis
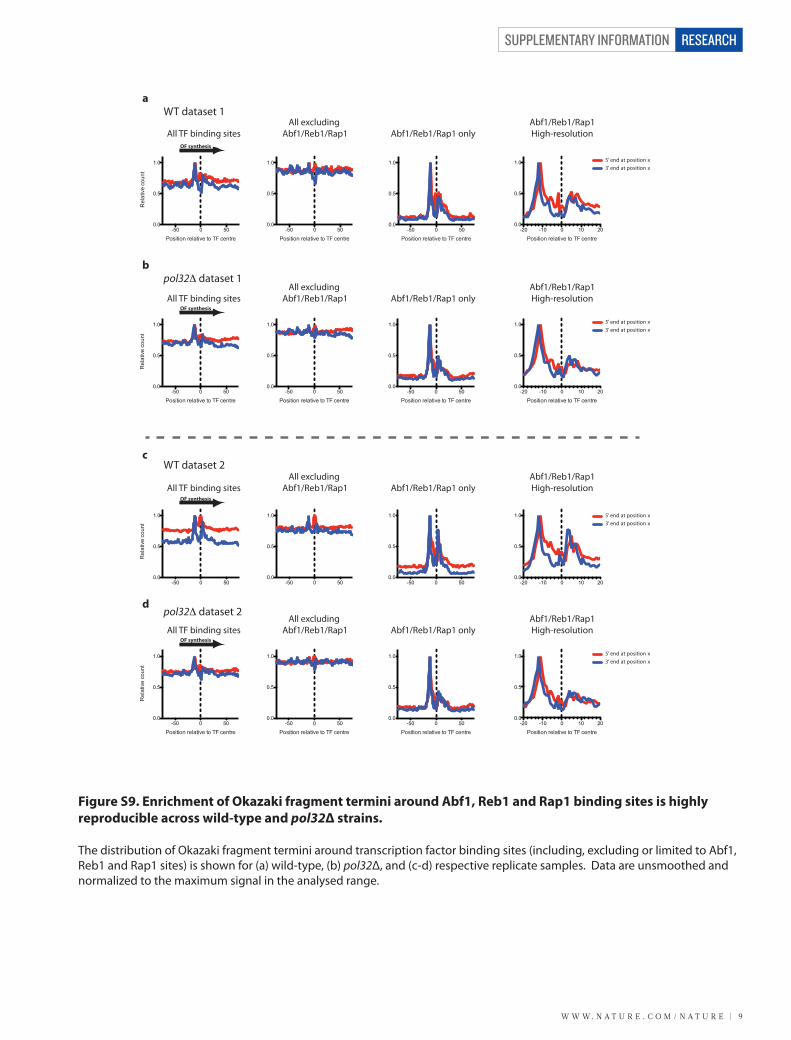
Figure S9. Enrichment of Okazaki fragment termini around Abf1, Reb1 and Rap1 binding sites is highly reproducible across wild-type and pol32Δ strains.
The distribution of Okazaki fragment termini around transcription factor binding sites (including, excluding or limited to Abf1, Reb1 and Rap1 sites) is shown for (a) wild-type, (b) pol32Δ, and (c-d) respective replicate samples. Data are unsmoothed and normalized to the maximum signal in the analysed range.
SUPPLEMENTARY INFORMATION
1 0 | W W W. N A T U R E . C O M / N A T U R E
RESEARCH
-200 -100 0 100 2000
2000
4000
Position relative to TSS (bp)
a
b
TFPol
TFPol
Fork
TSS
TFPol
Fork
TSS
TFPol
TFPol
TFPol
Fragment synthesisFragment synthesis
tRNA genes centred on TSS tRNA genes centred on TSS
Hits
per
bp
(5bp
sm
ooth
ed)
Hits
per
bp
(5bp
sm
ooth
ed)
-200 -100 0 100 2000
2000
4000
6000
8000
10000
Position relative to TSS (bp)
Transcribed regionTFIIIB binding site
5' end at position x 3' end at position x
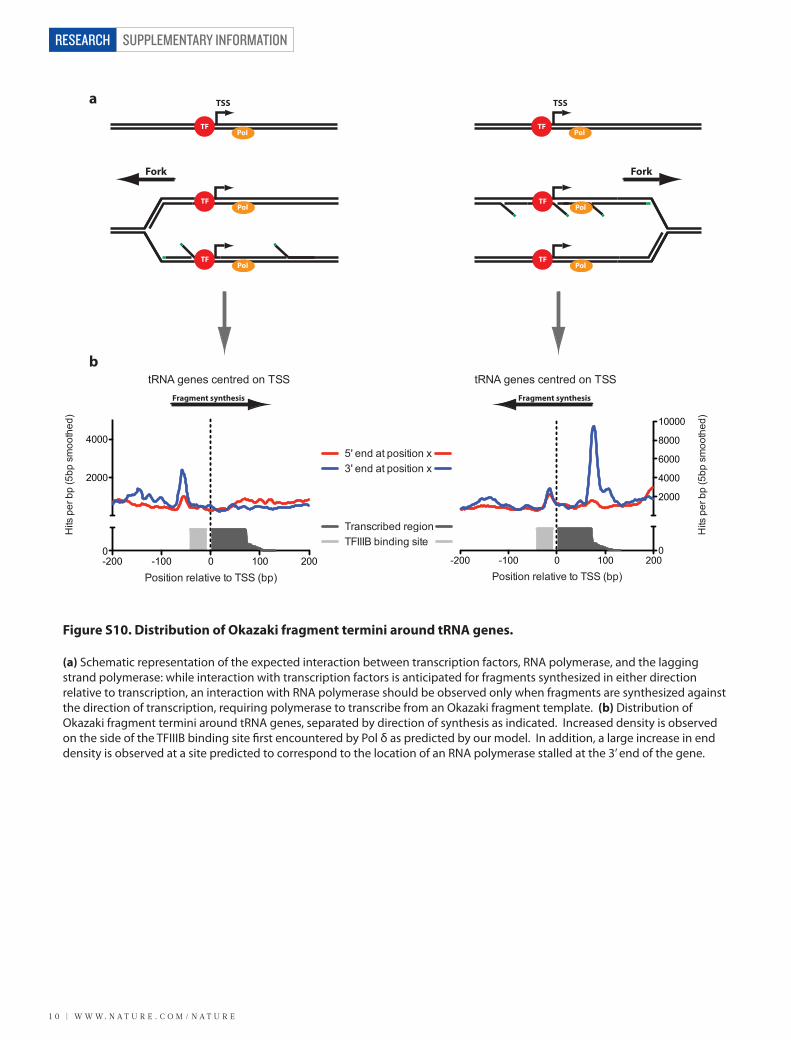
Figure S10. Distribution of Okazaki fragment termini around tRNA genes.
(a) Schematic representation of the expected interaction between transcription factors, RNA polymerase, and the lagging strand polymerase: while interaction with transcription factors is anticipated for fragments synthesized in either direction relative to transcription, an interaction with RNA polymerase should be observed only when fragments are synthesized against the direction of transcription, requiring polymerase to transcribe from an Okazaki fragment template. (b) Distribution of Okazaki fragment termini around tRNA genes, separated by direction of synthesis as indicated. Increased density is observed on the side of the TFIIIB binding site �rst encountered by Pol δ as predicted by our model. In addition, a large increase in end density is observed at a site predicted to correspond to the location of an RNA polymerase stalled at the 3’ end of the gene.
W W W. N A T U R E . C O M / N A T U R E | 1 1
SUPPLEMENTARY INFORMATION RESEARCH
a
(ii) pol32Δ dataset 2
(i) pol32Δ dataset 1
b
All fragments over 100nt
Rel
ativ
e C
ount
-50 0 500.0
0.5
1.0
Monosome-sized Okazaki fragmentsNormal distribution: Mean=165, SD=15
Position relative to nucleosome dyad (bp)(28832 best consensus centres; Jiang and Pugh, 2009)
-50 0 500.0
0.5
1.0
Dinucleosome-sized Okazaki fragments(All fragments from 310-350 nt)
-50 0 500.0
0.5
1.0
Nucleosome occupancy(Kaplan et al. 2009)
5' end at position x
3' end at position x
0 100 200 300 400 5000
200000
400000
600000
Length (nt)
Cou
nt
100 10000
200000
400000
600000
Length (nt)
Cou
nt
Dataset 1 [Fig. 5C, S11C(ii)] Dataset 2 [Fig. S11C(ii)]
Monosome sample
Disome subset
Dataset 1 [Fig. 5C, S11C(ii)] Dataset 2 [Fig. S11C(ii)]
Monosome sample
Disome subset
Length distribution of sequenced fragments (pol32Δ) Length distribution of sequenced fragments, log scale (pol32Δ)
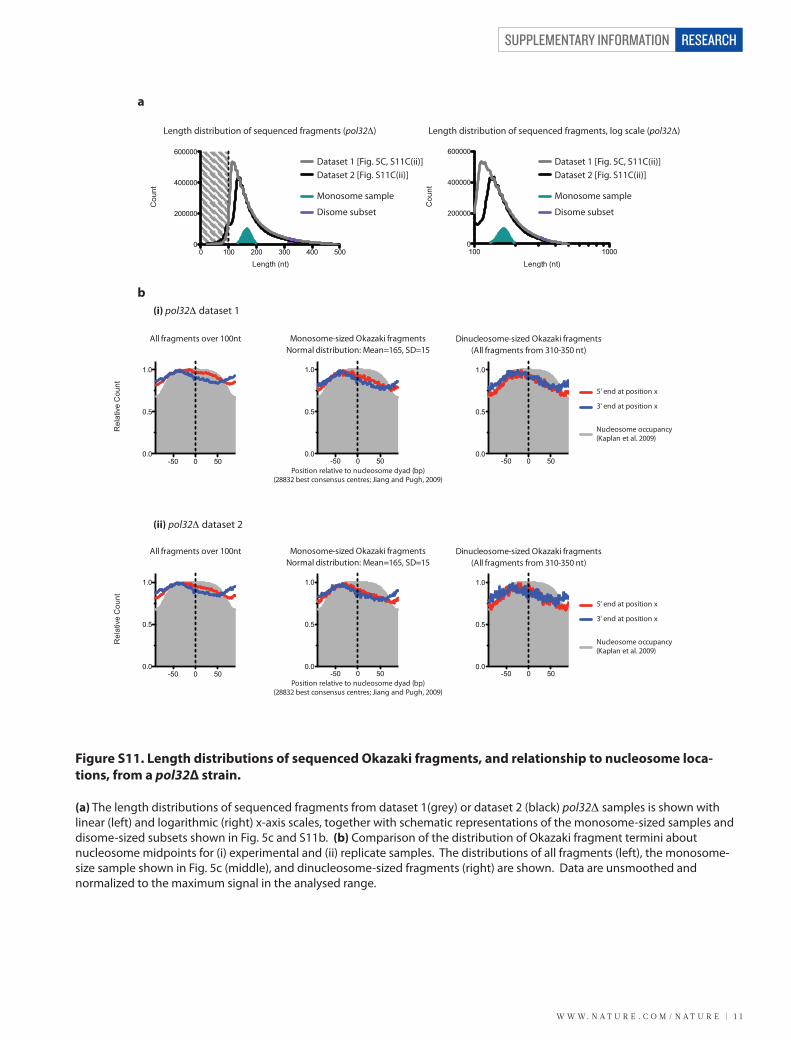
Figure S11. Length distributions of sequenced Okazaki fragments, and relationship to nucleosome loca-tions, from a pol32Δ strain.
(a) The length distributions of sequenced fragments from dataset 1(grey) or dataset 2 (black) pol32Δ samples is shown with linear (left) and logarithmic (right) x-axis scales, together with schematic representations of the monosome-sized samples and disome-sized subsets shown in Fig. 5c and S11b. (b) Comparison of the distribution of Okazaki fragment termini about nucleosome midpoints for (i) experimental and (ii) replicate samples. The distributions of all fragments (left), the monosome-size sample shown in Fig. 5c (middle), and dinucleosome-sized fragments (right) are shown. Data are unsmoothed and normalized to the maximum signal in the analysed range.
SUPPLEMENTARY INFORMATION
1 2 | W W W. N A T U R E . C O M / N A T U R E
RESEARCH
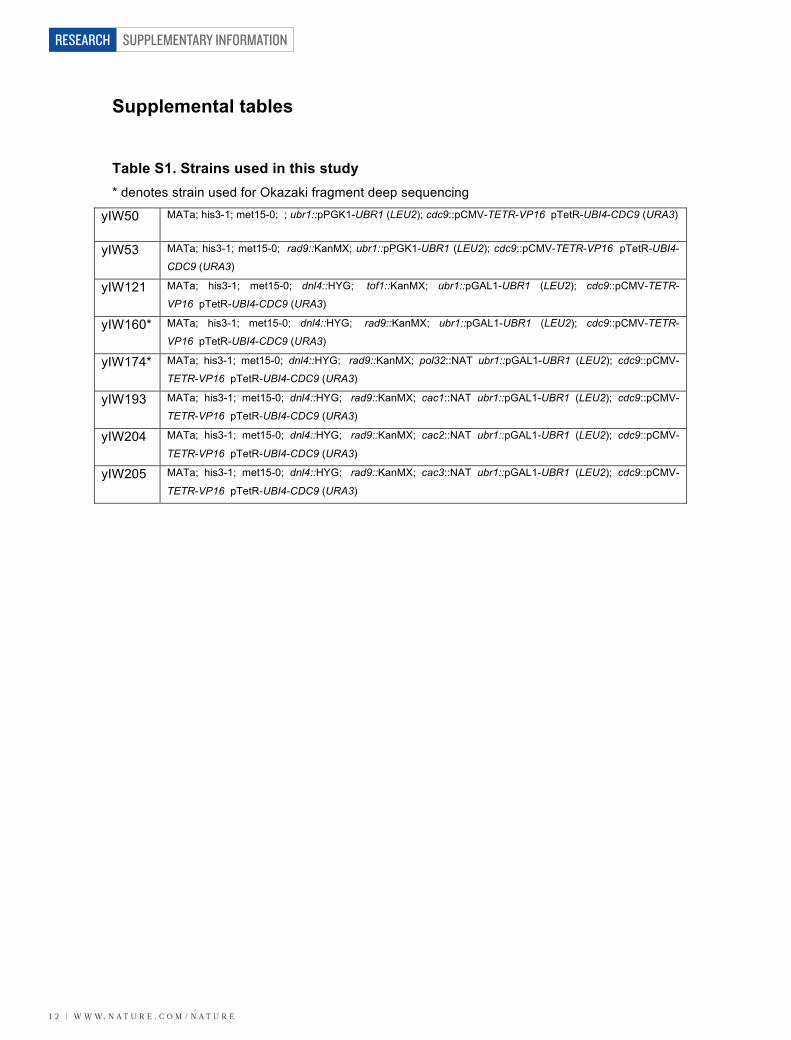
Supplemental tables Table S1. Strains used in this study * denotes strain used for Okazaki fragment deep sequencing
yIW50 MATa; his3-1; met15-0; ; ubr1::pPGK1-UBR1 (LEU2); cdc9::pCMV-TETR-VP16 pTetR-UBI4-CDC9 (URA3)
yIW53 MATa; his3-1; met15-0; rad9::KanMX; ubr1::pPGK1-UBR1 (LEU2); cdc9::pCMV-TETR-VP16 pTetR-UBI4-
CDC9 (URA3) yIW121 MATa; his3-1; met15-0; dnl4::HYG; tof1::KanMX; ubr1::pGAL1-UBR1 (LEU2); cdc9::pCMV-TETR-
VP16 pTetR-UBI4-CDC9 (URA3) yIW160* MATa; his3-1; met15-0; dnl4::HYG; rad9::KanMX; ubr1::pGAL1-UBR1 (LEU2); cdc9::pCMV-TETR-
VP16 pTetR-UBI4-CDC9 (URA3) yIW174* MATa; his3-1; met15-0; dnl4::HYG; rad9::KanMX; pol32::NAT ubr1::pGAL1-UBR1 (LEU2); cdc9::pCMV-
TETR-VP16 pTetR-UBI4-CDC9 (URA3) yIW193 MATa; his3-1; met15-0; dnl4::HYG; rad9::KanMX; cac1::NAT ubr1::pGAL1-UBR1 (LEU2); cdc9::pCMV-
TETR-VP16 pTetR-UBI4-CDC9 (URA3) yIW204 MATa; his3-1; met15-0; dnl4::HYG; rad9::KanMX; cac2::NAT ubr1::pGAL1-UBR1 (LEU2); cdc9::pCMV-
TETR-VP16 pTetR-UBI4-CDC9 (URA3) yIW205 MATa; his3-1; met15-0; dnl4::HYG; rad9::KanMX; cac3::NAT ubr1::pGAL1-UBR1 (LEU2); cdc9::pCMV-
TETR-VP16 pTetR-UBI4-CDC9 (URA3)
W W W. N A T U R E . C O M / N A T U R E | 1 3
SUPPLEMENTARY INFORMATION RESEARCH
Supplementary References 43. Bielinsky, A. K. & Gerbi, S. A. Discrete start sites for DNA synthesis in the yeast ARS1 origin. Science 279, 95-98 (1998).
44.. Bielinsky, A. K. & Gerbi, S. A. Chromosomal ARS1 has a single leading strand start site. Mol Cell 3, 477-486 (1999).
45. Sekedat, M. D. et al. GINS motion reveals replication fork progression is remarkably uniform throughout the yeast genome. Mol Syst Biol 6, 353 (2010).
46. Eaton, M. L., Galani, K., Kang, S., Bell, S. P. & MacAlpine, D. M. Conserved nucleosome positioning defines replication origins. Genes Dev 24, 748-753 (2010).