
Supplemental Information A Chemical Biology Study of ... Figu imag acid OCT -TU PLEMENT re S1, relat...
22
Stem Cell Reports, Volume 5 Supplemental Information A Chemical Biology Study of Human Pluripotent Stem Cells Unveils HSPA8 as a Key Regulator of Pluripotency Yijie Geng, Yongfeng Zhao, Lisa Corinna Schuster, Bradley Feng, Dana A. Lynn, Katherine M. Austin, Jason Daniel Stoklosa, and Joseph D. Morrison
Transcript of Supplemental Information A Chemical Biology Study of ... Figu imag acid OCT -TU PLEMENT re S1, relat...
Stem Cell Reports, Volume 5
Supplemental Information
A Chemical Biology Study of Human Pluripotent Stem Cells
Unveils HSPA8 as a Key Regulator of Pluripotency
Yijie Geng, Yongfeng Zhao, Lisa Corinna Schuster, Bradley Feng, Dana A. Lynn,
Katherine M. Austin, Jason Daniel Stoklosa, and Joseph D. Morrison
SUP
Figu
imag
acid
OCT
-TU
PPLEMENT
ure S1, relat
ges of NTER
(RA; 10 μM
T4 in NTERA
UBULIN wa
TAL DATA
ted to Figur
RA-2-OP4k c
M) and HMB
A-2-OP4k ce
as used as a lo
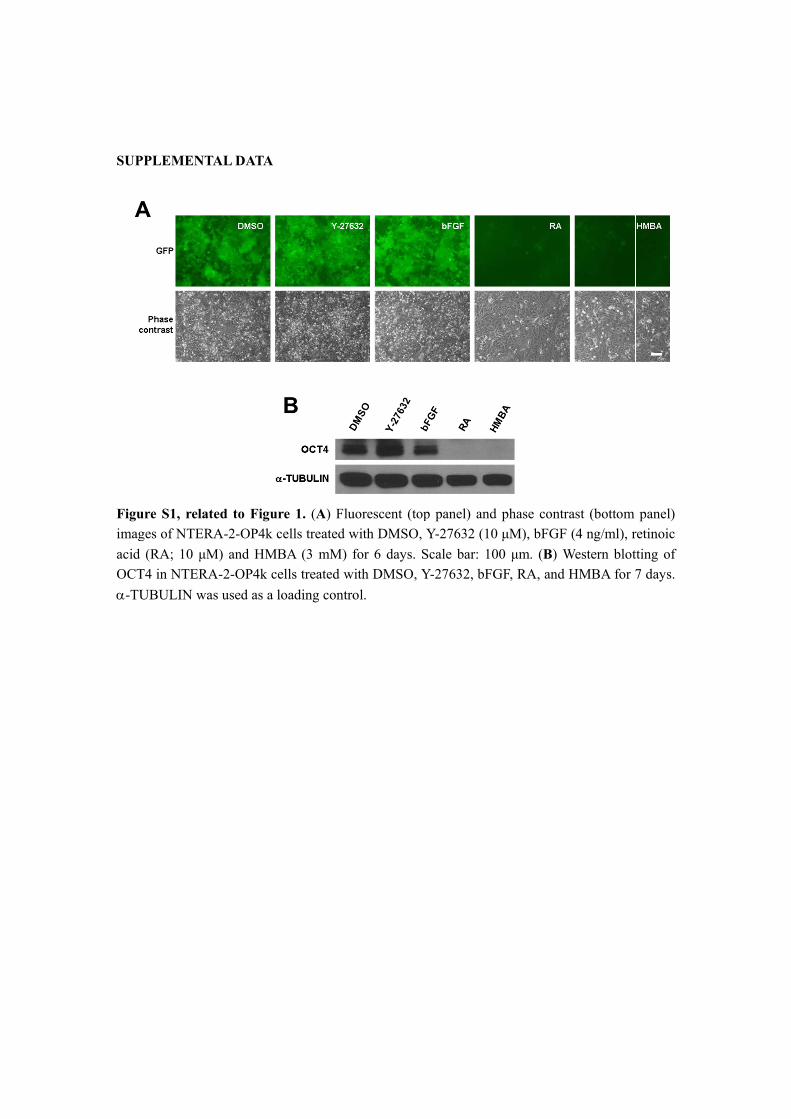
re 1. (A) Flu
ells treated w
BA (3 mM) f
ells treated w
oading contro
uorescent (top
with DMSO,
for 6 days. S
with DMSO, Y
ol.
p panel) and
Y-27632 (10
Scale bar: 10
Y-27632, bFG
d phase contr
0 μM), bFGF
00 μm. (B) W
GF, RA, and
rast (bottom
F (4 ng/ml), r
Western blot
HMBA for 7
panel)
retinoic
tting of
7 days.
Figu
hESC
(d). NAN
4, an
with
hESCshow
(END
M)
to thaver
ACT
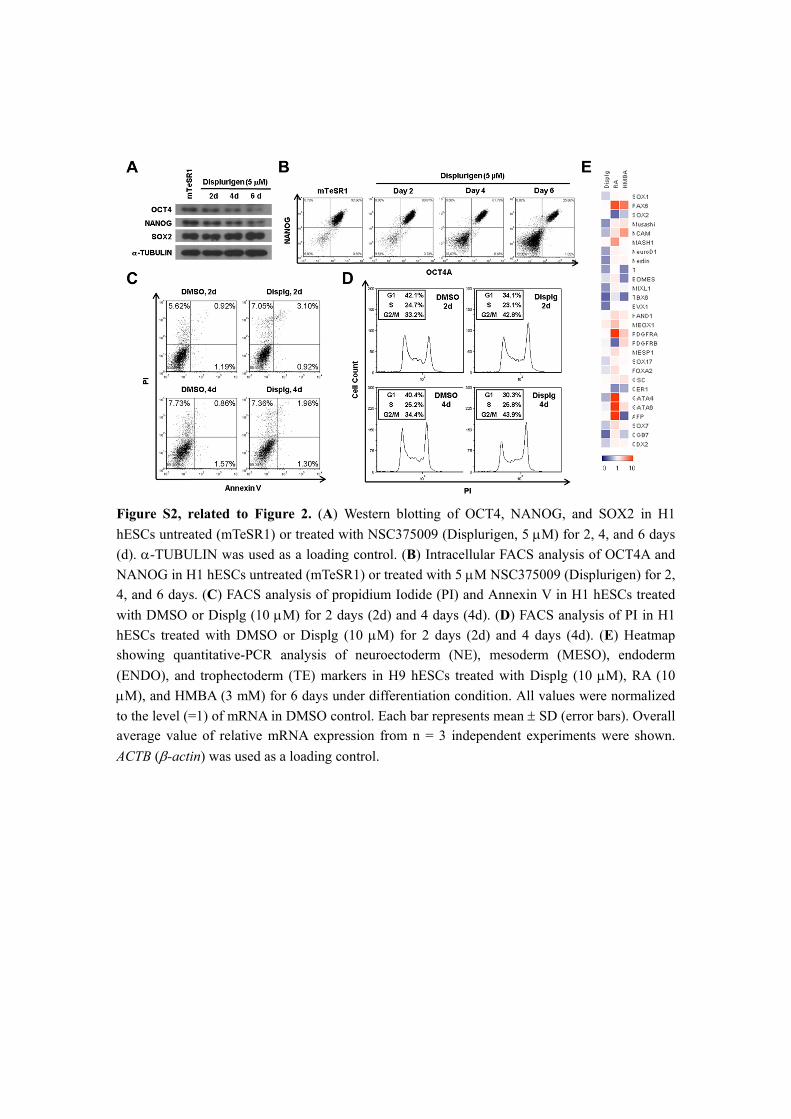
ure S2, relat
Cs untreated
-TUBULIN
NOG in H1 h
nd 6 days. (C
h DMSO or D
Cs treated wwing quantit
DO), and tro
), and HMBA
he level (=1) age value of
TB (-actin) w
ted to Figu
d (mTeSR1) o
N was used a
hESCs untrea
C) FACS ana
Displg (10 with DMSO tative-PCR a
ophectoderm
A (3 mM) for
of mRNA in f relative mR
was used as a
re 2. (A) W
or treated wit
as a loading
ated (mTeSR
alysis of prop
M) for 2 day
or Displg (1analysis of
m (TE) marke
r 6 days und
DMSO contRNA express
a loading con
Western blotti
th NSC3750
control. (B)
R1) or treated
pidium Iodid
ys (2d) and 4
10 M) for 2neuroectode
ers in H9 hE
der differentia
trol. Each barsion from n
ntrol.
ing of OCT4
09 (Displurig
Intracellular
with 5 M N
de (PI) and A
4 days (4d).
2 days (2d) erm (NE), m
ESCs treated
ation conditio
r represents m= 3 indepen
4, NANOG,
gen, 5 M) f
r FACS analy
NSC375009 (
Annexin V in
(D) FACS an
and 4 days mesoderm (M
with Displg
on. All value
mean SD (ndent experim
and SOX2
for 2, 4, and
ysis of OCT4
(Displurigen
n H1 hESCs
nalysis of PI
(4d). (E) HeMESO), end
g (10 M), R
es were norm
(error bars). Oments were s
in H1
6 days
4A and
n) for 2,
treated
I in H1
eatmap doderm
RA (10
malized
Overall shown.
Figu
the d
HSP
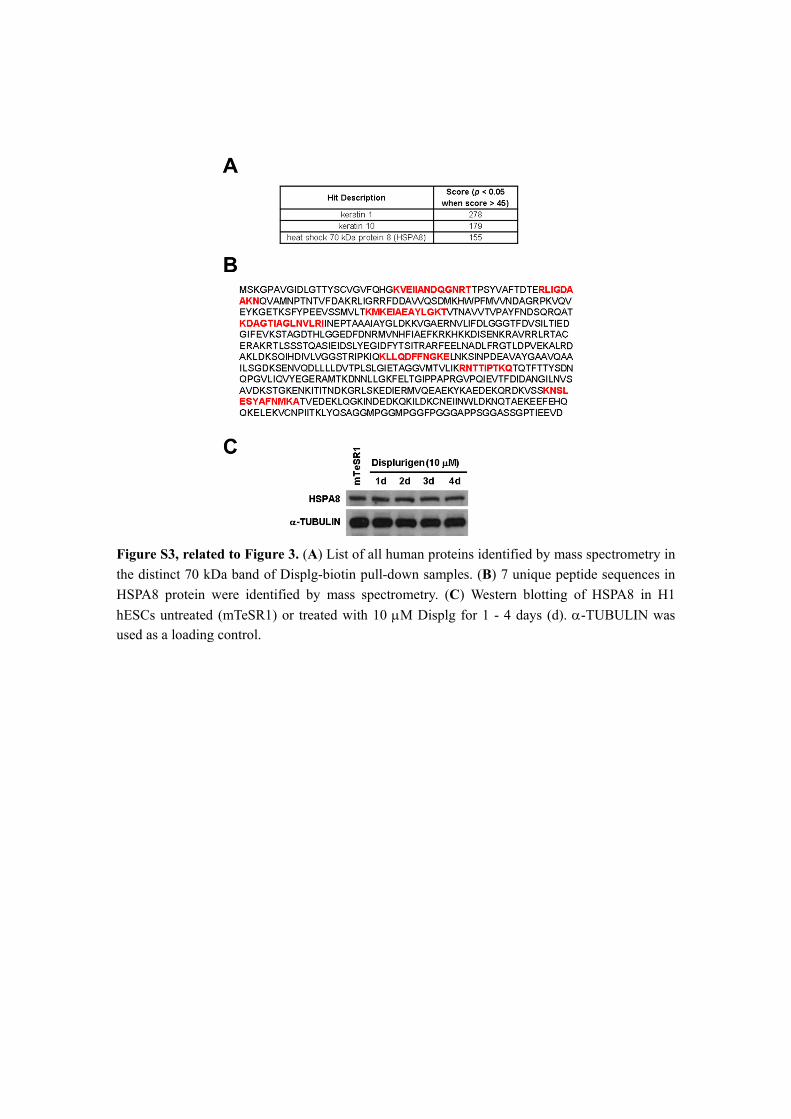
hESCused
ure S3, relate
distinct 70 kD
PA8 protein w
Cs untreatedd as a loading
ed to Figure
Da band of D
were identif
d (mTeSR1) og control.
e 3. (A) List o
Displg-biotin
fied by mass
or treated w
of all human
n pull-down
s spectromet
ith 10 M D
n proteins ide
samples. (B)
try. (C) Wes
Displg for 1
entified by m
) 7 unique pe
tern blotting
- 4 days (d).
mass spectrom
eptide sequen
g of HSPA8
. -TUBULI
metry in
nces in
in H1
IN was
Figu
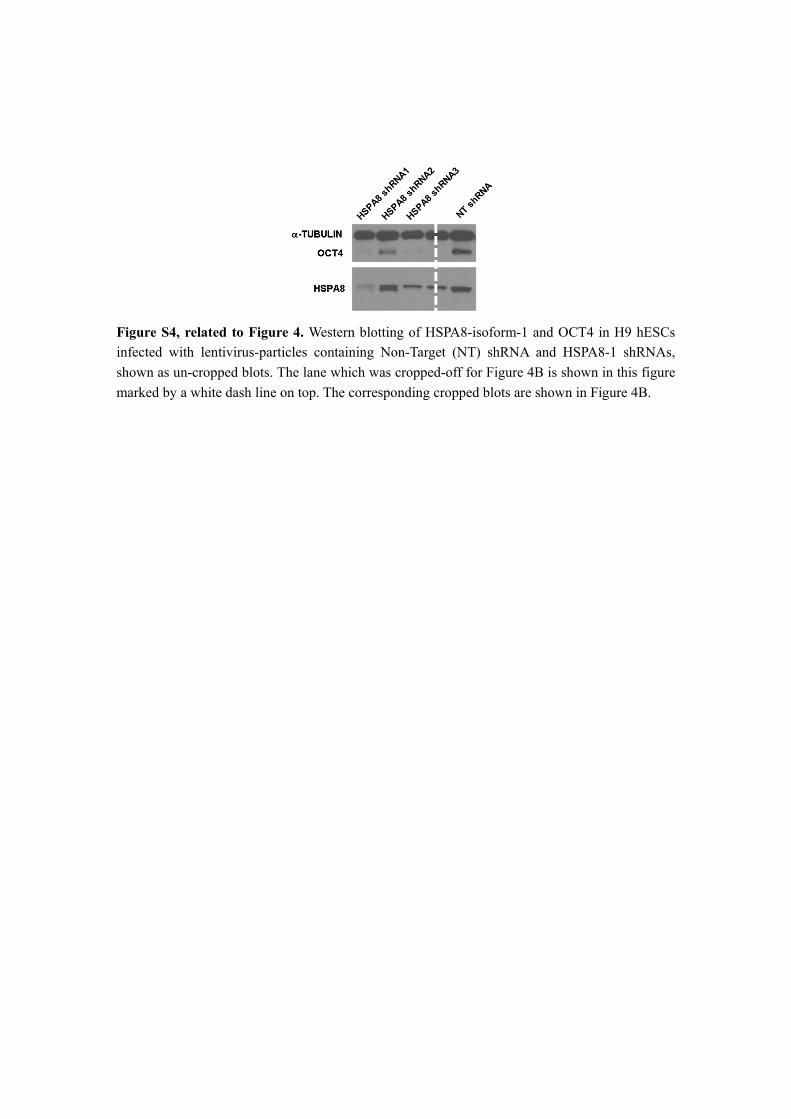
infec
show
mark
ure S4, relat
cted with len
wn as un-crop
ked by a whit
ted to Figur
ntivirus-parti
pped blots. T
te dash line o
e 4. Western
icles contain
The lane whic
on top. The c
n blotting of
ning Non-Ta
ch was cropp
corresponding
HSPA8-isofo
rget (NT) sh
ped-off for F
g cropped blo
form-1 and O
hRNA and H
igure 4B is s
ots are show
OCT4 in H9
HSPA8-1 sh
shown in this
n in Figure 4
hESCs
hRNAs,
s figure
4B.
Figu
fract
lane exclu
and t
EMS
bind
label
of DOCT
posit
that
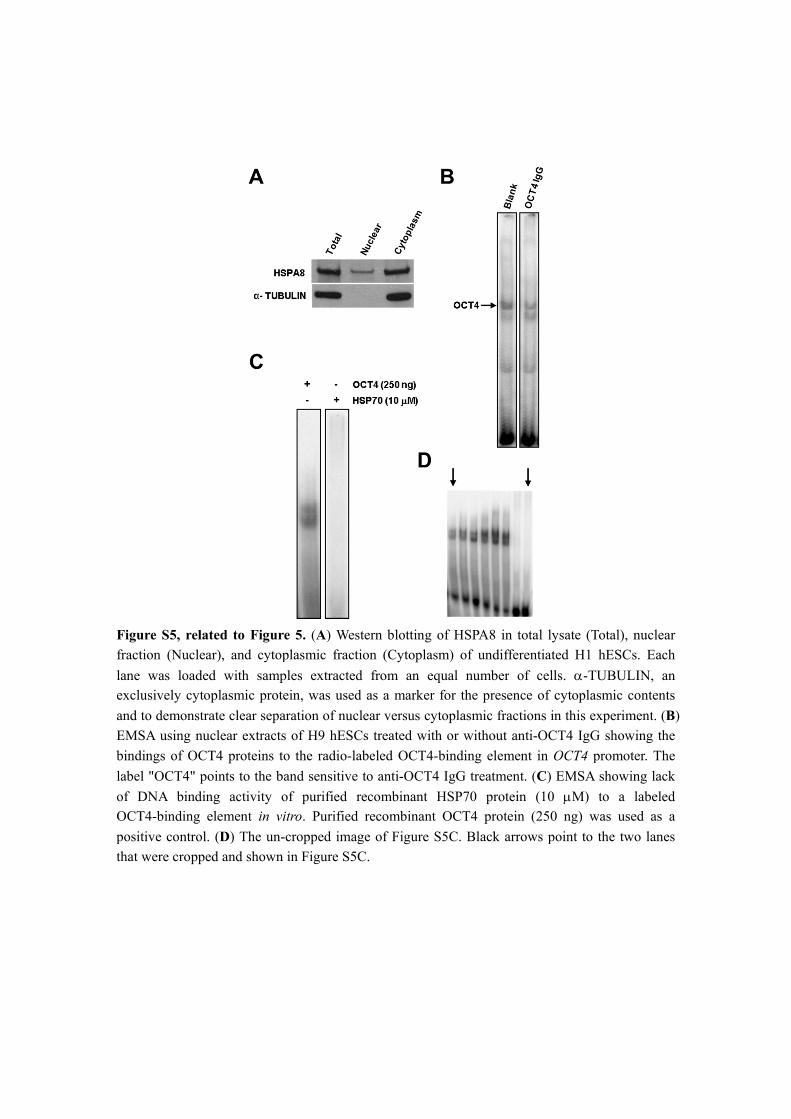
ure S5, relat
tion (Nuclear
was loadedusively cytop
to demonstra
SA using nuc
dings of OCT
l "OCT4" po
DNA bindinT4-binding e
tive control.
were cropped
ted to Figur
r), and cytop
d with sampplasmic prot
ate clear sepa
clear extracts
T4 proteins t
oints to the b
ng activity oelement in v
(D) The un-
d and shown
re 5. (A) We
plasmic frac
ples extractetein, was use
aration of nuc
s of H9 hES
to the radio-l
band sensitive
of purified itro. Purified
-cropped ima
n in Figure S5
estern blottin
ction (Cytopl
ed from an ed as a mark
clear versus
Cs treated w
labeled OCT
e to anti-OC
recombinantd recombina
age of Figure
5C.
ng of HSPA8
lasm) of und
equal number for the pr
cytoplasmic
with or witho
T4-binding el
T4 IgG treat
t HSP70 prant OCT4 pr
e S5C. Black
8 in total lysa
differentiated
ber of cells.resence of cy
fractions in
out anti-OCT
lement in OC
tment. (C) EM
rotein (10 rotein (250 n
k arrows poi
ate (Total), n
d H1 hESCs
. -TUBULytoplasmic co
this experim
T4 IgG showi
CT4 promote
MSA showin
M) to a lng) was use
int to the two
nuclear
s. Each
IN, an ontents
ment. (B)
ing the
er. The
ng lack
labeled ed as a
o lanes
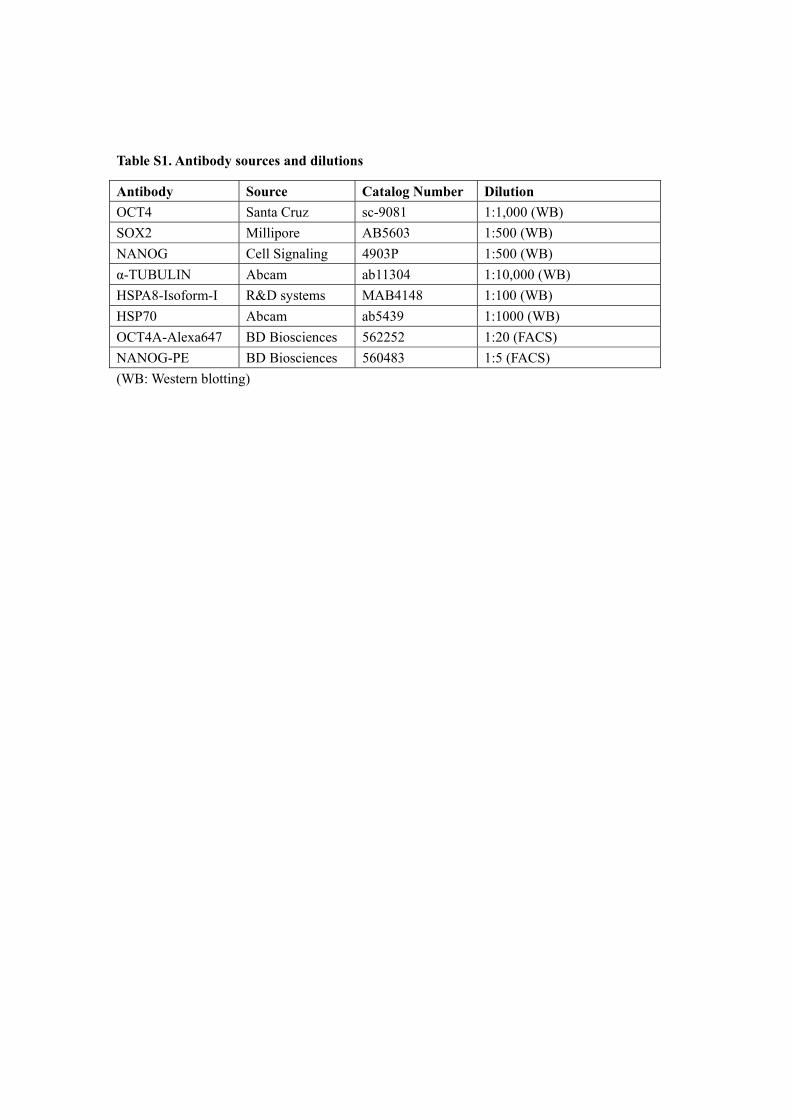
Table S1. Antibody sources and dilutions
Antibody Source Catalog Number Dilution
OCT4 Santa Cruz sc-9081 1:1,000 (WB)
SOX2 Millipore AB5603 1:500 (WB)
NANOG Cell Signaling 4903P 1:500 (WB)
α-TUBULIN Abcam ab11304 1:10,000 (WB)
HSPA8-Isoform-I R&D systems MAB4148 1:100 (WB)
HSP70 Abcam ab5439 1:1000 (WB)
OCT4A-Alexa647 BD Biosciences 562252 1:20 (FACS)
NANOG-PE BD Biosciences 560483 1:5 (FACS)
(WB: Western blotting)
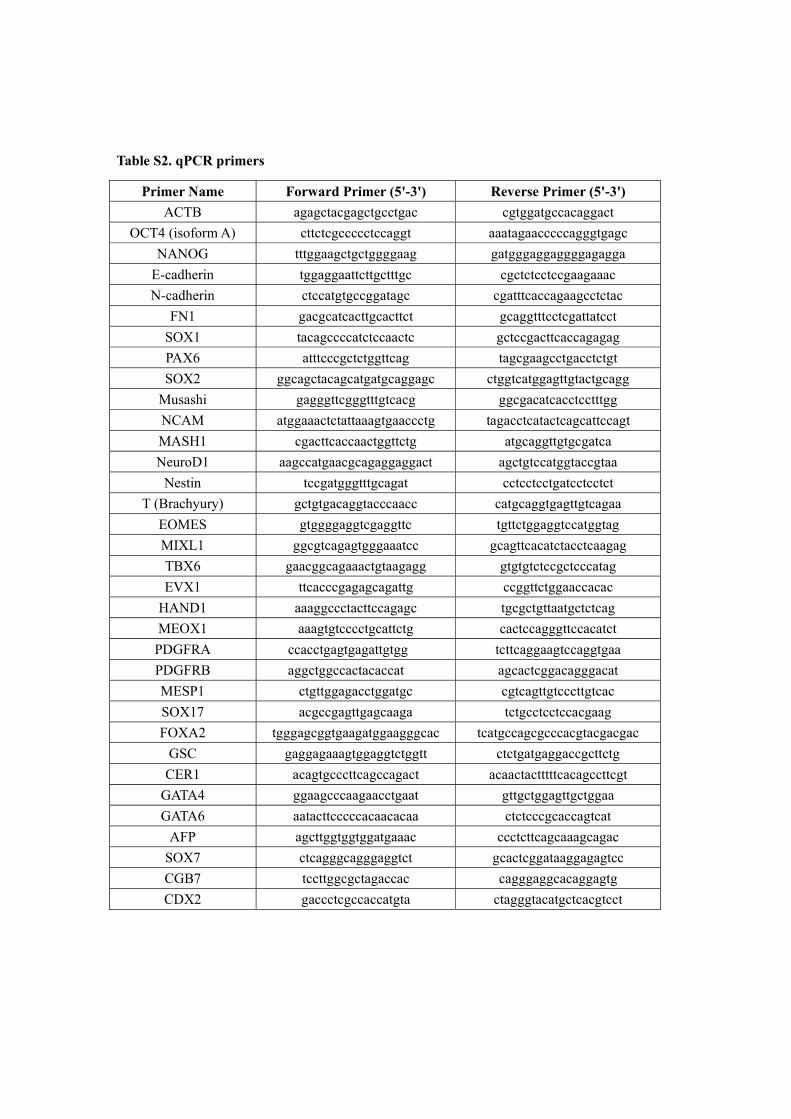
Table S2. qPCR primers
Primer Name Forward Primer (5'-3') Reverse Primer (5'-3')
ACTB agagctacgagctgcctgac cgtggatgccacaggact
OCT4 (isoform A) cttctcgccccctccaggt aaatagaacccccagggtgagc
NANOG tttggaagctgctggggaag gatgggaggaggggagagga
E-cadherin tggaggaattcttgctttgc cgctctcctccgaagaaac
N-cadherin ctccatgtgccggatagc cgatttcaccagaagcctctac
FN1 gacgcatcacttgcacttct gcaggtttcctcgattatcct
SOX1 tacagccccatctccaactc gctccgacttcaccagagag
PAX6 atttcccgctctggttcag tagcgaagcctgacctctgt
SOX2 ggcagctacagcatgatgcaggagc ctggtcatggagttgtactgcagg
Musashi gagggttcgggtttgtcacg ggcgacatcacctcctttgg
NCAM atggaaactctattaaagtgaaccctg tagacctcatactcagcattccagt
MASH1 cgacttcaccaactggttctg atgcaggttgtgcgatca
NeuroD1 aagccatgaacgcagaggaggact agctgtccatggtaccgtaa
Nestin tccgatgggtttgcagat cctcctcctgatcctcctct
T (Brachyury) gctgtgacaggtacccaacc catgcaggtgagttgtcagaa
EOMES gtggggaggtcgaggttc tgttctggaggtccatggtag
MIXL1 ggcgtcagagtgggaaatcc gcagttcacatctacctcaagag
TBX6 gaacggcagaaactgtaagagg gtgtgtctccgctcccatag
EVX1 ttcacccgagagcagattg ccggttctggaaccacac
HAND1 aaaggccctacttccagagc tgcgctgttaatgctctcag
MEOX1 aaagtgtcccctgcattctg cactccagggttccacatct
PDGFRA ccacctgagtgagattgtgg tcttcaggaagtccaggtgaa
PDGFRB aggctggccactacaccat agcactcggacagggacat
MESP1 ctgttggagacctggatgc cgtcagttgtcccttgtcac
SOX17 acgccgagttgagcaaga tctgcctcctccacgaag
FOXA2 tgggagcggtgaagatggaagggcac tcatgccagcgcccacgtacgacgac
GSC gaggagaaagtggaggtctggtt ctctgatgaggaccgcttctg
CER1 acagtgcccttcagccagact acaactactttttcacagccttcgt
GATA4 ggaagcccaagaacctgaat gttgctggagttgctggaa
GATA6 aatacttcccccacaacacaa ctctcccgcaccagtcat
AFP agcttggtggtggatgaaac ccctcttcagcaaagcagac
SOX7 ctcagggcagggaggtct gcactcggataaggagagtcc
CGB7 tccttggcgctagaccac cagggaggcacaggagtg
CDX2 gaccctcgccaccatgta ctagggtacatgctcacgtcct
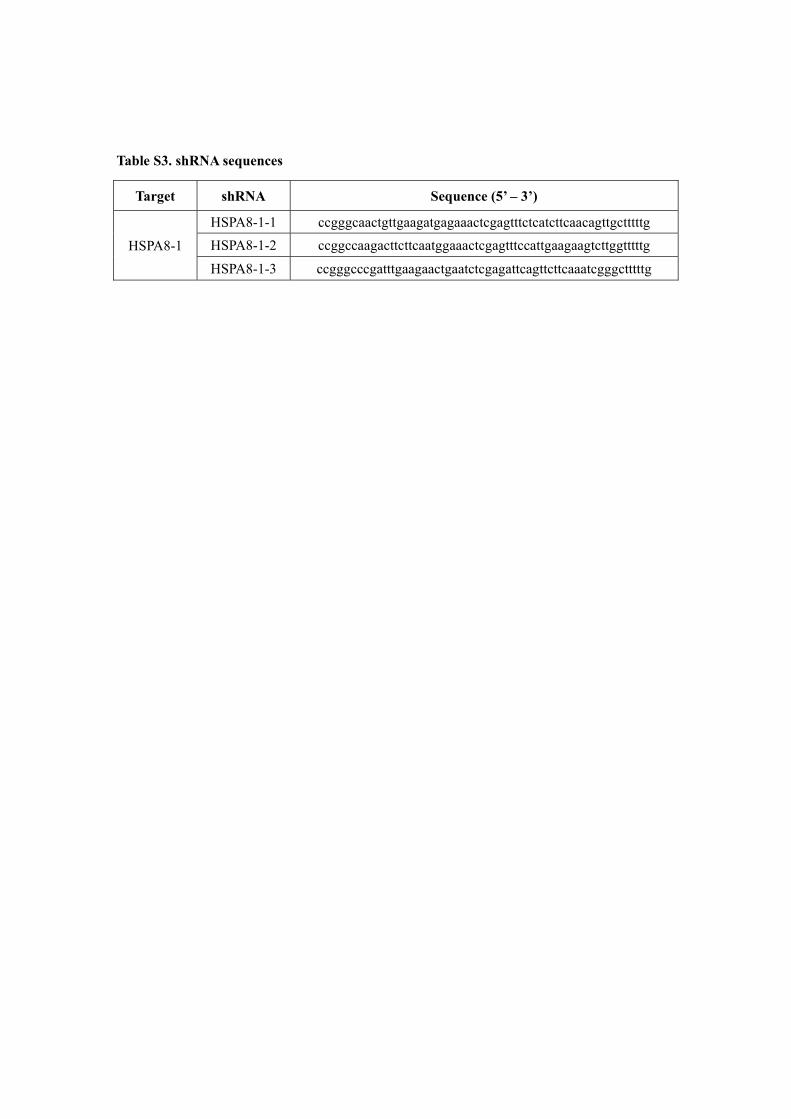
Table S3. shRNA sequences
Target shRNA Sequence (5’ – 3’)
HSPA8-1
HSPA8-1-1 ccgggcaactgttgaagatgagaaactcgagtttctcatcttcaacagttgctttttg
HSPA8-1-2 ccggccaagacttcttcaatggaaactcgagtttccattgaagaagtcttggtttttg
HSPA8-1-3 ccgggcccgatttgaagaactgaatctcgagattcagttcttcaaatcgggctttttg

Table S4. EMSA probes
Probes Forward Sequence (5'-3') Reverse Sequence (5'-3')
NANOG tctgcagctacttttgcattacaatggccttggtgag ctcaccaaggccattgtaatgcaaaagtagctgcaga
OCT4 cagacagcagagagatgcatgacaaaggtgccgtgat
ggttc gaaccatcacggcacctttgtcatgcatctctctgctgtctg
SOX2 gccgtttgccttcatttccataagaagattaaga tcttaatcttcttatggaaatgaaggcaaacggc
SUPPLEMENTAL EXPERIMENTAL PROCEDURES
Cell culture
H9 and H1 hESC lines (WiCell Research Institute, Madison, WI) were maintained under a feeder
condition or a feeder-independent condition. For the feeder condition (Thomson et al., 1998),
primary mouse embryonic fibroblasts (MEFs) prepared from embryos of pregnant CF-1 mice
(day 13.5 of gestation; Charles River) were cultured in Dulbecco’s Modified Eagle Medium
(DMEM) containing 10% FBS (Hyclone), 1% non-essential amino acids (NEAA; Invitrogen),
and penicillin/streptomycin, and mitotically inactivated by gamma irradiation. H9 and H1 hESCs
were cultured on irradiated MEFs in media containing DMEM/F12, 20% knockout serum
replacement (KSR; Invitrogen), 4 ng/ml basic fibroblast growth factor (bFGF) (Invitrogen), 1%
NEAA, 1 mM glutamine, and 0.1 mM β-mercaptoethanol. For the feeder-independent condition,
hESCs were cultured on Matrigel (BD Biosciences)-coated plates in mTeSR1 medium (StemCell
Technologies) as described (Ludwig et al., 2006). The experiments described in this study were
conducted with H9 and H1 hESCs between passages 30 and 60. NTERA-2 cells (NTERA-2 cl.D1)
were purchased from American Type Culture Collection (ATCC) and were cultured in Dulbecco's
Modified Eagle's Medium (DMEM) containing 10% fetal bovine serum.
Generation and validation of NTERA-2-OP4k reporter cells
The plasmid containing EGFP driven by a fragment of OCT4 promoter (~4 kb) was kindly
provided by Dr. Wei Cui (Imperial College London) and was as described (Gerrard et al., 2005).
We established NTERA-2-OP4k cells containing the OCT4-EGFP construct by transfecting cells
using Amaxa Nucleofection System (Nucleofector Kit L; Program X-001), selecting transfected
cells with G418 (500 μg/ml, 2 weeks), and enriching EGFP-positive cells using
fluorescence-activated cell sorting (FACS) (Cytomation Plus, Dako).
For validation of reporter activity, NTERA-2-OP4k cells were plated at a density of 0.1 – 0.25 ×
105 cells/cm2 and incubated with RA (Sigma; 10 μM), HMBA (Sigma; 3 mM), bFGF (Invitrogen;
4 ng/ml), and Y-27632 (Calbiochem; 10 μM). After 6 - 7 days of incubation, changes in the level
of EGFP signals were examined using fluorescent microscopy (Zeiss), flow cytometry (BD
Biosciences LSR II), and fluorescent plate reader (Analyst HT, Molecular Devices).
Large-scale chemical screening
Large-scale chemical screening was conducted at the High-Throughput Screening Facility (HTSF)
at the University of Illinois at Urbana−Champaign (http://www.scs.illinois.edu/htsf/index.html).
The HTSF hosts 171,077 compounds from several compound libraries, which include the Marvel
Library, the HTSF House Library, the ChemBridge MicroFormat Library, and the National
Cancer Institute (NCI) library.
For large-scale chemical screening, NTERA-2-OP4k cells were trypsinized and seeded onto
96/384-well plates (at 0.1 – 0.25 × 10⁵ cells/cm2) using a WellMate Microplate Dispenser
(Matrix). Compounds were added immediately after plating using a 96-well or a 384-well
pin-tool. The first two and last two columns of 384-well plates and the first and last column of
96-well plates were used for DMSO treatment as negative controls. Cells were incubated for 6 - 7
days without medium change. EGFP expressions of individual wells were recorded by the
fluorescence plate reader (Analyst HT, Molecular Devices). EGFP signal detected with compound
treatments were compared to the DMSO control, and those with significant reduction (>30%;
average level of background signals subtracted before comparison) were marked as potential hits
and were subsequently inspected visually using a fluorescence microscope (Zeiss). The final
compound concentrations applied to the screening plates were 5 - 10 μM (Marvel library), 500
nM - 1 μM (NCI library), 5 - 10 μM (House library), and 10 - 20 μg/ml (ChemBridge
MicroFormat library).
Western blotting
Cultured cells were lysed directly by 2× Laemmli buffer (Bio-Rad), boiled for 5 min, and
analyzed using SDS-PAGE electrophoresis followed by wet-transfer onto nitrocellulose
membranes using a system manufactured by Bio-Rad. The membranes were blocked using
blocking solution (5% BSA in Tris-buffered saline containing 0.1% Tween-20 [TBST]), and then
incubated with primary antibodies, diluted in TBST, at 4°C overnight. The membranes were then
washed by TBST for 3 × 5 min, and incubated with horseradish peroxidase (HRP) conjugated
secondary antibodies at room temperature for 1 hr. Finally, the membranes were washed 5 min
each time for 3 – 5 times by TBST and developed using Super-Signal West Pico
Chemiluminescent Substrate (Pierce). Antibody information are described in Table S1.
RNA extraction, reverse transcription, and quantitative-PCR
Total RNA were isolated using RNeasy mini kit (QIAGEN). cDNAs were synthesized from the
purified RNAs using Reverse Transcription System (Promega). Quantitative-PCR was performed
using QuantiTech SYBR Green PCR kit (QIAGEN). Signals were analyzed using the
comparative CT method, and ACTB gene was used as an internal control. The designs of
gene-specific primers are described in Table S2.
Intracellular FACS analysis
Single cell suspensions were acquired through Accutase (Invitrogen) treatment. Cells were fixed
and stained using Transcription Factor Buffer Set (BD Biosciences) following the manufacturer’s
instructions. Conjugated antibodies including OCT4A-Alexa647 and NANOG-PE (Table S1)
were used. Cells were resuspended in PBS supplemented with 1% BSA and analyzed using a BD
Biosciences LSR II flow cytometry analyzer and BD FACSDiva software.
Apoptosis analysis
Cells were collected and washed in cold PBS. Cells were then stained using FITC Annexin V
Apoptosis Detection Kit I (BD Biosciences) following the manufacturer’s instructions. Cells were
analyzed using a BD BD Biosciences LSR II flow cytometry analyzer and BD FACSDiva
software.
Cell cycle analysis
Cells were collected and washed in cold PBS, and fixed in chilled ethanol overnight at 4°C. Cells
were then washed and resuspended in PBS with 50 g/ml propidium iodide (PI) and 100 g/ml
RNase A for 30 min at 37°C. DNA content was measured by flow cytometry.
Differentiation assay
H9 and H1 hESC were seeded onto Matrigel coated plates in single cell in mTeSR1 medium.
Cells were then incubated with a basal differentiation medium containing Advanced RPMI 1640
(Invitrogen), 2% B-27 supplement (Invitrogen), and 1% Glutamax (Invitrogen) with compound
treatments (DMSO, 10 M Displg, 10 M RA, and 3 mM HMBA). Medium was changed every
other day. Samples were collected on day 6 for analysis.
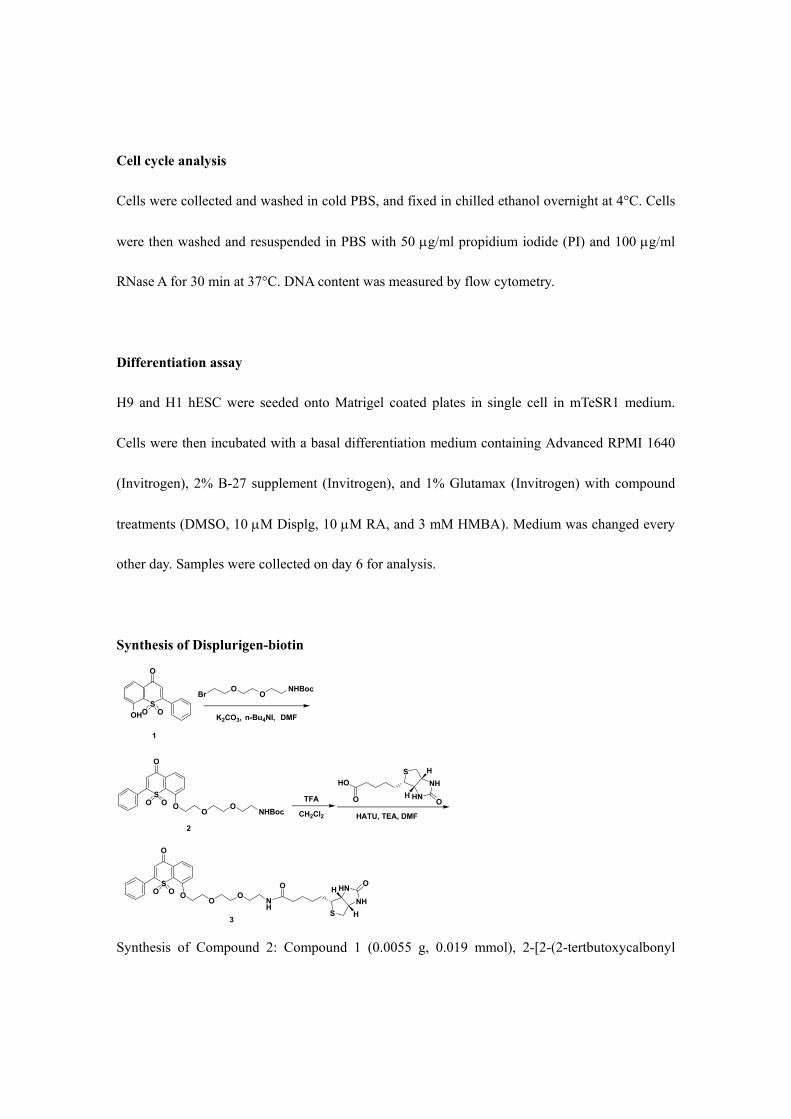
Synthesis of Displurigen-biotin
SO OOH
1
O
BrO
ONHBoc
SOO
O
OO
ONHBoc
HNO
H
NH
HS
O
HO
SOO
O
OO
ONH
HNO
H
NH
HS
O
2
3
K2CO3, n-Bu4NI,
TFA
CH2Cl2 HATU, TEA, DMF
DMF
Synthesis of Compound 2: Compound 1 (0.0055 g, 0.019 mmol), 2-[2-(2-tertbutoxycalbonyl
aminoethoxy) ethoxy]ethyl bromide (0.0071 g, 0.023 mmol), K2CO3 (0.0030 g, 0.022 mmol) and
n-Bu4NI (0.0014 g, 0.0038 mmol) were suspended in DMF (1 mL). The suspension was heated at
60 °C for 12 h. After evaporation of the solvent, crude product was purified by flash
chromatography on silica gel (EtOAc : Hexanes = 1 : 1) and then EtoAc to give 2 as solid (0.0086
g, 0.0166 mmol, 86.5 %). 1H NMR (300MHz, CDCl3, 25 oC) δ 1.43 (s, 9H), 3.29 (m, 2H), 3.53 (t,
J = 5.1 Hz, 2H), 3.58 (m, 2H), 3.76 (m, 2H), 3.99 (t, J = 4.5 Hz, 2H), 4.40 (t, J = 4.8 Hz, 2H),
4.98 (bs, 1H), 6.73 (s, 1H), 7.42-7.62 (m, 4H), 7.68 (t, J = 6.9 Hz, 1H), 7.83-7.90 (m, 3H); 13C
NMR (75 MHz, CDCl3, 25 oC) 28.4, 40.4, 69.3, 70.2, 70.4, 70.5, 71.4, 119.9, 120.4, 127.8, 129.1,
130.0, 131.6, 133.8, 154.5, 155.9, 156.6, 178.4
Synthesis of Compound 3: Deprotection of 2 (0.0086 g, 0.0166 mmol) was performed with 0.5
mL of CH2Cl2 and 0.2 mL TFA at 0 °C. After stirring at 0 °C for 3 h, the reaction mixture was
concentrated. Toluene (0.5 mL) was added to the residue and then evaporated to remove TFA.
The procedure was repeated three times. The resulting TFA salt of the deprotected amine was
dissolved in DMF (1 mL) and D-biotin (0.0071 g, 0.029 mmol). HATU (0.012 g, 0.0316 mmol)
was added followed by a triethylamine (25 μL, 0.18 mmol). After stirring at rt overnight, the
mixture was concentrated under reduced pressure and the residue was purified by flash
chromatography on silica gel (CHCl3 : EtOH = 10 : 1), which gave 3 (0.0077 g, 0.012 mmol,
72.1 %) as solid. 1H NMR (300 MHz, CDCl3, 25 °C) δ 1.37 (m, 2H), 1.68 (m, 4H), 2.15 (t, J =
7.5 Hz, 2H), 2.70 (d, J = 12.9 Hz, 1H), 2.88 (dd, J = 5.4 Hz, J = 12.9 Hz, 1H), 3.09 (m, 1H), 3.40
(m, 2H), 3.56 (t, J = 5.1 Hz, 2H), 3.67 (m, 2H), 3.78 (m, 2H), 3.98 (t, J = 4.8 Hz, 2H), 4.23 (m,
1H), 4.40 (m, 2H), 4.47 (m, 1H), 4.93 (s, 1H), 5.77 (s, 1H), 6.50 (t, 1H), 6.75 (s, 1H), 7.42-7.60
(m, 4H), 7.66 (t, J = 7.5 Hz, 1H), 7.84 (m, 3H); 13C NMR (75 MHz, CDCl3, 25 oC) 25.8, 28.3,
36.1, 39.4, 40.8, 55.7, 60.4, 62.0, 69.4, 70.2, 70.6, 70.7, 71.2, 120.0, 120.7, 128.2, 129.4, 130.3,
131.9, 134.2, 154.6, 156.7, 164.0, 173.5, 178.6; MS (ESI+) (m/z): [M + H]+ Calcd. For
C31H38N3O8S2: 644.2095; Found: 644.2104.
Affinity chromatography, electrophoresis, and silver staining
hESCs were cultured under the feeder-independent condition with or without the presence of
displurigen-biotin (10 µM) overnight, washed in PBS three times and lysed in Ice-cold RIPA
buffer supplemented with protease and phosphatase inhibitors cocktail (Sigma). The lysates were
then diluted two-fold by Tris buffer (50 mM Tris-HCl, pH 7.5).
For affinity chromatography (“pull-down”), diluted lysates were incubated with
streptavidin−agarose beads (Sigma) for 5 hr at 4°C. The beads were collected using centrifugation
and washed with wash buffer (75 mM NaCl, 0.5 mM EDTA, 0.5% Triton X-100, 0.5% sodium
deoxycholate, 0.05% SDS, 50 mM Tris-HCl, pH 7.6). The washed beads were suspended in 2×
Laemmli buffer (Bio-Rad) and heated at 100°C for 5 min.
For electrophoresis and silver staining, 10 μl samples were loaded on polyacrylamide gel. Silver
staining was performed using ProteoSilver Plus Silver Stain Kit (Sigma). Protein bands detected
by silver staining were selectively excised for mass spectrometry analysis.
Mass spectrometry analysis
Gel slices were dehydrated and destained in 50% Acetonitrile + 25 mM NH4HCO3 and gently
crushed using a plastic pestle inside a 1.5 ml eppendorf tube. The crushed gel was dried briefly
using Speedvac (Thermo) before digestion with Trypsin (mass spectrometry grade, G-Biosciences
at 1:50 w/w) in 25 mM ammonium bicarbonate. Digestion was performed using a CEM Discover
Microwave Digestor (Mathews, NC) for 15 min at 75 watts, 55°C. The digested peptides were
extracted using 50% acetonitrile and 5% formic acid, lyophilized and reconstituted in 5%
acetonitrile and 0.1% formic, 10 µl of which was used for LC/MS analysis. Mass spectrometry
was performed using a Waters Q-ToF connected to a Waters nanoAcquity UPLC (Milford, MA).
Column was a Waters Atlantis dC18 nanoAcquity UPLC column 75 µm x 150 mm (3 µm particle
size) running at 250 nl/min. Gradient was from 100% A to 60% B (A: water and 0.1% formic acid;
B: acetonitrile and 0.1% formic acid). Data collection was performed using MassLynx 4.1
(Waters). The top 4 intensive precursor ions from each survey scan were subjected to MS/MS by
Collision Induced Dissociation (CID). The raw mass spectrometric data were processed using
ProteinLynx Global Server 2.2.5 (Waters). The refined peaklists were analyzed using Mascot 2.2
(Matrix Science, London, UK) with a tolerance of ± 0.4 Da for both the precursor ions and
fragment ions. Searches were carried out using the NCBI non-redundant protein database.
Embryoid body (EB) formation
H9 and H1 hESC colonies were dissociated from the culture surface by 20 min treatment of
Dispase (Invitrogen). Suspended colonies were pooled by brief centrifugation (1000 rpm, 1 min),
resuspended in medium containing Advanced RPMI 1640 (Invitrogen), 2% B-27 supplement
(Invitrogen), and 1% Glutamax (Invitrogen), and then plated into ultra-low attachment plates
(Corning). Medium was changed every other day.
In vitro ATPase assay
The HSP70 ATPase rates were determined as described (Freeman et al., 1995). In brief, ATP
hydrolysis was determined by measuring the release of [32P]Pi from [-32P]ATP. The ATPase rates
were calculated utilizing an average [-32P]ATP hydrolysis rate at each time point (5, 10, 15 and
20 min) from three separate experiments after the background hydrolysis was subtracted. The
data were visualized and quantified by PhosphorImager analysis (Molecular Dynamics). The
effect of Displurigen on the ATPase rate of HSP70 was measured by incubating HSP70 (5 min)
with varying levels of Displurigen prior to the introduction of ATP.
Lentivirus production and infection
For viral packaging, expression vectors were co-transfected with pCMV-dR8.91 and
pCMV-VSV-G into 293T cells by CaPO4 precipitation. After overnight incubation, culture
medium was replaced by virus-packaging medium containing DMEM, 30% FBS, and 1 mM
sodium pyruvate. Supernatants were collected 48 hr later and concentrated approximately 100×
by ultracentrifuge (20,000 rpm, 1 hr). H1 and H9 hESCs were infected by virus concentrates in
the presence of Polybrene (6 μg/ml), and then subjected to puromycin (0.5 μg/ml) selection for
3-5 days prior to analysis.
HSPA8 overexpression plasmid construction
HSPA8-isoform-1 cDNA clone was purchased from OriGene (SC322471), and subcloned into a
pSin-EF2 plasmid (Addgene; modified with a short adaptor sequence) at the MluI/NdeI site.
Immunoprecipitation
Cells treated with DMSO or Displg (100 μM, 2 hours) were lysed in ice-cold RIPA buffer (Pierce)
supplemented with a protease inhibitor cocktail (Sigma). After clarification, cell lysates were
pre-cleared with Protein A/G magnetic beads (Pierce) and thereafter incubated with 2 μg of
anti-OCT4 antibody (Santa Cruz) and with DMSO or 1 mM Displg, respectively. After 2 hours of
incubation at 4°C, Protein A/G magnetic beads were added to the cell lysates. The resulting
immunoprecipitates were washed with ice-cold PBS and analyzed by Western blotting.
Electrophoretic mobility shift assay (EMSA)
EMSA analysis was performed using Buffer C nuclear extracts (10 g) from hESCs. The extracts
were incubated with poly dI-dC (Sigma) and 32P-end labeled oligonucleotides: OCT4, NANOG
and SOX2 binding sequence probes along with the complimentary primers. The protein-DNA
complexes were resolved by native polyacrylamide gel (4%) electrophoresis and the dried gels
were visualized using a PhosphorImager (Molecular Dynamics). Sequences of OCT4, NANOG
and SOX2 probes are listed in Table S4.
In vitro OCT4-DNA binding assay
OCT4 cDNA was cloned from the pSin-EF2-OCT4-Pur vector (Addgene) and inserted into the
PET-24a protein expression vector, which contains a C-terminal His Tag. OCT4 and HSP70
proteins were expressed in Rosetta cells and captured with the Talon metal affinity resin
(Clontech). The proteins were further purified using Resource Q and Superdex 200 columns (GE
Healthcare). OCT4 protein binding to the OCT4 response element (Supplemental Experimental
Procedures) was assessed by the use of EMSA analysis in the presence or absence of purified
HSP70 protein.
Statistical analysis
Statistical analyses were performed using Microsoft Excel. Student’s t-test was used to compare
two experimental groups, assuming unequal variances. Differences are considered significant
when p < 0.05.
SUPPLEMENTAL REFERENCES
Freeman, B.C., Myers, M.P., Schumacher, R., and Morimoto, R.I. (1995). Identification of a
Regulatory Motif in Hsp70 That Affects Atpase Activity, Substrate-Binding and Interaction with
Hdj-1. Embo J 14, 2281-2292.
Gerrard, L., Zhao, D., Clark, A.J., and Cui, W. (2005). Stably transfected human embryonic stem
cell clones express OCT4-specific green fluorescent protein and maintain self-renewal and
pluripotency. Stem Cells 23, 124-133.
Ludwig, T.E., Levenstein, M.E., Jones, J.M., Berggren, W.T., Mitchen, E.R., Frane, J.L., Crandall,
L.J., Daigh, C.A., Conard, K.R., Piekarczyk, M.S., et al. (2006). Derivation of human embryonic
stem cells in defined conditions. Nat Biotechnol 24, 185-187.
Thomson, J.A., Itskovitz-Eldor, J., Shapiro, S.S., Waknitz, M.A., Swiergiel, J.J., Marshall, V.S.,
and Jones, J.M. (1998). Embryonic stem cell lines derived from human blastocysts. In Science, pp.
1145-1147.