
Structure-Guided Design, Synthesis, and Evaluation of 1 ...
287
doi.org/10.26434/chemrxiv.13817243.v1 Structure-Guided Design, Synthesis, and Evaluation of 1-Indanone and 1,3-Indandione Derivatives as Ligands for Misfolded α-Synuclein Aggregates Xianwei Sun, Prasad Admane, Zbigniew A. Starosolski, Jason L Eriksen, Ananth V. Annapragada, Eric Tanifum Submitted date: 09/02/2021 • Posted date: 10/02/2021 Licence: CC BY-NC-ND 4.0 Citation information: Sun, Xianwei; Admane, Prasad; Starosolski, Zbigniew A.; L Eriksen, Jason; V. Annapragada, Ananth; Tanifum, Eric (2021): Structure-Guided Design, Synthesis, and Evaluation of 1-Indanone and 1,3-Indandione Derivatives as Ligands for Misfolded α-Synuclein Aggregates. ChemRxiv. Preprint. https://doi.org/10.26434/chemrxiv.13817243.v1 The development of imaging agents for in vivo detection of alpha-synuclein (α-syn) pathologies faces several challenges. A major gap in the field is the lack of diverse molecular scaffolds with high affinity and selectivity to α-syn fibrils for in vitro screening assays. Better in vitro scaffolds can instruct the discovery of better in vivo agents. We report the rational design, synthesis, and in vitro evaluation of a series of novel 1-indanone and 1,3-indandione derivatives from a Structure-Activity Relationship (SAR) study centered on some existing α-syn fibril binding ligands. Our results from fibril saturation binding experiments show that two of the lead candidates bind α-syn fibrils with binding constants (K d ) of 9.0 and 18.8 nM, respectively, and selectivity of greater than 10x for α-syn fibrils compared with amyloid-β (Aβ) fibrils. Our results demonstrate that the lead ligands avidly label all forms of α-syn on PD brain tissue sections, but only the dense core of senile plaques in AD brain tissue, respectively. These results are corroborated by ligand-antibody colocalization data from Syn211, which shows immunoreactivity towards all forms of α-syn aggregates, and Syn303, which displays preferential reactivity towards mature Lewy pathology. Our results reveal that 1-indanone derivatives have desirable properties for the biological evaluation of α-synucleinopathies. File list (2) download file view on ChemRxiv Manuscript.pdf (758.30 KiB) download file view on ChemRxiv Supporting Information.pdf (9.03 MiB)
Transcript of Structure-Guided Design, Synthesis, and Evaluation of 1 ...
doi.org/10.26434/chemrxiv.13817243.v1
Structure-Guided Design, Synthesis, and Evaluation of 1-Indanone and1,3-Indandione Derivatives as Ligands for Misfolded α-SynucleinAggregatesXianwei Sun, Prasad Admane, Zbigniew A. Starosolski, Jason L Eriksen, Ananth V. Annapragada, EricTanifum
Submitted date: 09/02/2021 • Posted date: 10/02/2021Licence: CC BY-NC-ND 4.0Citation information: Sun, Xianwei; Admane, Prasad; Starosolski, Zbigniew A.; L Eriksen, Jason; V.Annapragada, Ananth; Tanifum, Eric (2021): Structure-Guided Design, Synthesis, and Evaluation of1-Indanone and 1,3-Indandione Derivatives as Ligands for Misfolded α-Synuclein Aggregates. ChemRxiv.Preprint. https://doi.org/10.26434/chemrxiv.13817243.v1
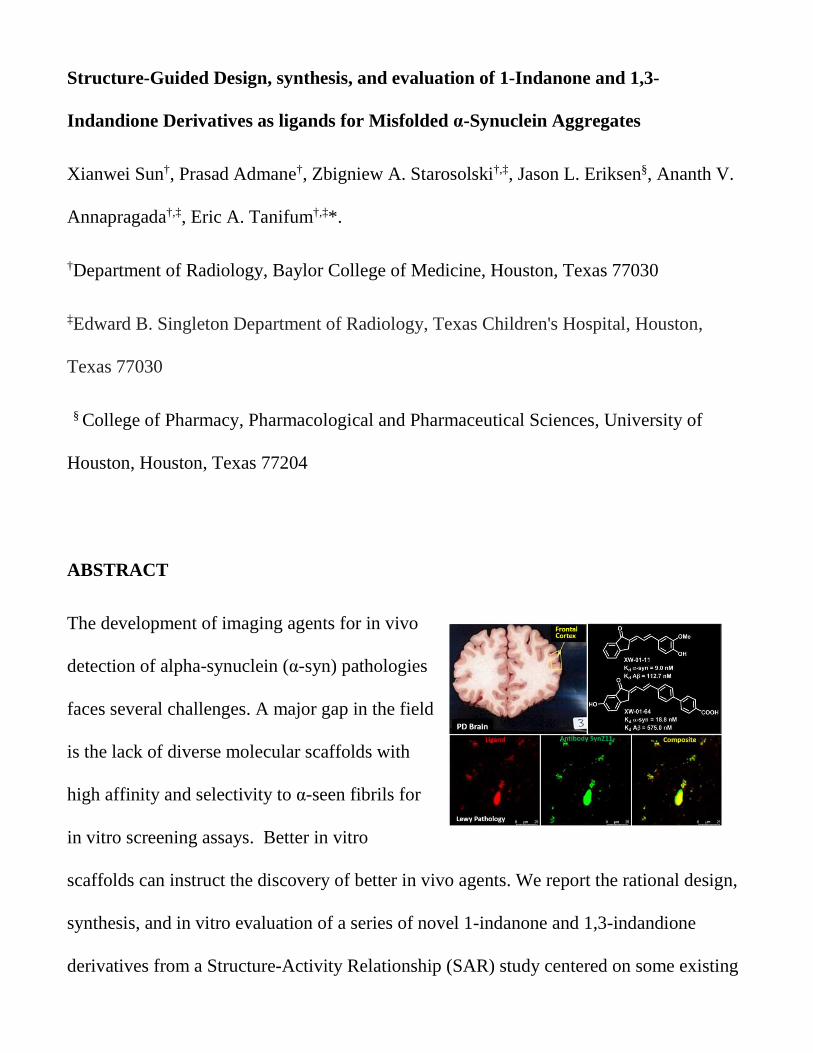
The development of imaging agents for in vivo detection of alpha-synuclein (α-syn) pathologies faces severalchallenges. A major gap in the field is the lack of diverse molecular scaffolds with high affinity and selectivity toα-syn fibrils for in vitro screening assays. Better in vitro scaffolds can instruct the discovery of better in vivoagents. We report the rational design, synthesis, and in vitro evaluation of a series of novel 1-indanone and1,3-indandione derivatives from a Structure-Activity Relationship (SAR) study centered on some existingα-syn fibril binding ligands. Our results from fibril saturation binding experiments show that two of the leadcandidates bind α-syn fibrils with binding constants (Kd) of 9.0 and 18.8 nM, respectively, and selectivity ofgreater than 10x for α-syn fibrils compared with amyloid-β (Aβ) fibrils. Our results demonstrate that the leadligands avidly label all forms of α-syn on PD brain tissue sections, but only the dense core of senile plaques inAD brain tissue, respectively. These results are corroborated by ligand-antibody colocalization data fromSyn211, which shows immunoreactivity towards all forms of α-syn aggregates, and Syn303, which displayspreferential reactivity towards mature Lewy pathology. Our results reveal that 1-indanone derivatives havedesirable properties for the biological evaluation of α-synucleinopathies.
File list (2)
download fileview on ChemRxivManuscript.pdf (758.30 KiB)
download fileview on ChemRxivSupporting Information.pdf (9.03 MiB)
Structure-Guided Design, synthesis, and evaluation of 1-Indanone and 1,3-
Indandione Derivatives as ligands for Misfolded α-Synuclein Aggregates
Xianwei Sun†, Prasad Admane†, Zbigniew A. Starosolski†,‡, Jason L. Eriksen§, Ananth V.
Annapragada†,‡, Eric A. Tanifum†,‡*.
†Department of Radiology, Baylor College of Medicine, Houston, Texas 77030
‡Edward B. Singleton Department of Radiology, Texas Children's Hospital, Houston,
Texas 77030
§ College of Pharmacy, Pharmacological and Pharmaceutical Sciences, University of
Houston, Houston, Texas 77204
ABSTRACT
The development of imaging agents for in vivo
detection of alpha-synuclein (α-syn) pathologies
faces several challenges. A major gap in the field
is the lack of diverse molecular scaffolds with
high affinity and selectivity to α-seen fibrils for
in vitro screening assays. Better in vitro
scaffolds can instruct the discovery of better in vivo agents. We report the rational design,
synthesis, and in vitro evaluation of a series of novel 1-indanone and 1,3-indandione
derivatives from a Structure-Activity Relationship (SAR) study centered on some existing
α-seen fibril binding ligands. Our results from fibril saturation binding experiments show
that two of the lead candidates bind α-seen fibrils with binding constants (Kd) of 9.0 and
18.8 nM, respectively, and selectivity of greater than 10x for α-seen fibrils compared with
amyloid-β (Aβ) fibrils. Our results demonstrate that the lead ligands avidly label all forms
of α-seen on PD brain tissue sections, but only the dense core of senile plaques in AD
brain tissue, respectively. These results are corroborated by ligand-antibody colocalization
data from Syn211, which shows immunoreactivity towards all forms of α-seen aggregates,
and Syn303, which displays preferential reactivity towards mature Lewy pathology. Our
results reveal that 1-indanone derivatives have desirable properties for the biological
evaluation of α-synucleinopathies.
1. Introduction
Pathological deposits of misfolded protein aggregates are a prominent characteristic
of neurodegenerative disorders such as Parkinson's disease (PD), Alzheimer's disease
(AD), and related dementias 1,2. PD is the second most common neurodegenerative disease
after AD and is characterized clinically by motor symptoms, including bradykinesia,
rigidity, tremor, and postural instability3. The development of motor symptoms has been
shown to correlate with degeneration of dopaminergic neurons in the substantia nigra,
accompanied by cytoplasmic deposition of Lewy pathology in the form of Lewy bodies
(LB) and Lewy neurites (LN). Lewy pathology is composed primarily of misfolded alpha-
synuclein (α-seen) aggregates. The regional distribution of α-seen in PD postmortem
studies suggests that this pathology originates from the olfactory bulb and the lower brain
stem and undergoes progressive spread to other areas of the CNS4,5. Empirical data also
shows abundant LBs and LNs in the medulla oblongata, pontine tegmentum, and anterior
olfactory bulb before the manifestation of PD-related motor symptoms6-8. Motor symptoms
appear at the intermediate stages of the disease, where the pathology has spread to the
substantia nigra and other foci within the basal portions of the mid- and forebrain6.
The correlation of Lewy pathology with nigrostriatal degeneration and motor
dysfunction4,9 in post mortem studies of PD patients suggests that technologies enabling
noninvasive detection and quantification of α-seen aggregates could be valuable for early
diagnosis and clinical evaluation of Lewy body disorders. Early detection can provide
better opportunities for the recruitment of patient cohorts for clinical trials, evaluation of
disease-modifying therapies, and validation of new drug candidates' therapeutic efficacy.
Some data indicate that as the disease progresses, some PD patients develop dementia,
which correlates with other protein aggregates' accumulation. For instance, a study focused
on PD patients who developed dementia revealed that apart from α-seen accumulation in
the neocortex, there was also was widespread Aβ accumulation in about 60% of the
patients, with 3% of cases showing tau accumulation in addition to α-seen and Aβ10.
Consequently, highly selective α-seen agents are desirable for an accurate diagnosis of PD.
The recent approval of several small-molecule Aβ positron emission tomography
(PET) imaging agents has dramatically improved the enrichment of cohorts for
Alzheimer's disease (AD) drug clinical trials11 and invigorated the search for similar agents
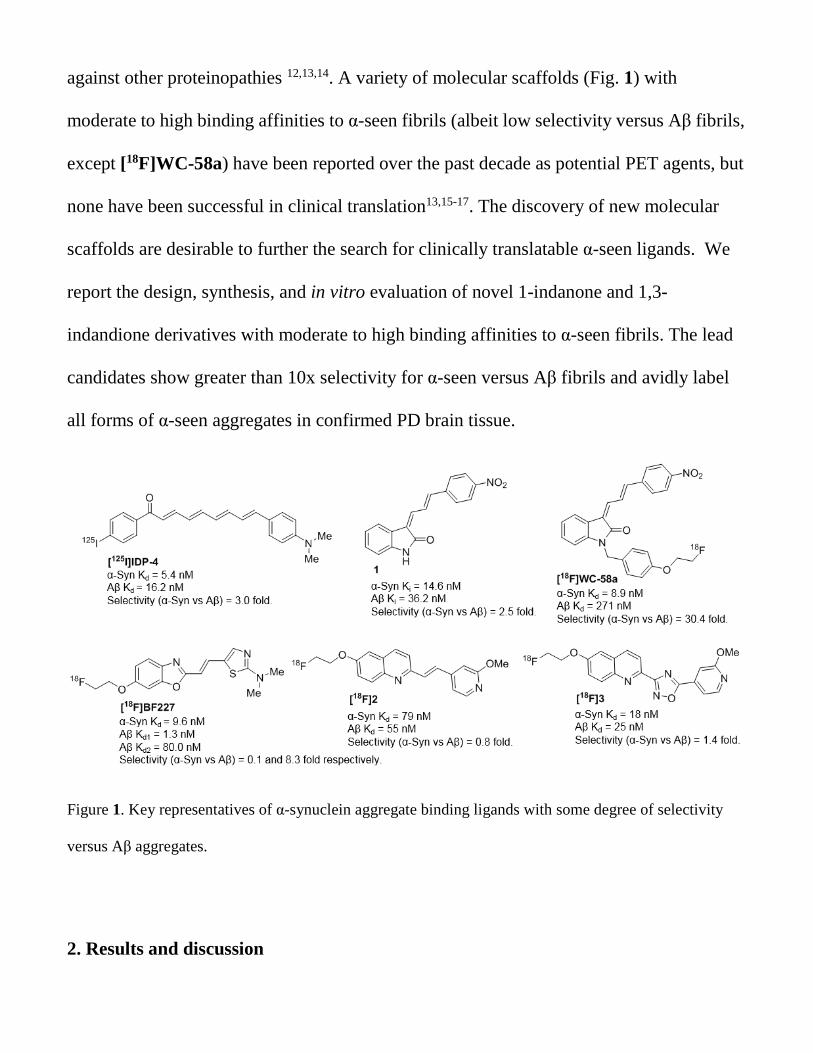
against other proteinopathies 12,13,14. A variety of molecular scaffolds (Fig. 1) with
moderate to high binding affinities to α-seen fibrils (albeit low selectivity versus Aβ fibrils,
except [18F]WC-58a) have been reported over the past decade as potential PET agents, but
none have been successful in clinical translation13,15-17. The discovery of new molecular
scaffolds are desirable to further the search for clinically translatable α-seen ligands. We
report the design, synthesis, and in vitro evaluation of novel 1-indanone and 1,3-
indandione derivatives with moderate to high binding affinities to α-seen fibrils. The lead
candidates show greater than 10x selectivity for α-seen versus Aβ fibrils and avidly label
all forms of α-seen aggregates in confirmed PD brain tissue.
Figure 1. Key representatives of α-synuclein aggregate binding ligands with some degree of selectivity
versus Aβ aggregates.
2. Results and discussion
2.1. Molecular design.
A common feature in reported α-seen ligands is two aromatic ring systems separated
by a spacer, which could be conjugated double bond(s) (compounds [125I]IDP-4 , 1,
[18F]WC-58a, [18F]BF227, and [18F]2), or a heterocycle ([18F]3). Structure-activity
relationship studies (SAR) around [125I]IDP-4 18, 1, and [18F]WC-58a19, respectively,
suggested that the number and configuration of the conjugated double bonds play a
significant role in both binding affinity and selectivity. For instance, in the indolinone
series (1 and [18F]WC-58a), indolinone-dienes displayed higher binding affinities for both
α-seen and Aβ fibrils over other indolinones19. Increase in steric bulk around compound 1
(α-Syn Ki = 14.6 nM and Aβ Ki = 36.2 nM) by replacing the N-H proton with a benzyl
group in [18F]WC-58a (α-Syn Kd = 8.9 nM and Aβ Kd = 271 nM) increased both binding
affinity and selectivity for α-seen versus Aβ. Despite its high binding affinity and highest
selectivity towards α-seen versus Aβ reported to date, the high log P value (4.18) of
[18F]WC-58a hampered further in vivo evaluation19. However, it provides a template for
further SAR-based searches for small molecule ligands with high affinity and selectivity
towards α-seen aggregates versus Aβ. Therefore, we chose compound 1 as a template for
SAR studies in search of new small molecule constructs with high binding affinity and
selectivity to α-seen aggregates.
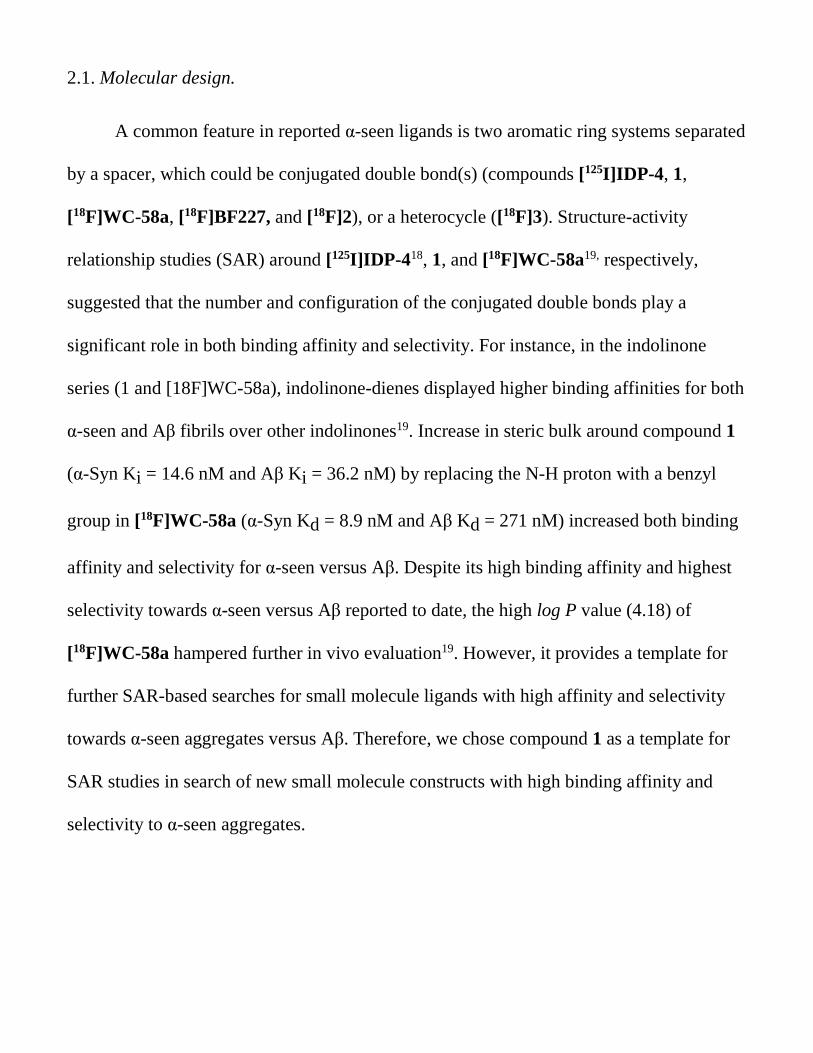
Figure 2. Molecular design of new α-synuclein ligands.
Our molecular design (Fig. 2) targeted all three parts of the molecule: the indolinone ring
(A), the diene bridge (B), and the second aromatic ring (C). Previous reports suggest that a
fused [6 + 5] ring system including 3- (benzylidene)-2-ones19, the benzoxazole
[18F]BF22720, the thiazole [11C]PBB321, and benzofuranones22, for the "A" ring system
may impart better affinity than a [6 + 6] ring system as observed with quinolines such as
[18F]2 and [18F]3. Furthermore, a α-carbonyl to the six-membered ring, as seen in the 3-
(benzylidene)-2-ones and [125I]IDP-4 , also appears to contribute to the binding affinity.
We, therefore, selected 1-indanone and 1,3-indandione as the starting points for new
derivatives. α-Tetralone and 4-Hydroxycoumarin-based scaffolds were also included to
verify further the observation that [6 + 5] ring systems are better binders than [6 + 6] ring
systems for this portion of the molecule. For the bridging system, we maintained the diene
in some derivatives, but also included derivatives in which one of the double bonds was
replaced with an electron-rich thiophene moiety (4) to increase the electron density were
also included. Derivatives with overall increased rigidity within the molecule were
introduced by "locking" the second double bond in two different ring systems (5 and 6).
Derivatization around ring "C" employed both electron-rich and electron-deficient
aromatic rings as well as heterocycles.
2.2. Chemical Synthesis.
As shown in Scheme 1, the first series of derivatives (Fig. 3) in which ring A is replaced
with either a 1-indanon- (equation i, to generate compounds 7 – 15), 1,3-indadion-
(equation ii , to generate compounds 16 – 22), α- teralonyl- (equation iii , to generate
compounds 23 – 24), or coumarin- (equation iv, to generate compounds 25-28) moieties,
while maintaining the diene bridge (B), were accessed by simple acid or base-catalyzed
aldol condensation reactions of the desired keto substrate with the corresponding
cinnamaldehyde derivatives. Early runs suggested that the monoketo substrates resulted in
cleaner reaction products and better yields under acidic conditions while the diketo
substrates preferred basic conditions. Therefore, subsequent reactions involving these
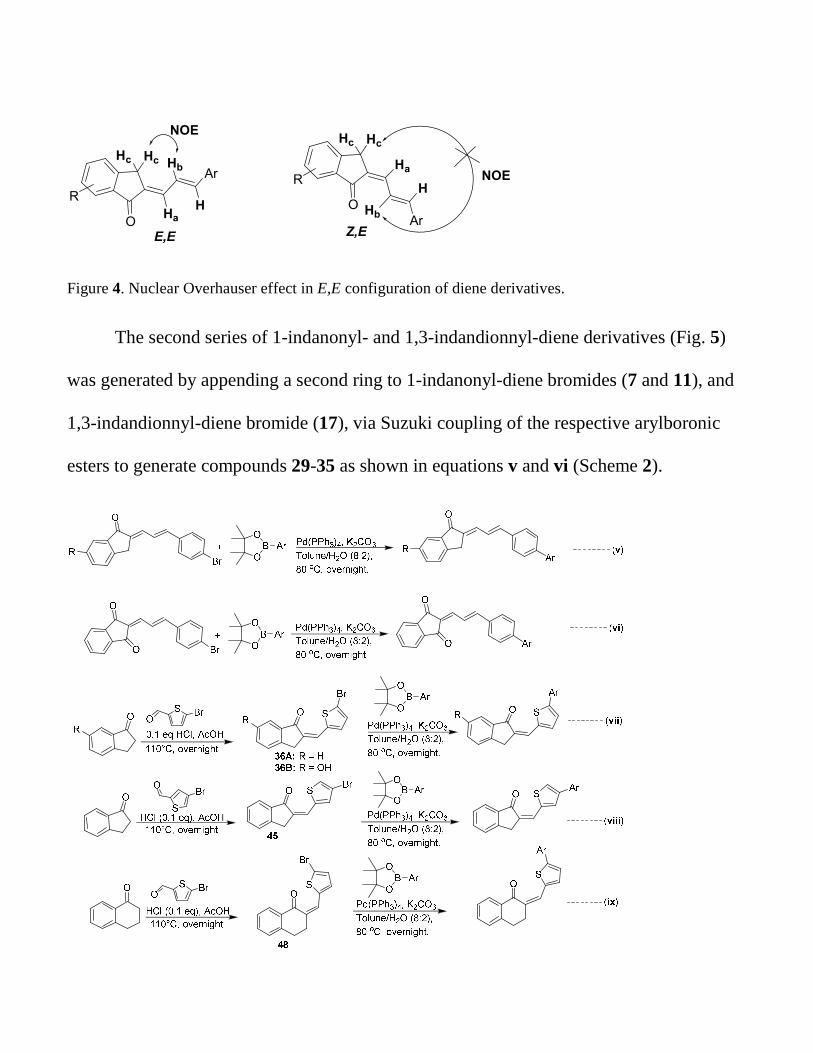
substrates were carried out under similar reaction conditions. Both 1H and 13C NMR
spectra of the resulting dienes showed peaks consistent with a single product, suggesting
that only one of the two possible isomers (E,E or Z,E), was formed. Further analyses of
their heteronuclear multiple bond connectivity (HMBC) and nuclear Overhauser effect
(NOE) spectra suggested that the isolated products had the E,E configuration due to NOE
enhancements observed between the highlighted protons (Fig. 4).
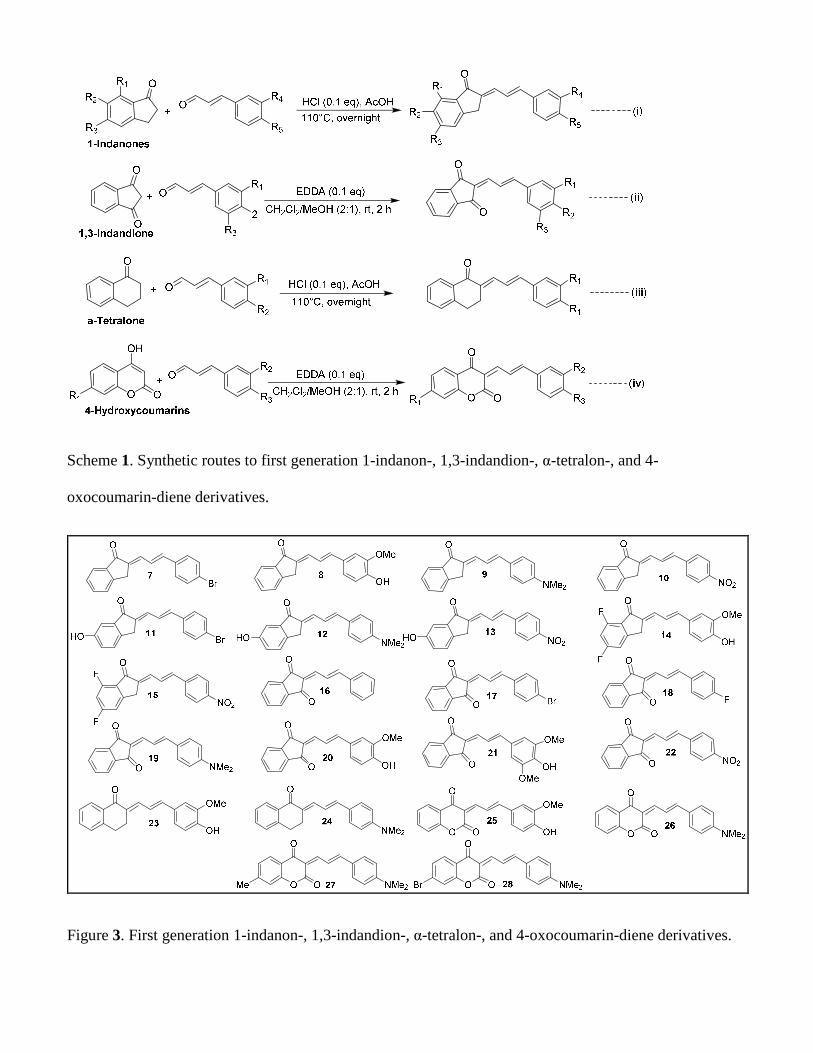
Scheme 1. Synthetic routes to first generation 1-indanon-, 1,3-indandion-, α-tetralon-, and 4-
oxocoumarin-diene derivatives.
Figure 3. First generation 1-indanon-, 1,3-indandion-, α-tetralon-, and 4-oxocoumarin-diene derivatives.
O
Ar
O
Ar
HcHc
HcHc
Ha
Hb
H
Ha
Hb
H
E,E Z,E
R
R
NOE
NOE
Figure 4. Nuclear Overhauser effect in E,E configuration of diene derivatives.
The second series of 1-indanonyl- and 1,3-indandionnyl-diene derivatives (Fig. 5)
was generated by appending a second ring to 1-indanonyl-diene bromides (7 and 11), and
1,3-indandionnyl-diene bromide (17), via Suzuki coupling of the respective arylboronic
esters to generate compounds 29-35 as shown in equations v and vi (Scheme 2).
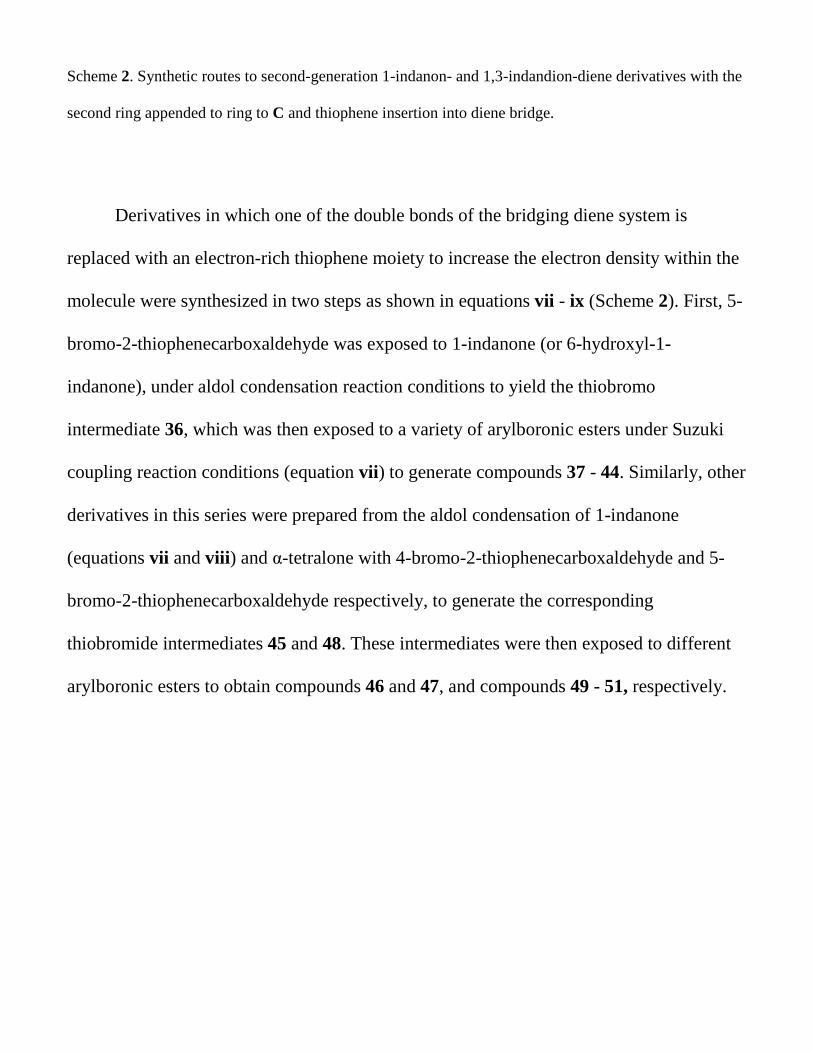
Scheme 2. Synthetic routes to second-generation 1-indanon- and 1,3-indandion-diene derivatives with the
second ring appended to ring to C and thiophene insertion into diene bridge.
Derivatives in which one of the double bonds of the bridging diene system is
replaced with an electron-rich thiophene moiety to increase the electron density within the
molecule were synthesized in two steps as shown in equations vii - ix (Scheme 2). First, 5-
bromo-2-thiophenecarboxaldehyde was exposed to 1-indanone (or 6-hydroxyl-1-
indanone), under aldol condensation reaction conditions to yield the thiobromo
intermediate 36, which was then exposed to a variety of arylboronic esters under Suzuki
coupling reaction conditions (equation vii ) to generate compounds 37 - 44. Similarly, other
derivatives in this series were prepared from the aldol condensation of 1-indanone
(equations vii and viii ) and α-tetralone with 4-bromo-2-thiophenecarboxaldehyde and 5-
bromo-2-thiophenecarboxaldehyde respectively, to generate the corresponding
thiobromide intermediates 45 and 48. These intermediates were then exposed to different
arylboronic esters to obtain compounds 46 and 47, and compounds 49 - 51, respectively.
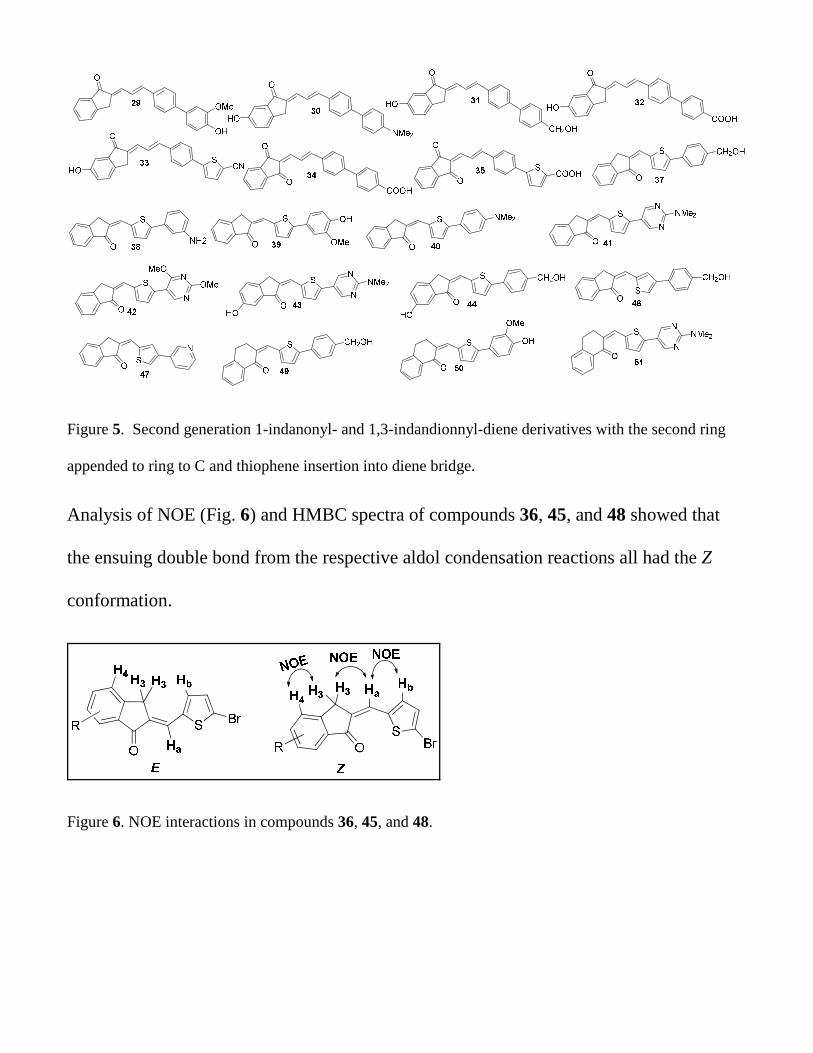
Figure 5. Second generation 1-indanonyl- and 1,3-indandionnyl-diene derivatives with the second ring
appended to ring to C and thiophene insertion into diene bridge.
Analysis of NOE (Fig. 6) and HMBC spectra of compounds 36, 45, and 48 showed that
the ensuing double bond from the respective aldol condensation reactions all had the Z
conformation.
Figure 6. NOE interactions in compounds 36, 45, and 48.
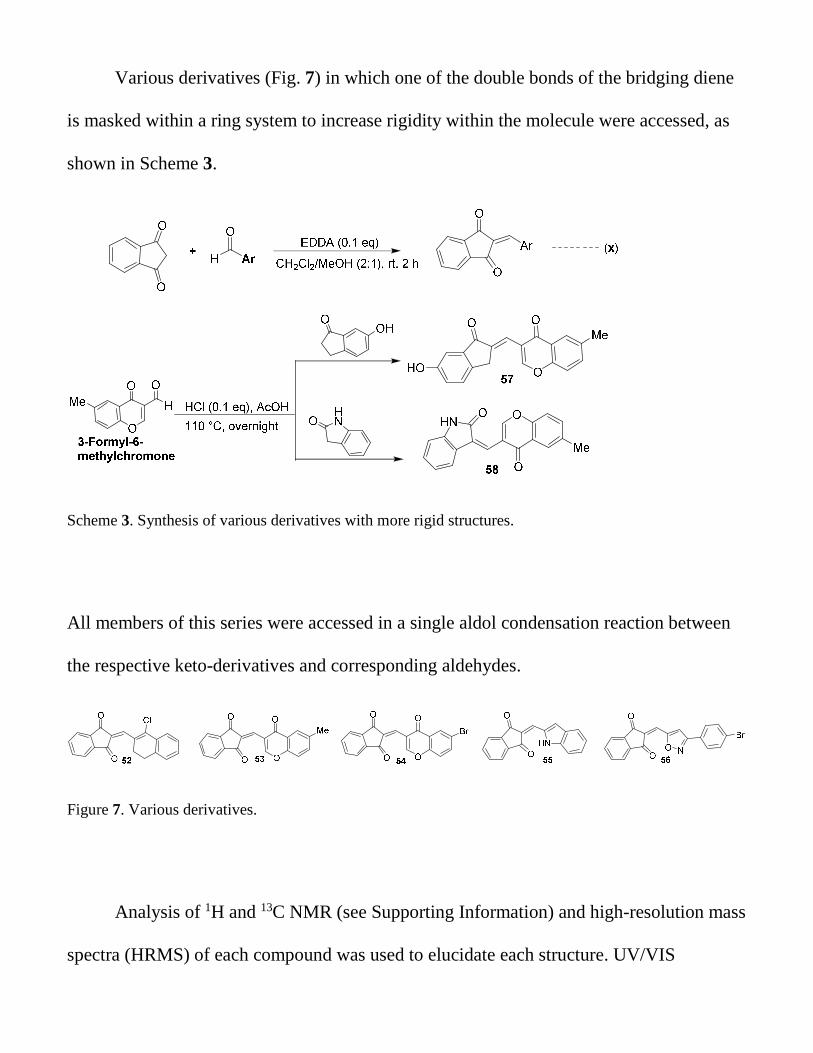
Various derivatives (Fig. 7) in which one of the double bonds of the bridging diene
is masked within a ring system to increase rigidity within the molecule were accessed, as
shown in Scheme 3.
Scheme 3. Synthesis of various derivatives with more rigid structures.
All members of this series were accessed in a single aldol condensation reaction between
the respective keto-derivatives and corresponding aldehydes.
Figure 7. Various derivatives.
Analysis of 1H and 13C NMR (see Supporting Information) and high-resolution mass
spectra (HRMS) of each compound was used to elucidate each structure. UV/VIS
absorption and emission spectra of all compounds were recorded in phosphate-buffered
saline (PBS), and those with fluorescence properties suitable for fluorescence microscopy
studies were further evaluated in synthetic fibril binding studies.
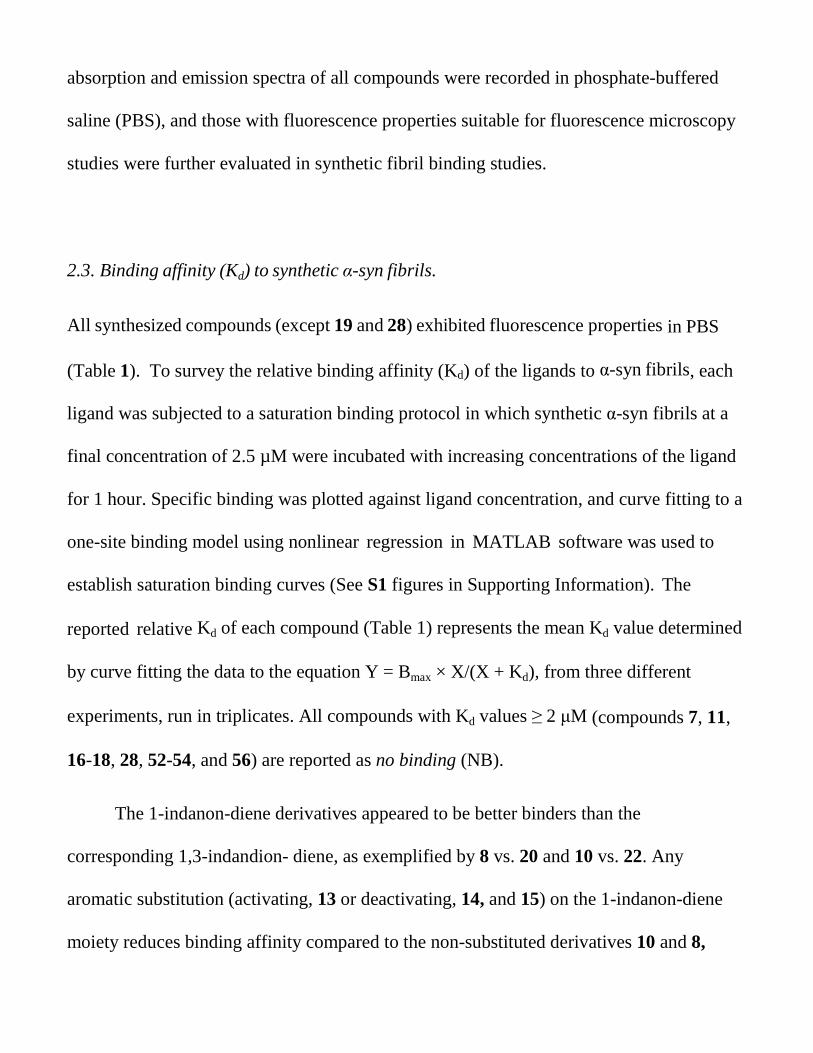
2.3. Binding affinity (Kd) to synthetic α-syn fibrils.
All synthesized compounds (except 19 and 28) exhibited fluorescence properties in PBS
(Table 1). To survey the relative binding affinity (Kd) of the ligands to α-syn fibrils, each
ligand was subjected to a saturation binding protocol in which synthetic α-syn fibrils at a
final concentration of 2.5 µM were incubated with increasing concentrations of the ligand
for 1 hour. Specific binding was plotted against ligand concentration, and curve fitting to a
one-site binding model using nonlinear regression in MATLAB software was used to
establish saturation binding curves (See S1 figures in Supporting Information). The
reported relative Kd of each compound (Table 1) represents the mean Kd value determined
by curve fitting the data to the equation Y = Bmax × X/(X + Kd), from three different
experiments, run in triplicates. All compounds with Kd values ≥ 2 µM (compounds 7, 11,
16-18, 28, 52-54, and 56) are reported as no binding (NB).
The 1-indanon-diene derivatives appeared to be better binders than the
corresponding 1,3-indandion- diene, as exemplified by 8 vs. 20 and 10 vs. 22. Any
aromatic substitution (activating, 13 or deactivating, 14, and 15) on the 1-indanon-diene
moiety reduces binding affinity compared to the non-substituted derivatives 10 and 8,
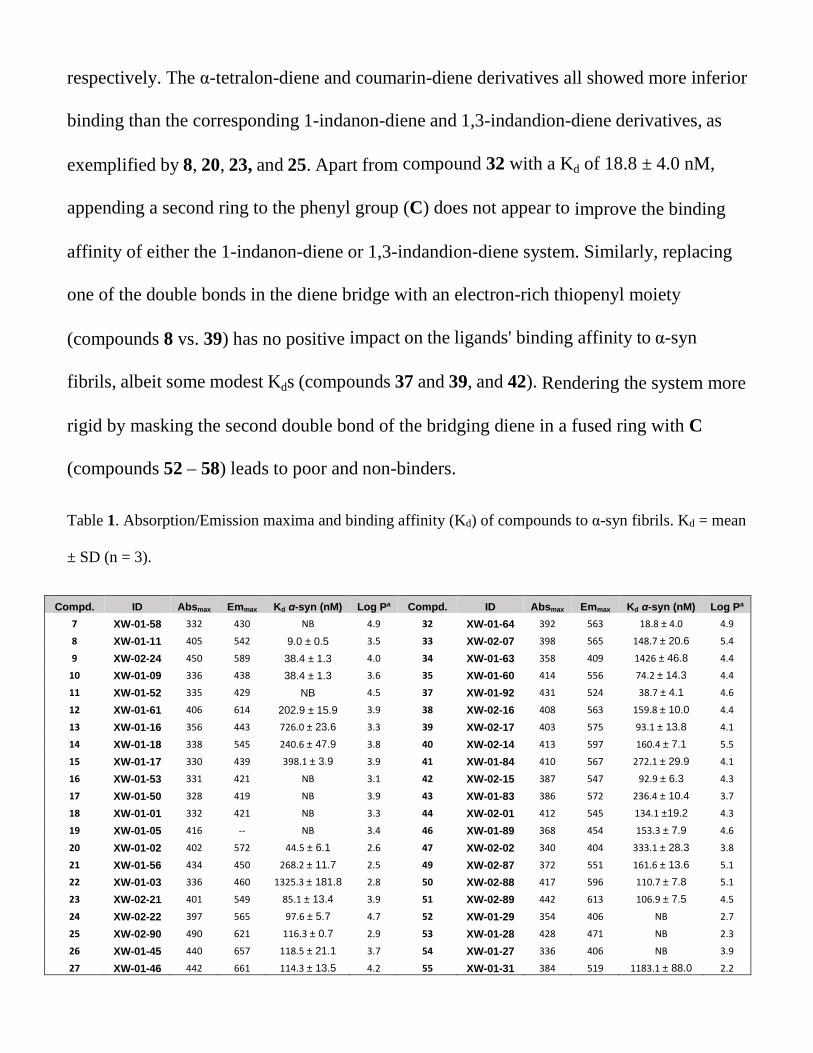
respectively. The α-tetralon-diene and coumarin-diene derivatives all showed more inferior
binding than the corresponding 1-indanon-diene and 1,3-indandion-diene derivatives, as
exemplified by 8, 20, 23, and 25. Apart from compound 32 with a Kd of 18.8 ± 4.0 nM,
appending a second ring to the phenyl group (C) does not appear to improve the binding
affinity of either the 1-indanon-diene or 1,3-indandion-diene system. Similarly, replacing
one of the double bonds in the diene bridge with an electron-rich thiopenyl moiety
(compounds 8 vs. 39) has no positive impact on the ligands' binding affinity to α-syn
fibrils, albeit some modest Kds (compounds 37 and 39, and 42). Rendering the system more
rigid by masking the second double bond of the bridging diene in a fused ring with C
(compounds 52 – 58) leads to poor and non-binders.
Table 1. Absorption/Emission maxima and binding affinity (Kd) of compounds to α-syn fibrils. Kd = mean
± SD (n = 3).
Compd. ID Absmax Emmax Kd α-syn (nM) Log Pa Compd. ID Absmax Emmax Kd α-syn (nM) Log Pa
7 XW-01-58 332 430 NB 4.9 32 XW-01-64 392 563 18.8 ± 4.0 4.9
8 XW-01-11 405 542 9.0 ± 0.5 3.5 33 XW-02-07 398 565 148.7 ± 20.6 5.4
9 XW-02-24 450 589 38.4 ± 1.3 4.0 34 XW-01-63 358 409 1426 ± 46.8 4.4
10 XW-01-09 336 438 38.4 ± 1.3 3.6 35 XW-01-60 414 556 74.2 ± 14.3 4.4
11 XW-01-52 335 429 NB 4.5 37 XW-01-92 431 524 38.7 ± 4.1 4.6
12 XW-01-61 406 614 202.9 ± 15.9 3.9 38 XW-02-16 408 563 159.8 ± 10.0 4.4
13 XW-01-16 356 443 726.0 ± 23.6 3.3 39 XW-02-17 403 575 93.1 ± 13.8 4.1
14 XW-01-18 338 545 240.6 ± 47.9 3.8 40 XW-02-14 413 597 160.4 ± 7.1 5.5
15 XW-01-17 330 439 398.1 ± 3.9 3.9 41 XW-01-84 410 567 272.1 ± 29.9 4.1
16 XW-01-53 331 421 NB 3.1 42 XW-02-15 387 547 92.9 ± 6.3 4.3
17 XW-01-50 328 419 NB 3.9 43 XW-01-83 386 572 236.4 ± 10.4 3.7
18 XW-01-01 332 421 NB 3.3 44 XW-02-01 412 545 134.1 ±19.2 4.3
19 XW-01-05 416 -- NB 3.4 46 XW-01-89 368 454 153.3 ± 7.9 4.6
20 XW-01-02 402 572 44.5 ± 6.1 2.6 47 XW-02-02 340 404 333.1 ± 28.3 3.8
21 XW-01-56 434 450 268.2 ± 11.7 2.5 49 XW-02-87 372 551 161.6 ± 13.6 5.1
22 XW-01-03 336 460 1325.3 ± 181.8 2.8 50 XW-02-88 417 596 110.7 ± 7.8 5.1
23 XW-02-21 401 549 85.1 ± 13.4 3.9 51 XW-02-89 442 613 106.9 ± 7.5 4.5
24 XW-02-22 397 565 97.6 ± 5.7 4.7 52 XW-01-29 354 406 NB 2.7
25 XW-02-90 490 621 116.3 ± 0.7 2.9 53 XW-01-28 428 471 NB 2.3
26 XW-01-45 440 657 118.5 ± 21.1 3.7 54 XW-01-27 336 406 NB 3.9
27 XW-01-46 442 661 114.3 ± 13.5 4.2 55 XW-01-31 384 519 1183.1 ± 88.0 2.2
28 XW-01-47 405 -- NB 4.5 56 XW-01-91 321 409 NB 3.8
39 XW-02-20 397 551 66.7 ± 2.0 5.2 57 XW-01-33 326 388 655.6 ± 88.0 2.8
30 XW-02-13 414 597 236.3 ± 10.5 5.6 58 XW-01-38 344 385 1685.3 ± 252.0 2.4
31 XW-01-87 368 540 125.5 ± 5.0 4.7
aObtained from ChemBioDraw Professional 16.
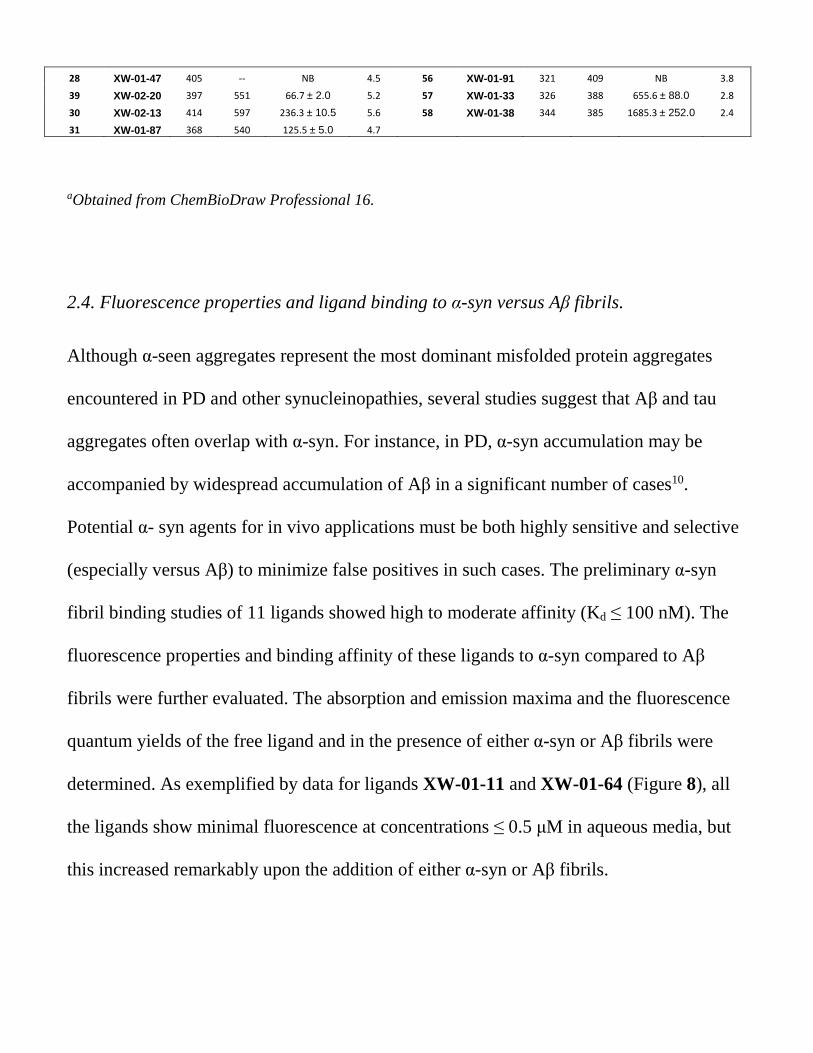
2.4. Fluorescence properties and ligand binding to α-syn versus Aβ fibrils.
Although α-seen aggregates represent the most dominant misfolded protein aggregates
encountered in PD and other synucleinopathies, several studies suggest that Aβ and tau
aggregates often overlap with α-syn. For instance, in PD, α-syn accumulation may be
accompanied by widespread accumulation of Aβ in a significant number of cases10.
Potential α- syn agents for in vivo applications must be both highly sensitive and selective
(especially versus Aβ) to minimize false positives in such cases. The preliminary α-syn
fibril binding studies of 11 ligands showed high to moderate affinity (Kd ≤ 100 nM). The
fluorescence properties and binding affinity of these ligands to α-syn compared to Aβ
fibrils were further evaluated. The absorption and emission maxima and the fluorescence
quantum yields of the free ligand and in the presence of either α-syn or Aβ fibrils were
determined. As exemplified by data for ligands XW-01-11 and XW-01-64 (Figure 8), all
the ligands show minimal fluorescence at concentrations ≤ 0.5 µM in aqueous media, but
this increased remarkably upon the addition of either α-syn or Aβ fibrils.
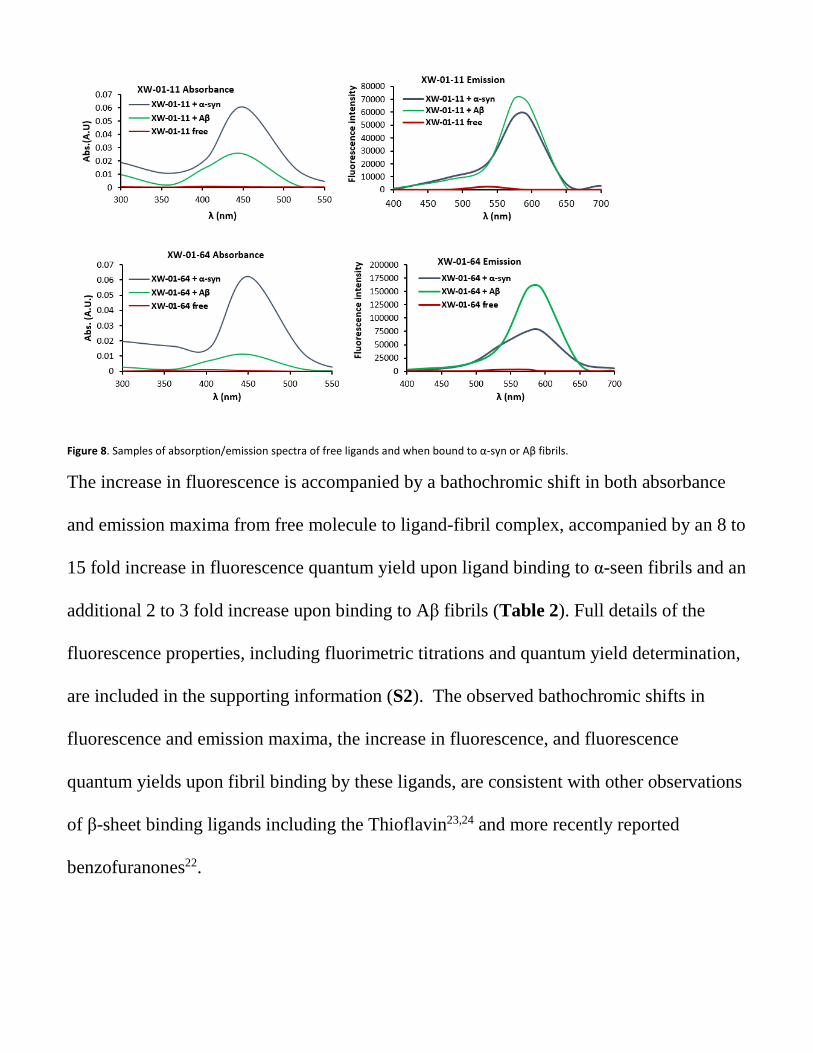
Figure 8. Samples of absorption/emission spectra of free ligands and when bound to α-syn or Aβ fibrils.
The increase in fluorescence is accompanied by a bathochromic shift in both absorbance
and emission maxima from free molecule to ligand-fibril complex, accompanied by an 8 to
15 fold increase in fluorescence quantum yield upon ligand binding to α-seen fibrils and an
additional 2 to 3 fold increase upon binding to Aβ fibrils (Table 2). Full details of the
fluorescence properties, including fluorimetric titrations and quantum yield determination,
are included in the supporting information (S2). The observed bathochromic shifts in
fluorescence and emission maxima, the increase in fluorescence, and fluorescence
quantum yields upon fibril binding by these ligands, are consistent with other observations
of β-sheet binding ligands including the Thioflavin23,24 and more recently reported
benzofuranones22.
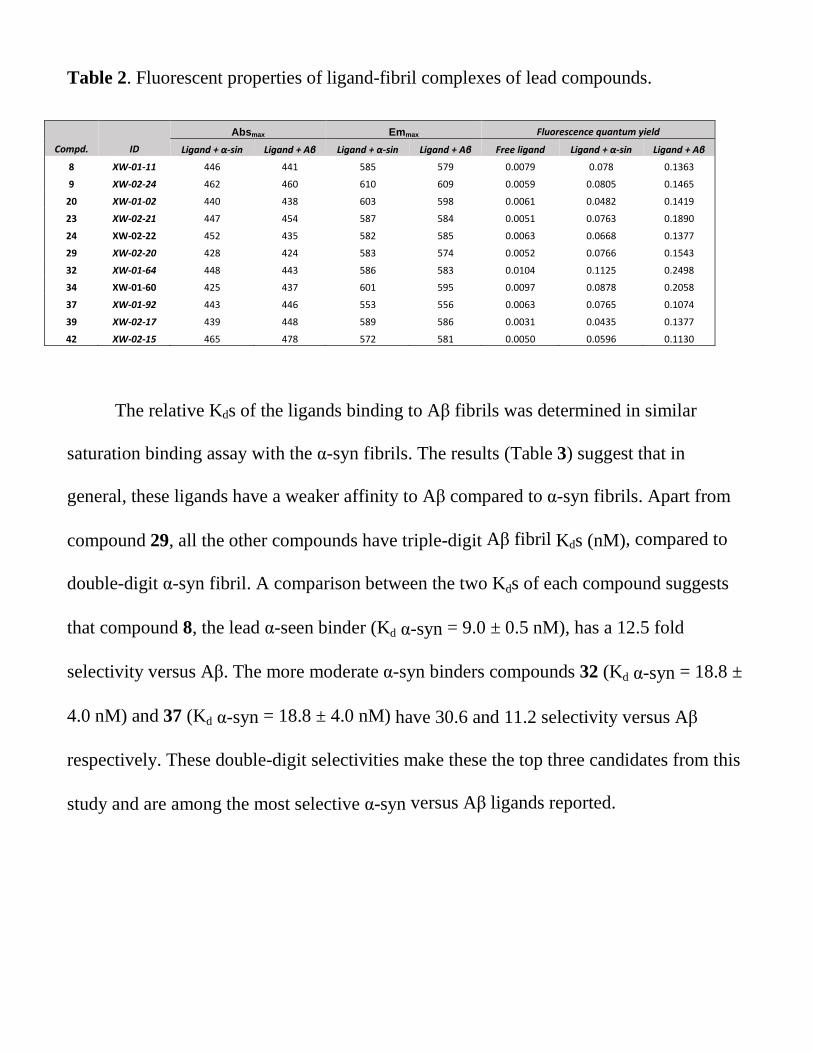
Table 2. Fluorescent properties of ligand-fibril complexes of lead compounds.
Compd.
ID
Absmax Emmax Fluorescence quantum yield
Ligand + α-sin Ligand + Aβ Ligand + α-sin Ligand + Aβ Free ligand Ligand + α-sin Ligand + Aβ
8 XW-01-11 446 441 585 579 0.0079 0.078 0.1363
9 XW-02-24 462 460 610 609 0.0059 0.0805 0.1465
20 XW-01-02 440 438 603 598 0.0061 0.0482 0.1419
23 XW-02-21 447 454 587 584 0.0051 0.0763 0.1890
24 XW-02-22 452 435 582 585 0.0063 0.0668 0.1377
29 XW-02-20 428 424 583 574 0.0052 0.0766 0.1543
32 XW-01-64 448 443 586 583 0.0104 0.1125 0.2498
34 XW-01-60 425 437 601 595 0.0097 0.0878 0.2058
37 XW-01-92 443 446 553 556 0.0063 0.0765 0.1074
39 XW-02-17 439 448 589 586 0.0031 0.0435 0.1377
42 XW-02-15 465 478 572 581 0.0050 0.0596 0.1130
The relative Kds of the ligands binding to Aβ fibrils was determined in similar
saturation binding assay with the α-syn fibrils. The results (Table 3) suggest that in
general, these ligands have a weaker affinity to Aβ compared to α-syn fibrils. Apart from
compound 29, all the other compounds have triple-digit Aβ fibril Kds (nM), compared to
double-digit α-syn fibril. A comparison between the two Kds of each compound suggests
that compound 8, the lead α-seen binder (Kd α-syn = 9.0 ± 0.5 nM), has a 12.5 fold
selectivity versus Aβ. The more moderate α-syn binders compounds 32 (Kd α-syn = 18.8 ±
4.0 nM) and 37 (Kd α-syn = 18.8 ± 4.0 nM) have 30.6 and 11.2 selectivity versus Aβ
respectively. These double-digit selectivities make these the top three candidates from this
study and are among the most selective α-syn versus Aβ ligands reported.
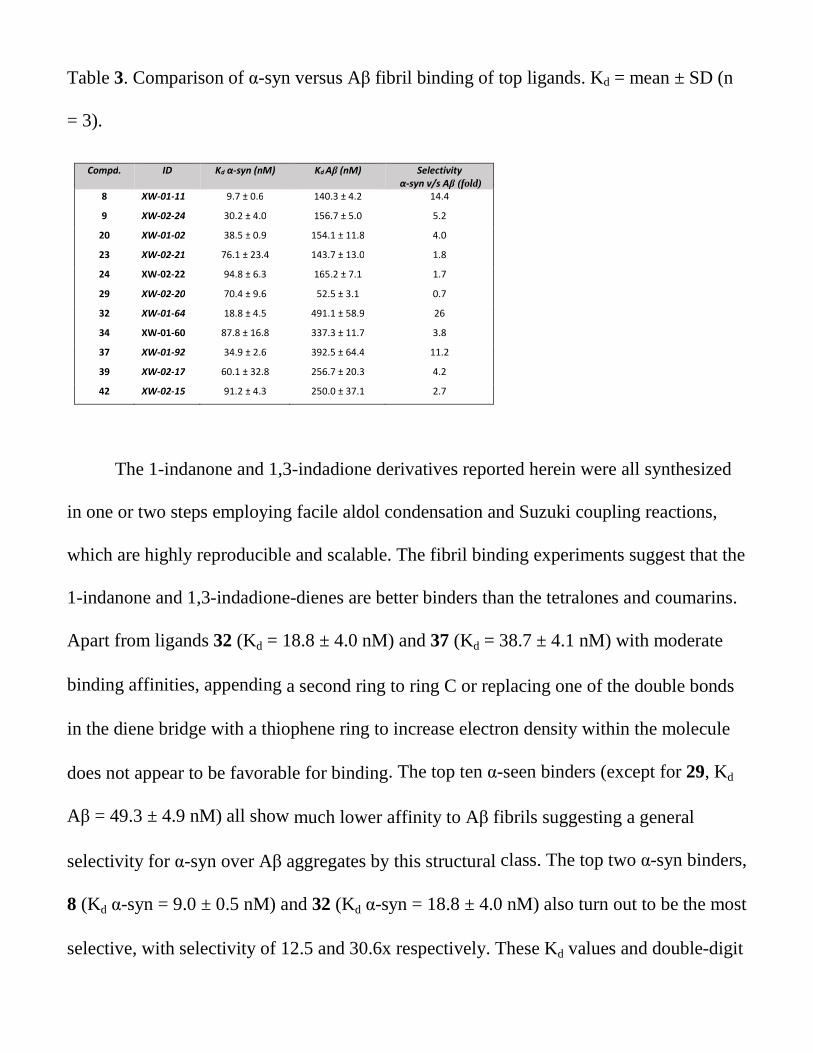
Table 3. Comparison of α-syn versus Aβ fibril binding of top ligands. Kd = mean ± SD (n
= 3).
Compd. ID Kd α-syn (nM) Kd Aβ (nM) Selectivity
α-syn v/s Aβ (fold) 8 XW-01-11 9.7 ± 0.6 140.3 ± 4.2 14.4
9 XW-02-24 30.2 ± 4.0 156.7 ± 5.0 5.2
20 XW-01-02 38.5 ± 0.9 154.1 ± 11.8 4.0
23 XW-02-21 76.1 ± 23.4 143.7 ± 13.0 1.8
24 XW-02-22 94.8 ± 6.3 165.2 ± 7.1 1.7
29 XW-02-20 70.4 ± 9.6 52.5 ± 3.1 0.7
32 XW-01-64 18.8 ± 4.5 491.1 ± 58.9 26
34 XW-01-60 87.8 ± 16.8 337.3 ± 11.7 3.8
37 XW-01-92 34.9 ± 2.6 392.5 ± 64.4 11.2
39 XW-02-17 60.1 ± 32.8 256.7 ± 20.3 4.2
42 XW-02-15 91.2 ± 4.3 250.0 ± 37.1 2.7
The 1-indanone and 1,3-indadione derivatives reported herein were all synthesized
in one or two steps employing facile aldol condensation and Suzuki coupling reactions,
which are highly reproducible and scalable. The fibril binding experiments suggest that the
1-indanone and 1,3-indadione-dienes are better binders than the tetralones and coumarins.
Apart from ligands 32 (Kd = 18.8 ± 4.0 nM) and 37 (Kd = 38.7 ± 4.1 nM) with moderate
binding affinities, appending a second ring to ring C or replacing one of the double bonds
in the diene bridge with a thiophene ring to increase electron density within the molecule
does not appear to be favorable for binding. The top ten α-seen binders (except for 29, Kd
Aβ = 49.3 ± 4.9 nM) all show much lower affinity to Aβ fibrils suggesting a general
selectivity for α-syn over Aβ aggregates by this structural class. The top two α-syn binders,
8 (Kd α-syn = 9.0 ± 0.5 nM) and 32 (Kd α-syn = 18.8 ± 4.0 nM) also turn out to be the most
selective, with selectivity of 12.5 and 30.6x respectively. These Kd values and double-digit
selectivities are comparable to those of one of the highest binding and selective α-syn
ligand [18F]WC-58a (Kd α-syn = 8.9 nM and Kd Aβ = 271)19, reported to date from fibril
saturation binding assays. Taken together, our binding data, in combination with the
recently reported benzofuranones22, suggest that the [6+5] bicyclic ring system, A (Fig. 2),
is more favorable for binding and selectivity than a [6+6] system. As previously reported,
the diene bridge, B (Fig. 2) separating the two ring systems (A and C), appears essential.
An increase in the system's electron density by replacing one of the double bonds with a
thiophene ring does not appear to have any significant favorable impact on binding affinity
or selectivity.
2.5. Fluorescent human PD and AD tissue staining.
The three lead ligands were further evaluated by in vitro fluorescent staining of
neuropathologically verified postmortem brain samples from PD and AD cases. Two
different anti-α-syn antibodies, Syn21125, and Syn30326, were employed to highlight
misfolded α-syn aggregates in PD brain sections while the anti-Aβ antibody, 4G8, was
used to highlight Aβ aggregates in the AD brain sections. The decision to use two different
anti- α-syn antibodies is vital because while they both label misfolded α-syn aggregates,
Syn211 is known to label all forms of aggregates including LBs and LNs as well as small
thread and dot neurites (suggested to be markers of the very early stages of the disease),
meanwhile Syn303 is more sensitive to mature LBs and LNs26. Sections from the PD
brain's frontal-cortex were permeabilized and treated sequentially with antibody Syn211
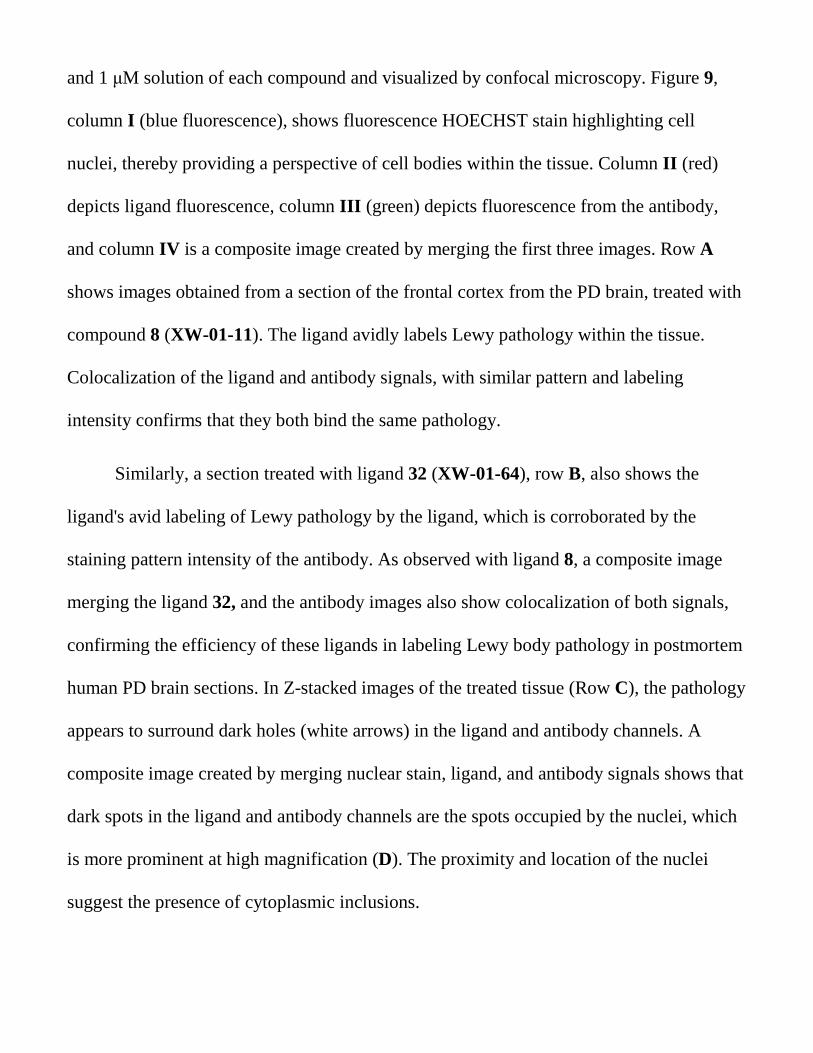
and 1 µM solution of each compound and visualized by confocal microscopy. Figure 9,
column I (blue fluorescence), shows fluorescence HOECHST stain highlighting cell
nuclei, thereby providing a perspective of cell bodies within the tissue. Column II (red)
depicts ligand fluorescence, column III (green) depicts fluorescence from the antibody,
and column IV is a composite image created by merging the first three images. Row A
shows images obtained from a section of the frontal cortex from the PD brain, treated with
compound 8 (XW-01-11). The ligand avidly labels Lewy pathology within the tissue.
Colocalization of the ligand and antibody signals, with similar pattern and labeling
intensity confirms that they both bind the same pathology.
Similarly, a section treated with ligand 32 (XW-01-64), row B, also shows the
ligand's avid labeling of Lewy pathology by the ligand, which is corroborated by the
staining pattern intensity of the antibody. As observed with ligand 8, a composite image
merging the ligand 32, and the antibody images also show colocalization of both signals,
confirming the efficiency of these ligands in labeling Lewy body pathology in postmortem
human PD brain sections. In Z-stacked images of the treated tissue (Row C), the pathology
appears to surround dark holes (white arrows) in the ligand and antibody channels. A
composite image created by merging nuclear stain, ligand, and antibody signals shows that
dark spots in the ligand and antibody channels are the spots occupied by the nuclei, which
is more prominent at high magnification (D). The proximity and location of the nuclei
suggest the presence of cytoplasmic inclusions.
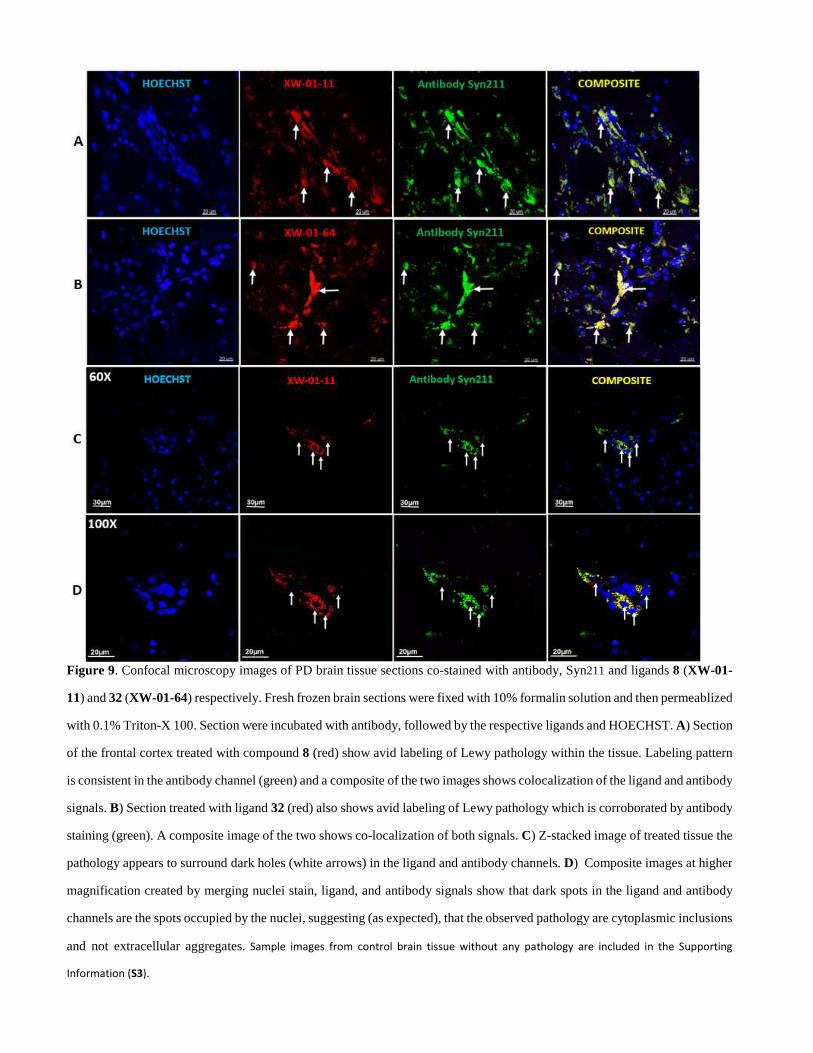
Figure 9. Confocal microscopy images of PD brain tissue sections co-stained with antibody, Syn211 and ligands 8 (XW-01-
11) and 32 (XW-01-64) respectively. Fresh frozen brain sections were fixed with 10% formalin solution and then permeablized
with 0.1% Triton-X 100. Section were incubated with antibody, followed by the respective ligands and HOECHST. A) Section
of the frontal cortex treated with compound 8 (red) show avid labeling of Lewy pathology within the tissue. Labeling pattern
is consistent in the antibody channel (green) and a composite of the two images shows colocalization of the ligand and antibody
signals. B) Section treated with ligand 32 (red) also shows avid labeling of Lewy pathology which is corroborated by antibody
staining (green). A composite image of the two shows co-localization of both signals. C) Z-stacked image of treated tissue the
pathology appears to surround dark holes (white arrows) in the ligand and antibody channels. D) Composite images at higher
magnification created by merging nuclei stain, ligand, and antibody signals show that dark spots in the ligand and antibody
channels are the spots occupied by the nuclei, suggesting (as expected), that the observed pathology are cytoplasmic inclusions
and not extracellular aggregates. Sample images from control brain tissue without any pathology are included in the Supporting
Information (S3).
Figure 10. Confocal microscopy studies on contiguous PD brain sections show that ligands bind all conformations of α-seen aggregates
including early stage small dot and thread neurites as well as mature Lewy bodies as exemplified by XW-01-11. A) Confocal microscopy
images of PD brain section treated with ligand and antibody Syn211 which labels all forms of α-seen aggregates shows labeling of both
early stage (white arrows) and mature Lewy pathology (blue arrow) in the ligand channel. B) Fluorescence due to antibody Syn211 staining
shows a similar to ligand channel. C) Composite image from the ligand and Syn211 fluorescence shows colocalization of the two signals
from both early stage and mature Lewy pathology. D) PD brain section treated with ligand and antibody Syn303 (which preferentially labels
mature Lewy pathology) shows all forms of α-seen aggregates in the ligand channel. E) Fluorescence due to antibody Syn303 staining
shows only the mature Lewy body. F) Composite image from the ligand and Syn303 fluorescence shows colocalization of the two signals
only for the mature Lewy body.
To further characterize the sites labeled by labeled by the ligands and antibody
Syn211 tissue staining experiments, were indeed α-seen, contiguous cortical section were
treated with the lead ligand, and then either Syn211 or Syn303. As expected, the sections
treated with the ligand and Syn211 (Fig. 10, first row) show identical ligand and antibody
labeling patterns that colocalize in the composite image. Both the ligand and antibody
appear to label all forms of pathology present on the tissue. On the other hand, tissue
sections treated with the ligand and antibody Syn303 (Fig. 10, second row) show effective
labeling of both small neurites (white arrows) in the ligand channel but only mature Lewy
bodies in the antibody channel (blue arrow). These findings suggest that the labeled
pathology is α-syn and that the ligand labels all conformations of the pathology.
To assess the observed selectivity in α-seen versus Aβ fibril binding on aggregates
on human tissue, equimolar concentrations of the top three lead candidates were further
evaluated on PD tissue and cortical sections from neuropathologically-verified postmortem
brain samples of AD cases. Figure 11 shows data from the top binder (8), demonstrating a
12.5-fold selectivity for α-seen vs. Aβ. As can be observed in Row A, the PD tissue shows
the avid labeling of both large and fine pathology (column II ). A similar labeling pattern
and efficiency are also observed in the antibody channel (column III ) and a composite
image generated by merging both signals with the HOECHST signal (column IV ) shows
colocalization of the ligand and antibody signals. Unlike the PD tissue, fluorescent images
from the AD tissue (Row B) show mostly dense core Aβ plaques in the ligand channel
(column II ) but not the finer aggregates composed of diffuse plaques. Amyloid pathology
was clearly labeled by the 4G8 antibody (column III ). A composite image generated by
merging both signals with the HOECHST channel demonstrated an overlap of the ligand
and 4G8 (column IV ). High magnification images from the treated AD tissue (Row C)
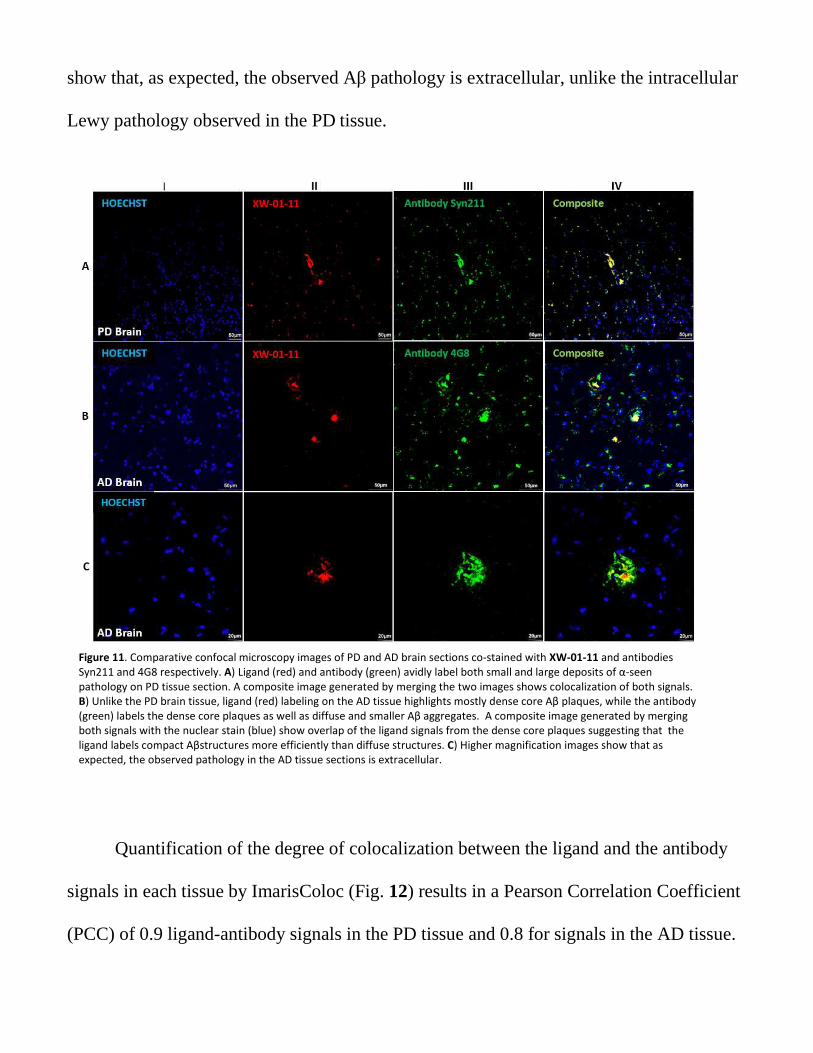
show that, as expected, the observed Aβ pathology is extracellular, unlike the intracellular
Lewy pathology observed in the PD tissue.
Quantification of the degree of colocalization between the ligand and the antibody
signals in each tissue by ImarisColoc (Fig. 12) results in a Pearson Correlation Coefficient
(PCC) of 0.9 ligand-antibody signals in the PD tissue and 0.8 for signals in the AD tissue.
Figure 11. Comparative confocal microscopy images of PD and AD brain sections co-stained with XW-01-11 and antibodies
Syn211 and 4G8 respectively. A) Ligand (red) and antibody (green) avidly label both small and large deposits of α-seen
pathology on PD tissue section. A composite image generated by merging the two images shows colocalization of both signals.
B) Unlike the PD brain tissue, ligand (red) labeling on the AD tissue highlights mostly dense core Aβ plaques, while the antibody
(green) labels the dense core plaques as well as diffuse and smaller Aβ aggregates. A composite image generated by merging
both signals with the nuclear stain (blue) show overlap of the ligand signals from the dense core plaques suggesting that the
ligand labels compact Aβstructures more efficiently than diffuse structures. C) Higher magnification images show that as
expected, the observed pathology in the AD tissue sections is extracellular.
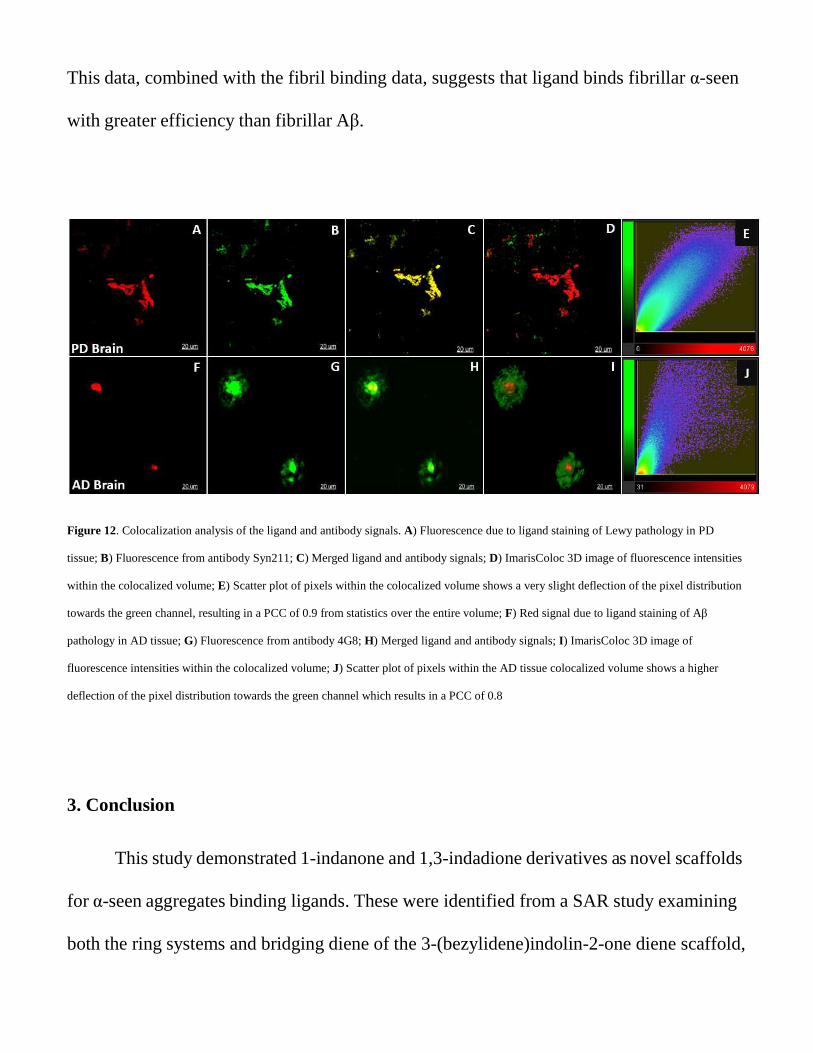
This data, combined with the fibril binding data, suggests that ligand binds fibrillar α-seen
with greater efficiency than fibrillar Aβ.
Figure 12. Colocalization analysis of the ligand and antibody signals. A) Fluorescence due to ligand staining of Lewy pathology in PD
tissue; B) Fluorescence from antibody Syn211; C) Merged ligand and antibody signals; D) ImarisColoc 3D image of fluorescence intensities
within the colocalized volume; E) Scatter plot of pixels within the colocalized volume shows a very slight deflection of the pixel distribution
towards the green channel, resulting in a PCC of 0.9 from statistics over the entire volume; F) Red signal due to ligand staining of Aβ
pathology in AD tissue; G) Fluorescence from antibody 4G8; H) Merged ligand and antibody signals; I ) ImarisColoc 3D image of
fluorescence intensities within the colocalized volume; J) Scatter plot of pixels within the AD tissue colocalized volume shows a higher
deflection of the pixel distribution towards the green channel which results in a PCC of 0.8
3. Conclusion
This study demonstrated 1-indanone and 1,3-indadione derivatives as novel scaffolds
for α-seen aggregates binding ligands. These were identified from a SAR study examining
both the ring systems and bridging diene of the 3-(bezylidene)indolin-2-one diene scaffold,
the source of the most potent and selective α-syn ligands reported to date. All compounds
were readily accessed via simple and readily scalable chemistries, and a majority of them
possess adequate fluorescent properties in aqueous media, making them suitable for easy evaluation in
biological systems. Saturation fibril binding studies suggest that the lead candidates have high
binding affinities to α-syn aggregates and show significant selectivity towards these
protein aggregates versus Aβ aggregates. Their potential as desirable ligands for
applications in α-syn aggregates studies is further highlighted by the PD and AD brain
tissue staining data, demonstrating that the ligands avidly bind all the different
conformations of α-syn pathology present in both early and later stages of the disease.
4. Experimental
4.1. Chemical synthesis
4.1.1. General methods
All reagents were obtained from either Sigma-Aldrich, TCI, Alfa Aesar, or Acros
Organics and used without further purification. Proton nuclear magnetic resonances (1H
NMR) were recorded at 600 MHz or 500 MHz on Bruker 600 or 500 NMR spectrometers.
Carbon nuclear magnetic resonances (13C NMR) were recorded at 75 MHz or 125 MHz on
a Bruker 300 or 500 NMR spectrometers, respectively. Chemical shifts are reported in
parts per million (ppm) from internal standards: acetone (2.05 ppm), chloroform (7.26
ppm), or dimethylsulfoxide (2.50 ppm) for 1H NMR; and from an internal standard of
either residual acetone (206.26 ppm), chloroform (77.00 ppm), or dimethylsulfoxide
(39.52 ppm) for 13C NMR. NMR peak multiplicities are denoted as follows: s (singlet), d
(doublet), t (triplet), q (quartet), dd (doublet of doublet), td (doublet of triplet), dt (triplet of
doublet), and m (multiplet). Coupling constants (J) are given in hertz (Hz). High-
resolution mass spectra (HRMS) were obtained from The Ohio State University Mass
Spectrometry and Proteomics Facility. Thin-layer chromatography (TLC) was performed
on silica gel 60 F254 plates from EMD Chemical Inc., and components were visualized by
ultraviolet light (254 nm) and/or phosphomolybdic acid, 20 wt% solution in ethanol.
SiliFlash silica gel (230–400 mesh) was used for all column chromatography. HPLC
confirmed the purity of the lead compounds, and the data shows that each compound's
purity is >95%.
4.1.2. Synthesis method 1
To a solution of aldehyde (1.0 eq) and 1-indanone (1.0 eq) in acetic acid (10 mL) was
slowly added concentrated HCl (0.5 mL). The reaction mixture was stirred at 110 oC
overnight and then cooled to room temperature. The cooled reaction mixture was poured
into ice water and solid filtered and recrystallized in methanol.
4.1.3. Synthesis method 2
To a solution of aldehyde (1.0 eq) and 1,3-indandione (1.0 eq) in
dichloromethane/methanol (1:2, 10 mL) was slowly added ethylenediamine
dihydrochloride (0.25 mmol). The reaction mixture was stirred at room temperature for 5
hours, and the resulting solid filtered out and recrystallized with methanol.
4.1.4. Synthesis method 3
A solution of the desired bromoindanone/indandione derivative (1.0 eq), bronic acid
derivative (2.0 eq), K2CO3 (1.0 eq) in 1, 4 - dioxane/ H2O (4:1, 10 mL) was deoxygenated
by bubbling argon through for 20 minutes. To this was added Pd(PPh3)4 (0.1 eq) and argon
bubbled through for a further 5 minutes, then stirred at 110 oC overnight. The reaction
mixture was then cooled and diluted with water (5 mL) and the aqueous layer extracted
with ethyl acetate. The combined organic layer was then washed with saturated NaHCO3,
rinsed with brine, dried over Na2SO4, and concentrated under reduced pressure. The
ensuing residue was purified by column chromatography to obtain the desired compound.
(E)-2-((E)-3-(4-Bromophenyl)allylidene)-2,3-dihydro-1H-inden-1-one (7).
Prepared by Method 1 with 1-indanone (132 mg, 1.0 mmol) and trans-4-
bromocinnamaldehyde (211 mg, 1.0 mmol) to afford compound 7 as a yellow solid (300
mg, 90% yield). 1H NMR (600 MHz, CDCl3) δ 7.87 (d, J = 7.8 Hz, 1H), 7.26 (td, J1 =
1.2 Hz, J2 = 7.2 Hz, 1H), 7.18 (d, J = 16.8 Hz, 1H), 7.50 – 7.48 (m, 2H), 7.41 (d, J = 10.8
Hz, 1H), 7.39 – 7.31 (m, 3H), 7.03 (dd, J1 = 11.4 Hz, J2 = 15.6 Hz, 1H), 6.96 (d, J = 15.6
Hz, 1H), 3.86 (s, 2H); 13C NMR (150 MHz, CDCl3) δ 193.6, 148.8, 140.4, 139.1, 136.6,
135.2, 134.5, 132.8, 132.0, 128.6, 127.6, 126.2, 124.9, 124.2, 123.2, 30.4. HRMS (ESI)
calcd for C18H14BrO [M+H]+ 326.0223, found, 326.0220.
(E)-2-((E)-3-(4-Hydroxy-3-methoxyphenyl)allylidene)-2,3-dihydro-1H-inden-1-
one (8). Prepared by Method 1 with 1-indanone (250 mg, 1.89 mmol) and 4-hydroxy-3-
methoycinnamaldehyde (337 mg, 1.89 mmol) to afford compound 8 as a red solid (436
mg, 79% yield). 1H NMR (600 MHz, DMSO-d6) δ 9.52 (s, 1H), 7.74 (d, J = 7.8 Hz, 1H),
7.69 (td, J1 = 1.2 Hz, J2 = 7.2 Hz, 1H), 7.64 (d, J = 7.8 Hz, 1H), 7.47 (t, J = 7.2 Hz, 1H),
7.29 (dt, J1 = 1.8 Hz, J2 = 10.2 Hz, 1H), 7.28 (s, 1H), 7.13 (d, J = 15.6 Hz, 1H), 7.09 (dt,
J1 = 10.2 Hz, J2 = 15.6 Hz, 1H), 7.06 (d, J = 8.4 Hz, 1H), 6.81 (d, J = 8.4 Hz, 1H), 3.93 (s,
2H), 3.86 (s, 3H); 13C NMR (150 MHz, DMSO-d6) δ 192.9, 149.6, 148.9, 148.4, 143.3,
139.3, 135.1, 134.9, 134.2, 128.4, 127.9, 127.1, 123.7, 122.6, 122.5, 116.1, 111.0, 56.2,
30.7. HRMS (ESI) calcd for C19H17O3 [M+H] + 293.1172, found, 293.1171.
(E)-2-((E)-3-(4-(Dimethylamino)phenyl)allylidene)-2,3-dihydro-1H-inden-1-one
(9). Prepared by Method 1 with 1-indanone (132 mg, 1.0 mmol) and 4-(dimethylamino)-
cinnamaldehyde (175 mg, 1.0 mmol) to afford compound 9 as a dark red solid (200 mg,
69% yield). 1H NMR (600 MHz, CDCl3) δ 7.86 (d, J = 7.8 Hz, 1H), 7.56 (td, J1 = 1.2 Hz,
J2 = 7.8 Hz, 1H), 7.51 (d, J = 7.8 Hz, 1H), 7.44-7.38 (m, 4H), 6.97 (d, J = 15.0 Hz, 1H),
6.83 (dd, J1 = 12.0 Hz, J2 = 15.0 Hz, 1H), 6.66 (d, J = 9.0 Hz, 2H), 3.80 (s, 2H), 3.00 (s,
6H); 13C NMR (150 MHz, CDCl3) δ 193.6, 151.1, 148.9, 143.2, 139.8, 134.9, 133.9,
133.4, 128.9, 127.4, 126.1, 124.5, 123.9, 119.8, 112.0, 40.2, 30.6. HRMS (ESI) calcd
for C20H20NO [M+H] + 290.1539, found, 290.1532.
(E)-2-((E)-3-(4-Nitrophenyl)allylidene)-2,3-dihydro-1H-inden-1-one (10).
Prepared by Method 1 with 1-indanone (150 mg, 1.1 mmol) and trans-4-
nitrocinnamaldehyde (200 mg, 1.1 mmol) to afford compound 10 as a yellow solid (300
mg, 85% yield). 1H NMR (600 MHz, DMSO-d6) δ 8.26 (d, J = 10.8 Hz, 2H), 7.94 (d, J =
10.8, Hz, 2H), 7.76 (d, J = 9.0 Hz, 1H), 7.73 (t, J = 9.0 Hz, 1H), 7.66 (d, J = 9.0 Hz, 1H),
7.51 (dd, J1 = 13.2 Hz, J2 = 18.6 Hz, 1H), 7.47 (t, J = 9.0 Hz, 1H), 7.37 (d, J = 18.6 Hz,
1H), 7.32 (d, J = 13.2 Hz, 1H), 4.0 (s, 2H); 13C NMR (150 MHz, DMSO-d6) δ 193.2,
149.9,147.5, 143.3, 139.4, 139.3, 138.8, 135.5, 132.2, 129.9, 128.8, 128.2, 127.2, 124.6,
124.0, 30.7. HRMS (ESI) calcd for C18H14NO3 [M+H] + 292.0968, found, 292.0967.
(E)-2-((E)-3-(4-Bromophenyl)allylidene)-6-hydroxy-2,3-dihydro-1H-inden-1-
one (11). Prepared by Method 1 with 6-hydroxy-indanone (148 mg, 1.0 mmol) and trans-
4-bromocinnamaldehyde (211 mg, 1.0 mmol) to afford compound 11 as a yellow solid
(320 mg, 87% yield). 1H NMR (600 MHz, DMSO-d6) δ 9.83 (s, 1H), 7.62 – 7.59 (m, 4H),
7.44 (d, J = 8.4 Hz, 1H), 7.26 (d, J1 = 11.4 Hz, J2 = 14.4 Hz, 1H), 7.23 – 7.21 (m, 1H),
7.18 (d, J = 14.4 Hz, 1H), 7.13 (dd, J1 = 2.4 Hz, J2 = 7.8 Hz, 1H), 7.04 (d, J = 2.4 Hz, 1H),
3.80 (s, 2H); 13C NMR (150 MHz, DMSO-d6) δ 193.1, 157.6, 140.5, 140.2, 138.4, 136.0,
132.5, 132.3, 129.7, 127.9, 126.4, 123.7, 122.7, 108.5, 29.8. HRMS (ESI) calcd for
C18H14BrO2 [M+H]+ 341.0172, found, 341.0169.
(E)-2-((E)-3-(4-(Dimethylamino)phenyl)allylidene)-6-hydroxy-2,3-dihydro-1H-
inden-1-one (12). Prepared by Method 1 with 6-hydroxy-indanone (148 mg, 1.0 mmol)
and 4-(dimethylamino)-cinnamaldehyde (175 mg, 1.0 mmol) to afford compound 12 as a
dark red solid (193 mg, 63% yield). 1H NMR (500 MHz, DMSO-d6) δ 9.78 (s, 1H), 7.48
(d, J = 8.5 Hz, 2H), 7.43 (d, J = 8.0 Hz, 1H), 7.24 (d, J = 11.5 Hz, 1H), 7.13 – 7.05 (m,
2H), 7.03 (d, J = 2.0 Hz, 1H), 6.93 (dd, J1 = 11.5 Hz, J2 = 15.5 Hz, 1H), 6.72 (d, J = 9.0
Hz, 2H), 3.74 (s, 2H), 2.98 (s, 6H); 13C NMR (125 MHz, DMSO-d6) δ 192.8, 157.5,
151.4, 143.4, 140.8, 140.2, 134.8, 134.4, 129.5, 127.8, 124.4, 123.1, 120.3, 112.4, 108.4,
39.1, 29.8. HRMS (ESI) calcd for C20H20NO2 [M+H] + 306.1489, found, 306.1489.
(E)-6-Hydroxy-2-((E)-3-(4-nitrophenyl)allylidene)-2,3-dihydro-1H-inden-1-one
(13). Prepared by Method 1 with 6- hydroxy-indanone (148 mg, 1.0 mmol) and trans-4-
nitrocinnamaldehyde (177 mg, 1.0 mmol) to afford compound 13 as a yellow solid (270
mg, 79% yield). 1H NMR (600 MHz, DMSO-d6) δ 9.83 (s, 1H), 8.25 (d, J = 10.8 Hz, 2H),
7.92 (d, J = 10.8, Hz, 2H), 7.47 (d, J = 14.4 Hz, 1H), 7.45 (t, J = 6.0 Hz, 1H), 7.33 (d, J =
18.6 Hz, 1H), 7.26 (d, J = 13.8 Hz, 1H), 7.14 (dd, J1 = 3.0 Hz, J2 = 9.6 Hz, 1H), 7.05 (d, J
= 3.0 Hz, 1H), 3.86 (s, 2H); 13C NMR (150 MHz, DMSO-d6) δ 192.1, 156.6, 146.4, 142.2,
139.6, 139.2, 138.9, 138.1, 130.7, 128.9, 127.7, 126.9, 123.5, 122.9, 107.5, 28.8. HRMS
(ESI) calcd for C18H14NO4 [M+H] + 308.0917, found, 308.0916.
(E)-5,7-Difluoro-2-((E)-3-(4-hydroxy-3-methoxyphenyl)allylidene)-2,3-dihydro-
1H-inden-1-one (14). Prepared by Method 1 with 5,7-difluoro-1-indanone (200 mg, 1.2
mmol) and 4-hydroxy-3-methoycinnamaldehyde (212 mg, 1.2 mmol) to afford compound
14 as a black solid (320 mg, 81%). 1H NMR (600 MHz, DMSO-d6) δ 9.53 (s, 1H), 7.33 (d,
J = 9.0 Hz, 1H), 7.28-7.22 (m, 3H), 7.13 (d, J = 18.0 Hz, 1H), 7.06-7.00 (m, 2H), 3.95 (s,
2H), 3.85 (s, 3H); 13C NMR (150 MHz, DMSO-d6) δ 188.4, 167.76 (d, J = 11.7 Hz),
165.74 (d, J = 11.4 Hz), 160.55 (d, J = 14.6 Hz), 158.47 (d, J = 14.5 Hz), 154.18 (d, J =
7.4 Hz), 149.1, 148.4, 143.9, 134.3, 134.2, 128.3, 123.6 (d, J = 13.2 Hz), 122.7, 122.2,
116.1, 110.9, 110.3 (d, J = 22.4 Hz), 104.1 (t, J1 = 23.8 Hz, J2 = 27.3), 56.2, 31.2. HRMS
(ESI) calcd for C19H15F2O3 [M + H]+ 329.0984, found, 329.0983.
(E)-5,7-Difluoro-2-((E)-3-(4-nitrophenyl)allylidene)-2,3-dihydro-1H-inden-1-
one (15). Prepared by Method 1 with 5,7-difluoro-1-indanone (150 mg, 0.9 mmol) and
trans-4-nitrocinnamaldehyde (158 mg, 0.9 mmol) to afford compound 15 as a yellow solid
(251 mg, 83% yield). 1H NMR (600 MHz, DMSO-d6) δ 8.26 (d, J = 8.4 Hz, 2H), 7.93 (d, J
= 8.4, Hz, 2H), 7.48 (dd, J = 15.6, 5.4 Hz, 1H), 7.39-7.37 (m, 2H), 7.33-7.27 (m, 2H), 4.04
(s, 2H); 13C NMR (150 MHz, CDCl3) δ 188.4, 167.6, 154.2, 154.1, 149.1, 148.4, 148.1,
143.9, 134.3, 128.3, 122.7, 122.2, 116.1, 111.0, 110.3 (d, J = 22.3 Hz), 104.1 (dd, J1 =
23.7 Hz, J2 = 26.8 Hz,), 56.2, 31.2. HRMS (ESI) calcd for C18H12F2NO3 [M + H]+
328.0780, found, 328.0779.
(E)-2-(3-Phenylallylidene)-1H-indene-1,3(2H)-dione (16). Prepared by Method 2
with 1,3-indandione (146 mg, 1.0 mmol) and cinnamaldehyde (132 mg, 1.0 mmol) to
afford compound 16 as a yellow solid (215 mg, 82% yield). 1H NMR (600 MHz, CDCl3) δ
8.44 (dd, J1 = 15.6 Hz, J2 = 12.0 Hz, 1H), 7.97-7.95 (m, 2H), 7.78-7.76 (m, 2H), 7.66-7.65
(m, 2H), 7.80 (dd, J1 = 1.2 Hz, J2 = 12.0 Hz, 1H), 7.42-7.41 (m, 2H), 7.32 (d, J = 15.6
Hz, 1H); 13C NMR (150 MHz, CDCl3) δ 190.4, 189.9, 151.0, 144.6, 142.1, 140.8, 135.5,
135.1, 134.9, 130.9, 128.9, 128.6, 127.9, 123.6, 123.1, 122.9. HRMS (ESI) calcd for
C18H13O2 [M + H]+ 261.0910, found, 261.0912.
(E)-2-(3-(4-Bromophenyl)allylidene)-1H-indene-1,3(2H)-dione (17). Prepared by
Method 2 with 1,3-indandione (146 mg, 1.0 mmol) and trans-4-bromocinnamaldehyde
(211 mg, 1.0 mmol) to afford compound 17 as a yellow solid (300 mg, 86% yield). 1H
NMR (600 MHz, CDCl3) δ 8.39 (dd, J1 = 11.4 Hz, J2 = 15.6 Hz, 1H), 7.95 (dt, J1 = 2.4
Hz, J2 = 5.46 Hz, 1H), 7.79 – 7.77 (m, 2H), 7.58 (d, J = 12.0 Hz, 1H), 7.55 – 7.51 (m,
2H), 7.50 (d, J = 8.4 Hz, 2H), 7.23 (d, J = 15.6 Hz, 1H); 13C NMR (150 MHz, CDCl3) δ
190.4, 189.9, 149.2, 143.9, 142.1, 140.8, 135.2, 135.1, 134.4, 132.2, 129.8, 128.3, 125.2,
124.1, 123.1, 122.9. HRMS (ESI) calcd for C18H12BrO2 [M + H]+ 339.0015, found,
339.0016.
(E)-2-(3-(4-Fluorophenyl)allylidene)-1H-indene-1,3(2H)-dione (18). Prepared by
Method 2 with 1,3-indandione (60 mg, 0.4 mmol) and trans-4-fluorocinnamaldehyde (62
mg, 0.4 mmol) to afford compound 18 as a yellow solid (100 mg, 88% yield). 1H NMR
(600 MHz, CDCl3) δ 8.34 (dd, J1 = 12.0 Hz, J2 = 15.6 Hz, 1H), 7.96 – 7.94 (m, 2H), 7.79
– 7.76 (m, 2H), 7.64 (dd, J1 = 6.6 Hz, J2 = 8.4 Hz, 2H), 7.59 (d, J = 12.0 Hz, 1H), 7.26 (d,
J = 15.6 Hz, 1H), 7.10 (t, J = 8.4 Hz, 2H); 13C NMR (150 MHz, CDCl3) δ 190.5, 189.9,
165.1, 163.4, 149.4, 144.3, 142.1, 140.8, 135.1 (d, J = 16.7 Hz), 131.8, 130.6 (d, J = 8.4
Hz), 127.9, 123.3, 123.14, 122.9, 116.3, 116.2 (d, J = 21.9 Hz). HRMS (ESI) calcd for
C18H12FO2 [M + H]+ 279.0816, found, 279.0816.
(E)-2-(3-(4-(Dimethylamino)phenyl)allylidene)-1H-indene-1,3(2H)-dione (19).
Prepared by Method 2 with 1,3- indandione (146 mg, 1.0 mmol) and 4-(dimethylamino)-
cinnamaldehyde (175 mg, 1.0 mmol) to afford compound 19 as a black solid (200 mg,
66% yield). 1H NMR (600 MHz, CDCl3) δ 8.23 (dd, J1 = 12.0 Hz, J2 = 15.6 Hz, 1H), 7.88
– 7.87 (m, 2H), 7.71 – 7.68 (m, 2H), 7.63 (dd, J1 = 0.6 Hz, J2 = 12.0 Hz, 1H), 7.56 (d, J =
8.4 Hz, 2H), 7.28 (d, J = 14.4 Hz, 1H), 6.69 (d, J = 9.0 Hz, 2H), 3.06 (s, 6H); 13C NMR
(150 MHz, CDCl3) δ 191.2, 190.8, 153.7, 151.4, 146.5, 142.0, 140.7, 134.5, 134.3, 132.8,
131.4, 124.4, 122.6, 122.4, 119.3, 111.9, 40.2. HRMS (ESI) calcd for C20H18NO2 [M + H]+
304.1332, found, 304.1332.
(E)-2-(3-(4-Hydroxy-3-methoxyphenyl)allylidene)-1H-indene-1,3(2H)-dione
(20). Prepared by Method 2 with 1,3- indandione (100 mg, 0.7 mmol) and 4-hydroxy-3-
methoycinnamaldehyde (123 mg, 0.7 mmol) to afford compound 20 as a brown solid (201
mg, 96% yield). 1H NMR (500 MHz, DMSO-d6) δ 10.04 (s, 1H), 8.16 (dd J1 = 12.0 Hz, J2
= 15.0 Hz, 1H), 7.90 (s, 4H), 7.65 (s, 1H), 7.62 (d, J = 5.0 Hz, 1H), 7.23 (s, 1H), 7.20 (d, J
= 8.0 Hz, 1H), 6.91 (d, J = 8.0 Hz, 1H), 3.88 (s, 3H); 13C NMR (125 MHz, DMSO-d6) δ
190.6, 189.9, 153.8, 151.3, 148.6, 145.5, 141.9, 140.6, 135.9, 135.8, 127.6, 125.9, 124.4,
123.1, 122.9, 120.5, 116.6, 112.0, 56.1. HRMS (ESI) calcd for C19H15O4 [M + H]+
307.0965, found, 307.0962.
(E)-2-(3-(4-Hydroxy-3,5-dimethoxyphenyl)allylidene)-1H-indene-1,3(2H)-dione
(21). Prepared by Method 2 with 1,3-indandione (146 mg, 1.0 mmol) and trans-3,5-
dimethoxy-4-hydroxycinnamaldehyde (208 mg, 1.0 mmol) to afford compound 21 as a
yellow solid (290 mg, 81% yield). 1H NMR (600 MHz, Acetone-d6) δ 8.36 (dd, J1 = 12.0
Hz, J2 = 15.6 Hz, 1H), 8.00 – 7.92 (m, 4H), 7.65 (d, J = 12.0 Hz, 1H), 7.60 (d, J = 15.6
Hz, 1H), 7.15 (s, 2H), 3.99 (s, 6H); 13C NMR (150 MHz, DMSO-d6) δ 190.6, 189.9, 153.9,
148.7, 145.3, 141.9, 140.6, 140.5, 135.9, 135.8, 126.3, 126.0, 123.1, 122.9, 120.9, 107.0,
56.5. HRMS (ESI) calcd for C20H17O5 [M + H]+ 337.1071, found, 337.1070.
(E)-2-(3-(4-Nitrophenyl)allylidene)-1H-indene-1,3(2H)-dione (22). Prepared by
Method 2 with 1,3-indandione (100 mg, 0.7 mmol) and trans-4-nitrocinnamaldehyde (121
mg, 0.7 mmol) to afford compound 22 as a yellow solid (202 mg, 95% yield). 1H NMR
(600 MHz, CDCl3) δ 8.56 (dd, J1 = 12.0 Hz, J2 = 15.6 Hz, 1H), 8.28 (d, J = 9.0 Hz, 1H),
8.02-8.01 (m, 2H), 7.85-7.83 (m, 2H), 7.80 (d, J = 8.4 Hz, 1H), 7.63 (d, J = 12.0 Hz, 1H),
7.33 (d, J = 15.6 Hz, 1H); 13C NMR (150 MHz, CDCl3) δ 190.2, 189.5, 148.5, 146.5,
142.4, 142.3, 141.5, 141.0, 135.6, 135.5, 130.1, 128.9, 127.3, 124.3, 123.4, 123.3. HRMS
(ESI) calcd for C18H12NO4 [M + H]+ 306.0761, found, 306.0761.
(E)-2-((E)-3-(4-Hydroxy-3-methoxyphenyl)allylidene)-3,4-dihydronaphthalen-
1(2H)-one (23). Prepared by Method 2 with alpha-tetralone (146 mg, 1.0 mmol) and 4-
hydroxy-3-methoxycinnamaldehyde (178 mg, 1.0 mmol) to afford compound 23 as a red
solid (246 mg, 80% yield). 1H NMR (600 MHz, CDCl3) δ 8.11 (d, J = 7.8 Hz, 1H), 7.56 (d,
J = 10.8 Hz, 1H), 7.47 (t, J = 7.2 Hz, 1H), 7.35 (t, J = 7.2 Hz, 1H), 7.26 (d, J = 7.8 Hz, 1H),
7.08 (d, J = 7.8Hz, 1H), 7.03 – 6.94 (m, 3H), 6.92 (d, J = 8.4 Hz, 1H), 5.85 (s, 1H), 3.95 (s,
3H), 3.01 (s, 4H); 13C NMR (150 MHz, CDCl3) δ 187.3, 146.9, 146.8, 143.4, 141.3, 136.5,
133.9, 133.3, 132.9, 129.4, 128.2, 128.1, 126.9, 121.5, 121.4, 114.8, 109.1, 56.0, 28.8,
25.9. HRMS (ESI) calcd for C20H19O3 [M + H]+ 307.1329, found, 307.1319.
(E)-2-((E)-3-(4-(Dimethylamino)phenyl)allylidene)-3,4-dihydronaphthalen-
1(2H)-one (24). Prepared by Method 2 with alpha-tetralone (146 mg, 1.0 mmol) and 4-
(dimethylamino)-cinnamaldehyde (175 mg, 1.0 mmol) to afford compound 24 as a red
solid (195 mg, 64% yield). 1H NMR (600 MHz, CDCl3) δ 8.12 (d, J = 7.8 Hz, 1H), 7.61
(d, J = 10.2 Hz, 1H), 7.47 (t, J = 7.2 Hz, 1H), 7.43 (d, J = 8.4 Hz, 2H), 7.35 (t, J = 7.2 Hz,
1H), 7.25 (d, J = 7.8 Hz, 1H), 7.03 – 6.93 (m, 2H), 6.69 (d, J = 9.0 Hz, 2H), 3.03 (s, 6H),
3.01 (s, 4H); 13C NMR (150 MHz, CDCl3) δ 187.3, 150.9, 143.4, 142.1, 137.6, 134.2,
132.7, 131.6, 128.7, 128.1, 128.0, 126.9, 124.9, 119.2, 112.1, 40.2, 28.8, 25.8. HRMS (ESI)
calcd for C21H22NO [M + H]+ 304.1696, found, 304.1689.
3-(3-(4-Hydroxy-3-methoxyphenyl)allylidene)chromane-2,4-dione (25). Prepared
by Method 2 with 4-
hydroxycoumarin (162 mg, 1.0 mmol) and 4-hydroxy-3-methoycinnamaldehyde (178 mg,
1.0 mmol) to afford compound 25 as a black solid (187 mg, 58% yield). 1H NMR (600
MHz, CDCl3) Major: δ 8.48 – 8.41 (m, 2H), 8.11 (d, J = 7.8 Hz, 1H), 7.65 – 7.61 (m, 1H),
7.54 (d, J = 13.8 Hz, 1H), 7.29 – 7.27 (m, 2H), 7.26 – 7.3 (m, 1H), 7.99 (d, J = 8.4 Hz,
2H), 6.15 (s, 1H), 4.01 (s, 3H); Minor: δ 8.75 (dd, J1 = 12.6 Hz, J2 = 15.0 Hz, 1H), 8.37
(d, J = 12.0 Hz, 1H), 8.07 (d, J = 7.2 Hz, 1H), 7.65 – 7.61 (m, 1H), 7.48 (d, J = 14.4 Hz,
1H), 7.29 – 7.27 (m, 1H), 7.26 – 7.3 (m, 1H), 7.02 – 7.0 (m, 1H), 6.94 (t, J = 7.2 Hz, 1H),
6.16 (s, 1H), 4.02 (s, 3H); 13C NMR (150 MHz, DMSO-d6) δ Major:193.4, 144.5, 143.5,
143.2, 142.2, 140.6, 138.7, 135.9, 131.7, 128.4, 126.3, 125.9, 124.7, 124.6, 124.5, 123.7,
120.7, 58.5; Minor: 193.4, 144.9, 143.4, 142.2, 140.6, 138.4, 135.3,135.0, 131.6,
126.3, 126.3, 124.9, 124.7, 124.6, 124.4, 123.4, 120.7, 58.7. HRMS (ESI) calcd for
C19H15O5 [M + H]+ 323.0914, found, 323.0908.
3-(3-(4-(Dimethylamino)phenyl)allylidene)chromane-2,4-dione (26). Prepared by
Method 2 with 4-
hydroxycoumarin (162 mg, 1.0 mmol) and 4-(dimethylamino)-cinnamaldehyde (175 mg,
1.0 mmol) to afford compound 26 as a blue solid (173 mg, 54% yield). 1H NMR (600
MHz, DMSO-d6) Major: δ 8.37 (d, J = 12.6 Hz, 1H), 8.23 (d, J = 14.4 Hz, 1H), 7.99 (d, J
= 14.4 Hz, 1H), 7.87 (d, J = 7.8 Hz, 1H), 7.72 – 7.70 (m, 2H), 7.65 (dd, J1 = 1.8 Hz, J2 =
7.8 Hz, 1H), 7.53 (t, J = 9.6 Hz, 1H), 6.89 (d, J = 9.0 Hz, 2H), 3.15 (s, 6H); Minor: δ 8.75
(dd, J1 = 12.6 Hz, J2 = 15.0 Hz, 1H), 6.89 (d, J = 9.0 Hz, 1H), 8.07 (d, J = 7.2 Hz, 1H),
7.65 – 7.61 (m, 1H), 7.48 (d, J = 14.4 Hz, 1H), 7.29 – 7.27 (m, 1H), 7.26 – 7.3 (m, 1H),
7.02 – 7.0 (m, 1H), 6.94 (t, J = 7.2 Hz, 1H), 6.16 (s, 1H), 4.02 (s, 3H); 13C NMR (150
MHz, CDCl3 + DMSO-d6) δ Major: 180.2, 161.8, 161.1, 160.5, 154.9, 153.9, 135.1,
133.4, 126.8, 123.9, 123.5, 121.5, 120.1, 117.0, 113.3, 111.9, 39.9; Minor: 180.5, 164.5,
161.4, 161.1, 160.5, 154.9, 154.2, 134.8, 133.4, 126.5, 124.1, 123.4, 121.3, 120.1, 116.9,
112.0, 39.9. HRMS (ESI) calcd for C20H18NO3 [M + H]+ 320.1281, found, 320.1281.
3-(3-(4-(Dimethylamino)phenyl)allylidene)chromane-2,4-dione (27). Prepared by
Method 2 with 4-hydroxy-7- methylcoumarin (176 mg, 1.0 mmol) and 4-
(dimethylamino)-cinnamaldehyde (175 mg, 1.0 mmol) to afford compound 27 as a blue
solid (157 mg, 47% yield). 1H NMR (600 MHz, DMSO-d6) Major: δ 8.37 (d, J = 12.6 Hz,
1H), 8.25-8.21 (m, 1H), 7.95 (d, J = 14.4 Hz, 1H), 7.75 (d, J = 9.6 Hz, 1H), 7.68 (d, J =
9.0 Hz, 2H), 7.53 – 7.50 (m, 1H), 7.20 (t, J = 8.4 Hz, 1H), 6.88 (t, J = 7.2 Hz, 2H), 3.14
(s, 6H), 2.37 (s, 3H); Minor: δ 8.65 (t, J = 13.8 Hz, 1H), 8.24-8.22 (m, 1H), 7.90 (d, J =
15.0 Hz, 1H), 7.75 (d, J = 9.6 Hz, 1H), 7.68 (d, J = 9.0 Hz, 2H), 7.53 – 7.50 (m, 1H), 7.20
(t, J = 8.4 Hz, 1H), 6.88 (t, J = 7.2 Hz, 2H), 3.14 (s, 6H), 2.38 (s, 3H); 13C NMR (150
MHz, CDCl3 + DMSO-d6) δ Major: 180.3, 161.9, 161.3, 160.9, 153.6, 136.1, 133.7,
133.4, 126.4, 123.5, 121.5, 120.9, 119.6, 116.7, 113.3, 111.9, 39.9, 20.2; Minor: 180.6,
164.7, 161.1, 161.4, 160.5, 152.9, 135.7, 133.8, 133.3, 126.1, 123.3, 121.0, 120.8, 116.6,
113.2, 111.9, 39.9, 20.2. HRMS (ESI) calcd for C21H20NO3 [M + H]+ 334.1438, found,
334.1437.
6-Bromo-3-(3-(4-(dimethylamino)phenyl)allylidene)chromane-2,4-dione (28).
Prepared by Method 2 with 6-bromo-4-hydroxycoumarin (241 mg, 1.0 mmol) and 4-
(dimethylamino)-cinnamaldehyde (175 mg, 1.0 mmol) to afford compound 28 as a blue
solid (160 mg, 40% yield). 1H NMR (600 MHz, DMSO-d6) Major: δ 8.38 (d, J = 12.6 Hz,
1H), 8.23 (t, J = 14.4 Hz, 1H), 7.97-7.95 (m, 2H), 7.73-7.69 (m, 3H), 7.35 – 7.29 (m, 2H),
6.87-6.88 (m, 2H), 3.14 (s, 6H); Minor: δ 8.65 (t, J = 13.2 Hz, 1H), 8.23 (t, J = 14.4 Hz,
1H), 7.97-7.95 (m, 1H), 7.92 (d, J = 14.4 Hz, 1H), 7.73-7.69 (m, 3H), 7.35 – 7.29 (m, 2H),
6.87-6.88 (m, 2H), 3.14 (s, 6H); 13C NMR (150 MHz, CDCl3 + DMSO-d6) δ Major:
179.5, 161.1, 160.5, 154.9, 154.2, 153.2, 134.4, 132.7, 126.1, 123.3, 123.5, 122.8, 120.6,
119.4, 116.3, 112.6, 111.3, 39.2; Minor: 179.8, 163.8, 160.7, 159.7, 153.5, 153.2, 134.1,
132.7, 125.8, 123.4, 122.7, 120.6, 120.4, 116.2, 112.4, 111.3, 39.2. HRMS (ESI) calcd for
C20H17BrNO3 [M + H]+ 398.0386, found, 398.0386.
(E)-2-((E)-3-(4'-Hydroxy-3'-methoxy-[1,1'-biphenyl]-4-yl)allylidene)-2,3-
dihydro-1H-inden-1-one (29). Prepared by Method 3 with compound 7 (160 mg, 0.5
mmol) and 4-hydroxy-3-methoxyphenylboronic acid pinacol ester (250 mg, 1.0 mmol) to
afford compound 29 as a red solid (140 mg, 76% yield). 1H NMR (600 MHz, CDCl3) δ
7.87 (d, J = 7.8 Hz, 1H), 7.59 (t, J = 7.2 Hz, 1H), 7.55 (s, 4H), 7.52 (d, J = 7.8 Hz, 1H),
7.45 – 7.27 (m, 1H), 7.40 (d, J = 7.2 Hz, 1H), 7.40 (dd, J1 = 1.2 Hz, J2 = 7.8 Hz, 1H), 7.10
(s, 1H), 7.05 (d, J = 5.4 Hz, 2H), 7.00 (d, J = 7.8 Hz, 1H), 5.84 (s, 1H), 3.96 (s, 3H), 3.86
(s, 2H); 13C NMR (150 MHz, CDCl3) δ 193.7, 148.9, 146.9, 145.8, 141.9, 141.7, 139.3,
135.9, 134.8, 134.4, 133.6, 132.7, 127.8, 127.6, 127.1, 126.3, 124.2, 124.1, 120.2, 114.9,
109.5, 56.0, 30.5, 24.9. HRMS (ESI) calcd for C25H21O3 [M + H]+ 369.1486, found,
369.1474.
(E)-2-((E)-3-(4'-(Dimethylamino)-[1,1'-biphenyl]-4-yl)allyli dene)-6-hydroxy-
2,3-dihydro-1H-inden-1-one (30). Prepared by Method 3 with compound 11 (170 mg,
0.5 mmol) and 4- (N,N-dimethylamino)phenylboronic acid pinacol ester (247 mg, 1.0
mmol) to afford compound 30 as a black solid (130 mg, 68% yield). 1H NMR (600 MHz,
DMSO-d6) δ 7.76 (d, J = 7.8 Hz, 1H), 7.72-7.66 (m, 6H), 7.61 (d, J = 8.4 Hz, 2H), 7.49
(d, J = 7.2 Hz, 1H), 7.35 – 7.33 (m, 1H), 7.27 – 7.26 (m, 2H), 6.81 (d, J = 9.0 Hz, 2H),
3.98 (s, 2H), 2.97 (s, 6H); 13C NMR (150 MHz, CDCl3 + DMSO-d6) δ 194.4, 150.1, 149.0,
142.5, 141.9, 138.9, 135.2, 134.5, 134.3, 133.7, 127.7, 127.4, 127.2, 126.0, 123.8, 123.1,
112.6, 40.1, 30.2. HRMS (ESI) calcd for C26H24NO [M + H]+ 382.1802, found, 382.1808.
(E)-6-Hydroxy-2-((E)-3-(4'-(hydroxymethyl)-[1,1'-biphenyl]-4-yl)allyli dene)-
2,3-dihydro-1H-inden-1-one (31). Prepared by Method 3 with compound 11 (170 mg,
0.5 mmol) and 4-(hydroxymethyl)phenylboronic acid pinacol ester (234 mg, 1.0 mmol) to
afford compound 31 as a brown solid (129 mg, 70% yield). 1H NMR (500 MHz, DMSO-
d6) δ 9.86 (s, 1H), 7.76 – 7.72 (m, 4H), 7.70 (d, J = 8.0 Hz, 2H), 7.46 (d, J = 8.0 Hz, 1H),
7.42 (d, J = 8.5 Hz, 2H), 7.29 – 7.26 (m, 3H), 7.13 (dd, J1 = 2.5 Hz, J2 = 8.0 Hz, 1H),
7.05 (d, J = 3.0 Hz, 1H), 5.24 (s, 1H), 4.55 (s, 2H), 3.83 (s, 2H); 13C NMR (125 MHz,
DMSO-d6) δ 192.1, 141.7, 140.6, 140.0, 139.4, 139.3, 137.1, 136.9, 134.8, 131.9, 127.5,
126.9, 126.5, 126.4, 125.8, 124.5, 122.8, 107.5, 62.1, 28.8. HRMS (ESI) calcd for
C25H21O3 [M + Na]+ 369.1485, found, 369.1480.
4'-((E)-3-((E)-6-Hydroxy-1-oxo-1,3-dihydro-2H-inden-2-ylidene)prop-1-en-1-
yl)-[1,1'-biphenyl]-4-carboxylic acid (32). Prepared by Method 3 with compound 11
(170 mg, 0.5 mmol) and 4-carboxyphenylboronic acid (166 mg, 1.0 mmol) to afford
compound 32 as a gray solid (111 mg, 58% yield). 1H NMR (600 MHz, DMSO-d6) δ 13.20
(s, 1H), 7.81 (d, J = 7.8 Hz, 2H), 7.77 – 7.73 (m, 4H), 7.71 (t, J = 7.8 Hz, 1H), 7.7-7.65
(m, 3H), 7.48 (t, J = 7.8 Hz, 1H), 7.34 (d, J = 13.2 Hz, 2H), 7.27 (d, J = 13.8 Hz, 1H), 3.98
(s, 2H); 13C NMR (150 MHz, DMSO-d6) δ 193.1, 163.3, 149.8, 149.4, 141.4, 139.0, 137.3,
137.1, 135.2, 134.8, 133.8, 133.1, 128.8, 128.1, 127.2, 126.7, 126.2, 125.5, 123.9, 30.7.
HRMS (ESI) calcd for C25H19O4 [M + H]+ 383.1278, found, 383.1277.
5-(4-((E)-3-((E)-6-Hydroxy-1-oxo-1,3-dihydro-2H-inden-2-ylidene)prop-1-en-1-
yl)phenyl)thiophene-2- carbonitrile (33). Prepared by Method 3 with compound 11 (170
mg, 0.5 mmol) and 5-cyanothiophene-2-boronic acid pinacol ester (235 mg, 1.0 mmol) to
afford compound 33 as a red solid (131 mg, 71% yield). 1H NMR (600 MHz, DMSO-d6) δ
8.01 (d, J = 4.8 Hz, 1H), 7.82 (d, J = 10.2 Hz, 2H), 7.78 – 7.74 (m, 3H), 7.71 (t, J = 9.0
Hz, 1H), 7.65 (d, J = 9.0 Hz, 1H), 7.48 (t, J = 9.0 Hz, 1H), 7.38 – 7.25 (m, 3H), 3.97 (s,
2H); 13C NMR (150 MHz, DMSO-d6) δ 192.0, 149.9, 148.7, 140.1, 139.8, 137.9, 136.8,
136.5, 134.2, 131.9, 131.4, 127.8, 127.0, 126.1, 126.0, 125.9, 124.4, 122.8, 113.8, 106.3,
29.6. HRMS (ESI) calcd for C23H16NOS [M + H]+ 370.0896, found, 370.0896.
(E)-4'-(3-(1,3-Dioxo-1,3-dihydro-2H-inden-2-ylidene)prop-1-en-1-yl)-[1,1'-
biphenyl]-4-carboxylic acid (34). Prepared by Method 3 with compound 17 (170 mg, 0.5
mmol) and 4-carboxyphenylboronic acid (166 mg, 1.0 mmol) to afford compound 34 as a
gray solid (120 mg, 68%). 1H NMR (600 MHz, DMSO-d6) δ 13.04 (s, 1H), 8.38 (dd, J1 =
12.0 Hz, J2 = 15.6 Hz, 1H), 8.05 (d, J = 8.4 Hz, 2H), 7.95-7.94 (m, 4H), 7.91 – 7.86 (m,
4H), 7.82 (d, J = 7.8 Hz, 2H), 7.79 (d, J = 15.6 Hz, 1H), 7.71 (d, J = 12.0 Hz, 1H); 13C NMR
(150 MHz, DMSO-d6) δ 190.8, 190.0, 167.8, 151.5, 144.5, 143.9, 142.4, 141.9, 141.1,
136.6, 136.0, 134.9, 130.9, 130.8, 129.9, 128.6, 127.7, 124.0, 123.7, 123.6. HRMS (ESI)
calcd for C25H17O4 [M + H]+ 381.1121, found, 381.1121.
(E)-5-(4-(3-(1,3-Dioxo-1,3-dihydro-2H-inden-2-ylidene)prop-1-en-1-
yl)phenyl)thiophene-2-carboxylic acid (35). Prepared by Method 3 with compound 17
(170 mg, 0.5 mmol) and 5-carboxythiophene-2-boronic acid pinacol ester (254 mg, 1.0
mmol) to afford compound 35 as a red solid (137 mg, 71% yield). 1H NMR (600 MHz,
DMSO-d6) δ 8.36 (dd, J1 = 12.0 Hz, J2 = 15.6 Hz, 1H), 7.95 – 7.96 (m, 4H), 7.88 (d, J =
7.8 Hz, 2H), 7.77 (d, J = 7.8 Hz, 2H), 7.75 – 7.69 (m, 4H); 13C NMR (150 MHz, DMSO-
d6) δ 190.5, 189.7, 169.8, 151.0, 150.9, 144.8, 144.1, 143.5, 142.1, 140.8, 137.4, 136.3,
134.3, 129.8, 128.2, 126.9, 126.3, 126.2, 126.1, 123.8, 123.7, 123.4, 123.2. HRMS (ESI)
calcd for C23H15O4S [M + H]+ 387.0686, found, 387.0686.
(Z)-2-((5-Bromothiophen-2-yl)methylene)-2,3-dihydro-1H-inden-1-one (36A).
Prepared by Method 1 with 1- indanone (650 mg, 5.0 mmol) and 5-bromo-2-
thiophenecarboxaldehyde (1.43 g, 7.5 mmol) to afford intermediate 36A as a yellow solid
(1.5 g, 93% yield). 1H NMR (600 MHz, DMSO-d6) δ 7.30 (d, J = 7.8 Hz, 1H), 7.27 (dt, J1
= 1.2 Hz, J2 = 3.0 Hz, 1H), 7.25 (dd, J1 = 1.2 Hz, J2 = 7.2 Hz, 1H), 7.24 (dd, J1 = 0.6 Hz,
J2 = 7.2 Hz, 1H), 7.07 (d, J = 4.2 Hz, 1H), 7.02 (td, J1 = 1.2 Hz, J2 = 7.8 Hz, 1H), 6.94 (d,
J = 4.2 Hz, 1H), 3.44 (d, J = 1.2 Hz, 2H); 13C NMR (150 MHz, DMSO-d6) δ 193.0, 149.6,
141.5, 138.1, 135.4, 135.1, 133.7, 132.3, 128.2, 127.3, 125.5, 123.9, 117.9, 32.1. HRMS
(ESI) calcd for C14H10BrOS [M + H]+ 304.9630, found, 304.9627.
(Z)-2-((5-Bromothiophen-2-yl)methylene)-6-hydroxy-2,3-dihydro-1H-inden-1-
one (36B). Prepared by Method 1 with 6-hydroxy-indanone (740 mg, 5.0 mmol) and 5-
bromo-2-thiophenecarboxaldehyde (1.4 g, 7.5 mmol) to afford intermediate 36B as a
yellow solid (1.4 g, 85% yield). 1H NMR (600 MHz, DMSO-d6) δ 9.86 (s, 1H), 7.67 (dd,
J1 = 1.8 Hz, J2 = 2.4 Hz, 1H), 7.52 – 7.49 (m, 1H), 7.49 – 7.46 (m, 1H), 7.38 (d, J = 4.2
Hz, 1H), 7.13 (dd, J1 = 2.4 Hz, J2 = 8.4 Hz, 1H), 7.05 (d, J = 2.4 Hz, 1H), 3.75 (d, J =
1.8 Hz, 2H); 13C NMR (150 MHz, DMSO-d6) δ 193.0, 157.7, 141.5, 140.3, 139.4,
134.9, 134.8, 132.2, 128.0, 125.2, 123.9, 117.8, 108.6, 31.4. HRMS (ESI) calcd for
C14H10BrO2S [M + H]+ 320.9579, found, 320.9577.
(Z)-2-((5-(4-(Hydroxymethyl)phenyl)thiophen-2-yl)methylene)-2,3-dihydro-1H-
inden-1-one (37). Prepared by Method 3 with intermediate 36A (152 mg, 0.5 mmol) and
4-(hydroxymethyl)phenylboronic acid pinacol ester (234 mg, 1.0 mmol) to afford
compound 37 as a red solid (125 mg, 75 % yield). 1H NMR (500 MHz, DMSO-d6) δ 7.80
(s, 1H), 7.78 (d, J = 7.5 Hz, 1H), 7.75 (d, J = 8.0 Hz, 2H), 7.76 – 7.70 (m, 3H), 7.49 (d, J =
4.0 Hz, 1H), 7.51 – 7.48 (m, 1H), 7.41 (d, J = 8.5 Hz, 2H), 5.29 (s, 1H), 4.54 (s, 2H), 4.03
(s, 2H); 13C NMR (125 MHz, DMSO-d6) δ 191.9, 148.6, 148.4, 142.7, 137.5, 137.3, 135.2,
134.2, 131.9, 130.8, 126.6, 126.2, 125.4, 124.8, 124.1, 122.9, 61.9, 31.3. HRMS (ESI) calcd
for C21H17O2S [M + H]+ 333.0944, found, 333.0943.
(Z)-2-((5-(3-Aminophenyl)thiophen-2-yl)methylene)-2,3-dihydro-1H-inden-1-
one (38). Prepared by Method 3 with intermediate 36A (152 mg, 0.5 mmol) and 3-
aminophenylboronic acid (137 mg, 1.0 mmol) to afford compound 38 as a yellow solid
(100 mg, 68% yield). 1H NMR (600 MHz, DMSO-d6) δ 7.80 (t, J = 1.8 Hz, 1H), 7.78 (d, J
= 7.2 Hz, 1H), 7.72 (d, J = 3.6 Hz, 2H), 7.68 (d, J = 4.2 Hz, 1H), 7.53 (d, J = 3.6 Hz, 1H),
7.50-7.48 (m, 1H), 7.11 (t, J = 7.8 Hz, 1H), 6.96 (t, J = 1.8 Hz, 1H), 6.94 (d, J = 7.2 Hz,
1H), 6.59 (dd, J1 = 1.8 Hz, J2 = 7.8 Hz, 1H), 5.33 (s, 2H), 4.01 (s, 2H); 13C NMR (150
MHz, DMSO-d6) δ 193.0, 150.6, 149.9, 149.6, 138.2, 136.2, 135.2, 132.7, 130.2, 127.3,
126.6, 124.7, 123.9, 114.9, 13.7, 111.1, 32.4. HRMS (ESI) calcd for C20H16NOS [M + H]+
318.0947, found, 318.0937.
(Z)-2-((5-(4-Hydroxy-3-methoxyphenyl)thiophen-2-yl)methylene)-2,3-dihydro-
1H-inden-1-one (39). Prepared by Method 3 with intermediate 36A (152 mg, 0.5 mmol)
and 4-hydroxy-3-methoxyphenylboronic acid pinacol ester (250 mg, 1.0 mmol) to afford
compound 39 as a red solid (124 mg, 71% yield). 1H NMR (600 MHz, DMSO-d6) δ 7.77
(d, J = 8.4 Hz, 2H), 7.75 – 7.69 (m, 2H), 7.67 (d, J = 3.6 Hz, 1H), 7.56 (d, J = 3.6 Hz,
1H), 7.49 (td, J1 = 1.2 Hz, J2 = 7.8 Hz, 1H), 7.28 (d, J = 1.8 Hz, 1H), 7.21 (dd, J1 = 1.8
Hz, J2 = 7.8 Hz, 1H), 6.85 (d, J = 7.8 Hz, 1H), 4.01 (s, 2H), 3.88 (s, 3H); 13C NMR (150
MHz, DMSO-d6) δ 193.0, 150.7, 149.6, 148.7, 138.5, 137.3, 136.4, 135.1, 132.1 128.2,
127.2, 126.7, 124.0, 123.9, 119.5, 116.6, 110.3, 56.3, 32.3. HRMS (ESI) calcd for
C21H17O3S [M + H]+ 349.0893, found, 349.0881.
(Z)-2-((5-(4-(Dimethylamino)phenyl)thiophen-2-yl)methylene)-2,3-dihydro-1H-
inden-1-one (40). Prepared by Method 3 with intermediate 36A (152 mg, 0.5 mmol) and
4- (N,N-dimethylamino)phenylboronic acid pinacol ester (247 mg, 1.0 mmol) to afford
compound 40 as a red solid (118 mg, 68% yield). 1H NMR (600 MHz, DMSO-d6) δ 7.77
(d, J = 7.8 Hz, 2H), 7.74 – 7.71 (m, 2H), 7.65 (d, J = 4.2 Hz, 1H), 7.61 (d, J = 9.0 Hz, 2H),
7.50 – 7.48 (m, 2H), 6.78 (d, J = 8.4 Hz, 2H), 4.01 (s, 2H), 2.99 (s, 6H); 13C NMR (150
MHz, CDCl3 + DMSO-d6) δ 190.8, 149.2, 148.8, 147.6, 147.1, 136.6, 134.4, 133.8, 133.7,
129.3, 125.0, 124.9, 120.1, 119.2, 110.5, 38.3, 30.4. HRMS (ESI) calcd for C22H20NOS
[M + H]+ 346.1260, found, 346.1259.
(Z)-2-((5-(2-(Dimethylamino)pyrimidin-5-yl)thiophen-2-yl)methylene)-2,3-
dihydro-1H-inden-1-one (41). Prepared by Method 3 with intermediate 36A (152 mg, 0.5
mmol) and 2-(dimethylamino)pyrimidine-5-boronic acid pinacol ester (249 mg, 1.0 mmol)
to afford compound 41 as a red solid (72 mg, 40%). 1H NMR (600 MHz, DMSO-d6) δ 8.76
(s, 2H), 7.78 (s, 1H), 7.72 – 7.70 (m, 3H), 7.58 (d, J = 4.2 Hz, 1H), 7.50 – 7.48 (m, 1H),
4.00 (s, 2H), 3.19 (s, 6H); 13C NMR (150 MHz, CDCl3) δ 193.6, 161.2, 154.8, 148.9,
144.4, 138.7, 138.1, 134.5, 134.4, 132.2, 127.6, 126.5, 126.2, 124.2, 122.6, 115.9, 37.2,
32.3. HRMS (ESI) calcd for C20H18N3OS [M + H]+ 348.1165, found, 348.1165.
(Z)-2-((5-(2,4-Dimethoxypyrimidin-5-yl)thiophen-2-yl)methylene)-2,3-dihydro-
1H-inden-1-one (42). Prepared by Method 3 with intermediate 36A (152 mg, 0.5 mmol)
and 2,4-dimethoxy-5-pyrimidinylboronic acid (184 mg, 1.0 mmol) to afford compound 42
as a red solid (124 mg, 68 % yield). 1H NMR (600 MHz, CDCl3) δ 8.59 (s, 1H), 7.89 (d, J
= 7.2 Hz, 1H), 7.85 (s, 1H), 7.62 (t, J = 7.2 Hz, 1H), 7.58 (d, J = 7.8 Hz, 1H), 7.48 (d, J =
4.2 Hz, 1H), 7.43 (t, J = 7.2 Hz, 1H), 7.40 (d, J = 4.2 Hz, 1H), 4.13(s, 3H), 4.06 (s, 3H),
3.97 (s, 2H); 13C NMR (150 MHz, CDCl3) δ 193.6, 166.8, 164.5, 156.3, 148.9, 139.9,
139.4, 138.6, 134.5, 133.6, 132.7, 127.7, 126.5 126.3, 126.2, 124.3, 109.9, 55.1, 54.5,
32.4. HRMS (ESI) calcd for C20H17N2O3S [M + H]+ 365.0954, found, 365.0939.
(Z)-2-((5-(2-(Dimethylamino)pyrimidin-5-yl)thiophen-2-yl)methylene)-6-
hydroxy-2,3-dihydro-1H-inden-1-one (43). Prepared by Method 3 with intermediate 36B
(160 mg, 0.5 mmol) and 2-(dimethylamino)pyrimidine-5-boronic acid pinacol ester (249
mg, 1.0 mmol) to afford compound 43 as a red solid (79 mg, 44% yield). 1H NMR (600
MHz, CDCl3) δ 8.75 (s, 2H), 7.68 (s, 1H), 7.64 (d, J = 3.6 Hz, 1H), 7.56 (d, J = 3.6 Hz,
1H), 7.39 (d, J = 7.8 Hz, 1H), 7.04 (d, J = 8.4 Hz, 1H), 6.96 (s, 1H), 3.82 (s, 2H), 3.19 (s,
6H); 13C NMR (150 MHz, DMSO-d6 + Methanol-d4) δ 193.9, 161.5, 158.4, 154.9, 143.5,
139.6, 138.2, 134.9, 134.6, 127.6, 126.4, 124.5, 123.4, 116.1, 109.9, 36.7, 31.3. HRMS
(ESI) calcd for C20H17N3O2S [M + K]+ 402.0673, found, 402.0673.
(Z)-6-Hydroxy-2-((5-(4-(hydroxymethyl)phenyl)thiophen-2-yl)methylene)-2,3-
dihydro-1H-inden-1-one (44). Prepared by Method 3 with intermediate 36B (160 mg, 0.5
mmol) and 4-(hydroxymethyl)phenylboronic acid pinacol ester (234 mg, 1.0 mmol) to
afford compound 44 as a brown solid (131 mg, 75 % yield). 1H NMR (500 MHz, DMSO-
d6) δ 7.73 (d, J = 8.0 Hz, 2H), 7.67 (s, 1H), 7.64 (s, 2H), 7.40 (d, J = 8.5 Hz, 2H), 7.34 (d,
J = 8.0 Hz, 1H), 6.99 (dd, J1 = 2.5 Hz, J2 = 8.5 Hz, 1H), 6.89 (d, J = 2.0 Hz, 1H), 4.53
(s, 2H), 3.82 (s, 2H); 13C NMR (125 MHz, DMSO-d6) δ 192.4, 147.7, 142.6, 138.6,
137.9, 134.5, 133.8, 130.9, 126.6, 126.1, 124.7, 124.0, 123.9, 108.0, 61.9, 30.5. HRMS
(ESI) calcd for C21H17O3S [M + H]+ 349.0893, found, 349.0793.
(Z)-2-((4-Bromothiophen-2-yl)methylene)-2,3-dihydro-1H-inden-1-one (45).
Prepared by Method 2 with 1- indanone (650 mg, 5.0 mmol) and 4-bromo-2-
thiophenecarboxaldehyde (1.4 g, 7.5 mmol) to afford intermediate 45 as a yellow solid
(1.5 g, 92%). 1H NMR (500 MHz, CDCl3) δ 7.90 (d, J = 7.5 Hz, 1H), 7.75 (s, 1H), 7.64
(td, J1 = 1.0 Hz, J2 = 7.5 Hz, 1H), 7.57 (d, J = 7.5 Hz, 1H), 7.45 (s, 1H), 7.43 (d, J = 7.0
Hz, 1H), 7.33 (s, 1H), 3.92 (s, 2H); 13C NMR (125 MHz, CDCl3) δ 193.5, 148.9, 140.8,
138.2, 134.9, 134.23, 134.2, 127.9, 127.1, 126.3, 124.9, 124.5, 111.6, 32.2. HRMS (ESI)
calcd for C14H10BrOS [M + H]+ 304.9630, found, 304.9625.
(Z)-2-((4-(4-(Hydroxymethyl)phenyl)thiophen-2-yl)methylene)-2,3-dihydro-1H-
inden-1-one (46). Prepared by Method 3 with intermediate 45 (152 mg, 0.5 mmol) and 4-
(hydroxymethyl)phenylboronic acid pinacol ester (234 mg, 1.0 mmol) to afford compound
46 as a brown solid (110 mg, 66% yield). 1H NMR (500 MHz, DMSO-d6) δ 8.24 (s, 1H),
8.11 (s, 1H), 7.82 (s, 1H), 7.78 (d, J = 7.5 Hz, 1H), 7.76 – 7.69 (m, 4H), 7.51-7.48 (m, 1H),
7.39 (d, J = 8.0 Hz, 2H), 5.23 (s, 1H), 4.53 (s, 2H), 4.02 (s, 2H); 13C NMR (125 MHz,
DMSO-d6) δ 192.1, 148.7, 141.7, 141.5, 139.1, 137.1, 134.3, 132.5, 132.1, 127.2, 126.4,
126.2, 125.8, 125.2, 125.1, 122.9, 61.9, 31.1. HRMS (ESI) calcd for C21H17O2S [M + H]+
333.0944, found, 333.0943.
(Z)-2-((4-(Pyridin-3-yl)thiophen-2-yl)methylene)-2,3-dihydro-1H-inden-1-one
(47). Prepared by Method 3 with intermediate 45 (152 mg, 0.5 mmol) and 3-
pyridineboronic acid pinacol ester (234 mg, 1.0 mmol) to afford compound 47 as a red
solid (100 mg, 66% yield). 1H NMR (500 MHz, DMSO-d6) δ 8.03 (s, 1H), 8.00 (s, 1H),
7.80 (s, 1H), 7.70 (d, J = 7.5 Hz, 1H), 7.74 – 7.71 (m, 3H), 7.57 (d, J = 8.5 Hz, 2H), 7.50-
7.47 (m, 1H), 6.82 (d, J = 8.5 Hz, 2H), 3.99 (s, 2H); 13C NMR (125 MHz, DMSO-d6) δ
193.2, 149.7, 139.9, 138.3, 135.3, 133.3, 132.7, 128.2, 127.8, 127.3, 126.4, 123.9, 116.3,
32.2. HRMS (ESI) calcd for C19H14NOS [M + H]+ 304.0791, found, 304.0788.
(Z)-2-((5-Bromothiophen-2-yl)methylene)-3,4-dihydronaphthalen-1(2H)-one
(48). Prepared by Method 1 with alpha-tetralone (730 mg, 5.0 mmol) and 5-bromo-2-
thiophenecarboxaldehyde (1.4 g, 7.5 mmol) to afford intermediate 48 as a yellow solid (1.3
g, 82% yield). 1H NMR (600 MHz, CDCl3) δ 8.09 (d, J = 7.8 Hz, 1H), 7.90 (s, 1H), 7.49 (t,
J = 7.2 Hz, 1H), 7.36 (t, J = 7.2 Hz, 1H), 7.27 (d, J = 7.8 Hz, 1H), 7.13 (d, J = 4.2 Hz, 1H),
7.09 (d, J = 4.2 Hz, 1H), 3.11 (t, J = 6.6 Hz, 2H), 3.02 (t, J = 6.6 Hz, 2H); 13C NMR (150
MHz, CDCl3) δ 186.9, 142.9, 140.7, 133.5, 133.3, 132.2, 130.5, 128.8, 128.2, 128.1, 127.1,
116.9, 28.0, 27.2. HRMS (ESI) calcd for C15H12BrOS [M + H]+ 318.9787, found,
318.9788.
(Z)-2-((5-(4-(Hydroxymethyl)phenyl)thiophen-2-yl)methylene)-3,4-
dihydronaphthalen-1(2H)-one (49). Prepared by Method 3 with intermediate 48 (159
mg, 0.5 mmol) and 4-hydroxy-3-methoxyphenylboronic acid pinacol ester (234 mg, 1.0
mmol) to afford compound 49 as a red solid (125 mg, 72% yield). 1H NMR (600 MHz,
CDCl3) δ 8.13 (d, J = 7.2 Hz, 1H), 8.03 (s, 1H), 7.67 (d, J = 7.8 Hz, 2H), 7.51 (t, J = 7.8
Hz, 1H), 7.43 (d, J = 7.8 Hz, 2H), 7.38 (d, J = 4.2 Hz, 2H), 7.36 (d, J = 4.2 Hz, 1H), 7.30
(d, J = 7.8 Hz, 1H), 4.75 (d, J = 5.4 Hz, 2H), 3.27 (t, J = 6.6 Hz, 2H), 3.07 (t, J = 6.6 Hz,
2H), 1.73 (t, J = 5.4 Hz, 1H); 13C NMR (150 MHz, CDCl3) δ 187.1, 148.0, 143.0, 138.5,
134.8, 133.1, 129.6, 128.2, 128.1, 127.6, 127.1, 126.1, 123.6, 64.9, 28.2, 27.2. HRMS
(ESI) calcd for C22H19O2S [M + H]+ 347.1100, found, 347.1089.
(Z)-2-((5-(4-Hydroxy-3-methoxyphenyl)thiophen-2-yl)methylene)-3,4-
dihydronaphthalen-1(2H)-one (50). Prepared by Method 3 with intermediate 48 (159
mg, 0.5 mmol) and 4-hydroxy-3-methoxyphenylboronic acid pinacol ester (250 mg, 1.0
mmol) to afford compound 50 as a red solid (138 mg, 76% yield). 1H NMR (600 MHz,
DMSO-d6) δ 7.93 (d, J = 7.2 Hz, 1H), 7.88 (s, 1H), 7.55 (td, J1 = 1.2 Hz, J2 = 7.2 Hz, 1H),
7.51 (d, J = 3.6 Hz, 1H), 7.39 (t, J = 7.8 Hz, 2H), 7.27 (d, J = 3.6 Hz, 1H), 7.06 (dd, J1 =
2.4 Hz, J2 = 8.4 Hz, 1H), 7.02 (s, 1H), 6.47 (s, 1H), 3.75 (s, 3H), 3.15 (t, J = 6.6 Hz, 2H),
3.03 (t, J = 6.6 Hz, 2H); 13C NMR (150 MHz, CDCl3) δ 193.0, 150.7, 149.6, 148.7, 138.5,
136.4, 135.1, 132.1, 128.2, 127.2, 126.7, 124.0, 123.9, 119.5, 116.6, 110.3, 56.3, 32.3.
HRMS (ESI) calcd for C22H19O3S [M + H]+ 363.1049, found, 363.1039.
(Z)-2-((5-(2-(Dimethylamino)pyrimidin-5-yl)thiophen-2-yl)methylene)-3,4-
dihydronaphthalen-1(2H)-one (51). Prepared by Method 3 with intermediate 48 (159
mg, 0.5 mmol) and 2-(dimethylamino)pyrimidine-5-boronic acid pinacol ester (249 mg,
1.0 mmol) to afford compound 51 as a red solid (130 mg, 72% yield). 1H NMR (600 MHz,
CDCl3) δ 8.58 (s, 2H), 8.11 (d, J = 7.8 Hz, 1H), 8.01 (s, 1H), 7.49 (t, J = 7.2 Hz, 1H),
7.37-7.36 (m, 2H), 7.28 (d, J = 7.8 Hz, 1H), 7.18 (d, J = 3.0 Hz, 1H), 3.25 (s, 8H), 3.06 (t,
J = 6.6 Hz, 2H); 13C NMR (150 MHz, CDCl3) δ 187.0, 161.5, 154.9, 143.1, 142.9, 137.5,
134.9, 133.8, 133.1, 131.2, 129.5, 128.1, 128.0, 127.1, 122.1, 116.1, 37.3, 28.2, 27.1.
HRMS (ESI) calcd for C21H20N3OS [M + H]+ 362.1322, found, 362.1310.
2-((1-Chloro-3,4-dihydronaphthalen-2-yl)methylene)-1H-indene-1,3(2H)-dione
(52). Prepared by Method 2 with 1,3-indandione (146 mg, 1.0 mmol) and 1-chloro-3,4-
dihydro-2-naphthalenecarbaldehyde (193 mg, 1.0 mmol) to afford compound 52 as a
brown solid (268 mg, 81% yield). 1H NMR (600 MHz, CDCl3) δ 7.95 (s, 1H), 7.69-7.67
(m, 1H), 7.63-7.62 (m, 1H), 7.48-7.46 (m, 3H), 7.03-6.98 (m, 2H), 6.91-6.89 (m, 1H),
2.84 (t, J = 7.2, Hz, 2H), 2.60 (t, J = 7.2, Hz, 2H); 13C NMR (150 MHz, CDCl3) δ 189.6,
188.3, 142.5, 141.9, 140.0, 138.6, 134.9, 134.8, 132.4, 131.9, 130.4, 129.4, 126.9, 126.7,
126.5, 122.9, 122.8, 28.7, 27.6. HRMS (ESI) calcd for C20H14ClO2 [M + H]+ 321.0677,
found, 321.0676.
2-((6-Methyl-4-oxo-4H-chromen-3-yl)methylene)-1H-indene-1,3(2H)-dione (53).
Prepared by Method 2 with 1,3- indandione (146 mg, 1.0 mmol) and 3-formyl-6-
methylchromone (188 mg, 1.0 mmol) to afford compound 53 as a yellow solid (253 mg,
80% yield). 1H NMR (500 MHz, CDCl3) δ 10.35 (s, 1H), 8.39 (s, 1H), 8.05 (d, J = 1.0 Hz,
1H), 7.99 – 7.97 (m, 2H), 7.83 – 7.79 (m, 2H), 7.52 (dd, J1 = 1.5 Hz, J2 = 7.0 Hz, 1H),
7.43 (d, J = 7.0 Hz, 1H), 2.46 (s, 3H); 13C NMR (125 MHz, CDCl3) δ 190.1, 189.1,
175.3, 163.4, 154.3, 142.1, 140.3, 136.7, 136.6, 135.6, 135.5, 135.3, 129.0, 125.9, 123.6,
123.5, 123.3, 118.4, 118.3, 21.0. HRMS (ESI) calcd for C20H13O4 [M + H]+ 317.0808,
found, 317.0808.
2-((6-Bromo-4-oxo-4H-chromen-3-yl)methylene)-1H-indene-1,3(2H)-dione (54).
Prepared by Method 2 with 1,3- indandione (100 mg, 0.7 mmol) and 6-bromo-3-
formylchromone (173 mg, 0.7 mmol) to afford compound 54 as a yellow solid (230 mg,
72% yield). 1H NMR (500 MHz, CDCl3) δ 10.35 (s, 1H), 8.39 (s, 1H), 8.05 (d, J = 1.0 Hz,
1H), 7.99 – 7.97 (m, 2H), 7.83 – 7.79 (m, 2H), 7.52 (dd, J1 = 1.5 Hz, J2 = 7.0 Hz, 1H),
7.43 (d, J = 7.0 Hz, 1H), 2.46 (s, 3H); 13C NMR (150 MHz, CDCl3 + DMSO-d6) δ
194.4, 193.6, 178.7, 159.7, 146.9, 144.9, 142.7, 142.6, 141.0, 140.9, 139.4, 139.2, 134.7,
133.3, 133.2, 129.9, 128.5, 126.4, 124.4, 123.8, 122.9, 116.1. HRMS (ESI) calcd for
C19H10BrO4 [M + H]+ 380.9757, found, 380.9756.
2-((1H-Indol-2-yl)methylene)-1H-indene-1,3(2H)-dione (55). Prepared by Method
2 with 1,3-indandione (146 mg, mmol) and indole-2-carboxaldehyde (145 mg, 1.0 mmol)
to afford compound 55 as a yellow solid (255 mg, 81% yield). 1H NMR (500 MHz,
DMSO-d6) δ 12.2 (s, 1H), 8.03–8.01 (m, 1H), 7.96 – 7.95 (m, 3H), 7.91 (d, J = 5.5 Hz,
1H), 7.75 – 7.71 (m, 3H), 7.41 – 7.38 (m, 1H), 7.16 – 7.12 (m, 1H); 13C NMR (125 MHz,
DMSO-d6) δ 191.2, 189.8, 141.6, 140.4, 139.9, 136.4, 133.8, 133.4, 128.5, 128.1, 124.9,
123.5, 123.3, 122.9, 121.6, 119.5, 113.6. HRMS (ESI) calcd for C18H12NO2 [M + H]+
274.0863, found, 274.0862.
2-((3-(4-Bromophenyl)isoxazol-5-yl)methylene)-1H-indene-1,3(2H)-dione (56).
Prepared by Method 2 with 1,3- indandione (146 mg, 1.0 mmol) and 3-(4-
bromophenyl)isoxazole-5-carboxaldehyde (252 mg, 1.0 mmol) to afford compound 56 as a
yellow solid (238 mg, 63% yield). 1H NMR (500 MHz, CDCl3) δ 8.36 (s, 1H), 8.07. – 8.05
(m, 2H), 8.02 – 8.01 (m, 2H), 7.92 (d, J = 8.5 Hz, 2H), 7.79 (d, J = 8.0 Hz, 2H), 7.65 (s,
1H); 13C NMR (125 MHz, CDCl3) δ 188.4, 187.9, 165.7, 162.8, 142.8, 140.8, 137.1, 136.9,
132.9, 132.8, 129.2, 127.4, 124.7, 124.0, 123.9, 122.9, 110.1. HRMS (ESI) calcd for
C19H11BrNO3 [M + H]+ 379.9917, found, 379.9910.
(Z)-3-((6-Hydroxy-1-oxo-1,3-dihydro-2H-inden-2-ylidene)methyl)-6-methyl-4H-
chromen-4-one (57). Prepared by Method 1 with 6-hydro-indanone (148 mg, 1.0 mmol)
and 3-formyl-6-methylchromone (188 mg, 1.0 mmol) to afford compound 57 as a yellow
solid (290 mg, 82% yield). 1H NMR (600 MHz, DMSO-d6) δ 9.87 (s, 1H), 8.82 (s, 1H),
7.90 (d, J = 0.6 Hz, 1H), 7.65 (dd, J1 = 1.8 Hz, J2 = 8.4 Hz, 1H), 7.61 (d, J = 8.4 Hz,
1H), 7.58 (t, J = 1.8 Hz, 1H), 7.44 (d, J = 7.8 Hz, 1H), 7.14 (dd, J1 = 2.4 Hz, J2 = 7.8 Hz,
1H), 7.07 (d, J = 2.4 Hz, 1H), 3.90 (d, J = 1.8 Hz, 2H), 2.43 (s, 3H); 13C NMR (150 MHz,
DMSO-d6) δ 193.2, 175.5, 158.0, 157.6, 154.2, 140.9, 138.9, 136.9, 136.2, 127.8, 125.2,
124.1, 123.2, 122.8, 119.6, 118.8, 108.7, 31.4, 20.9. HRMS (ESI) calcd for C20H15O4 [M +
H]+ 319.0965, found, 319.0964.
(Z)-3-((6-Methyl-4-oxo-4H-chromen-2-yl)methylene)indolin-2-one (58).
Prepared by Method 1 with 2-oxindole (200 mg, 1.5 mmol) and 3-formyl-6-
methylchromone (283 mg, 1.5 mmol) to afford compound 58 as a yellow solid (310 mg,
68% yield). 1H NMR (600 MHz, DMSO-d6) δ 10.74 (s, 1H), 9.95 (d, J = 0.6 Hz, 1H), 7.95
(s, 1H), 7.78 (s, 1H), 7.71 – 7.64 (m, 3H), 7.25 (td, J1 = 1.2 Hz, J2 = 7.8 Hz, 1H), 7.02 (t,
J = 7.8 Hz, 1H), 6.85 (d, J = 8.4 Hz, 1H), 2.46 (s, 3H); 13C NMR (150 MHz, DMSO-d6) δ
175.4, 168.0, 160.4, 154.3, 141.2, 136.3, 136.1, 129.9, 127.9, 125.8, 125.2, 124.6, 123.3,
121.9, 120.4, 119.0, 117.6, 110.1, 20.9. HRMS (ESI) calcd for C19H14NO3 [M + H]+
304.0968, found, 304.0968.
4.2. α-Synuclein fibril formation
Fibrils were made from α-synuclein peptide (R-peptide, Bogart, GA) as follows: α-
Synuclein peptide (0.5 mg) was suspended in 0.2 ml water and transferred into a centricon
(10000 MWCO). 0.2 mL phosphate buffer (10 mM, pH 7.5) was added to this suspension
was added, and any soluble materials were removed by spinning for 5 minutes in a
centrifuge (18000g). The process was repeated four times. After the fourth time, the
peptide was transferred into a microtube (200 µl), and 2.5 µl of 300 mM MnCl2 (made in
water) was added. The resulting mixture was stirred at 40 ⁰C in an incubator for seven
days until the solution turned hazy. The fibrils were spun down at 21000 rcf for six
minutes. The supernatant was decanted and tested for monomer concentration using the
BCA assay, and the fibril pellet was resuspended in 200 µl PBS buffer (pH = 7.4).
Analysis BCA assay data showed a final concentration of peptide 129.6 µM in fibrils.
4.3. α-Synuclein fibril/ligand binding assay
The fluorescence (F1) of ligand solutions at various concentrations (0.1 nM to 10 µM) in
PBS (pH = 7.5, 196.2 µL) were recorded and then transferred into microtube containing α-
synuclein fibrils (3.8 µL, 2.5 µM final concentration). The mixture was incubated at 37 ⁰C
for 1 hour with shaking. Then the mixture was spun down at 21000g for 15 minutes to
separate the fibrils. The supernatant was decanted, and its fluorescence (F2) was measured. The
fluorescence (F3) of the bound fraction was obtained by subtracting F2 from F1. All data points
were performed in triplicate. The dissociation constant (Kd) was determined by fitting the
data to the equation Y = Bmax × X/(X + Kd), [where Y = fluorescence units of the bound
fraction (F3) and X = ligand concentration], by nonlinear regression using MATLAB
software (R2019B).
4.4. Aβ fibrils formation
Aβ (1–40) peptide (R-Peptide, Bogart, GA), was dissolved in PBS, pH 7.4, to a final
concentration of 433 µg/ml (100 µM). The solution was stirred using a magnetic stir bar at
700 rpm for four days at room temperature to drive fibrils' formation. The fibrils were spun
down at 21000 rcf for six minutes. The supernatant was decanted and tested for monomer
concentration using the BCA assay. BCA assay data showed a final concentration of
peptide 129.6 µM in fibrils. The stock solution was aliquoted and stored at -80 oC for future
use. The stock solutions were stirred thoroughly before removing aliquots for binding
assays, to maintain a homogenous suspension of fibrils.
4.5. Aβ fibril/ligand binding assay
Ligand solutions at various concentrations from 1 nM to 100 µM in PBS (pH = 7.5, 180
µL) ware added into microtube containing Aβ fibrils (20 µL, 10 µM final concentration).
The mixture was incubated at 37 ⁰C for 1 hour with shaking and then spun down at
21000g for 12 minutes to separate the fibrils. The precipitate was washed twice with Tris-
HCl and resuspended in 200 µL buffer. Fluorescence was measured in a SpectraMax-384
plate reader using excitation and emission maxima of the molecule. All data points were
performed in triplicate. The dissociation constant (Kd) was determined by fitting the data
to the equation Y = Bmax × X/(X + Kd), by nonlinear regression using MATLAB software
(R2019B).
4.6. Labeling of α-synuclein aggregates in Human PD Brain Tissue
Confirmed PD and AD (as well as control) tissue specimens were obtained from the NIH
Brain & Tissue Repository-California, Human Brain & Spinal Fluid Resource Center, VA
West Los Angeles Medical Center, Los Angeles, California, which is supported in part by
National Institutes of Health and the US Department of Veterans Affairs.
Fresh frozen tissue from the frontal cortex was embedded in Tissue-Tek O.C.T. and kept in
the liquid nitrogen for 30 minutes. The embedded tissue was sliced into 30 µm thick
sections with Lecia Biosystems Cryostats under -20 oC and mounted onto microscope
slides, washed with 1× PBST, and then fixed with 10% formalin solution for 20 minutes.
Following fixation, the section was washed with 1× PBS (three times) and permeablized
with 0.1% Triton-X 100 for ten minutes, followed by a washed with 1× PBS. Tissue was
then incubated with 2% normal Donkey serum at room temperature for one hour followed
by incubation with antibody Syn211(Ascites free) (1:1000 in 1% Donkey serum) overnight
at 4 °C. Tissue was washed with 1× PBS and incubated for two hours at room temperature
with Alexa Fluor 647 labeled secondary antibody (1:200 in PBS). After a washed with 1×
PBST, tissue was incubated at room temperature for thirty minutes with 5 µM of test
compound dissolved in PBS. The section was washed with 1× PBST, treated with
TrueBlack Linpofuscin Autofluorescence Quencher (1:20 in ethanol) for two minutes,
washed with 1× PBS, coverslipped, and imaged in Olympus IX81 microscope using
standard excitation/emission filters.
4.7. Staining of amyloid-β plaques in human AD brain tissue
Fresh frozen tissue from the frontal cortex was embedded with Tissue-Tek O.C.T.
Compound and kept in the liquid nitrogen for 30 minutes. The embedded tissue was sliced
into 30 µm thick sections with Lecia Biosystems Cryostats under -20 oC and mounted onto
microscope slides. The section was washed with 1× PBST and then fixed with 10%
formalin solution for twenty minutes. It was then permeablized with 0.1% Triton-X 100
for ten minutes, incubated with 2% normal donkey serum at room temperature for one
hour, followed by incubation with purified anti-β-Amyloid, 17-24 Antibody (Covance,
4G8) (1:500 in 1% Donkey serum) overnight at 4 °C. The section was incubated for two
hours at room temperature with Alexa Fluor 647 labeled secondary (1:200 in PBS) and then
treated with the compound to be tested. Each tissue section was incubated at room
temperature for thirty minutes with 5 µM of test compound dissolved in PBS and then
treated with TrueBlack Linpofuscin Autofluorescence Quencher (Biotium, 1:20 in ethanol)
for two minutes. Finally, tissue was washed, coverslipped, and imaged in an Olympus
IX81 microscope using standard excitation/emission filters.
4.8. Determination of Pearson's Correlation Coefficients (PCC) in tissue mages.
PCC values in the composite images were determined using the ImarisColoc module of
IMARIS x64 version 9. The analysis was carried out over the entire frame of the image. A
threshold for each fluorophore channel, ligand (594), and antibody (647) was defined by
increasing the minimums in the LUT distribution, in a way to define the true signal. A
region of interest was selected by masking the background, and all the region except the
signal was masked off. All voxels excluding the region of interest defined by the masked
channel were ignored for colocalization analysis. A colocalization channel was created
based on the overlapping voxels using the software. Statistics for the colocalized channel
generated by the software resulted in the respective Pearson's correlation coefficients.
ASSOCIATED CONTENT
Supporting Information. Supporting Information is available
1H and 13C NMR spectra of all compounds
2D NMR data for NOE determination of double bond geometry
Saturation α-syn and Aβ fibril binding curves to determine Kd values
Determination of fluorimetric properties of the lead ligands
Samples of microscopy images from control brain tissue with no pathology
HPLC profiles of lead compounds
AUTHOR INFORMATION
*Corresponding Author, E-mail: [email protected] . ORCID: 0000-0001-8803-
5643
Financial Conflict of Interests: XS and PA declare no competing financial interest. ZS is a
stockholder at Alzeca Biosciences, Inc; JE is a stockholder at Alzeca Biosciences, Inc; AA
is a stockholder and consultant at Alzeca Biosciences, Inc; ET is a stockholder and
consultant at Alzeca Biosciences, Inc.
ACKNOWLEDGMENTS
A grant funded this work from Alzeca Biosciences, Inc. to AA.
Confirmed PD and AD (as well as control) tissue specimens were obtained from the NIH
Brain & Tissue Repository-California, Human Brain & Spinal Fluid Resource Center, VA
West Los Angeles Medical Center, Los Angeles, California, which is supported in part by
National Institutes of Health and the US Department of Veterans Affairs.
The authors also acknowledge the NIH Neurobiobank for facilitating tissue acquisition.
REFERENCES
1. Ross, C. A.; Poirier, M. A. Protein Aggregation and Neurodegenerative Disease. Nat
Med 2004, 10 Suppl, S10–7.
2. Irvine, G. B.; El, O. M. Protein Aggregation in the Brain: the Molecular Basis for
Alzheimer's and Parkinson's Diseases. Mol Med 2008, 14(7-8), 451.
3. Gelb, D. J.; Oliver, E.; Gilman, S. Diagnostic Criteria for Parkinson Disease. Archives
on Neurology 1999, 56 (1), 33.
4. Braak, H.; Del Tredici, K. Neuropathological Staging of Brain Pathology in Sporadic
Parkinson's Disease: Separating the Wheat from the Chaff. Journal of Parkinson's Disease
2017, 7, S71.
5. Braak, H.; Ghebremedhin, E.; Rüb, U.; Bratzke, H.; Del Tredici, K. Stages in the
Development of Parkinson's Disease-Related Pathology. Cell and Tissue Research 2004,
318, 121.
6. Braak, H.; Bohl, J. R.; Müller, C. M.; Rüb, U.; Del Tredici, K. Stanley Fahn Lecture
2005: the Staging Procedure for the Inclusion Body Pathology Associated with Sporadic
Parkinson's Disease Reconsidered. Movement Disorders 2006, 21, 2042.
7. Ingelsson, M. Alpha-Synuclein Oligomers—Neurotoxic Molecules in Parkinson's
Disease and Other Lewy Body Disorders. Frontiers in Neuroscience 2016, 10, 16.
8. Kim, W. S.; Kågedal, K.; Halliday, G. M. Alpha-Synuclein Biology in Lewy Body
Diseases. Nature Biotechnology 2014, 6, 1186.
9. Beach, T. G.; Consortium, T. A. P. D.; Adler, C. H.; Lue, L.; Sue, L. I.; Bachalakuri, J.;
Henry-Watson, J.; Sasse, J.; Boyer, S.; Shirohi, S.; Brooks, R.; Eschbacher, J.; White, C.
L.; Akiyama, H.; Caviness, J.; Shill, H. A.; Connor, D. J.; Sabbagh, M. N.; Walker, D. G.
Unified Staging System for Lewy Body Disorders: Correlation with Nigrostriatal
Degeneration, Cognitive Impairment and Motor Dysfunction. Molecular Neurobiology
2009, 117, 613.
10. Kotzbauer, P. T.; Cairns, N. J.; Campbell, M. C.; Willis, A. W.; Racette, B. A.;
Tabbal, S. D.; Perlmutter, J. S. Pathologic Accumulation of α-Synuclein and Aβ in
Parkinson Disease Patients with Dementia. Archives of Neurology 2012, 69, 1326.
11. Morris, E.; Chalkidou, A.; Hammers, A.; Peacock, J.; Summers, J.; Keevil, S.
Diagnostic Accuracy of 18F Amyloid PET Tracers for the Diagnosis of Alzheimer's
Disease: a Systematic Review and Meta-Analysis. European Journal of Nuclear Medicine
and Molecular Imaging 2015, 43, 374.
12. Bischof, G. N.; Endepols, H.; van Eimeren, T.; Drzezga, A. Tau-Imaging in
Neurodegeneration. Methods 2017, 130, 114.
13. Mathis, C. A.; Lopresti, B. J.; Ikonomovic, M. D.; Klunk, W. E. Small-Molecule PET
Tracers for Imaging Proteinopathies. Seminars in Nuclear Medicine 2017, 47, 553.
14. Kotzbauer, P. T.; Tu, Z.; Mach, R. H. Current Status of the Development of PET
Radiotracers for Imaging Alpha Synuclein Aggregates in Lewy Bodies and Lewy Neurites.
Clinical and Translational Imaging 2016, 5, 3.
15. Shah, M.; Seibyl, J.; Cartier, A.; Bhatt, R.; Catafau, A. M. Molecular Imaging Insights
into Neurodegeneration: Focus on -Synuclein Radiotracers. Journal of Nuclear Medicine
2014, 55, 1397.
16. Pike, V. W. Considerations in the Development of Reversibly Binding PET
Radioligands for Brain Imaging. Current Medicinal Chemistry 2016, 23, 1818–1869.
17. Laruelle, M. Relationships between Radiotracer Properties and Image Quality in
Molecular Imaging of the Brain with Positron Emission Tomography. Advanced Drug
Delivery Reviews 2003, 5, 363.
18. Ono, M.; Doi, Y.; Watanabe, H.; Ihara, M.; Ozaki, A.; Saji, H. Structure–Activity
Relationships of Radioiodinated Diphenyl Derivatives with Different Conjugated Double
Bonds as Ligands for Α-Synuclein Aggregates. RSC Advances 2016, 6, 44305.
19. Chu, W.; Zhou, D.; Gaba, V.; Liu, J.; Li, S.; Peng, X.; Xu, J.; Dhavale, D.; Bagchi, D.
P.; d'Avignon, A.; Shakerdge, N. B.; Bacskai, B. J.; Tu, Z.; Kotzbauer, P. T.; Mach, R. H.
Design, Synthesis, and Characterization of 3-(Benzylidene)indolin-2-one Derivatives as
Ligands for α-Synuclein Fibrils. J Med Chem 2015, 58, 6002.
20. Fodero-Tavoletti, M. T.; Mulligan, R. S.; Okamura, N.; Furumoto, S.; Rowe, C. C.;
Kudo, Y.; Masters, C. L.; Cappai, R.; Yanai, K.; Villemagne, V. L. In Vitro
Characterisation of BF227 Binding to α-synuclein/Lewy Bodies. Molecular Neurobiology
2009, 617, 54.
21. Koga, S.; Ono, M.; Sahara, N.; Higuchi, M.; Dickson, D. W. Fluorescence and
Autoradiographic Evaluation of Tau PET Ligand PBB3 to Α-Synuclein Pathology.
Nuklearmedizin 2017, 32, 884.
22. Lengyel-Zhand, Z.; Ferrie, J. J.; Janssen, B.; Hsieh, C.-J.; Graham, T.; Xu, K.; Haney,
C. M.; Lee, V. M.-Y.; John Q. Trojanowski, J. Q.; Petersson, E.J. and Mach, R. H.
Synthesis and Characterization of High Affinity Fluorogenic α- Synuclein Probes.
Chemical Communications 2020, 56 (24), 3567-3570.
23. Xue, C.; Lin, T.Y.; Chang, D.; Guo, Z. Thioflavin T as an amyloid dye: fibril
quantification, optimal concentration and effect on aggregation. R. Soc. open sci.
2017, 4: 160696. http://dx.doi.org/10.1098/rsos.160696
24. Biancalana, M.; Makabe, K.; Koide, A. and Koide, S. Molecular Mechanism of
Thioflavin-T Binding to the Surface of β-Rich Peptide Self-Assemblies. J Mol Biol 2009;
385(4): 1052–1063. doi:10.1016/j.jmb.2008.11.006.
25. Giasson, B. I.; Jakes, R.; Goedert, M.; Duda, J. E.; Leight, S.; Trojanowski, J. Q.; and
Lee, V. M. Y. A Panel of Epitope-Specific Antibodies Detects Protein Domains
Distributed Throughout Human a-Synuclein in Lewy Bodies of Parkinson's Disease.
Journal of Neuroscience Research 2000, 59, 528–533.
26. Covell, D. J.; Robinson, J. L.; Akhtar, R. S.; Grossman, M.; Weintraub, D.; Bucklin,
H. M.; Pitkin, R. M.; Riddle, D.; Yousef, A.; Trojanowski, J. Q. and Lee, V. M.-Y. Novel
conformation-selective alpha-synuclein antibodies raised against different in vitro fibril
forms show distinct patterns of Lewy pathology in Parkinson's disease. Neuropathology
and Applied Neurobiology 2017, 43, 604–620.

download fileview on ChemRxivManuscript.pdf (758.30 KiB)
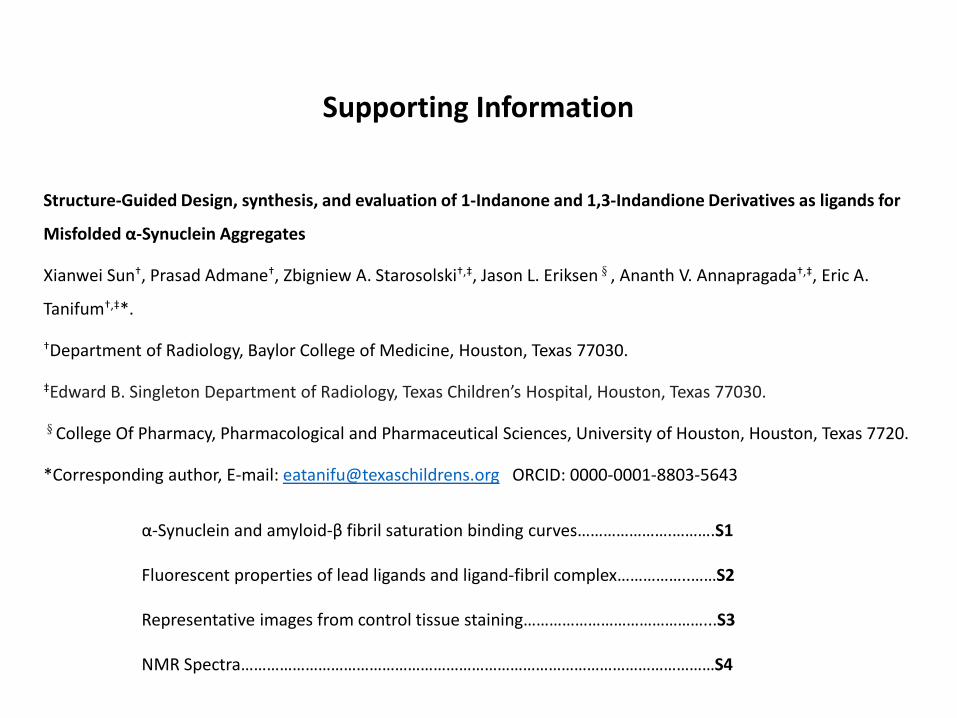
Supporting Information
Structure-Guided Design, synthesis, and evaluation of 1-Indanone and 1,3-Indandione Derivatives as ligands for
Misfolded α-Synuclein Aggregates
Xianwei Sun†, Prasad Admane†, Zbigniew A. Starosolski†,‡, Jason L. Eriksen§, Ananth V. Annapragada†,‡, Eric A.
Tanifum†,‡*.
†Department of Radiology, Baylor College of Medicine, Houston, Texas 77030.
‡Edward B. Singleton Department of Radiology, Texas Children’s Hospital, Houston, Texas 77030.
§College Of Pharmacy, Pharmacological and Pharmaceutical Sciences, University of Houston, Houston, Texas 7720.
*Corresponding author, E-mail: [email protected] ORCID: 0000-0001-8803-5643
α-Synuclein and amyloid-β fibril saturation binding curves………………….……….S1
Fluorescent properties of lead ligands and ligand-fibril complex……………..……S2
Representative images from control tissue staining……………………………………...S3
NMR Spectra…………………………………………………………………………………………………S4
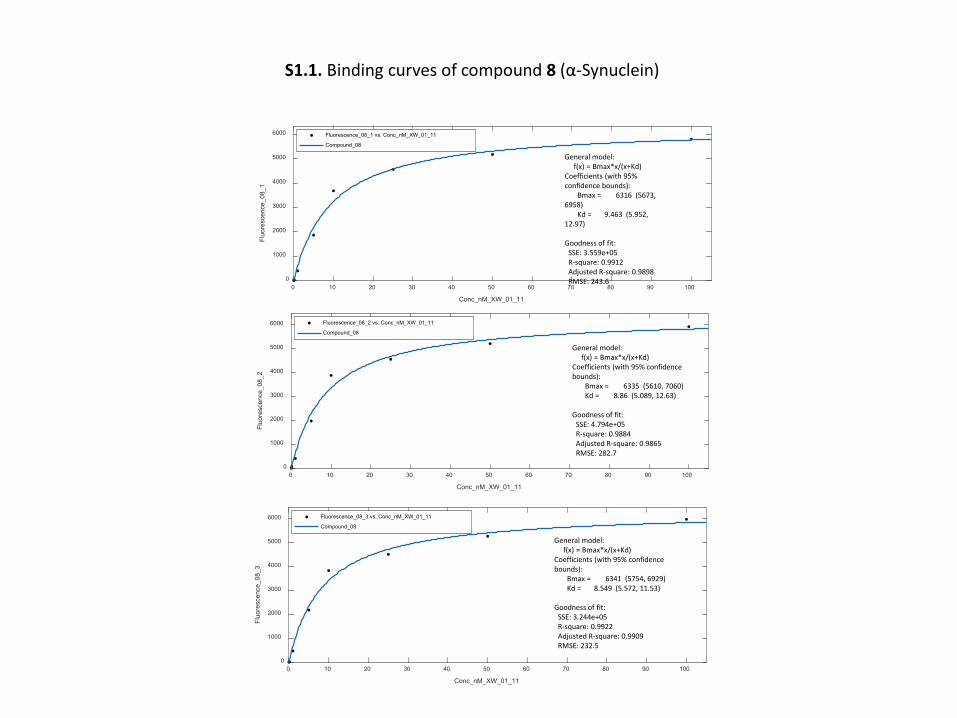
0 10 20 30 40 50 60 70 80 90 100
Conc_nM_XW_01_11
0
1000
2000
3000
4000
5000
6000
Fluo
resc
ence
_08_
1
Fluorescence_08_1 vs. Conc_nM_XW_01_11
Compound_08
General model:f(x) = Bmax*x/(x+Kd)
Coefficients (with 95% confidence bounds):
Bmax = 6316 (5673, 6958)
Kd = 9.463 (5.952, 12.97)
Goodness of fit:SSE: 3.559e+05R-square: 0.9912Adjusted R-square: 0.9898RMSE: 243.6
0 10 20 30 40 50 60 70 80 90 100
Conc_nM_XW_01_11
0
1000
2000
3000
4000
5000
6000
Fluo
resc
ence
_08_
2
Fluorescence_08_2 vs. Conc_nM_XW_01_11
Compound_08
General model:f(x) = Bmax*x/(x+Kd)
Coefficients (with 95% confidence bounds):
Bmax = 6335 (5610, 7060)Kd = 8.86 (5.089, 12.63)
Goodness of fit:SSE: 4.794e+05R-square: 0.9884Adjusted R-square: 0.9865RMSE: 282.7
0 10 20 30 40 50 60 70 80 90 100
Conc_nM_XW_01_11
0
1000
2000
3000
4000
5000
6000
Fluo
resc
ence
_08_
3
Fluorescence_08_3 vs. Conc_nM_XW_01_11
Compound_08
General model:f(x) = Bmax*x/(x+Kd)
Coefficients (with 95% confidence bounds):
Bmax = 6341 (5754, 6929)Kd = 8.549 (5.572, 11.53)
Goodness of fit:SSE: 3.244e+05R-square: 0.9922Adjusted R-square: 0.9909RMSE: 232.5
S1.1. Binding curves of compound 8 (α-Synuclein)
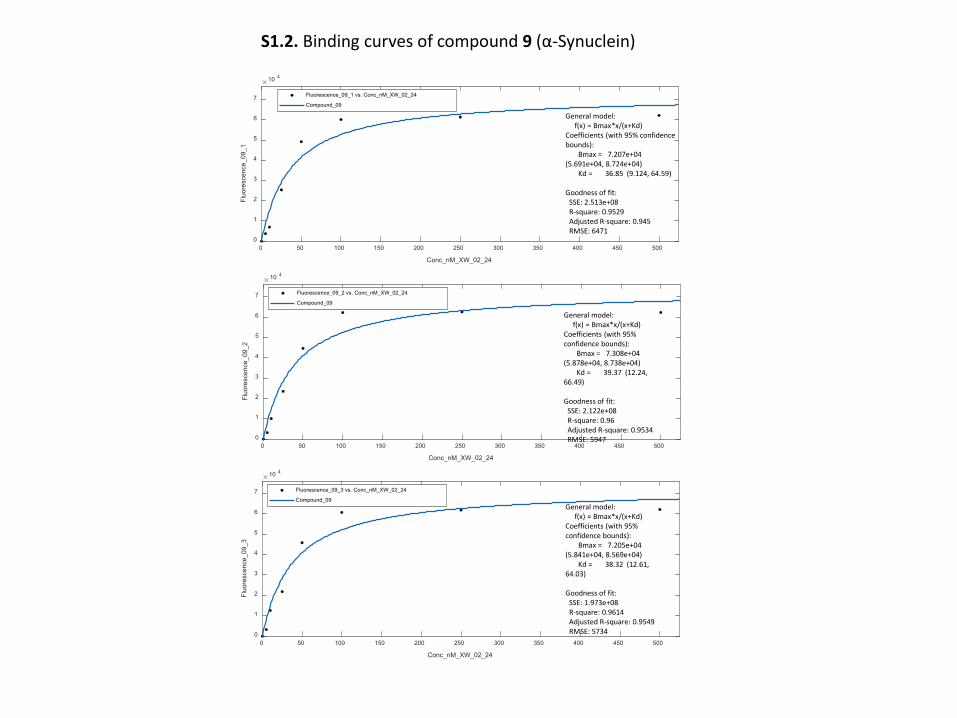
0 50 100 150 200 250 300 350 400 450 500
Conc_nM_XW_02_24
0
1
2
3
4
5
6
7
Fluo
resc
ence
_09_
1
10 4
Fluorescence_09_1 vs. Conc_nM_XW_02_24
Compound_09
General model:f(x) = Bmax*x/(x+Kd)
Coefficients (with 95% confidence bounds):
Bmax = 7.207e+04 (5.691e+04, 8.724e+04)
Kd = 36.85 (9.124, 64.59)
Goodness of fit:SSE: 2.513e+08R-square: 0.9529Adjusted R-square: 0.945RMSE: 6471
0 50 100 150 200 250 300 350 400 450 500
Conc_nM_XW_02_24
0
1
2
3
4
5
6
7
Fluo
resc
ence
_09_
2
10 4
Fluorescence_09_2 vs. Conc_nM_XW_02_24
Compound_09
General model:f(x) = Bmax*x/(x+Kd)
Coefficients (with 95% confidence bounds):
Bmax = 7.308e+04 (5.878e+04, 8.738e+04)
Kd = 39.37 (12.24, 66.49)
Goodness of fit:SSE: 2.122e+08R-square: 0.96Adjusted R-square: 0.9534RMSE: 5947
0 50 100 150 200 250 300 350 400 450 500
Conc_nM_XW_02_24
0
1
2
3
4
5
6
7
Fluo
resc
ence
_09_
3
10 4
Fluorescence_09_3 vs. Conc_nM_XW_02_24
Compound_09General model:
f(x) = Bmax*x/(x+Kd)Coefficients (with 95% confidence bounds):
Bmax = 7.205e+04 (5.841e+04, 8.569e+04)
Kd = 38.32 (12.61, 64.03)
Goodness of fit:SSE: 1.973e+08R-square: 0.9614Adjusted R-square: 0.9549RMSE: 5734
S1.2. Binding curves of compound 9 (α-Synuclein)
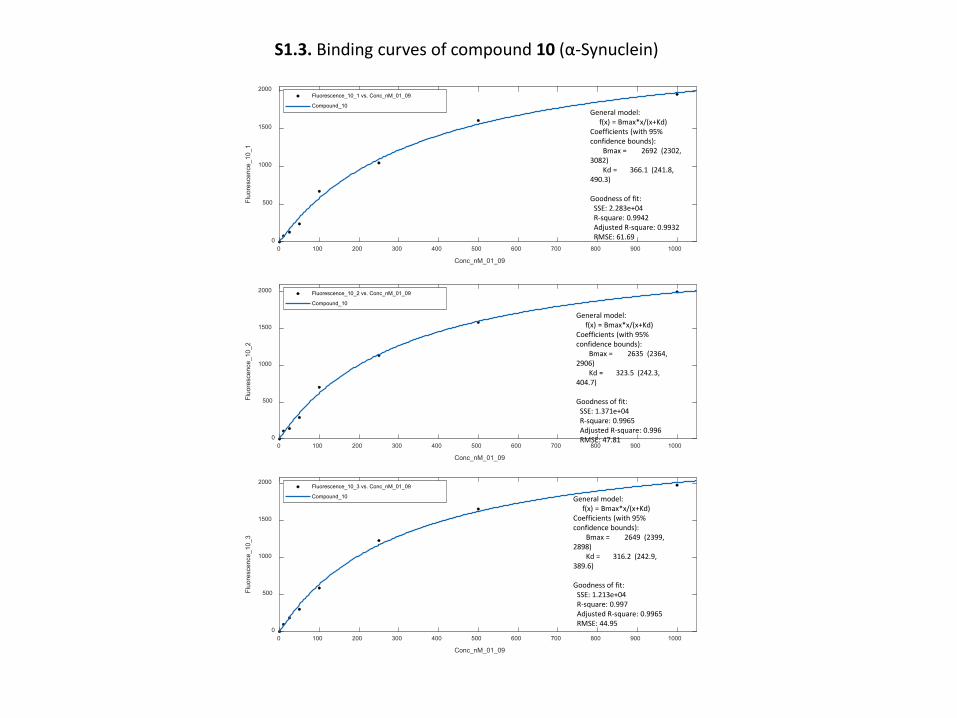
0 100 200 300 400 500 600 700 800 900 1000
Conc_nM_01_09
0
500
1000
1500
2000
Fluo
resc
ence
_10_
1
Fluorescence_10_1 vs. Conc_nM_01_09
Compound_10General model:
f(x) = Bmax*x/(x+Kd)Coefficients (with 95% confidence bounds):
Bmax = 2692 (2302, 3082)
Kd = 366.1 (241.8, 490.3)
Goodness of fit:SSE: 2.283e+04R-square: 0.9942Adjusted R-square: 0.9932RMSE: 61.69
0 100 200 300 400 500 600 700 800 900 1000
Conc_nM_01_09
0
500
1000
1500
2000
Fluo
resc
ence
_10_
2
Fluorescence_10_2 vs. Conc_nM_01_09
Compound_10
General model:f(x) = Bmax*x/(x+Kd)
Coefficients (with 95% confidence bounds):
Bmax = 2635 (2364, 2906)
Kd = 323.5 (242.3, 404.7)
Goodness of fit:SSE: 1.371e+04R-square: 0.9965Adjusted R-square: 0.996RMSE: 47.81
0 100 200 300 400 500 600 700 800 900 1000
Conc_nM_01_09
0
500
1000
1500
2000
Fluo
resc
ence
_10_
3
Fluorescence_10_3 vs. Conc_nM_01_09
Compound_10 General model:f(x) = Bmax*x/(x+Kd)
Coefficients (with 95% confidence bounds):
Bmax = 2649 (2399, 2898)
Kd = 316.2 (242.9, 389.6)
Goodness of fit:SSE: 1.213e+04R-square: 0.997Adjusted R-square: 0.9965RMSE: 44.95
S1.3. Binding curves of compound 10 (α-Synuclein)
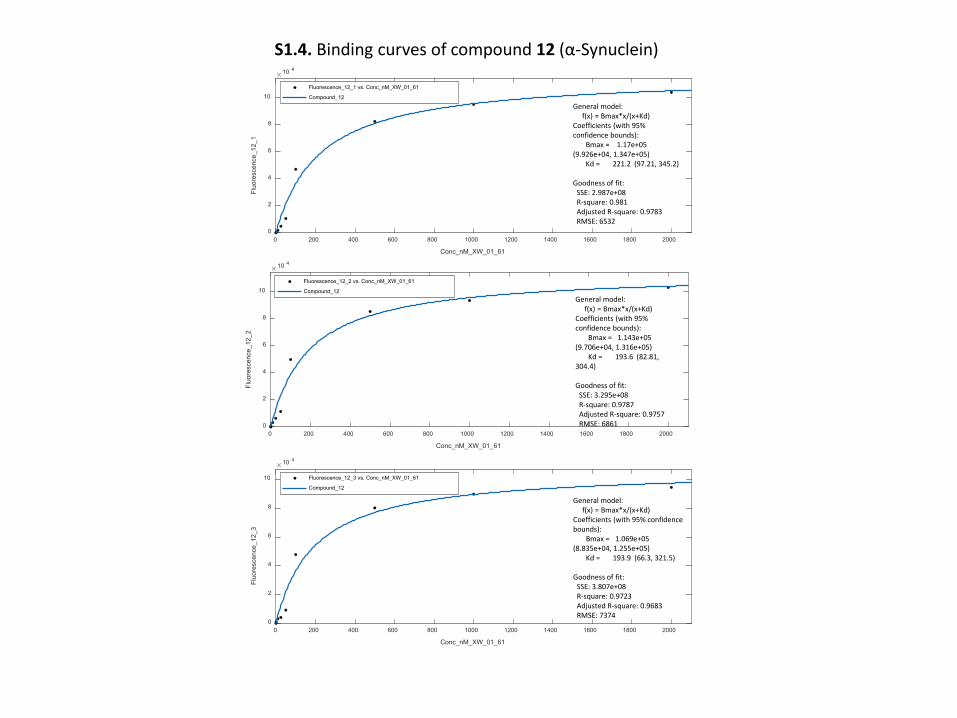
0 200 400 600 800 1000 1200 1400 1600 1800 2000
Conc_nM_XW_01_61
0
2
4
6
8
10
Fluo
resc
ence
_12_
1
10 4
Fluorescence_12_1 vs. Conc_nM_XW_01_61
Compound_12
General model:f(x) = Bmax*x/(x+Kd)
Coefficients (with 95% confidence bounds):
Bmax = 1.17e+05 (9.926e+04, 1.347e+05)
Kd = 221.2 (97.21, 345.2)
Goodness of fit:SSE: 2.987e+08R-square: 0.981Adjusted R-square: 0.9783RMSE: 6532
0 200 400 600 800 1000 1200 1400 1600 1800 2000
Conc_nM_XW_01_61
0
2
4
6
8
10
Fluo
resc
ence
_12_
2
10 4
Fluorescence_12_2 vs. Conc_nM_XW_01_61
Compound_12General model:
f(x) = Bmax*x/(x+Kd)Coefficients (with 95% confidence bounds):
Bmax = 1.143e+05 (9.706e+04, 1.316e+05)
Kd = 193.6 (82.81, 304.4)
Goodness of fit:SSE: 3.295e+08R-square: 0.9787Adjusted R-square: 0.9757RMSE: 6861
0 200 400 600 800 1000 1200 1400 1600 1800 2000
Conc_nM_XW_01_61
0
2
4
6
8
10
Fluo
resc
ence
_12_
3
10 4
Fluorescence_12_3 vs. Conc_nM_XW_01_61
Compound_12
General model:f(x) = Bmax*x/(x+Kd)
Coefficients (with 95% confidence bounds):
Bmax = 1.069e+05 (8.835e+04, 1.255e+05)
Kd = 193.9 (66.3, 321.5)
Goodness of fit:SSE: 3.807e+08R-square: 0.9723Adjusted R-square: 0.9683RMSE: 7374
S1.4. Binding curves of compound 12 (α-Synuclein)
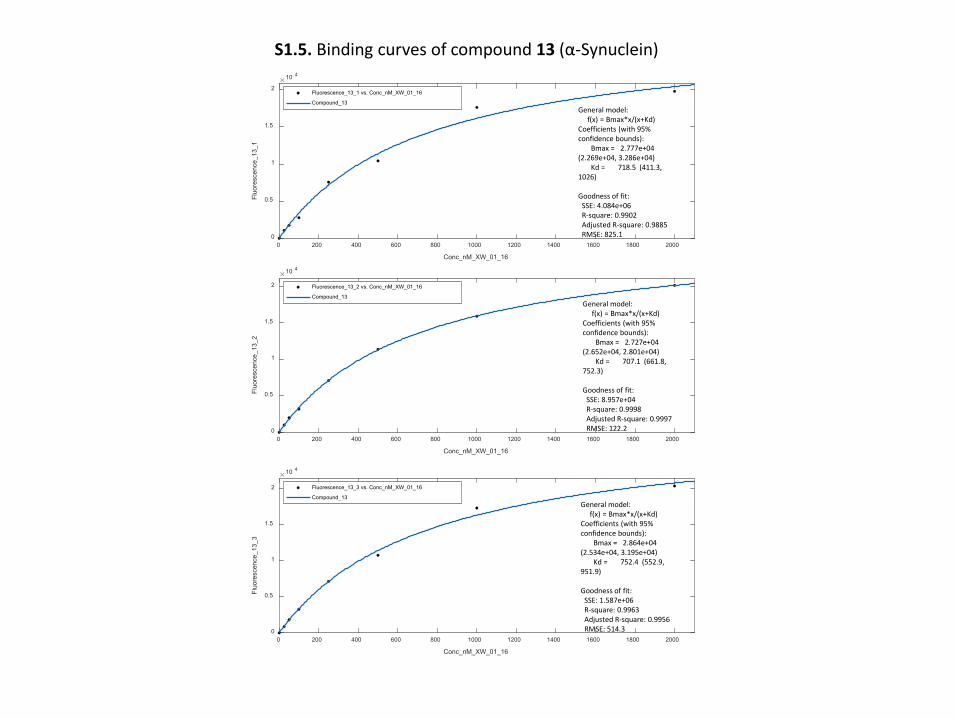
0 200 400 600 800 1000 1200 1400 1600 1800 2000
Conc_nM_XW_01_16
0
0.5
1
1.5
2
Fluo
resc
ence
_13_
1
10 4
Fluorescence_13_1 vs. Conc_nM_XW_01_16
Compound_13General model:
f(x) = Bmax*x/(x+Kd)Coefficients (with 95% confidence bounds):
Bmax = 2.777e+04 (2.269e+04, 3.286e+04)
Kd = 718.5 (411.3, 1026)
Goodness of fit:SSE: 4.084e+06R-square: 0.9902Adjusted R-square: 0.9885RMSE: 825.1
0 200 400 600 800 1000 1200 1400 1600 1800 2000
Conc_nM_XW_01_16
0
0.5
1
1.5
2
Fluo
resc
ence
_13_
2
10 4
Fluorescence_13_2 vs. Conc_nM_XW_01_16
Compound_13General model:
f(x) = Bmax*x/(x+Kd)Coefficients (with 95% confidence bounds):
Bmax = 2.727e+04 (2.652e+04, 2.801e+04)
Kd = 707.1 (661.8, 752.3)
Goodness of fit:SSE: 8.957e+04R-square: 0.9998Adjusted R-square: 0.9997RMSE: 122.2
0 200 400 600 800 1000 1200 1400 1600 1800 2000
Conc_nM_XW_01_16
0
0.5
1
1.5
2
Fluo
resc
ence
_13_
3
10 4
Fluorescence_13_3 vs. Conc_nM_XW_01_16
Compound_13General model:
f(x) = Bmax*x/(x+Kd)Coefficients (with 95% confidence bounds):
Bmax = 2.864e+04 (2.534e+04, 3.195e+04)
Kd = 752.4 (552.9, 951.9)
Goodness of fit:SSE: 1.587e+06R-square: 0.9963Adjusted R-square: 0.9956RMSE: 514.3
S1.5. Binding curves of compound 13 (α-Synuclein)
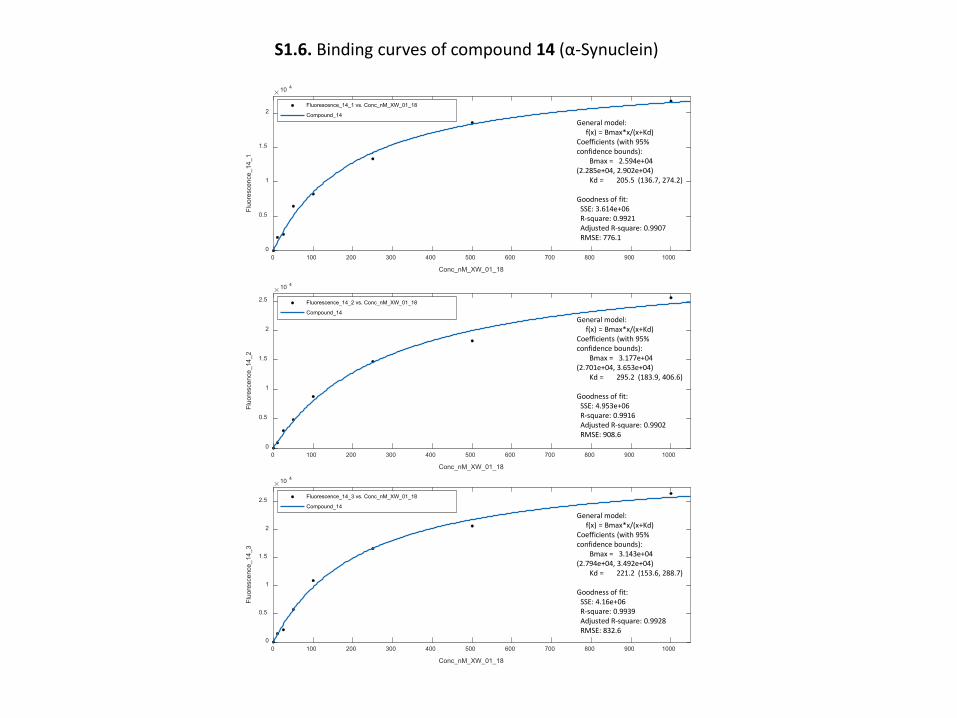
0 100 200 300 400 500 600 700 800 900 1000
Conc_nM_XW_01_18
0
0.5
1
1.5
2
Fluo
resc
ence
_14_
1
10 4
Fluorescence_14_1 vs. Conc_nM_XW_01_18
Compound_14General model:
f(x) = Bmax*x/(x+Kd)Coefficients (with 95% confidence bounds):
Bmax = 2.594e+04 (2.285e+04, 2.902e+04)
Kd = 205.5 (136.7, 274.2)
Goodness of fit:SSE: 3.614e+06R-square: 0.9921Adjusted R-square: 0.9907RMSE: 776.1
0 100 200 300 400 500 600 700 800 900 1000
Conc_nM_XW_01_18
0
0.5
1
1.5
2
2.5
Fluo
resc
ence
_14_
2
10 4
Fluorescence_14_2 vs. Conc_nM_XW_01_18
Compound_14General model:
f(x) = Bmax*x/(x+Kd)Coefficients (with 95% confidence bounds):
Bmax = 3.177e+04 (2.701e+04, 3.653e+04)
Kd = 295.2 (183.9, 406.6)
Goodness of fit:SSE: 4.953e+06R-square: 0.9916Adjusted R-square: 0.9902RMSE: 908.6
0 100 200 300 400 500 600 700 800 900 1000
Conc_nM_XW_01_18
0
0.5
1
1.5
2
2.5
Fluo
resc
ence
_14_
3
10 4
Fluorescence_14_3 vs. Conc_nM_XW_01_18
Compound_14
General model:f(x) = Bmax*x/(x+Kd)
Coefficients (with 95% confidence bounds):
Bmax = 3.143e+04 (2.794e+04, 3.492e+04)
Kd = 221.2 (153.6, 288.7)
Goodness of fit:SSE: 4.16e+06R-square: 0.9939Adjusted R-square: 0.9928RMSE: 832.6
S1.6. Binding curves of compound 14 (α-Synuclein)
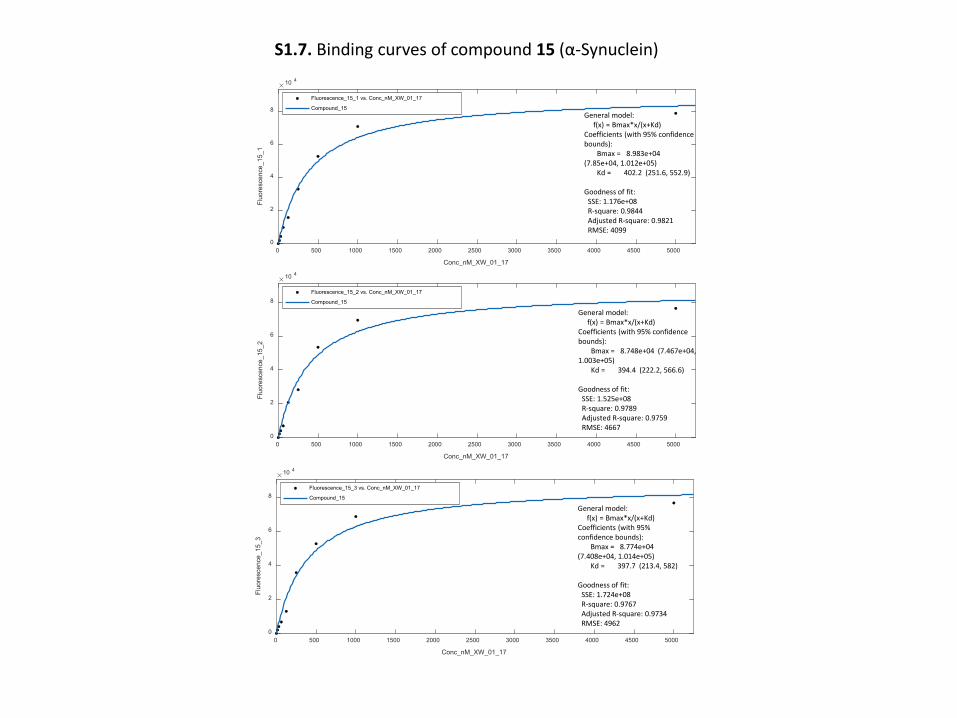
0 500 1000 1500 2000 2500 3000 3500 4000 4500 5000
Conc_nM_XW_01_17
0
2
4
6
8
Fluo
resc
ence
_15_
1
10 4
Fluorescence_15_1 vs. Conc_nM_XW_01_17
Compound_15General model:
f(x) = Bmax*x/(x+Kd)Coefficients (with 95% confidence bounds):
Bmax = 8.983e+04 (7.85e+04, 1.012e+05)
Kd = 402.2 (251.6, 552.9)
Goodness of fit:SSE: 1.176e+08R-square: 0.9844Adjusted R-square: 0.9821RMSE: 4099
0 500 1000 1500 2000 2500 3000 3500 4000 4500 5000
Conc_nM_XW_01_17
0
2
4
6
8
Fluo
resc
ence
_15_
2
10 4
Fluorescence_15_2 vs. Conc_nM_XW_01_17
Compound_15
General model:f(x) = Bmax*x/(x+Kd)
Coefficients (with 95% confidence bounds):
Bmax = 8.748e+04 (7.467e+04, 1.003e+05)
Kd = 394.4 (222.2, 566.6)
Goodness of fit:SSE: 1.525e+08R-square: 0.9789Adjusted R-square: 0.9759RMSE: 4667
0 500 1000 1500 2000 2500 3000 3500 4000 4500 5000
Conc_nM_XW_01_17
0
2
4
6
8
Fluo
resc
ence
_15_
3
10 4
Fluorescence_15_3 vs. Conc_nM_XW_01_17
Compound_15
General model:f(x) = Bmax*x/(x+Kd)
Coefficients (with 95% confidence bounds):
Bmax = 8.774e+04 (7.408e+04, 1.014e+05)
Kd = 397.7 (213.4, 582)
Goodness of fit:SSE: 1.724e+08R-square: 0.9767Adjusted R-square: 0.9734RMSE: 4962
S1.7. Binding curves of compound 15 (α-Synuclein)
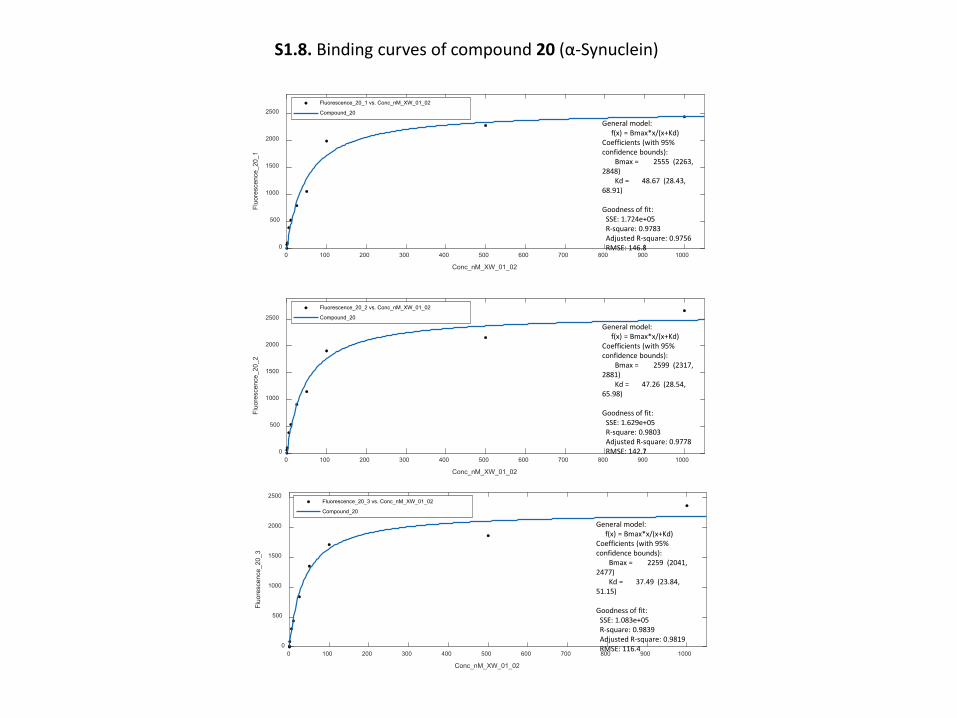
0 100 200 300 400 500 600 700 800 900 1000
Conc_nM_XW_01_02
0
500
1000
1500
2000
2500
Fluo
resc
ence
_20_
1
Fluorescence_20_1 vs. Conc_nM_XW_01_02
Compound_20
General model:f(x) = Bmax*x/(x+Kd)
Coefficients (with 95% confidence bounds):
Bmax = 2555 (2263, 2848)
Kd = 48.67 (28.43, 68.91)
Goodness of fit:SSE: 1.724e+05R-square: 0.9783Adjusted R-square: 0.9756RMSE: 146.8
0 100 200 300 400 500 600 700 800 900 1000
Conc_nM_XW_01_02
0
500
1000
1500
2000
2500
Fluo
resc
ence
_20_
2
Fluorescence_20_2 vs. Conc_nM_XW_01_02
Compound_20
General model:f(x) = Bmax*x/(x+Kd)
Coefficients (with 95% confidence bounds):
Bmax = 2599 (2317, 2881)
Kd = 47.26 (28.54, 65.98)
Goodness of fit:SSE: 1.629e+05R-square: 0.9803Adjusted R-square: 0.9778RMSE: 142.7
0 100 200 300 400 500 600 700 800 900 1000
Conc_nM_XW_01_02
0
500
1000
1500
2000
2500
Fluo
resc
ence
_20_
3
Fluorescence_20_3 vs. Conc_nM_XW_01_02
Compound_20
General model:f(x) = Bmax*x/(x+Kd)
Coefficients (with 95% confidence bounds):
Bmax = 2259 (2041, 2477)
Kd = 37.49 (23.84, 51.15)
Goodness of fit:SSE: 1.083e+05R-square: 0.9839Adjusted R-square: 0.9819RMSE: 116.4
S1.8. Binding curves of compound 20 (α-Synuclein)
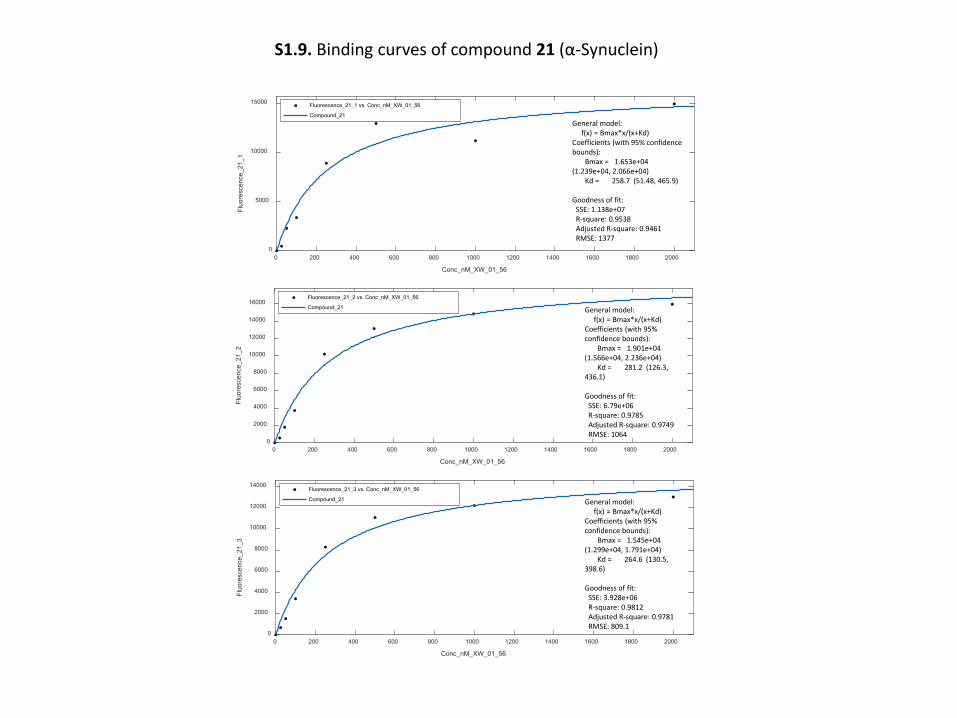
0 200 400 600 800 1000 1200 1400 1600 1800 2000
Conc_nM_XW_01_56
0
5000
10000
15000
Fluo
resc
ence
_21_
1
Fluorescence_21_1 vs. Conc_nM_XW_01_56
Compound_21General model:
f(x) = Bmax*x/(x+Kd)Coefficients (with 95% confidence bounds):
Bmax = 1.653e+04 (1.239e+04, 2.066e+04)
Kd = 258.7 (51.48, 465.9)
Goodness of fit:SSE: 1.138e+07R-square: 0.9538Adjusted R-square: 0.9461RMSE: 1377
0 200 400 600 800 1000 1200 1400 1600 1800 2000
Conc_nM_XW_01_56
0
2000
4000
6000
8000
10000
12000
14000
16000
Fluo
resc
ence
_21_
2
Fluorescence_21_2 vs. Conc_nM_XW_01_56
Compound_21 General model:f(x) = Bmax*x/(x+Kd)
Coefficients (with 95% confidence bounds):
Bmax = 1.901e+04 (1.566e+04, 2.236e+04)
Kd = 281.2 (126.3, 436.1)
Goodness of fit:SSE: 6.79e+06R-square: 0.9785Adjusted R-square: 0.9749RMSE: 1064
0 200 400 600 800 1000 1200 1400 1600 1800 2000
Conc_nM_XW_01_56
0
2000
4000
6000
8000
10000
12000
14000
Fluo
resc
ence
_21_
3
Fluorescence_21_3 vs. Conc_nM_XW_01_56
Compound_21 General model:f(x) = Bmax*x/(x+Kd)
Coefficients (with 95% confidence bounds):
Bmax = 1.545e+04 (1.299e+04, 1.791e+04)
Kd = 264.6 (130.5, 398.6)
Goodness of fit:SSE: 3.928e+06R-square: 0.9812Adjusted R-square: 0.9781RMSE: 809.1
S1.9. Binding curves of compound 21 (α-Synuclein)
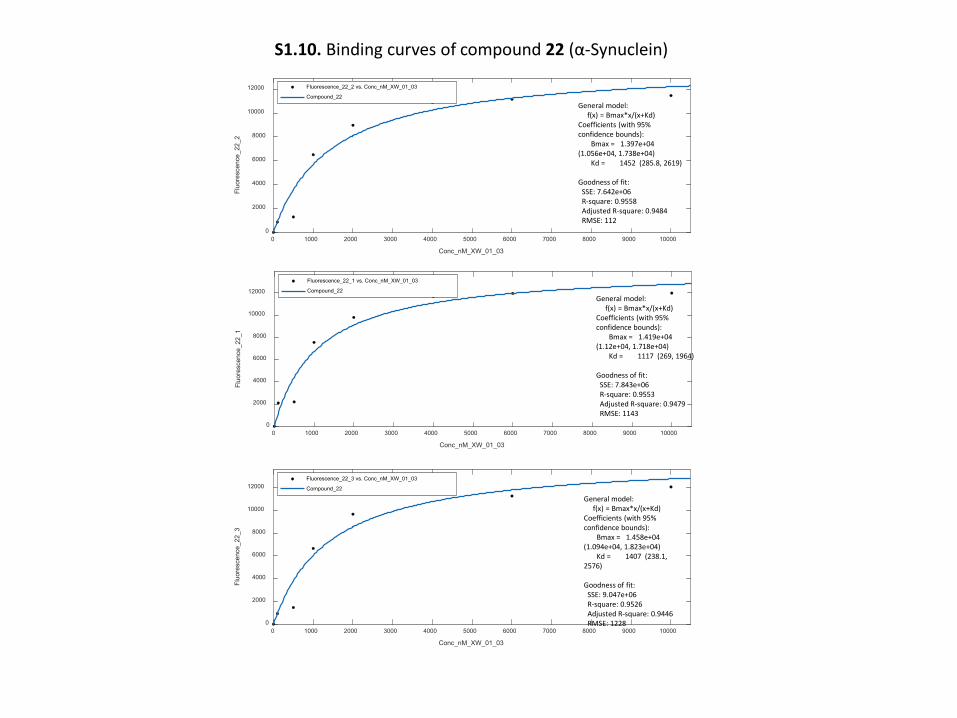
0 1000 2000 3000 4000 5000 6000 7000 8000 9000 10000
Conc_nM_XW_01_03
0
2000
4000
6000
8000
10000
12000
Fluo
resc
ence
_22_
1
Fluorescence_22_1 vs. Conc_nM_XW_01_03
Compound_22General model:
f(x) = Bmax*x/(x+Kd)Coefficients (with 95% confidence bounds):
Bmax = 1.419e+04 (1.12e+04, 1.718e+04)
Kd = 1117 (269, 1964)
Goodness of fit:SSE: 7.843e+06R-square: 0.9553Adjusted R-square: 0.9479RMSE: 1143
0 1000 2000 3000 4000 5000 6000 7000 8000 9000 10000
Conc_nM_XW_01_03
0
2000
4000
6000
8000
10000
12000
Fluo
resc
ence
_22_
2
Fluorescence_22_2 vs. Conc_nM_XW_01_03
Compound_22
General model:f(x) = Bmax*x/(x+Kd)
Coefficients (with 95% confidence bounds):
Bmax = 1.397e+04 (1.056e+04, 1.738e+04)
Kd = 1452 (285.8, 2619)
Goodness of fit:SSE: 7.642e+06R-square: 0.9558Adjusted R-square: 0.9484RMSE: 112
0 1000 2000 3000 4000 5000 6000 7000 8000 9000 10000
Conc_nM_XW_01_03
0
2000
4000
6000
8000
10000
12000
Fluo
resc
ence
_22_
3
Fluorescence_22_3 vs. Conc_nM_XW_01_03
Compound_22
General model:f(x) = Bmax*x/(x+Kd)
Coefficients (with 95% confidence bounds):
Bmax = 1.458e+04 (1.094e+04, 1.823e+04)
Kd = 1407 (238.1, 2576)
Goodness of fit:SSE: 9.047e+06R-square: 0.9526Adjusted R-square: 0.9446RMSE: 1228
S1.10. Binding curves of compound 22 (α-Synuclein)
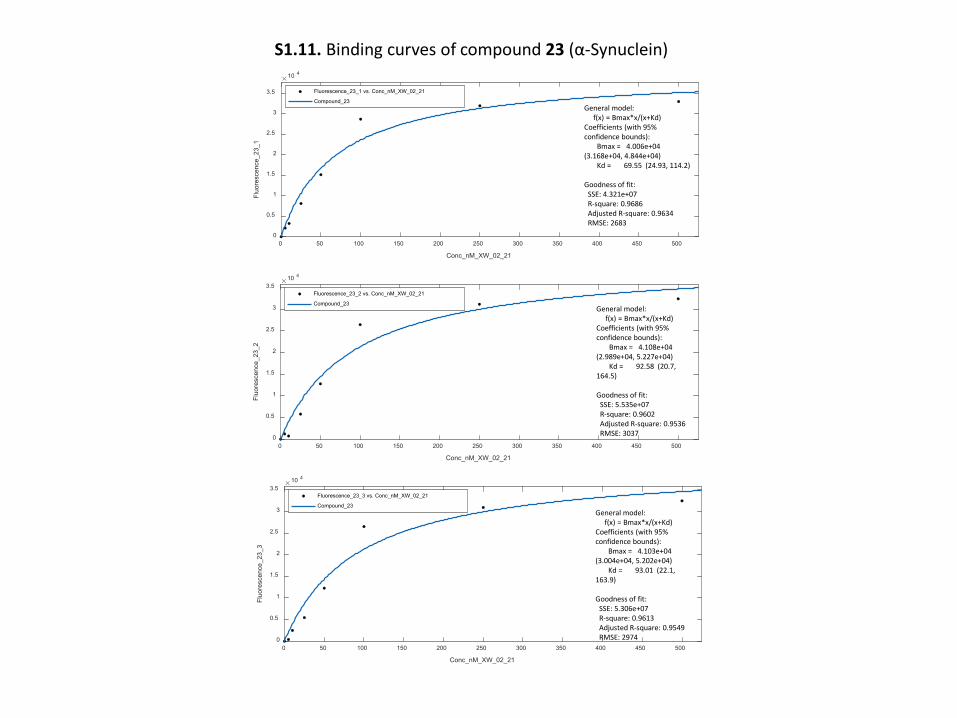
0 50 100 150 200 250 300 350 400 450 500
Conc_nM_XW_02_21
0
0.5
1
1.5
2
2.5
3
3.5
Fluo
resc
ence
_23_
3
10 4
Fluorescence_23_3 vs. Conc_nM_XW_02_21
Compound_23
0 50 100 150 200 250 300 350 400 450 500
Conc_nM_XW_02_21
0
0.5
1
1.5
2
2.5
3
3.5
Fluo
resc
ence
_23_
2
10 4
Fluorescence_23_2 vs. Conc_nM_XW_02_21
Compound_23
0 50 100 150 200 250 300 350 400 450 500
Conc_nM_XW_02_21
0
0.5
1
1.5
2
2.5
3
3.5
Fluo
resc
ence
_23_
1
10 4
Fluorescence_23_1 vs. Conc_nM_XW_02_21
Compound_23General model:
f(x) = Bmax*x/(x+Kd)Coefficients (with 95% confidence bounds):
Bmax = 4.006e+04 (3.168e+04, 4.844e+04)
Kd = 69.55 (24.93, 114.2)
Goodness of fit:SSE: 4.321e+07R-square: 0.9686Adjusted R-square: 0.9634RMSE: 2683
General model:f(x) = Bmax*x/(x+Kd)
Coefficients (with 95% confidence bounds):
Bmax = 4.108e+04 (2.989e+04, 5.227e+04)
Kd = 92.58 (20.7, 164.5)
Goodness of fit:SSE: 5.535e+07R-square: 0.9602Adjusted R-square: 0.9536RMSE: 3037
General model:f(x) = Bmax*x/(x+Kd)
Coefficients (with 95% confidence bounds):
Bmax = 4.103e+04 (3.004e+04, 5.202e+04)
Kd = 93.01 (22.1, 163.9)
Goodness of fit:SSE: 5.306e+07R-square: 0.9613Adjusted R-square: 0.9549RMSE: 2974
S1.11. Binding curves of compound 23 (α-Synuclein)
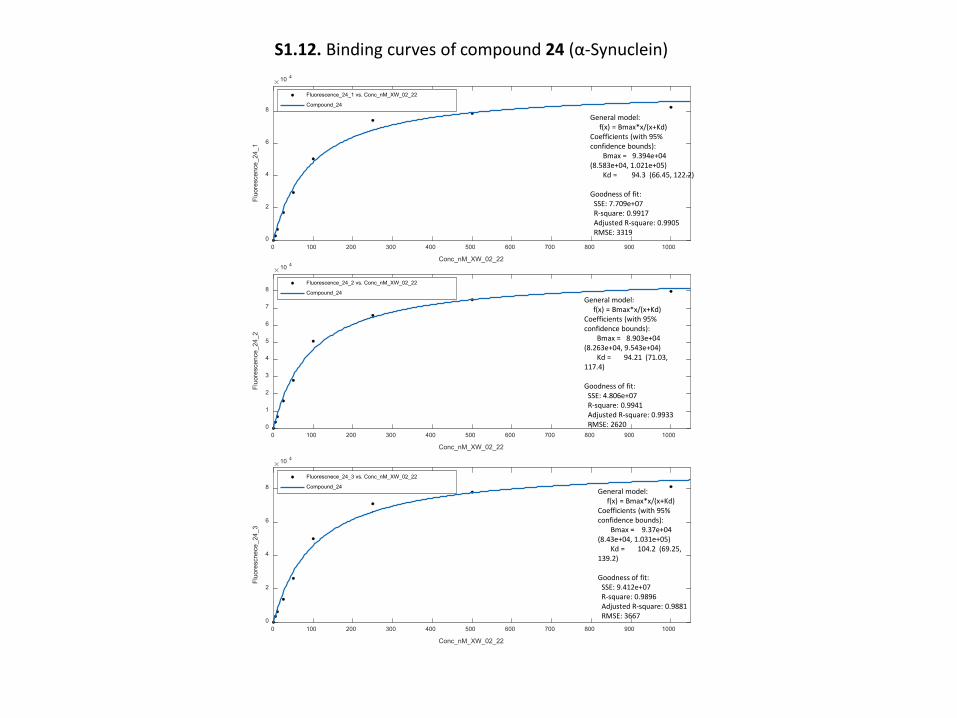
0 100 200 300 400 500 600 700 800 900 1000
Conc_nM_XW_02_22
0
2
4
6
8
Fluo
resc
nece
_24_
3
10 4
Fluorescnece_24_3 vs. Conc_nM_XW_02_22
Compound_24General model:
f(x) = Bmax*x/(x+Kd)Coefficients (with 95% confidence bounds):
Bmax = 9.37e+04 (8.43e+04, 1.031e+05)
Kd = 104.2 (69.25, 139.2)
Goodness of fit:SSE: 9.412e+07R-square: 0.9896Adjusted R-square: 0.9881RMSE: 3667
0 100 200 300 400 500 600 700 800 900 1000
Conc_nM_XW_02_22
0
2
4
6
8
Fluo
resc
ence
_24_
1
10 4
Fluorescence_24_1 vs. Conc_nM_XW_02_22
Compound_24
General model:f(x) = Bmax*x/(x+Kd)
Coefficients (with 95% confidence bounds):
Bmax = 9.394e+04 (8.583e+04, 1.021e+05)
Kd = 94.3 (66.45, 122.2)
Goodness of fit:SSE: 7.709e+07R-square: 0.9917Adjusted R-square: 0.9905RMSE: 3319
0 100 200 300 400 500 600 700 800 900 1000
Conc_nM_XW_02_22
0
1
2
3
4
5
6
7
8
Fluo
resc
ence
_24_
2
10 4
Fluorescence_24_2 vs. Conc_nM_XW_02_22
Compound_24General model:
f(x) = Bmax*x/(x+Kd)Coefficients (with 95% confidence bounds):
Bmax = 8.903e+04 (8.263e+04, 9.543e+04)
Kd = 94.21 (71.03, 117.4)
Goodness of fit:SSE: 4.806e+07R-square: 0.9941Adjusted R-square: 0.9933RMSE: 2620
S1.12. Binding curves of compound 24 (α-Synuclein)
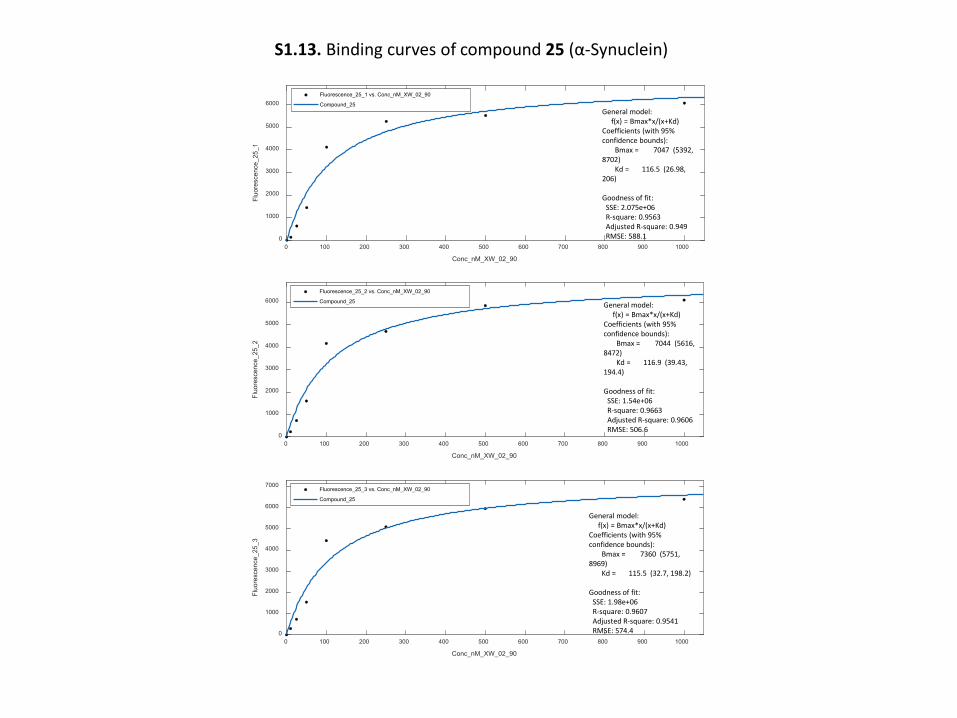
0 100 200 300 400 500 600 700 800 900 1000
Conc_nM_XW_02_90
0
1000
2000
3000
4000
5000
6000
Fluo
resc
ence
_25_
1
Fluorescence_25_1 vs. Conc_nM_XW_02_90
Compound_25General model:
f(x) = Bmax*x/(x+Kd)Coefficients (with 95% confidence bounds):
Bmax = 7047 (5392, 8702)
Kd = 116.5 (26.98, 206)
Goodness of fit:SSE: 2.075e+06R-square: 0.9563Adjusted R-square: 0.949RMSE: 588.1
0 100 200 300 400 500 600 700 800 900 1000
Conc_nM_XW_02_90
0
1000
2000
3000
4000
5000
6000
Fluo
resc
ence
_25_
2
Fluorescence_25_2 vs. Conc_nM_XW_02_90
Compound_25 General model:f(x) = Bmax*x/(x+Kd)
Coefficients (with 95% confidence bounds):
Bmax = 7044 (5616, 8472)
Kd = 116.9 (39.43, 194.4)
Goodness of fit:SSE: 1.54e+06R-square: 0.9663Adjusted R-square: 0.9606RMSE: 506.6
0 100 200 300 400 500 600 700 800 900 1000
Conc_nM_XW_02_90
0
1000
2000
3000
4000
5000
6000
7000
Fluo
resc
ence
_25_
3
Fluorescence_25_3 vs. Conc_nM_XW_02_90
Compound_25
General model:f(x) = Bmax*x/(x+Kd)
Coefficients (with 95% confidence bounds):
Bmax = 7360 (5751, 8969)
Kd = 115.5 (32.7, 198.2)
Goodness of fit:SSE: 1.98e+06R-square: 0.9607Adjusted R-square: 0.9541RMSE: 574.4
S1.13. Binding curves of compound 25 (α-Synuclein)
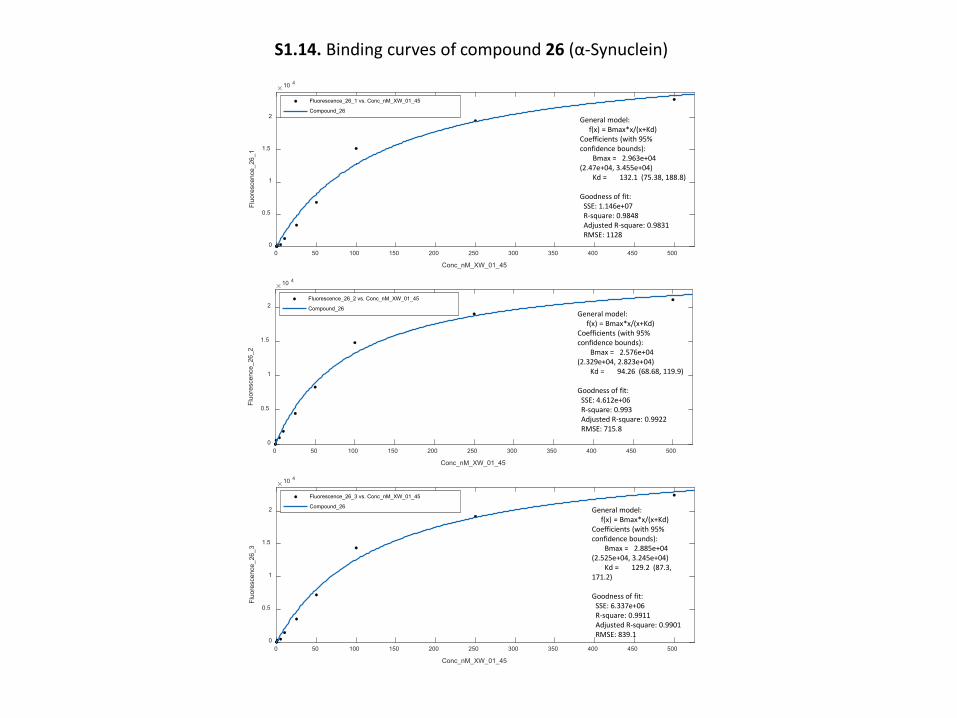
0 50 100 150 200 250 300 350 400 450 500
Conc_nM_XW_01_45
0
0.5
1
1.5
2
Fluo
resc
ence
_26_
2
10 4
Fluorescence_26_2 vs. Conc_nM_XW_01_45
Compound_26General model:
f(x) = Bmax*x/(x+Kd)Coefficients (with 95% confidence bounds):
Bmax = 2.576e+04 (2.329e+04, 2.823e+04)
Kd = 94.26 (68.68, 119.9)
Goodness of fit:SSE: 4.612e+06R-square: 0.993Adjusted R-square: 0.9922RMSE: 715.8
0 50 100 150 200 250 300 350 400 450 500
Conc_nM_XW_01_45
0
0.5
1
1.5
2
Fluo
resc
ence
_26_
1
10 4
Fluorescence_26_1 vs. Conc_nM_XW_01_45
Compound_26
General model:f(x) = Bmax*x/(x+Kd)
Coefficients (with 95% confidence bounds):
Bmax = 2.963e+04 (2.47e+04, 3.455e+04)
Kd = 132.1 (75.38, 188.8)
Goodness of fit:SSE: 1.146e+07R-square: 0.9848Adjusted R-square: 0.9831RMSE: 1128
0 50 100 150 200 250 300 350 400 450 500
Conc_nM_XW_01_45
0
0.5
1
1.5
2
Fluo
resc
ence
_26_
3
10 4
Fluorescence_26_3 vs. Conc_nM_XW_01_45
Compound_26 General model:f(x) = Bmax*x/(x+Kd)
Coefficients (with 95% confidence bounds):
Bmax = 2.885e+04 (2.525e+04, 3.245e+04)
Kd = 129.2 (87.3, 171.2)
Goodness of fit:SSE: 6.337e+06R-square: 0.9911Adjusted R-square: 0.9901RMSE: 839.1
S1.14. Binding curves of compound 26 (α-Synuclein)
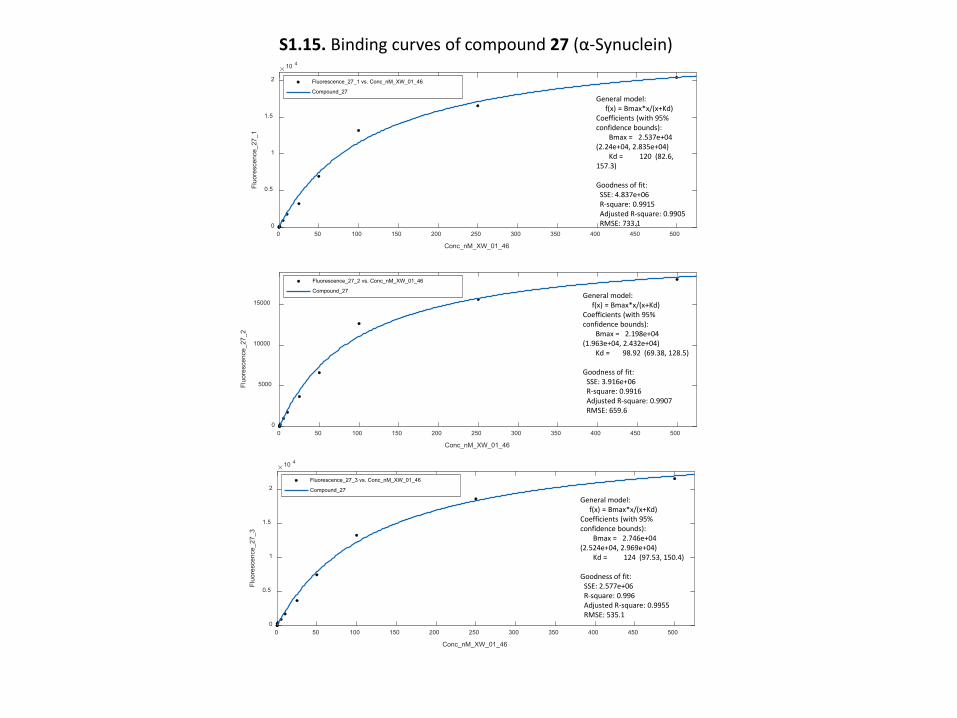
0 50 100 150 200 250 300 350 400 450 500
Conc_nM_XW_01_46
0
0.5
1
1.5
2
Fluo
resc
ence
_27_
1
10 4
Fluorescence_27_1 vs. Conc_nM_XW_01_46
Compound_27General model:
f(x) = Bmax*x/(x+Kd)Coefficients (with 95% confidence bounds):
Bmax = 2.537e+04 (2.24e+04, 2.835e+04)
Kd = 120 (82.6, 157.3)
Goodness of fit:SSE: 4.837e+06R-square: 0.9915Adjusted R-square: 0.9905RMSE: 733.1
0 50 100 150 200 250 300 350 400 450 500
Conc_nM_XW_01_46
0
5000
10000
15000
Fluo
resc
ence
_27_
2
Fluorescence_27_2 vs. Conc_nM_XW_01_46
Compound_27General model:
f(x) = Bmax*x/(x+Kd)Coefficients (with 95% confidence bounds):
Bmax = 2.198e+04 (1.963e+04, 2.432e+04)
Kd = 98.92 (69.38, 128.5)
Goodness of fit:SSE: 3.916e+06R-square: 0.9916Adjusted R-square: 0.9907RMSE: 659.6
0 50 100 150 200 250 300 350 400 450 500
Conc_nM_XW_01_46
0
0.5
1
1.5
2
Fluo
resc
ence
_27_
3
10 4
Fluorescence_27_3 vs. Conc_nM_XW_01_46
Compound_27
General model:f(x) = Bmax*x/(x+Kd)
Coefficients (with 95% confidence bounds):
Bmax = 2.746e+04 (2.524e+04, 2.969e+04)
Kd = 124 (97.53, 150.4)
Goodness of fit:SSE: 2.577e+06R-square: 0.996Adjusted R-square: 0.9955RMSE: 535.1
S1.15. Binding curves of compound 27 (α-Synuclein)
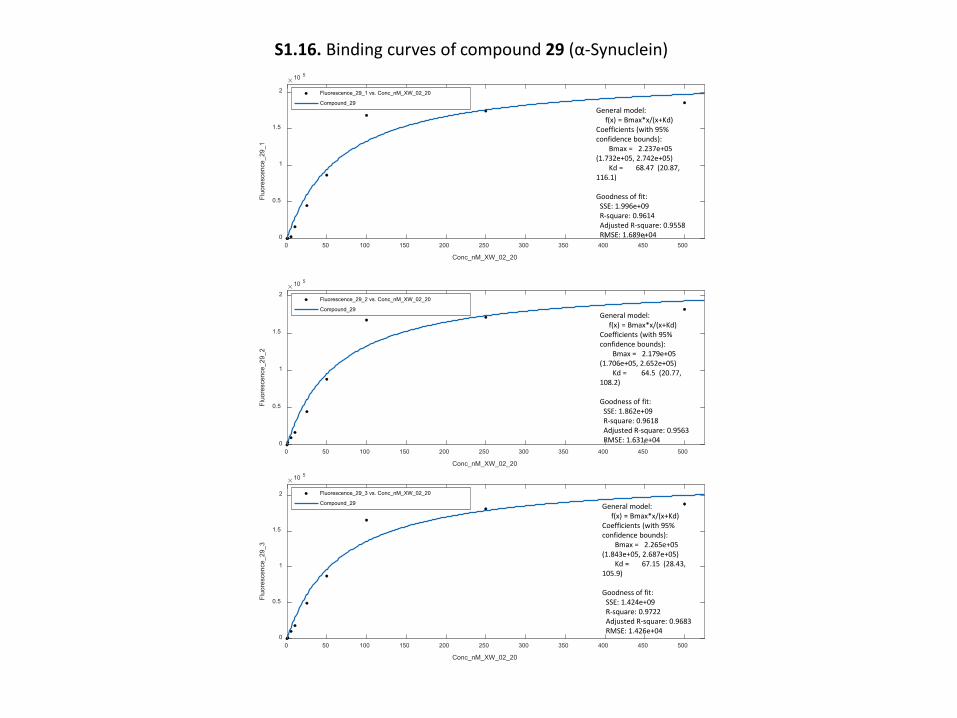
0 50 100 150 200 250 300 350 400 450 500
Conc_nM_XW_02_20
0
0.5
1
1.5
2
Fluo
resc
ence
_29_
1
10 5
Fluorescence_29_1 vs. Conc_nM_XW_02_20
Compound_29General model:
f(x) = Bmax*x/(x+Kd)Coefficients (with 95% confidence bounds):
Bmax = 2.237e+05 (1.732e+05, 2.742e+05)
Kd = 68.47 (20.87, 116.1)
Goodness of fit:SSE: 1.996e+09R-square: 0.9614Adjusted R-square: 0.9558RMSE: 1.689e+04
0 50 100 150 200 250 300 350 400 450 500
Conc_nM_XW_02_20
0
0.5
1
1.5
2
Fluo
resc
ence
_29_
2
10 5
Fluorescence_29_2 vs. Conc_nM_XW_02_20
Compound_29General model:
f(x) = Bmax*x/(x+Kd)Coefficients (with 95% confidence bounds):
Bmax = 2.179e+05 (1.706e+05, 2.652e+05)
Kd = 64.5 (20.77, 108.2)
Goodness of fit:SSE: 1.862e+09R-square: 0.9618Adjusted R-square: 0.9563RMSE: 1.631e+04
0 50 100 150 200 250 300 350 400 450 500
Conc_nM_XW_02_20
0
0.5
1
1.5
2
Fluo
resc
ence
_29_
3
10 5
Fluorescence_29_3 vs. Conc_nM_XW_02_20
Compound_29 General model:f(x) = Bmax*x/(x+Kd)
Coefficients (with 95% confidence bounds):
Bmax = 2.265e+05 (1.843e+05, 2.687e+05)
Kd = 67.15 (28.43, 105.9)
Goodness of fit:SSE: 1.424e+09R-square: 0.9722Adjusted R-square: 0.9683RMSE: 1.426e+04
S1.16. Binding curves of compound 29 (α-Synuclein)
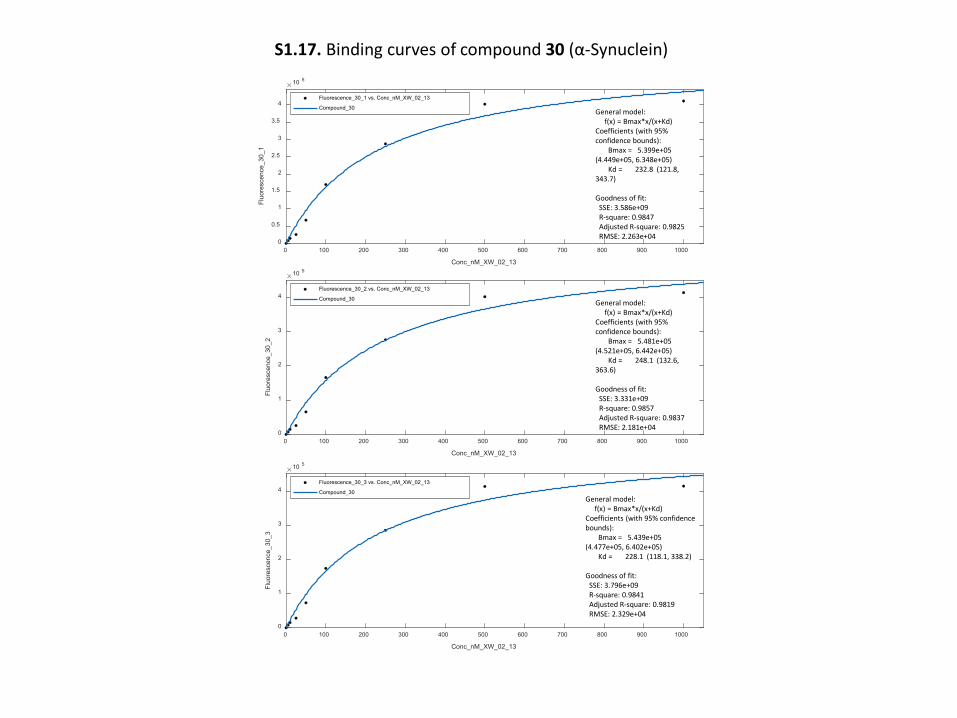
0 100 200 300 400 500 600 700 800 900 1000
Conc_nM_XW_02_13
0
0.5
1
1.5
2
2.5
3
3.5
4
Fluo
resc
ence
_30_
1
10 5
Fluorescence_30_1 vs. Conc_nM_XW_02_13
Compound_30 General model:f(x) = Bmax*x/(x+Kd)
Coefficients (with 95% confidence bounds):
Bmax = 5.399e+05 (4.449e+05, 6.348e+05)
Kd = 232.8 (121.8, 343.7)
Goodness of fit:SSE: 3.586e+09R-square: 0.9847Adjusted R-square: 0.9825RMSE: 2.263e+04
0 100 200 300 400 500 600 700 800 900 1000
Conc_nM_XW_02_13
0
1
2
3
4
Fluo
resc
ence
_30_
210 5
Fluorescence_30_2 vs. Conc_nM_XW_02_13
Compound_30 General model:f(x) = Bmax*x/(x+Kd)
Coefficients (with 95% confidence bounds):
Bmax = 5.481e+05 (4.521e+05, 6.442e+05)
Kd = 248.1 (132.6, 363.6)
Goodness of fit:SSE: 3.331e+09R-square: 0.9857Adjusted R-square: 0.9837RMSE: 2.181e+04
0 100 200 300 400 500 600 700 800 900 1000
Conc_nM_XW_02_13
0
1
2
3
4
Fluo
resc
ence
_30_
3
10 5
Fluorescence_30_3 vs. Conc_nM_XW_02_13
Compound_30General model:
f(x) = Bmax*x/(x+Kd)Coefficients (with 95% confidence bounds):
Bmax = 5.439e+05 (4.477e+05, 6.402e+05)
Kd = 228.1 (118.1, 338.2)
Goodness of fit:SSE: 3.796e+09R-square: 0.9841Adjusted R-square: 0.9819RMSE: 2.329e+04
S1.17. Binding curves of compound 30 (α-Synuclein)
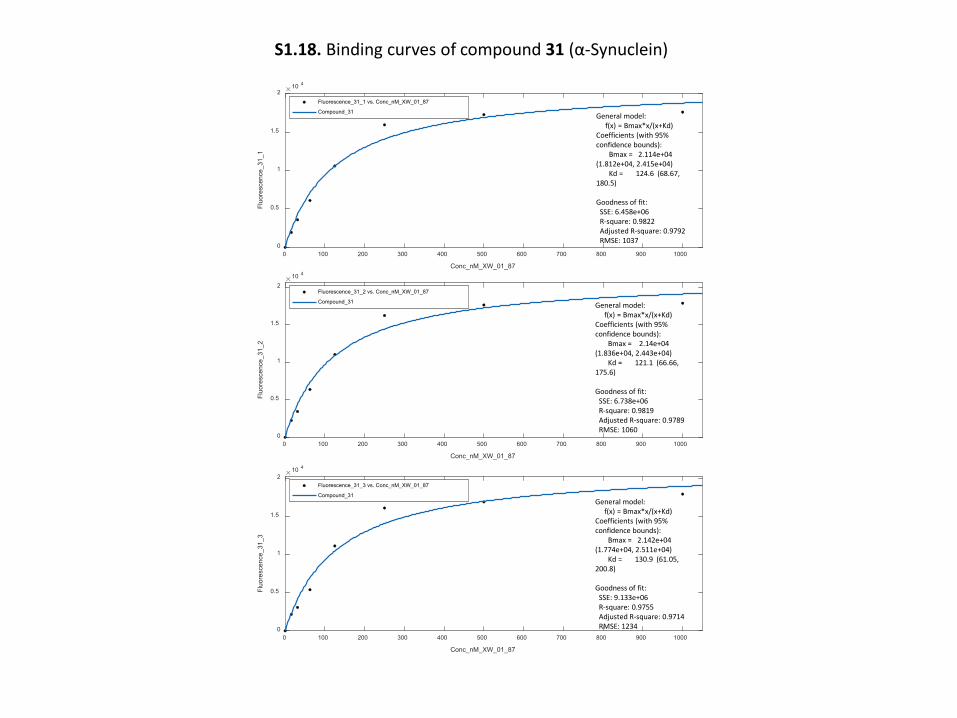
0 100 200 300 400 500 600 700 800 900 1000
Conc_nM_XW_01_87
0
0.5
1
1.5
2
Fluo
resc
ence
_31_
2
10 4
Fluorescence_31_2 vs. Conc_nM_XW_01_87
Compound_31
0 100 200 300 400 500 600 700 800 900 1000
Conc_nM_XW_01_87
0
0.5
1
1.5
2
Fluo
resc
ence
_31_
1
10 4
Fluorescence_31_1 vs. Conc_nM_XW_01_87
Compound_31
General model:f(x) = Bmax*x/(x+Kd)
Coefficients (with 95% confidence bounds):
Bmax = 2.14e+04 (1.836e+04, 2.443e+04)
Kd = 121.1 (66.66, 175.6)
Goodness of fit:SSE: 6.738e+06R-square: 0.9819Adjusted R-square: 0.9789RMSE: 1060
General model:f(x) = Bmax*x/(x+Kd)
Coefficients (with 95% confidence bounds):
Bmax = 2.114e+04 (1.812e+04, 2.415e+04)
Kd = 124.6 (68.67, 180.5)
Goodness of fit:SSE: 6.458e+06R-square: 0.9822Adjusted R-square: 0.9792RMSE: 1037
0 100 200 300 400 500 600 700 800 900 1000
Conc_nM_XW_01_87
0
0.5
1
1.5
2
Fluo
resc
ence
_31_
3
10 4
Fluorescence_31_3 vs. Conc_nM_XW_01_87
Compound_31General model:
f(x) = Bmax*x/(x+Kd)Coefficients (with 95% confidence bounds):
Bmax = 2.142e+04 (1.774e+04, 2.511e+04)
Kd = 130.9 (61.05, 200.8)
Goodness of fit:SSE: 9.133e+06R-square: 0.9755Adjusted R-square: 0.9714RMSE: 1234
S1.18. Binding curves of compound 31 (α-Synuclein)
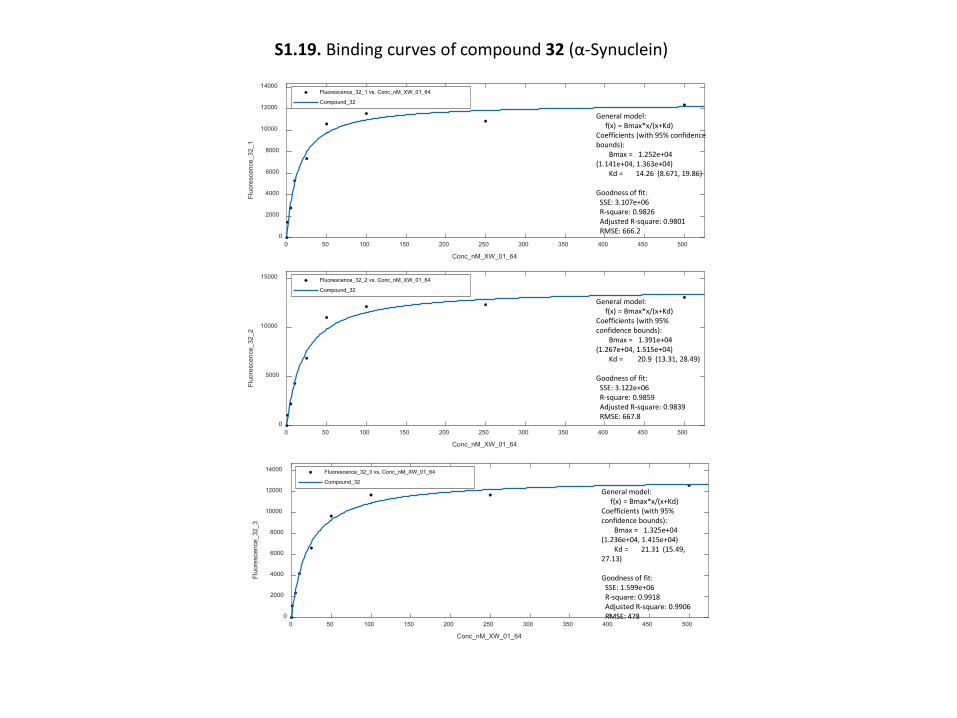
0 50 100 150 200 250 300 350 400 450 500
Conc_nM_XW_01_64
0
2000
4000
6000
8000
10000
12000
14000
Fluo
resc
ence
_32_
3
Fluorescence_32_3 vs. Conc_nM_XW_01_64
Compound_32
General model:f(x) = Bmax*x/(x+Kd)
Coefficients (with 95% confidence bounds):
Bmax = 1.325e+04 (1.236e+04, 1.415e+04)
Kd = 21.31 (15.49, 27.13)
Goodness of fit:SSE: 1.599e+06R-square: 0.9918Adjusted R-square: 0.9906RMSE: 478
0 50 100 150 200 250 300 350 400 450 500
Conc_nM_XW_01_64
0
2000
4000
6000
8000
10000
12000
14000
Fluo
resc
ence
_32_
1
Fluorescence_32_1 vs. Conc_nM_XW_01_64
Compound_32
General model:f(x) = Bmax*x/(x+Kd)
Coefficients (with 95% confidence bounds):
Bmax = 1.252e+04 (1.141e+04, 1.363e+04)
Kd = 14.26 (8.671, 19.86)
Goodness of fit:SSE: 3.107e+06R-square: 0.9826Adjusted R-square: 0.9801RMSE: 666.2
0 50 100 150 200 250 300 350 400 450 500
Conc_nM_XW_01_64
0
5000
10000
15000
Fluo
resc
ence
_32_
2
Fluorescence_32_2 vs. Conc_nM_XW_01_64
Compound_32
General model:f(x) = Bmax*x/(x+Kd)
Coefficients (with 95% confidence bounds):
Bmax = 1.391e+04 (1.267e+04, 1.515e+04)
Kd = 20.9 (13.31, 28.49)
Goodness of fit:SSE: 3.122e+06R-square: 0.9859Adjusted R-square: 0.9839RMSE: 667.8
S1.19. Binding curves of compound 32 (α-Synuclein)
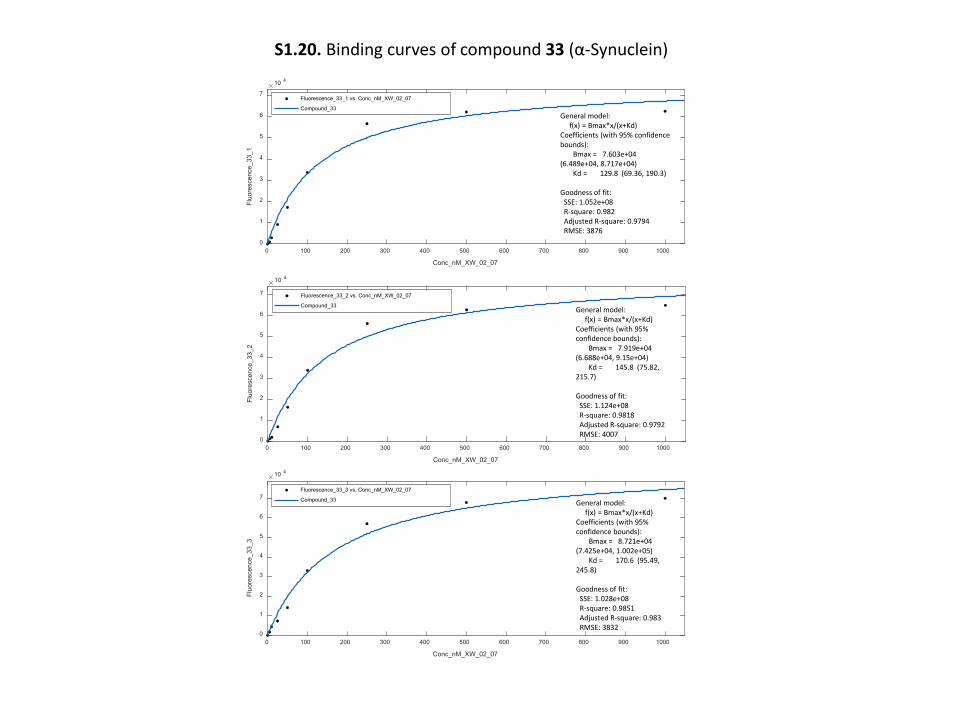
0 100 200 300 400 500 600 700 800 900 1000
Conc_nM_XW_02_07
0
1
2
3
4
5
6
7
Fluo
resc
ence
_33_
1
10 4
Fluorescence_33_1 vs. Conc_nM_XW_02_07
Compound_33General model:
f(x) = Bmax*x/(x+Kd)Coefficients (with 95% confidence bounds):
Bmax = 7.603e+04 (6.489e+04, 8.717e+04)
Kd = 129.8 (69.36, 190.3)
Goodness of fit:SSE: 1.052e+08R-square: 0.982Adjusted R-square: 0.9794RMSE: 3876
0 100 200 300 400 500 600 700 800 900 1000
Conc_nM_XW_02_07
0
1
2
3
4
5
6
7
Fluo
resc
ence
_33_
2
10 4
Fluorescence_33_2 vs. Conc_nM_XW_02_07
Compound_33 General model:f(x) = Bmax*x/(x+Kd)
Coefficients (with 95% confidence bounds):
Bmax = 7.919e+04 (6.688e+04, 9.15e+04)
Kd = 145.8 (75.82, 215.7)
Goodness of fit:SSE: 1.124e+08R-square: 0.9818Adjusted R-square: 0.9792RMSE: 4007
0 100 200 300 400 500 600 700 800 900 1000
Conc_nM_XW_02_07
0
1
2
3
4
5
6
7
Fluo
resc
ence
_33_
3
10 4
Fluorescence_33_3 vs. Conc_nM_XW_02_07
Compound_33 General model:f(x) = Bmax*x/(x+Kd)
Coefficients (with 95% confidence bounds):
Bmax = 8.721e+04 (7.425e+04, 1.002e+05)
Kd = 170.6 (95.49, 245.8)
Goodness of fit:SSE: 1.028e+08R-square: 0.9851Adjusted R-square: 0.983RMSE: 3832
S1.20. Binding curves of compound 33 (α-Synuclein)
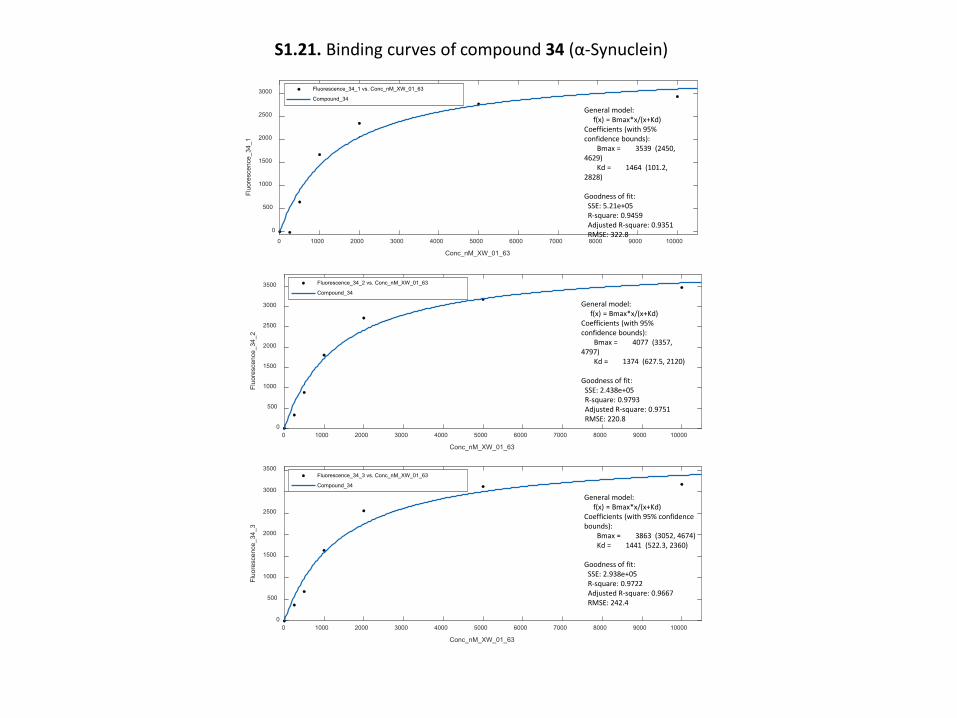
0 1000 2000 3000 4000 5000 6000 7000 8000 9000 10000
Conc_nM_XW_01_63
0
500
1000
1500
2000
2500
3000
Fluo
resc
ence
_34_
1
Fluorescence_34_1 vs. Conc_nM_XW_01_63
Compound_34
General model:f(x) = Bmax*x/(x+Kd)
Coefficients (with 95% confidence bounds):
Bmax = 3539 (2450, 4629)
Kd = 1464 (101.2, 2828)
Goodness of fit:SSE: 5.21e+05R-square: 0.9459Adjusted R-square: 0.9351RMSE: 322.8
0 1000 2000 3000 4000 5000 6000 7000 8000 9000 10000
Conc_nM_XW_01_63
0
500
1000
1500
2000
2500
3000
3500
Fluo
resc
ence
_34_
2
Fluorescence_34_2 vs. Conc_nM_XW_01_63
Compound_34
General model:f(x) = Bmax*x/(x+Kd)
Coefficients (with 95% confidence bounds):
Bmax = 4077 (3357, 4797)
Kd = 1374 (627.5, 2120)
Goodness of fit:SSE: 2.438e+05R-square: 0.9793Adjusted R-square: 0.9751RMSE: 220.8
0 1000 2000 3000 4000 5000 6000 7000 8000 9000 10000
Conc_nM_XW_01_63
0
500
1000
1500
2000
2500
3000
3500
Fluo
resc
ence
_34_
3
Fluorescence_34_3 vs. Conc_nM_XW_01_63
Compound_34
General model:f(x) = Bmax*x/(x+Kd)
Coefficients (with 95% confidence bounds):
Bmax = 3863 (3052, 4674)Kd = 1441 (522.3, 2360)
Goodness of fit:SSE: 2.938e+05R-square: 0.9722Adjusted R-square: 0.9667RMSE: 242.4
S1.21. Binding curves of compound 34 (α-Synuclein)
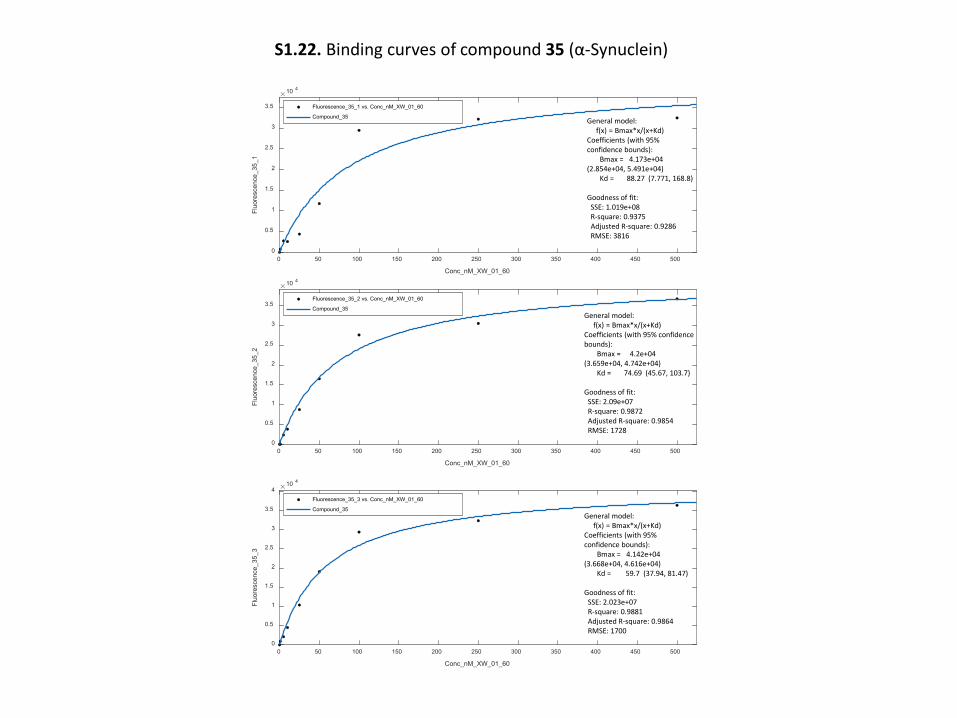
0 50 100 150 200 250 300 350 400 450 500
Conc_nM_XW_01_60
0
0.5
1
1.5
2
2.5
3
3.5
Fluo
resc
ence
_35_
1
10 4
Fluorescence_35_1 vs. Conc_nM_XW_01_60
Compound_35 General model:f(x) = Bmax*x/(x+Kd)
Coefficients (with 95% confidence bounds):
Bmax = 4.173e+04 (2.854e+04, 5.491e+04)
Kd = 88.27 (7.771, 168.8)
Goodness of fit:SSE: 1.019e+08R-square: 0.9375Adjusted R-square: 0.9286RMSE: 3816
0 50 100 150 200 250 300 350 400 450 500
Conc_nM_XW_01_60
0
0.5
1
1.5
2
2.5
3
3.5
Fluo
resc
ence
_35_
2
10 4
Fluorescence_35_2 vs. Conc_nM_XW_01_60
Compound_35General model:
f(x) = Bmax*x/(x+Kd)Coefficients (with 95% confidence bounds):
Bmax = 4.2e+04 (3.659e+04, 4.742e+04)
Kd = 74.69 (45.67, 103.7)
Goodness of fit:SSE: 2.09e+07R-square: 0.9872Adjusted R-square: 0.9854RMSE: 1728
0 50 100 150 200 250 300 350 400 450 500
Conc_nM_XW_01_60
0
0.5
1
1.5
2
2.5
3
3.5
4
Fluo
resc
ence
_35_
3
10 4
Fluorescence_35_3 vs. Conc_nM_XW_01_60
Compound_35General model:
f(x) = Bmax*x/(x+Kd)Coefficients (with 95% confidence bounds):
Bmax = 4.142e+04 (3.668e+04, 4.616e+04)
Kd = 59.7 (37.94, 81.47)
Goodness of fit:SSE: 2.023e+07R-square: 0.9881Adjusted R-square: 0.9864RMSE: 1700
S1.22. Binding curves of compound 35 (α-Synuclein)
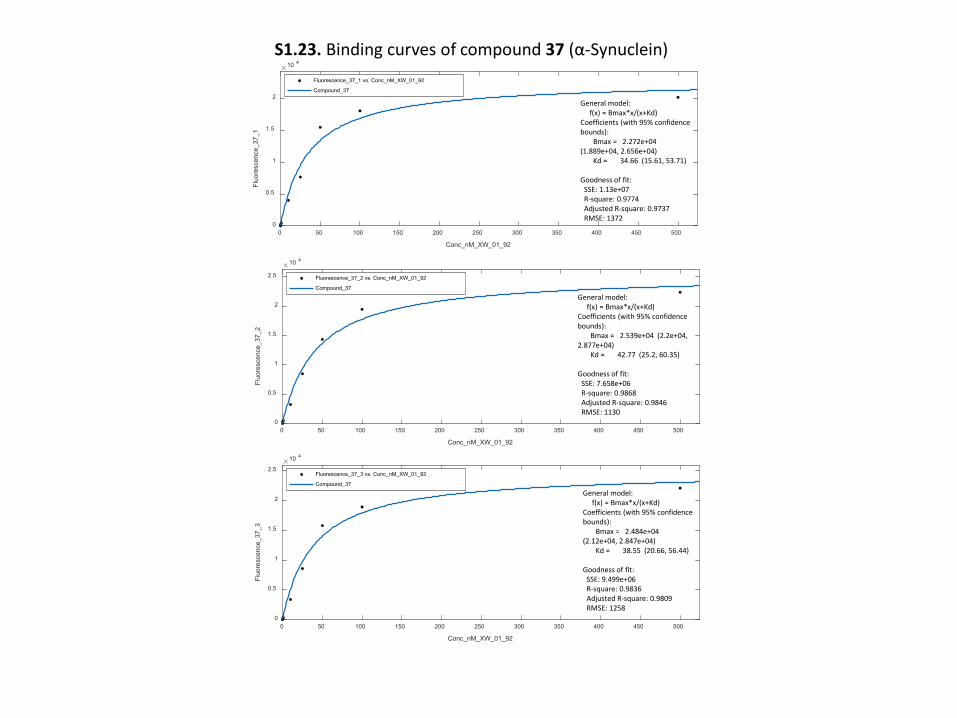
0 50 100 150 200 250 300 350 400 450 500
Conc_nM_XW_01_92
0
0.5
1
1.5
2
Fluo
resc
ence
_37_
1
10 4
Fluorescence_37_1 vs. Conc_nM_XW_01_92
Compound_37
General model:f(x) = Bmax*x/(x+Kd)
Coefficients (with 95% confidence bounds):
Bmax = 2.272e+04 (1.889e+04, 2.656e+04)
Kd = 34.66 (15.61, 53.71)
Goodness of fit:SSE: 1.13e+07R-square: 0.9774Adjusted R-square: 0.9737RMSE: 1372
0 50 100 150 200 250 300 350 400 450 500
Conc_nM_XW_01_92
0
0.5
1
1.5
2
2.5
Fluo
resc
ence
_37_
210 4
Fluorescence_37_2 vs. Conc_nM_XW_01_92
Compound_37
General model:f(x) = Bmax*x/(x+Kd)
Coefficients (with 95% confidence bounds):
Bmax = 2.539e+04 (2.2e+04, 2.877e+04)
Kd = 42.77 (25.2, 60.35)
Goodness of fit:SSE: 7.658e+06R-square: 0.9868Adjusted R-square: 0.9846RMSE: 1130
0 50 100 150 200 250 300 350 400 450 500
Conc_nM_XW_01_92
0
0.5
1
1.5
2
2.5
Fluo
resc
ence
_37_
3
10 4
Fluorescence_37_3 vs. Conc_nM_XW_01_92
Compound_37
General model:f(x) = Bmax*x/(x+Kd)
Coefficients (with 95% confidence bounds):
Bmax = 2.484e+04 (2.12e+04, 2.847e+04)
Kd = 38.55 (20.66, 56.44)
Goodness of fit:SSE: 9.499e+06R-square: 0.9836Adjusted R-square: 0.9809RMSE: 1258
S1.23. Binding curves of compound 37 (α-Synuclein)
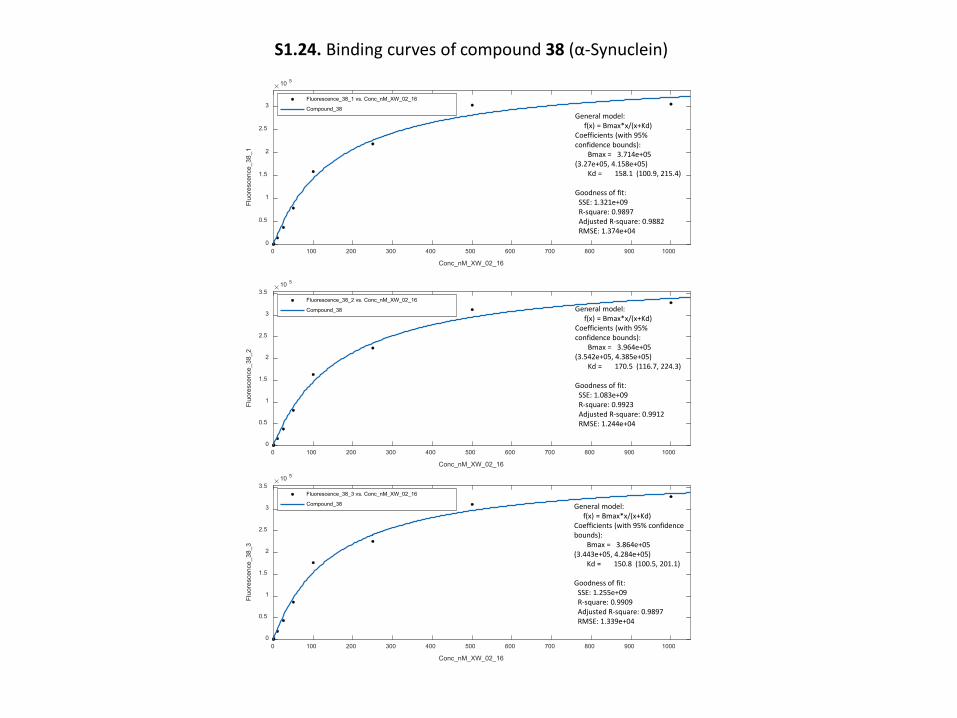
0 100 200 300 400 500 600 700 800 900 1000
Conc_nM_XW_02_16
0
0.5
1
1.5
2
2.5
3
Fluo
resc
ence
_38_
1
10 5
Fluorescence_38_1 vs. Conc_nM_XW_02_16
Compound_38General model:
f(x) = Bmax*x/(x+Kd)Coefficients (with 95% confidence bounds):
Bmax = 3.714e+05 (3.27e+05, 4.158e+05)
Kd = 158.1 (100.9, 215.4)
Goodness of fit:SSE: 1.321e+09R-square: 0.9897Adjusted R-square: 0.9882RMSE: 1.374e+04
0 100 200 300 400 500 600 700 800 900 1000
Conc_nM_XW_02_16
0
0.5
1
1.5
2
2.5
3
3.5
Fluo
resc
ence
_38_
2
10 5
Fluorescence_38_2 vs. Conc_nM_XW_02_16
Compound_38 General model:f(x) = Bmax*x/(x+Kd)
Coefficients (with 95% confidence bounds):
Bmax = 3.964e+05 (3.542e+05, 4.385e+05)
Kd = 170.5 (116.7, 224.3)
Goodness of fit:SSE: 1.083e+09R-square: 0.9923Adjusted R-square: 0.9912RMSE: 1.244e+04
0 100 200 300 400 500 600 700 800 900 1000
Conc_nM_XW_02_16
0
0.5
1
1.5
2
2.5
3
3.5
Fluo
resc
ence
_38_
3
10 5
Fluorescence_38_3 vs. Conc_nM_XW_02_16
Compound_38 General model:f(x) = Bmax*x/(x+Kd)
Coefficients (with 95% confidence bounds):
Bmax = 3.864e+05 (3.443e+05, 4.284e+05)
Kd = 150.8 (100.5, 201.1)
Goodness of fit:SSE: 1.255e+09R-square: 0.9909Adjusted R-square: 0.9897RMSE: 1.339e+04
S1.24. Binding curves of compound 38 (α-Synuclein)
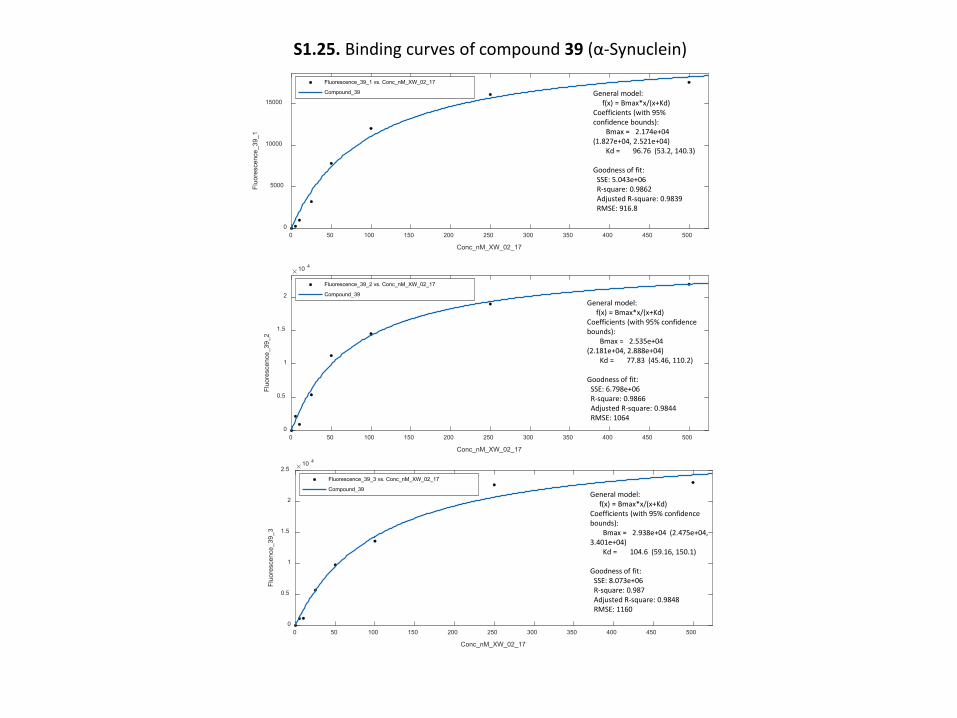
0 50 100 150 200 250 300 350 400 450 500
Conc_nM_XW_02_17
0
5000
10000
15000
Fluo
resc
ence
_39_
1
Fluorescence_39_1 vs. Conc_nM_XW_02_17
Compound_39 General model:f(x) = Bmax*x/(x+Kd)
Coefficients (with 95% confidence bounds):
Bmax = 2.174e+04 (1.827e+04, 2.521e+04)
Kd = 96.76 (53.2, 140.3)
Goodness of fit:SSE: 5.043e+06R-square: 0.9862Adjusted R-square: 0.9839RMSE: 916.8
0 50 100 150 200 250 300 350 400 450 500
Conc_nM_XW_02_17
0
0.5
1
1.5
2
Fluo
resc
ence
_39_
210 4
Fluorescence_39_2 vs. Conc_nM_XW_02_17
Compound_39
General model:f(x) = Bmax*x/(x+Kd)
Coefficients (with 95% confidence bounds):
Bmax = 2.535e+04 (2.181e+04, 2.888e+04)
Kd = 77.83 (45.46, 110.2)
Goodness of fit:SSE: 6.798e+06R-square: 0.9866Adjusted R-square: 0.9844RMSE: 1064
0 50 100 150 200 250 300 350 400 450 500
Conc_nM_XW_02_17
0
0.5
1
1.5
2
2.5
Fluo
resc
ence
_39_
3
10 4
Fluorescence_39_3 vs. Conc_nM_XW_02_17
Compound_39General model:
f(x) = Bmax*x/(x+Kd)Coefficients (with 95% confidence bounds):
Bmax = 2.938e+04 (2.475e+04, 3.401e+04)
Kd = 104.6 (59.16, 150.1)
Goodness of fit:SSE: 8.073e+06R-square: 0.987Adjusted R-square: 0.9848RMSE: 1160
S1.25. Binding curves of compound 39 (α-Synuclein)
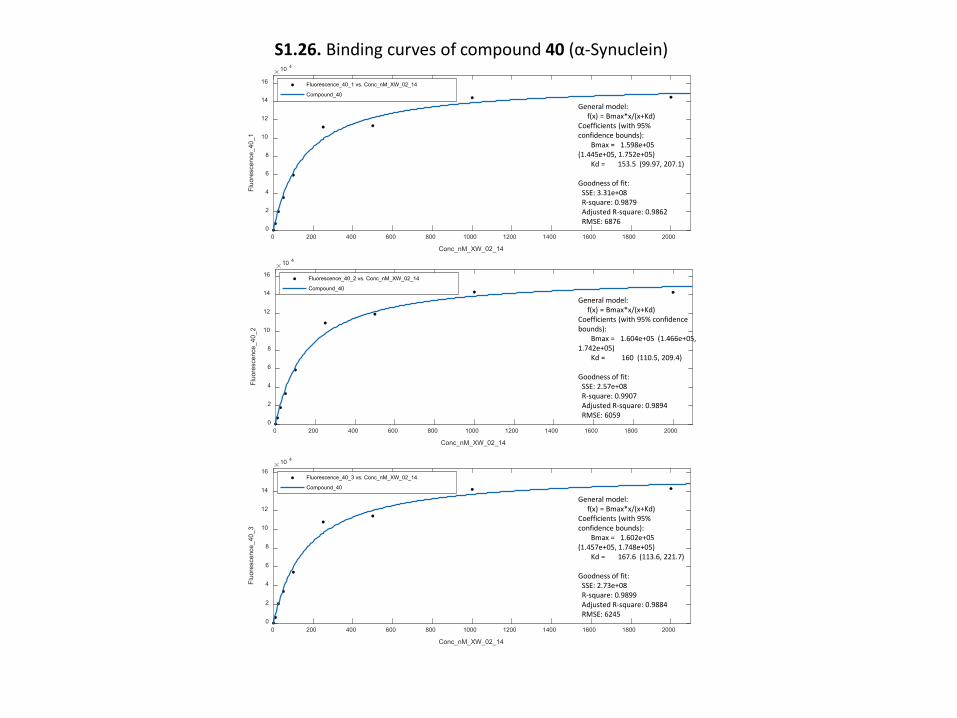
0 200 400 600 800 1000 1200 1400 1600 1800 2000
Conc_nM_XW_02_14
0
2
4
6
8
10
12
14
16
Fluo
resc
ence
_40_
1
10 4
Fluorescence_40_1 vs. Conc_nM_XW_02_14
Compound_40
General model:f(x) = Bmax*x/(x+Kd)
Coefficients (with 95% confidence bounds):
Bmax = 1.598e+05 (1.445e+05, 1.752e+05)
Kd = 153.5 (99.97, 207.1)
Goodness of fit:SSE: 3.31e+08R-square: 0.9879Adjusted R-square: 0.9862RMSE: 6876
0 200 400 600 800 1000 1200 1400 1600 1800 2000
Conc_nM_XW_02_14
0
2
4
6
8
10
12
14
16
Fluo
resc
ence
_40_
210 4
Fluorescence_40_2 vs. Conc_nM_XW_02_14
Compound_40
General model:f(x) = Bmax*x/(x+Kd)
Coefficients (with 95% confidence bounds):
Bmax = 1.604e+05 (1.466e+05, 1.742e+05)
Kd = 160 (110.5, 209.4)
Goodness of fit:SSE: 2.57e+08R-square: 0.9907Adjusted R-square: 0.9894RMSE: 6059
0 200 400 600 800 1000 1200 1400 1600 1800 2000
Conc_nM_XW_02_14
0
2
4
6
8
10
12
14
16
Fluo
resc
ence
_40_
3
10 4
Fluorescence_40_3 vs. Conc_nM_XW_02_14
Compound_40
General model:f(x) = Bmax*x/(x+Kd)
Coefficients (with 95% confidence bounds):
Bmax = 1.602e+05 (1.457e+05, 1.748e+05)
Kd = 167.6 (113.6, 221.7)
Goodness of fit:SSE: 2.73e+08R-square: 0.9899Adjusted R-square: 0.9884RMSE: 6245
S1.26. Binding curves of compound 40 (α-Synuclein)
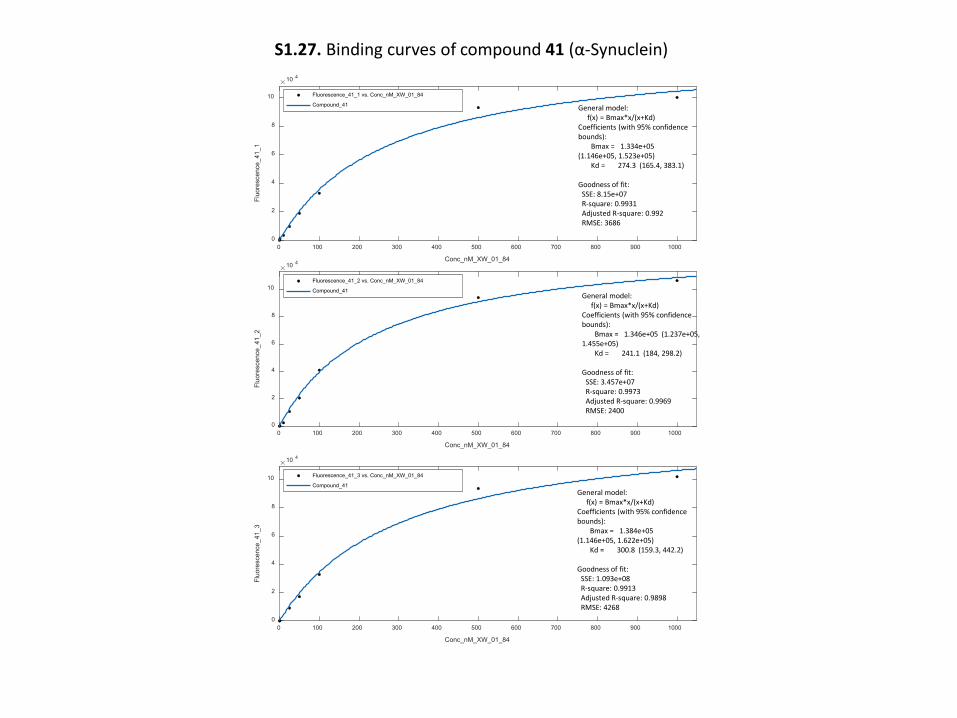
0 100 200 300 400 500 600 700 800 900 1000
Conc_nM_XW_01_84
0
2
4
6
8
10
Fluo
resc
ence
_41_
1
10 4
Fluorescence_41_1 vs. Conc_nM_XW_01_84
Compound_41 General model:f(x) = Bmax*x/(x+Kd)
Coefficients (with 95% confidence bounds):
Bmax = 1.334e+05 (1.146e+05, 1.523e+05)
Kd = 274.3 (165.4, 383.1)
Goodness of fit:SSE: 8.15e+07R-square: 0.9931Adjusted R-square: 0.992RMSE: 3686
0 100 200 300 400 500 600 700 800 900 1000
Conc_nM_XW_01_84
0
2
4
6
8
10
Fluo
resc
ence
_41_
210 4
Fluorescence_41_2 vs. Conc_nM_XW_01_84
Compound_41General model:
f(x) = Bmax*x/(x+Kd)Coefficients (with 95% confidence bounds):
Bmax = 1.346e+05 (1.237e+05, 1.455e+05)
Kd = 241.1 (184, 298.2)
Goodness of fit:SSE: 3.457e+07R-square: 0.9973Adjusted R-square: 0.9969RMSE: 2400
0 100 200 300 400 500 600 700 800 900 1000
Conc_nM_XW_01_84
0
2
4
6
8
10
Fluo
resc
ence
_41_
3
10 4
Fluorescence_41_3 vs. Conc_nM_XW_01_84
Compound_41General model:
f(x) = Bmax*x/(x+Kd)Coefficients (with 95% confidence bounds):
Bmax = 1.384e+05 (1.146e+05, 1.622e+05)
Kd = 300.8 (159.3, 442.2)
Goodness of fit:SSE: 1.093e+08R-square: 0.9913Adjusted R-square: 0.9898RMSE: 4268
S1.27. Binding curves of compound 41 (α-Synuclein)
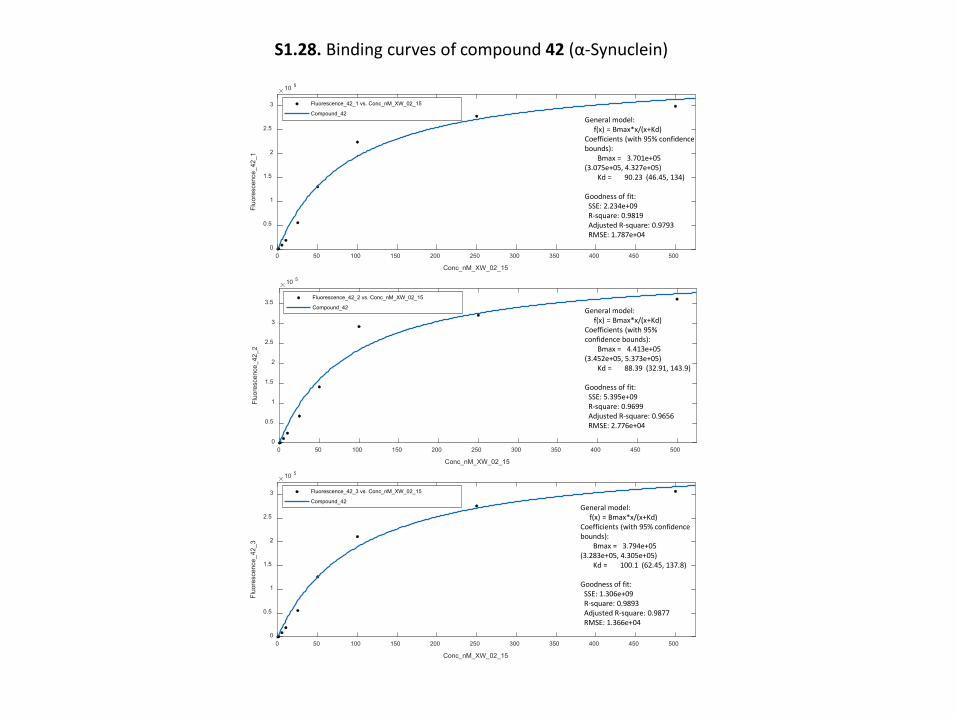
0 50 100 150 200 250 300 350 400 450 500
Conc_nM_XW_02_15
0
0.5
1
1.5
2
2.5
3
Fluo
resc
ence
_42_
1
10 5
Fluorescence_42_1 vs. Conc_nM_XW_02_15
Compound_42General model:
f(x) = Bmax*x/(x+Kd)Coefficients (with 95% confidence bounds):
Bmax = 3.701e+05 (3.075e+05, 4.327e+05)
Kd = 90.23 (46.45, 134)
Goodness of fit:SSE: 2.234e+09R-square: 0.9819Adjusted R-square: 0.9793RMSE: 1.787e+04
0 50 100 150 200 250 300 350 400 450 500
Conc_nM_XW_02_15
0
0.5
1
1.5
2
2.5
3
3.5
Fluo
resc
ence
_42_
2
10 5
Fluorescence_42_2 vs. Conc_nM_XW_02_15
Compound_42 General model:f(x) = Bmax*x/(x+Kd)
Coefficients (with 95% confidence bounds):
Bmax = 4.413e+05 (3.452e+05, 5.373e+05)
Kd = 88.39 (32.91, 143.9)
Goodness of fit:SSE: 5.395e+09R-square: 0.9699Adjusted R-square: 0.9656RMSE: 2.776e+04
0 50 100 150 200 250 300 350 400 450 500
Conc_nM_XW_02_15
0
0.5
1
1.5
2
2.5
3
Fluo
resc
ence
_42_
3
10 5
Fluorescence_42_3 vs. Conc_nM_XW_02_15
Compound_42General model:
f(x) = Bmax*x/(x+Kd)Coefficients (with 95% confidence bounds):
Bmax = 3.794e+05 (3.283e+05, 4.305e+05)
Kd = 100.1 (62.45, 137.8)
Goodness of fit:SSE: 1.306e+09R-square: 0.9893Adjusted R-square: 0.9877RMSE: 1.366e+04
S1.28. Binding curves of compound 42 (α-Synuclein)
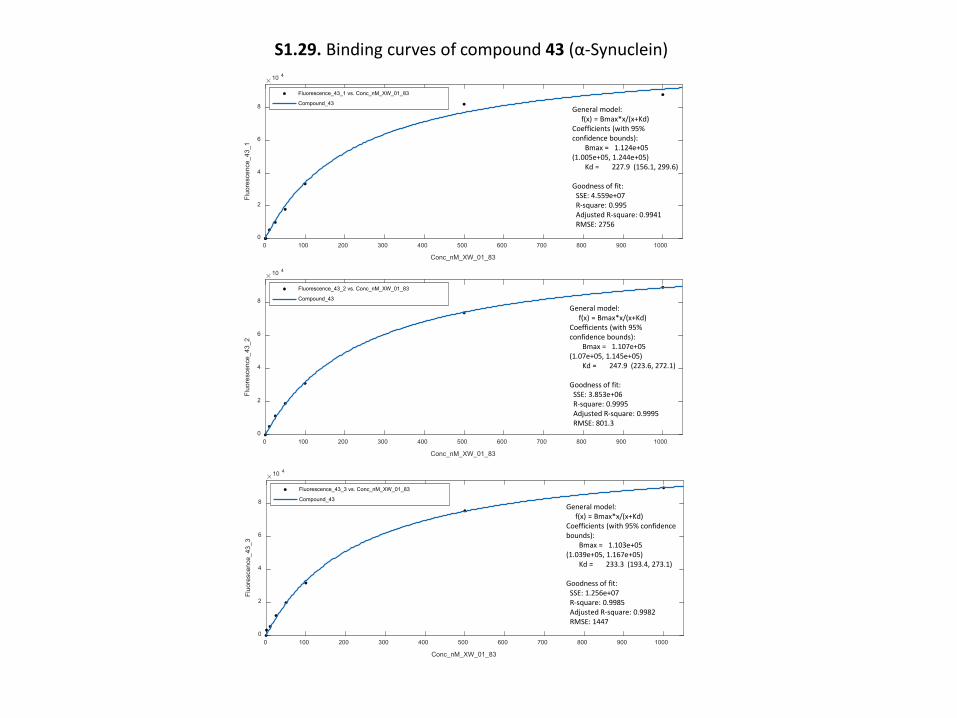
0 100 200 300 400 500 600 700 800 900 1000
Conc_nM_XW_01_83
0
2
4
6
8
Fluo
resc
ence
_43_
1
10 4
Fluorescence_43_1 vs. Conc_nM_XW_01_83
Compound_43General model:
f(x) = Bmax*x/(x+Kd)Coefficients (with 95% confidence bounds):
Bmax = 1.124e+05 (1.005e+05, 1.244e+05)
Kd = 227.9 (156.1, 299.6)
Goodness of fit:SSE: 4.559e+07R-square: 0.995Adjusted R-square: 0.9941RMSE: 2756
0 100 200 300 400 500 600 700 800 900 1000
Conc_nM_XW_01_83
0
2
4
6
8
Fluo
resc
ence
_43_
2
10 4
Fluorescence_43_2 vs. Conc_nM_XW_01_83
Compound_43
General model:f(x) = Bmax*x/(x+Kd)
Coefficients (with 95% confidence bounds):
Bmax = 1.107e+05 (1.07e+05, 1.145e+05)
Kd = 247.9 (223.6, 272.1)
Goodness of fit:SSE: 3.853e+06R-square: 0.9995Adjusted R-square: 0.9995RMSE: 801.3
0 100 200 300 400 500 600 700 800 900 1000
Conc_nM_XW_01_83
0
2
4
6
8
Fluo
resc
ence
_43_
3
10 4
Fluorescence_43_3 vs. Conc_nM_XW_01_83
Compound_43General model:
f(x) = Bmax*x/(x+Kd)Coefficients (with 95% confidence bounds):
Bmax = 1.103e+05 (1.039e+05, 1.167e+05)
Kd = 233.3 (193.4, 273.1)
Goodness of fit:SSE: 1.256e+07R-square: 0.9985Adjusted R-square: 0.9982RMSE: 1447
S1.29. Binding curves of compound 43 (α-Synuclein)
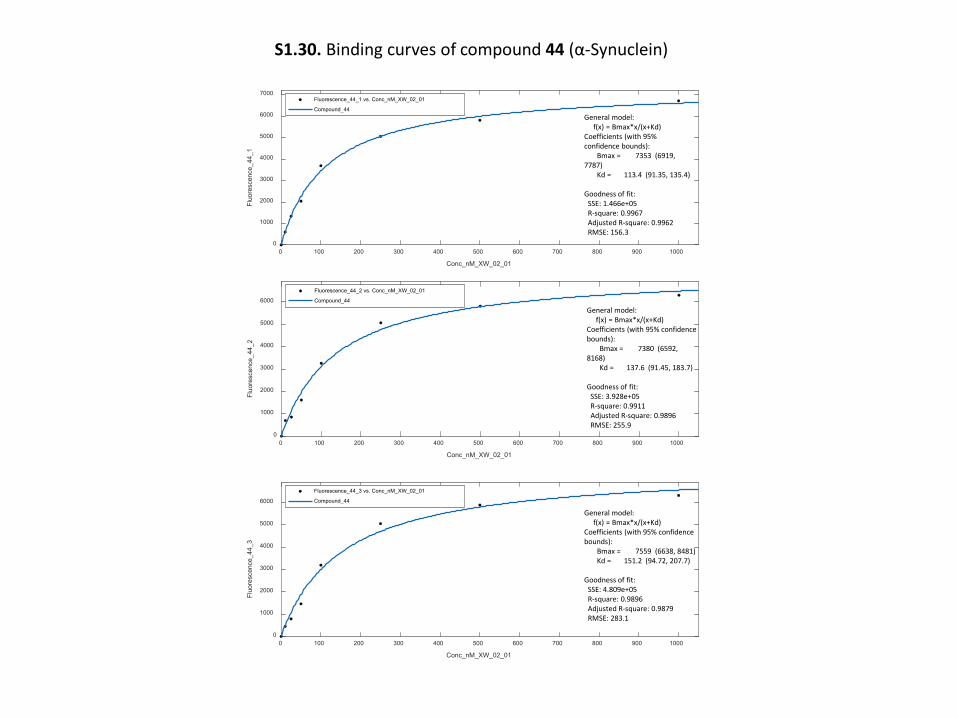
0 100 200 300 400 500 600 700 800 900 1000
Conc_nM_XW_02_01
0
1000
2000
3000
4000
5000
6000
7000
Fluo
resc
ence
_44_
1
Fluorescence_44_1 vs. Conc_nM_XW_02_01
Compound_44General model:
f(x) = Bmax*x/(x+Kd)Coefficients (with 95% confidence bounds):
Bmax = 7353 (6919, 7787)
Kd = 113.4 (91.35, 135.4)
Goodness of fit:SSE: 1.466e+05R-square: 0.9967Adjusted R-square: 0.9962RMSE: 156.3
0 100 200 300 400 500 600 700 800 900 1000
Conc_nM_XW_02_01
0
1000
2000
3000
4000
5000
6000
Fluo
resc
ence
_44_
2
Fluorescence_44_2 vs. Conc_nM_XW_02_01
Compound_44
General model:f(x) = Bmax*x/(x+Kd)
Coefficients (with 95% confidence bounds):
Bmax = 7380 (6592, 8168)
Kd = 137.6 (91.45, 183.7)
Goodness of fit:SSE: 3.928e+05R-square: 0.9911Adjusted R-square: 0.9896RMSE: 255.9
0 100 200 300 400 500 600 700 800 900 1000
Conc_nM_XW_02_01
0
1000
2000
3000
4000
5000
6000
Fluo
resc
ence
_44_
3
Fluorescence_44_3 vs. Conc_nM_XW_02_01
Compound_44
General model:f(x) = Bmax*x/(x+Kd)
Coefficients (with 95% confidence bounds):
Bmax = 7559 (6638, 8481)Kd = 151.2 (94.72, 207.7)
Goodness of fit:SSE: 4.809e+05R-square: 0.9896Adjusted R-square: 0.9879RMSE: 283.1
S1.30. Binding curves of compound 44 (α-Synuclein)
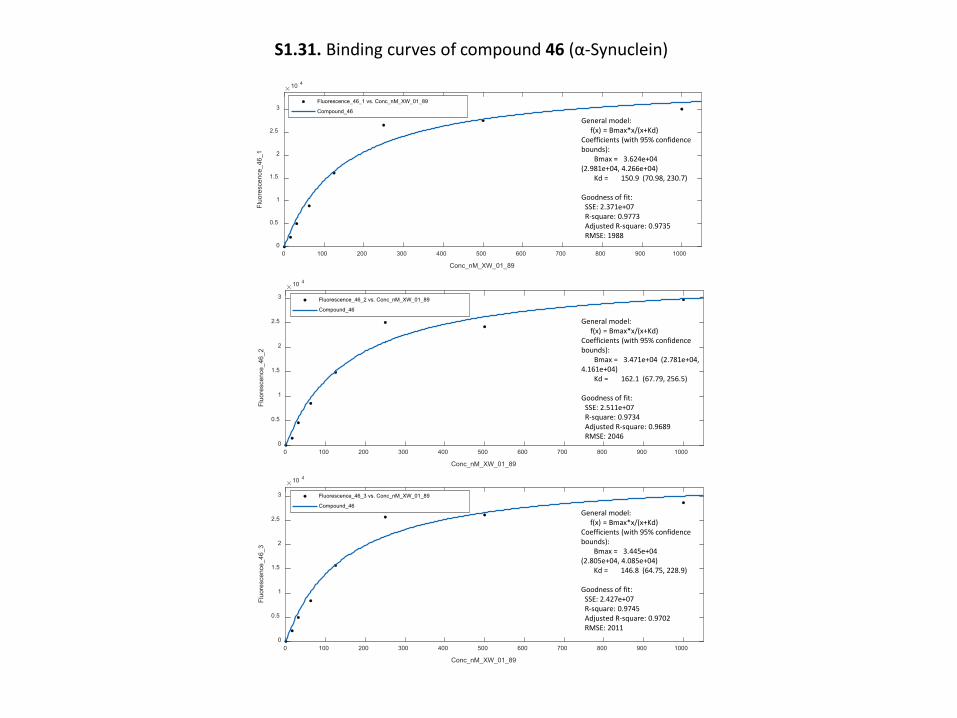
0 100 200 300 400 500 600 700 800 900 1000
Conc_nM_XW_01_89
0
0.5
1
1.5
2
2.5
3
Fluo
resc
ence
_46_
1
10 4
Fluorescence_46_1 vs. Conc_nM_XW_01_89
Compound_46
General model:f(x) = Bmax*x/(x+Kd)
Coefficients (with 95% confidence bounds):
Bmax = 3.624e+04 (2.981e+04, 4.266e+04)
Kd = 150.9 (70.98, 230.7)
Goodness of fit:SSE: 2.371e+07R-square: 0.9773Adjusted R-square: 0.9735RMSE: 1988
0 100 200 300 400 500 600 700 800 900 1000
Conc_nM_XW_01_89
0
0.5
1
1.5
2
2.5
3
Fluo
resc
ence
_46_
2
10 4
Fluorescence_46_2 vs. Conc_nM_XW_01_89
Compound_46
General model:f(x) = Bmax*x/(x+Kd)
Coefficients (with 95% confidence bounds):
Bmax = 3.471e+04 (2.781e+04, 4.161e+04)
Kd = 162.1 (67.79, 256.5)
Goodness of fit:SSE: 2.511e+07R-square: 0.9734Adjusted R-square: 0.9689RMSE: 2046
0 100 200 300 400 500 600 700 800 900 1000
Conc_nM_XW_01_89
0
0.5
1
1.5
2
2.5
3
Fluo
resc
ence
_46_
3
10 4
Fluorescence_46_3 vs. Conc_nM_XW_01_89
Compound_46General model:
f(x) = Bmax*x/(x+Kd)Coefficients (with 95% confidence bounds):
Bmax = 3.445e+04 (2.805e+04, 4.085e+04)
Kd = 146.8 (64.75, 228.9)
Goodness of fit:SSE: 2.427e+07R-square: 0.9745Adjusted R-square: 0.9702RMSE: 2011
S1.31. Binding curves of compound 46 (α-Synuclein)
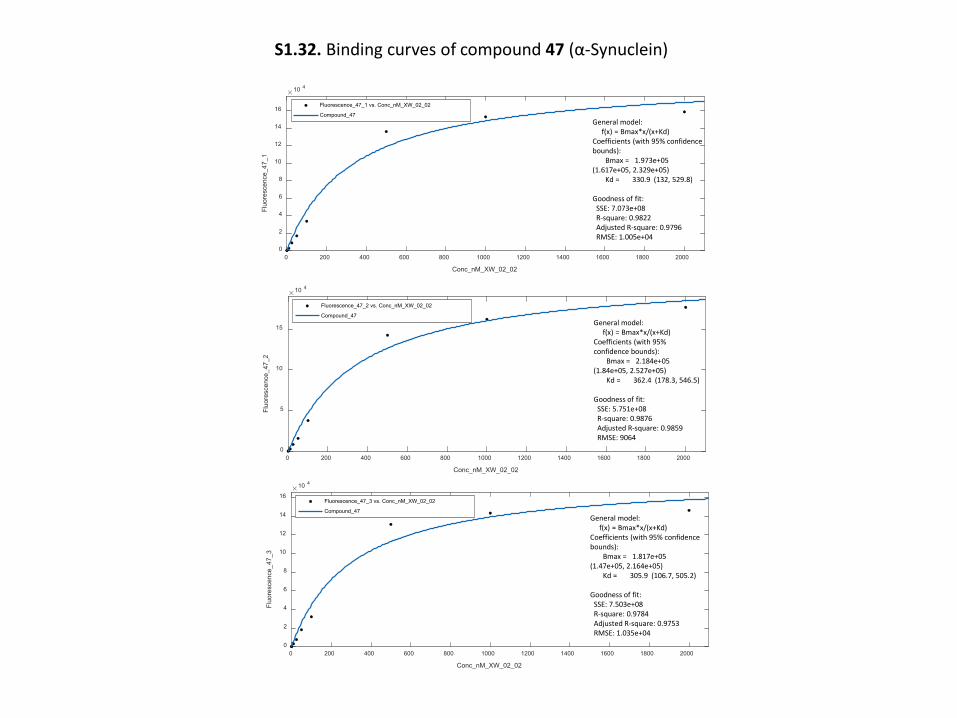
0 200 400 600 800 1000 1200 1400 1600 1800 2000
Conc_nM_XW_02_02
0
2
4
6
8
10
12
14
16
Fluo
resc
ence
_47_
1
10 4
Fluorescence_47_1 vs. Conc_nM_XW_02_02
Compound_47General model:
f(x) = Bmax*x/(x+Kd)Coefficients (with 95% confidence bounds):
Bmax = 1.973e+05 (1.617e+05, 2.329e+05)
Kd = 330.9 (132, 529.8)
Goodness of fit:SSE: 7.073e+08R-square: 0.9822Adjusted R-square: 0.9796RMSE: 1.005e+04
0 200 400 600 800 1000 1200 1400 1600 1800 2000
Conc_nM_XW_02_02
0
5
10
15
Fluo
resc
ence
_47_
2
10 4
Fluorescence_47_2 vs. Conc_nM_XW_02_02
Compound_47General model:
f(x) = Bmax*x/(x+Kd)Coefficients (with 95% confidence bounds):
Bmax = 2.184e+05 (1.84e+05, 2.527e+05)
Kd = 362.4 (178.3, 546.5)
Goodness of fit:SSE: 5.751e+08R-square: 0.9876Adjusted R-square: 0.9859RMSE: 9064
0 200 400 600 800 1000 1200 1400 1600 1800 2000
Conc_nM_XW_02_02
0
2
4
6
8
10
12
14
16
Fluo
resc
ence
_47_
3
10 4
Fluorescence_47_3 vs. Conc_nM_XW_02_02
Compound_47General model:
f(x) = Bmax*x/(x+Kd)Coefficients (with 95% confidence bounds):
Bmax = 1.817e+05 (1.47e+05, 2.164e+05)
Kd = 305.9 (106.7, 505.2)
Goodness of fit:SSE: 7.503e+08R-square: 0.9784Adjusted R-square: 0.9753RMSE: 1.035e+04
S1.32. Binding curves of compound 47 (α-Synuclein)
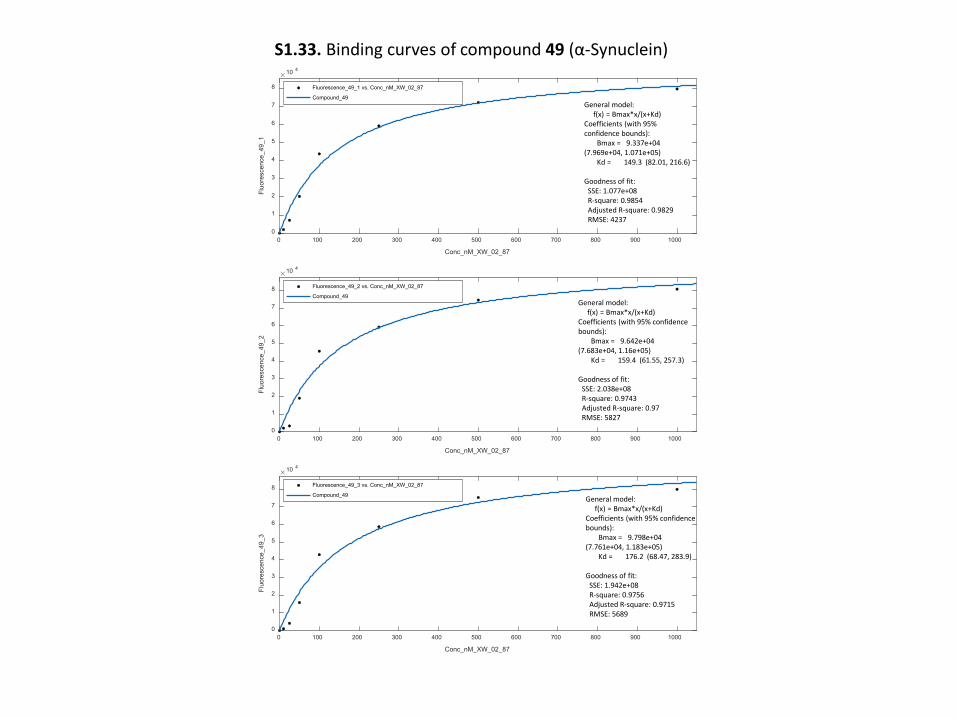
0 100 200 300 400 500 600 700 800 900 1000
Conc_nM_XW_02_87
0
1
2
3
4
5
6
7
8
Fluo
resc
ence
_49_
1
10 4
Fluorescence_49_1 vs. Conc_nM_XW_02_87
Compound_49
0 100 200 300 400 500 600 700 800 900 1000
Conc_nM_XW_02_87
0
1
2
3
4
5
6
7
8
Fluo
resc
ence
_49_
210 4
Fluorescence_49_2 vs. Conc_nM_XW_02_87
Compound_49General model:
f(x) = Bmax*x/(x+Kd)Coefficients (with 95% confidence bounds):
Bmax = 9.642e+04 (7.683e+04, 1.16e+05)
Kd = 159.4 (61.55, 257.3)
Goodness of fit:SSE: 2.038e+08R-square: 0.9743Adjusted R-square: 0.97RMSE: 5827
General model:f(x) = Bmax*x/(x+Kd)
Coefficients (with 95% confidence bounds):
Bmax = 9.337e+04 (7.969e+04, 1.071e+05)
Kd = 149.3 (82.01, 216.6)
Goodness of fit:SSE: 1.077e+08R-square: 0.9854Adjusted R-square: 0.9829RMSE: 4237
0 100 200 300 400 500 600 700 800 900 1000
Conc_nM_XW_02_87
0
1
2
3
4
5
6
7
8
Fluo
resc
ence
_49_
3
10 4
Fluorescence_49_3 vs. Conc_nM_XW_02_87
Compound_49 General model:f(x) = Bmax*x/(x+Kd)
Coefficients (with 95% confidence bounds):
Bmax = 9.798e+04 (7.761e+04, 1.183e+05)
Kd = 176.2 (68.47, 283.9)
Goodness of fit:SSE: 1.942e+08R-square: 0.9756Adjusted R-square: 0.9715RMSE: 5689
S1.33. Binding curves of compound 49 (α-Synuclein)
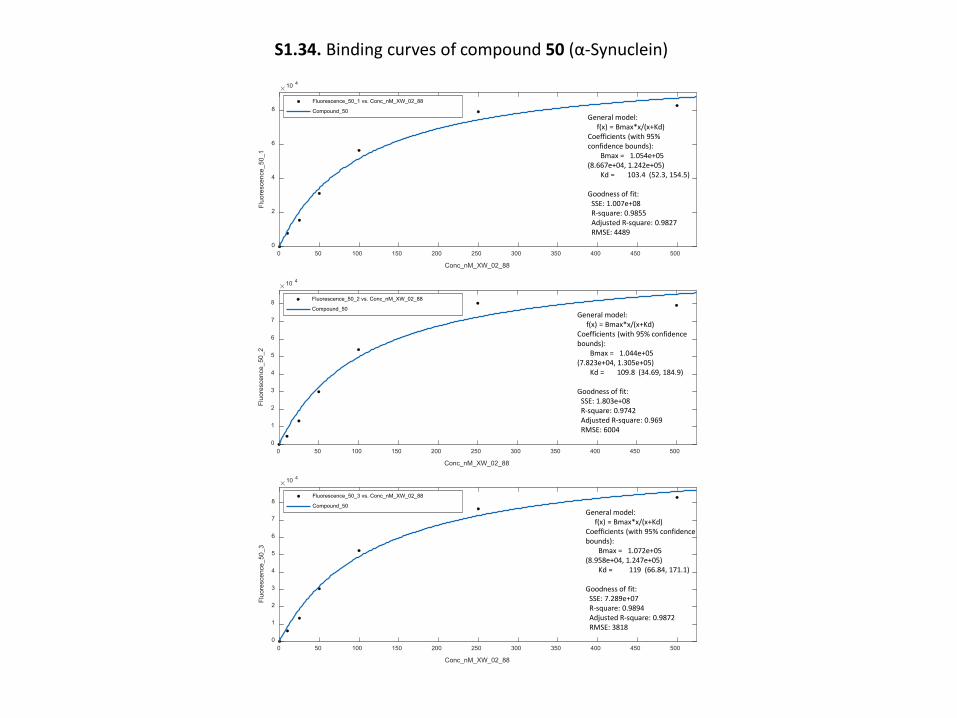
0 50 100 150 200 250 300 350 400 450 500
Conc_nM_XW_02_88
0
2
4
6
8
Fluo
resc
ence
_50_
1
10 4
Fluorescence_50_1 vs. Conc_nM_XW_02_88
Compound_50General model:
f(x) = Bmax*x/(x+Kd)Coefficients (with 95% confidence bounds):
Bmax = 1.054e+05 (8.667e+04, 1.242e+05)
Kd = 103.4 (52.3, 154.5)
Goodness of fit:SSE: 1.007e+08R-square: 0.9855Adjusted R-square: 0.9827RMSE: 4489
0 50 100 150 200 250 300 350 400 450 500
Conc_nM_XW_02_88
0
1
2
3
4
5
6
7
8
Fluo
resc
ence
_50_
2
10 4
Fluorescence_50_2 vs. Conc_nM_XW_02_88
Compound_50General model:
f(x) = Bmax*x/(x+Kd)Coefficients (with 95% confidence bounds):
Bmax = 1.044e+05 (7.823e+04, 1.305e+05)
Kd = 109.8 (34.69, 184.9)
Goodness of fit:SSE: 1.803e+08R-square: 0.9742Adjusted R-square: 0.969RMSE: 6004
0 50 100 150 200 250 300 350 400 450 500
Conc_nM_XW_02_88
0
1
2
3
4
5
6
7
8
Fluo
resc
ence
_50_
3
10 4
Fluorescence_50_3 vs. Conc_nM_XW_02_88
Compound_50General model:
f(x) = Bmax*x/(x+Kd)Coefficients (with 95% confidence bounds):
Bmax = 1.072e+05 (8.958e+04, 1.247e+05)
Kd = 119 (66.84, 171.1)
Goodness of fit:SSE: 7.289e+07R-square: 0.9894Adjusted R-square: 0.9872RMSE: 3818
S1.34. Binding curves of compound 50 (α-Synuclein)
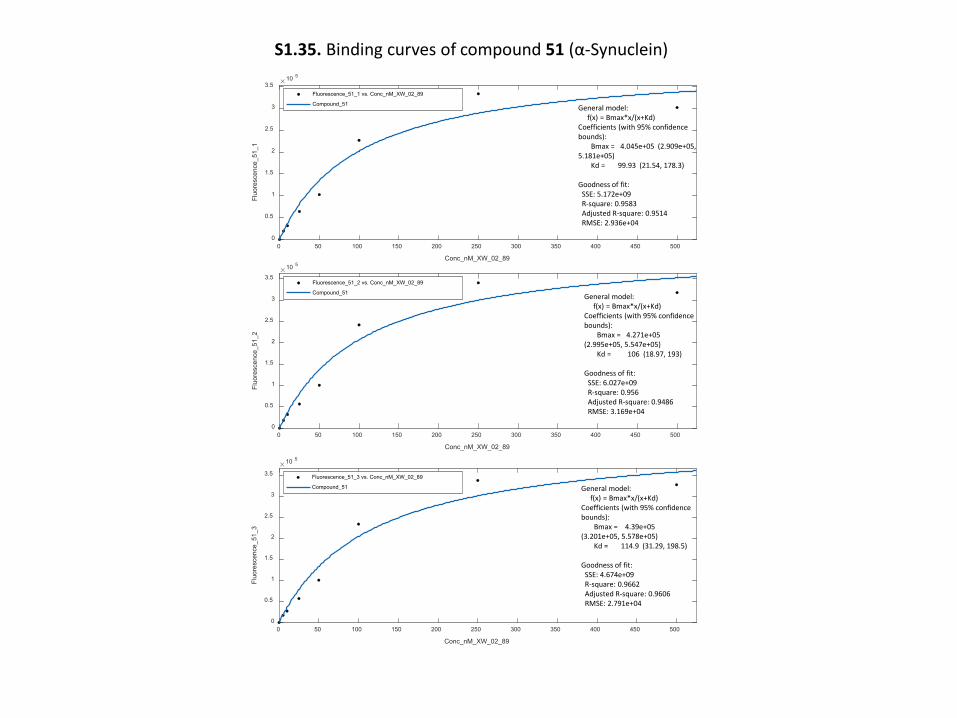
0 50 100 150 200 250 300 350 400 450 500
Conc_nM_XW_02_89
0
0.5
1
1.5
2
2.5
3
3.5
Fluo
resc
ence
_51_
1
10 5
Fluorescence_51_1 vs. Conc_nM_XW_02_89
Compound_51 General model:f(x) = Bmax*x/(x+Kd)
Coefficients (with 95% confidence bounds):
Bmax = 4.045e+05 (2.909e+05, 5.181e+05)
Kd = 99.93 (21.54, 178.3)
Goodness of fit:SSE: 5.172e+09R-square: 0.9583Adjusted R-square: 0.9514RMSE: 2.936e+04
0 50 100 150 200 250 300 350 400 450 500
Conc_nM_XW_02_89
0
0.5
1
1.5
2
2.5
3
3.5
Fluo
resc
ence
_51_
2
10 5
Fluorescence_51_2 vs. Conc_nM_XW_02_89
Compound_51 General model:f(x) = Bmax*x/(x+Kd)
Coefficients (with 95% confidence bounds):
Bmax = 4.271e+05 (2.995e+05, 5.547e+05)
Kd = 106 (18.97, 193)
Goodness of fit:SSE: 6.027e+09R-square: 0.956Adjusted R-square: 0.9486RMSE: 3.169e+04
0 50 100 150 200 250 300 350 400 450 500
Conc_nM_XW_02_89
0
0.5
1
1.5
2
2.5
3
3.5
Fluo
resc
ence
_51_
3
10 5
Fluorescence_51_3 vs. Conc_nM_XW_02_89
Compound_51 General model:f(x) = Bmax*x/(x+Kd)
Coefficients (with 95% confidence bounds):
Bmax = 4.39e+05 (3.201e+05, 5.578e+05)
Kd = 114.9 (31.29, 198.5)
Goodness of fit:SSE: 4.674e+09R-square: 0.9662Adjusted R-square: 0.9606RMSE: 2.791e+04
S1.35. Binding curves of compound 51 (α-Synuclein)
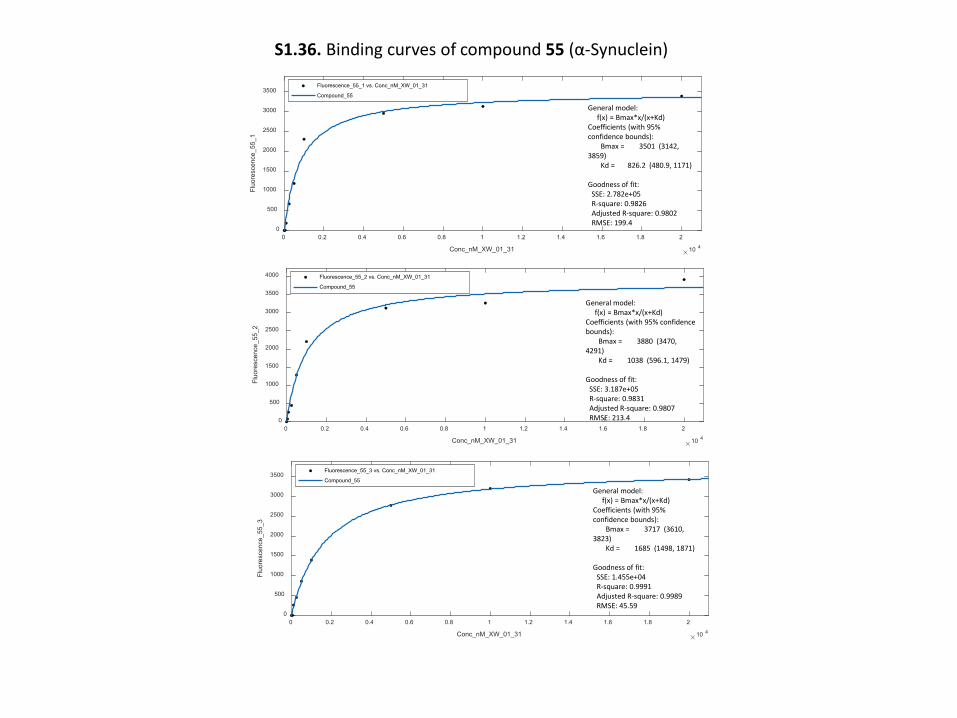
0 0.2 0.4 0.6 0.8 1 1.2 1.4 1.6 1.8 2
Conc_nM_XW_01_31 10 4
0
500
1000
1500
2000
2500
3000
3500
Fluo
resc
ence
_55_
1
Fluorescence_55_1 vs. Conc_nM_XW_01_31
Compound_55
General model:f(x) = Bmax*x/(x+Kd)
Coefficients (with 95% confidence bounds):
Bmax = 3501 (3142, 3859)
Kd = 826.2 (480.9, 1171)
Goodness of fit:SSE: 2.782e+05R-square: 0.9826Adjusted R-square: 0.9802RMSE: 199.4
0 0.2 0.4 0.6 0.8 1 1.2 1.4 1.6 1.8 2
Conc_nM_XW_01_31 10 4
0
500
1000
1500
2000
2500
3000
3500
4000
Fluo
resc
ence
_55_
2
Fluorescence_55_2 vs. Conc_nM_XW_01_31
Compound_55
General model:f(x) = Bmax*x/(x+Kd)
Coefficients (with 95% confidence bounds):
Bmax = 3880 (3470, 4291)
Kd = 1038 (596.1, 1479)
Goodness of fit:SSE: 3.187e+05R-square: 0.9831Adjusted R-square: 0.9807RMSE: 213.4
0 0.2 0.4 0.6 0.8 1 1.2 1.4 1.6 1.8 2
Conc_nM_XW_01_31 10 4
0
500
1000
1500
2000
2500
3000
3500
Fluo
resc
ence
_55_
3
Fluorescence_55_3 vs. Conc_nM_XW_01_31
Compound_55
General model:f(x) = Bmax*x/(x+Kd)
Coefficients (with 95% confidence bounds):
Bmax = 3717 (3610, 3823)
Kd = 1685 (1498, 1871)
Goodness of fit:SSE: 1.455e+04R-square: 0.9991Adjusted R-square: 0.9989RMSE: 45.59
S1.36. Binding curves of compound 55 (α-Synuclein)
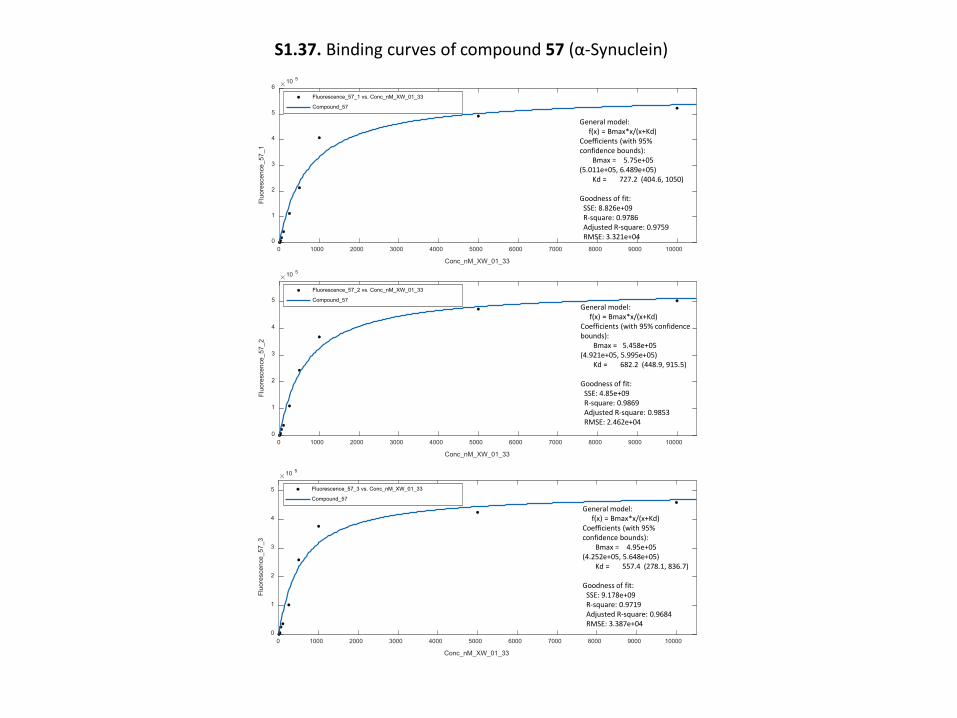
0 1000 2000 3000 4000 5000 6000 7000 8000 9000 10000
Conc_nM_XW_01_33
0
1
2
3
4
5
6
Fluo
resc
ence
_57_
1
10 5
Fluorescence_57_1 vs. Conc_nM_XW_01_33
Compound_57
General model:f(x) = Bmax*x/(x+Kd)
Coefficients (with 95% confidence bounds):
Bmax = 5.75e+05 (5.011e+05, 6.489e+05)
Kd = 727.2 (404.6, 1050)
Goodness of fit:SSE: 8.826e+09R-square: 0.9786Adjusted R-square: 0.9759RMSE: 3.321e+04
0 1000 2000 3000 4000 5000 6000 7000 8000 9000 10000
Conc_nM_XW_01_33
0
1
2
3
4
5
Fluo
resc
ence
_57_
2
10 5
Fluorescence_57_2 vs. Conc_nM_XW_01_33
Compound_57General model:
f(x) = Bmax*x/(x+Kd)Coefficients (with 95% confidence bounds):
Bmax = 5.458e+05 (4.921e+05, 5.995e+05)
Kd = 682.2 (448.9, 915.5)
Goodness of fit:SSE: 4.85e+09R-square: 0.9869Adjusted R-square: 0.9853RMSE: 2.462e+04
0 1000 2000 3000 4000 5000 6000 7000 8000 9000 10000
Conc_nM_XW_01_33
0
1
2
3
4
5
Fluo
resc
ence
_57_
3
10 5
Fluorescence_57_3 vs. Conc_nM_XW_01_33
Compound_57
General model:f(x) = Bmax*x/(x+Kd)
Coefficients (with 95% confidence bounds):
Bmax = 4.95e+05 (4.252e+05, 5.648e+05)
Kd = 557.4 (278.1, 836.7)
Goodness of fit:SSE: 9.178e+09R-square: 0.9719Adjusted R-square: 0.9684RMSE: 3.387e+04
S1.37. Binding curves of compound 57 (α-Synuclein)
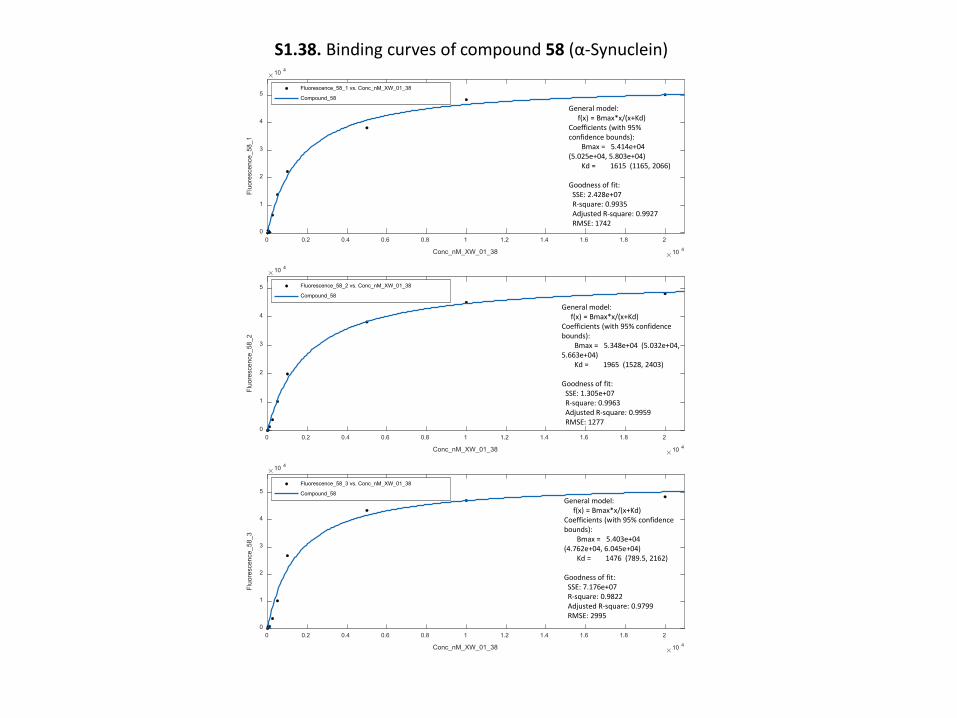
0 0.2 0.4 0.6 0.8 1 1.2 1.4 1.6 1.8 2
Conc_nM_XW_01_38 10 4
0
1
2
3
4
5
Fluo
resc
ence
_58_
1
10 4
Fluorescence_58_1 vs. Conc_nM_XW_01_38
Compound_58
General model:f(x) = Bmax*x/(x+Kd)
Coefficients (with 95% confidence bounds):
Bmax = 5.414e+04 (5.025e+04, 5.803e+04)
Kd = 1615 (1165, 2066)
Goodness of fit:SSE: 2.428e+07R-square: 0.9935Adjusted R-square: 0.9927RMSE: 1742
0 0.2 0.4 0.6 0.8 1 1.2 1.4 1.6 1.8 2
Conc_nM_XW_01_38 10 4
0
1
2
3
4
5
Fluo
resc
ence
_58_
3
10 4
Fluorescence_58_3 vs. Conc_nM_XW_01_38
Compound_58General model:
f(x) = Bmax*x/(x+Kd)Coefficients (with 95% confidence bounds):
Bmax = 5.403e+04 (4.762e+04, 6.045e+04)
Kd = 1476 (789.5, 2162)
Goodness of fit:SSE: 7.176e+07R-square: 0.9822Adjusted R-square: 0.9799RMSE: 2995
0 0.2 0.4 0.6 0.8 1 1.2 1.4 1.6 1.8 2
Conc_nM_XW_01_38 10 4
0
1
2
3
4
5
Fluo
resc
ence
_58_
2
10 4
Fluorescence_58_2 vs. Conc_nM_XW_01_38
Compound_58
General model:f(x) = Bmax*x/(x+Kd)
Coefficients (with 95% confidence bounds):
Bmax = 5.348e+04 (5.032e+04, 5.663e+04)
Kd = 1965 (1528, 2403)
Goodness of fit:SSE: 1.305e+07R-square: 0.9963Adjusted R-square: 0.9959RMSE: 1277
S1.38. Binding curves of compound 58 (α-Synuclein)
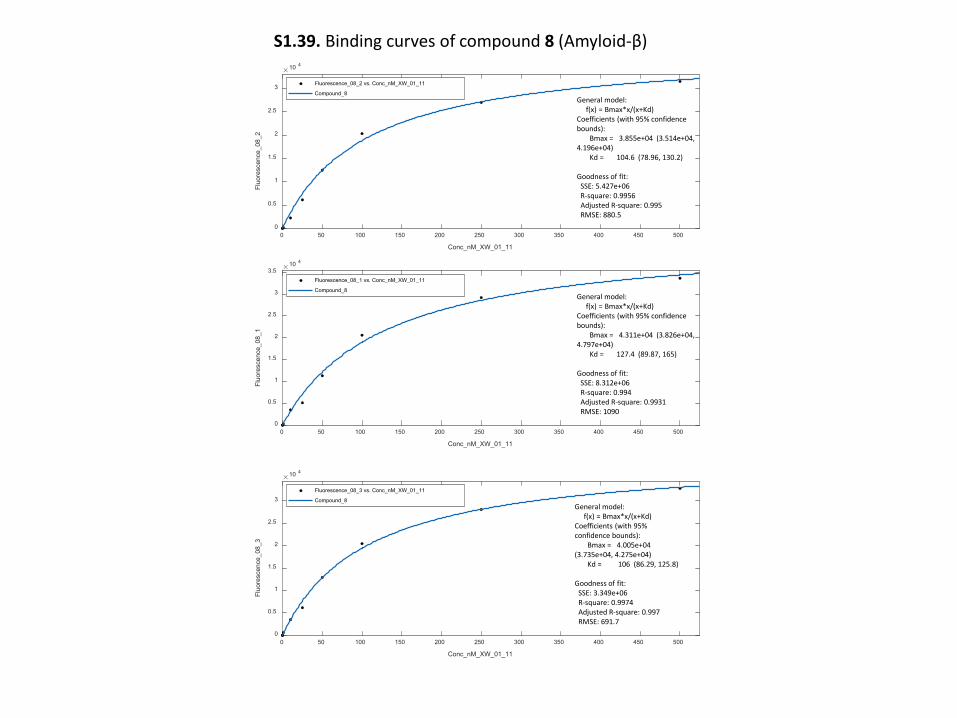
0 50 100 150 200 250 300 350 400 450 500
Conc_nM_XW_01_11
0
0.5
1
1.5
2
2.5
3
3.5
Fluo
resc
ence
_08_
110 4
Fluorescence_08_1 vs. Conc_nM_XW_01_11
Compound_8General model:
f(x) = Bmax*x/(x+Kd)Coefficients (with 95% confidence bounds):
Bmax = 4.311e+04 (3.826e+04, 4.797e+04)
Kd = 127.4 (89.87, 165)
Goodness of fit:SSE: 8.312e+06R-square: 0.994Adjusted R-square: 0.9931RMSE: 1090
0 50 100 150 200 250 300 350 400 450 500
Conc_nM_XW_01_11
0
0.5
1
1.5
2
2.5
3
Fluo
resc
ence
_08_
2
10 4
Fluorescence_08_2 vs. Conc_nM_XW_01_11
Compound_8General model:
f(x) = Bmax*x/(x+Kd)Coefficients (with 95% confidence bounds):
Bmax = 3.855e+04 (3.514e+04, 4.196e+04)
Kd = 104.6 (78.96, 130.2)
Goodness of fit:SSE: 5.427e+06R-square: 0.9956Adjusted R-square: 0.995RMSE: 880.5
0 50 100 150 200 250 300 350 400 450 500
Conc_nM_XW_01_11
0
0.5
1
1.5
2
2.5
3
Fluo
resc
ence
_08_
3
10 4
Fluorescence_08_3 vs. Conc_nM_XW_01_11
Compound_8General model:
f(x) = Bmax*x/(x+Kd)Coefficients (with 95% confidence bounds):
Bmax = 4.005e+04 (3.735e+04, 4.275e+04)
Kd = 106 (86.29, 125.8)
Goodness of fit:SSE: 3.349e+06R-square: 0.9974Adjusted R-square: 0.997RMSE: 691.7
S1.39. Binding curves of compound 8 (Amyloid-β)
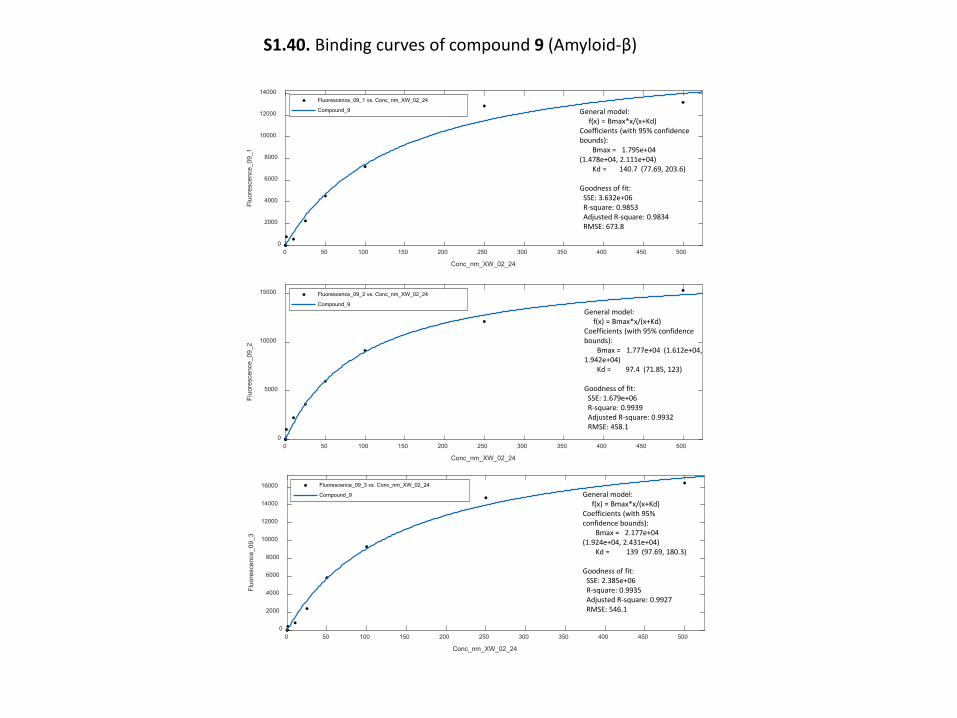
0 50 100 150 200 250 300 350 400 450 500
Conc_nm_XW_02_24
0
2000
4000
6000
8000
10000
12000
14000
Fluo
resc
ence
_09_
1
Fluorescence_09_1 vs. Conc_nm_XW_02_24
Compound_9 General model:f(x) = Bmax*x/(x+Kd)
Coefficients (with 95% confidence bounds):
Bmax = 1.795e+04 (1.478e+04, 2.111e+04)
Kd = 140.7 (77.69, 203.6)
Goodness of fit:SSE: 3.632e+06R-square: 0.9853Adjusted R-square: 0.9834RMSE: 673.8
0 50 100 150 200 250 300 350 400 450 500
Conc_nm_XW_02_24
0
5000
10000
15000
Fluo
resc
ence
_09_
2
Fluorescence_09_2 vs. Conc_nm_XW_02_24
Compound_9General model:
f(x) = Bmax*x/(x+Kd)Coefficients (with 95% confidence bounds):
Bmax = 1.777e+04 (1.612e+04, 1.942e+04)
Kd = 97.4 (71.85, 123)
Goodness of fit:SSE: 1.679e+06R-square: 0.9939Adjusted R-square: 0.9932RMSE: 458.1
0 50 100 150 200 250 300 350 400 450 500
Conc_nm_XW_02_24
0
2000
4000
6000
8000
10000
12000
14000
16000
Fluo
resc
ence
_09_
3
Fluorescence_09_3 vs. Conc_nm_XW_02_24
Compound_9 General model:f(x) = Bmax*x/(x+Kd)
Coefficients (with 95% confidence bounds):
Bmax = 2.177e+04 (1.924e+04, 2.431e+04)
Kd = 139 (97.69, 180.3)
Goodness of fit:SSE: 2.385e+06R-square: 0.9935Adjusted R-square: 0.9927RMSE: 546.1
S1.40. Binding curves of compound 9 (Amyloid-β)
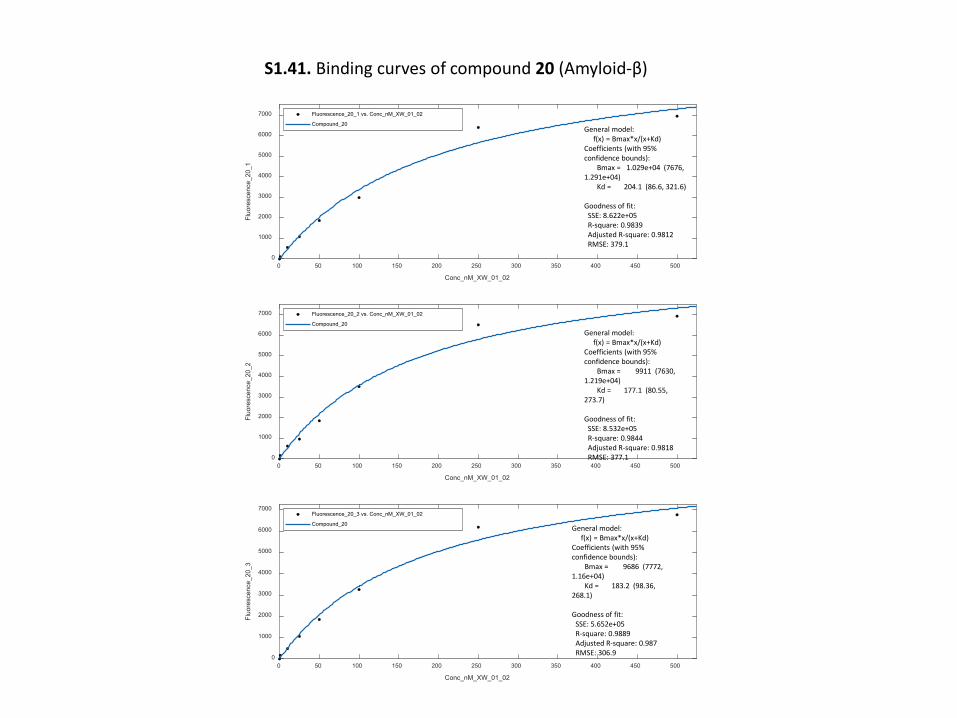
0 50 100 150 200 250 300 350 400 450 500
Conc_nM_XW_01_02
0
1000
2000
3000
4000
5000
6000
7000
Fluo
resc
ence
_20_
1
Fluorescence_20_1 vs. Conc_nM_XW_01_02
Compound_20General model:
f(x) = Bmax*x/(x+Kd)Coefficients (with 95% confidence bounds):
Bmax = 1.029e+04 (7676, 1.291e+04)
Kd = 204.1 (86.6, 321.6)
Goodness of fit:SSE: 8.622e+05R-square: 0.9839Adjusted R-square: 0.9812RMSE: 379.1
0 50 100 150 200 250 300 350 400 450 500
Conc_nM_XW_01_02
0
1000
2000
3000
4000
5000
6000
7000
Fluo
resc
ence
_20_
2
Fluorescence_20_2 vs. Conc_nM_XW_01_02
Compound_20
General model:f(x) = Bmax*x/(x+Kd)
Coefficients (with 95% confidence bounds):
Bmax = 9911 (7630, 1.219e+04)
Kd = 177.1 (80.55, 273.7)
Goodness of fit:SSE: 8.532e+05R-square: 0.9844Adjusted R-square: 0.9818RMSE: 377.1
0 50 100 150 200 250 300 350 400 450 500
Conc_nM_XW_01_02
0
1000
2000
3000
4000
5000
6000
7000
Fluo
resc
ence
_20_
3
Fluorescence_20_3 vs. Conc_nM_XW_01_02
Compound_20 General model:f(x) = Bmax*x/(x+Kd)
Coefficients (with 95% confidence bounds):
Bmax = 9686 (7772, 1.16e+04)
Kd = 183.2 (98.36, 268.1)
Goodness of fit:SSE: 5.652e+05R-square: 0.9889Adjusted R-square: 0.987RMSE: 306.9
S1.41. Binding curves of compound 20 (Amyloid-β)
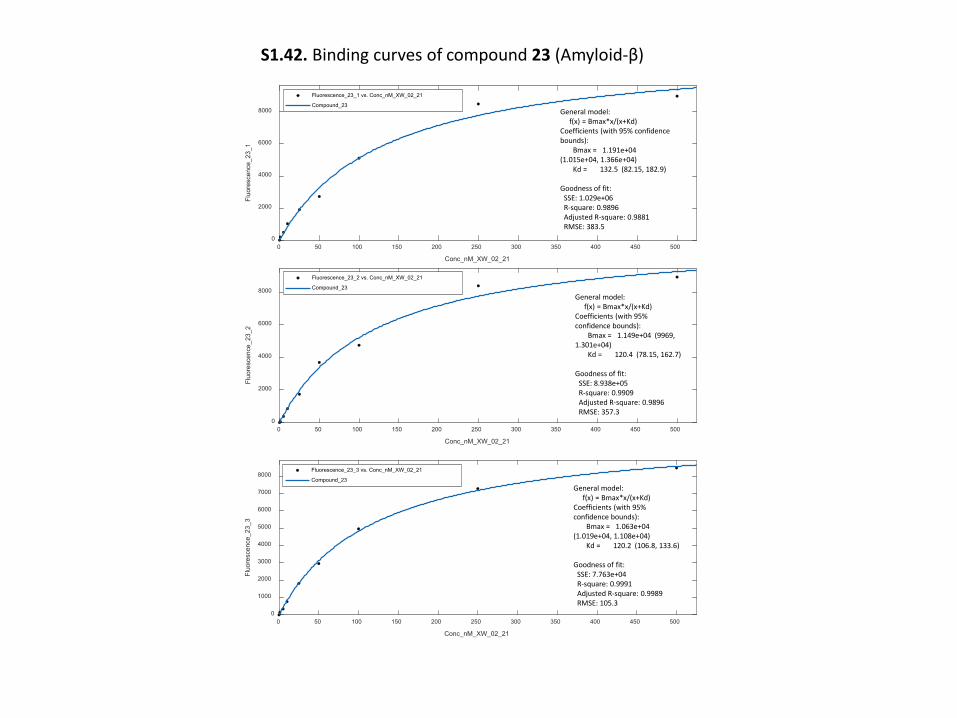
0 50 100 150 200 250 300 350 400 450 500
Conc_nM_XW_02_21
0
2000
4000
6000
8000
Fluo
resc
ence
_23_
1
Fluorescence_23_1 vs. Conc_nM_XW_02_21
Compound_23General model:
f(x) = Bmax*x/(x+Kd)Coefficients (with 95% confidence bounds):
Bmax = 1.191e+04 (1.015e+04, 1.366e+04)
Kd = 132.5 (82.15, 182.9)
Goodness of fit:SSE: 1.029e+06R-square: 0.9896Adjusted R-square: 0.9881RMSE: 383.5
0 50 100 150 200 250 300 350 400 450 500
Conc_nM_XW_02_21
0
2000
4000
6000
8000
Fluo
resc
ence
_23_
2
Fluorescence_23_2 vs. Conc_nM_XW_02_21
Compound_23
General model:f(x) = Bmax*x/(x+Kd)
Coefficients (with 95% confidence bounds):
Bmax = 1.149e+04 (9969, 1.301e+04)
Kd = 120.4 (78.15, 162.7)
Goodness of fit:SSE: 8.938e+05R-square: 0.9909Adjusted R-square: 0.9896RMSE: 357.3
0 50 100 150 200 250 300 350 400 450 500
Conc_nM_XW_02_21
0
1000
2000
3000
4000
5000
6000
7000
8000
Fluo
resc
ence
_23_
3
Fluorescence_23_3 vs. Conc_nM_XW_02_21
Compound_23General model:
f(x) = Bmax*x/(x+Kd)Coefficients (with 95% confidence bounds):
Bmax = 1.063e+04 (1.019e+04, 1.108e+04)
Kd = 120.2 (106.8, 133.6)
Goodness of fit:SSE: 7.763e+04R-square: 0.9991Adjusted R-square: 0.9989RMSE: 105.3
S1.42. Binding curves of compound 23 (Amyloid-β)
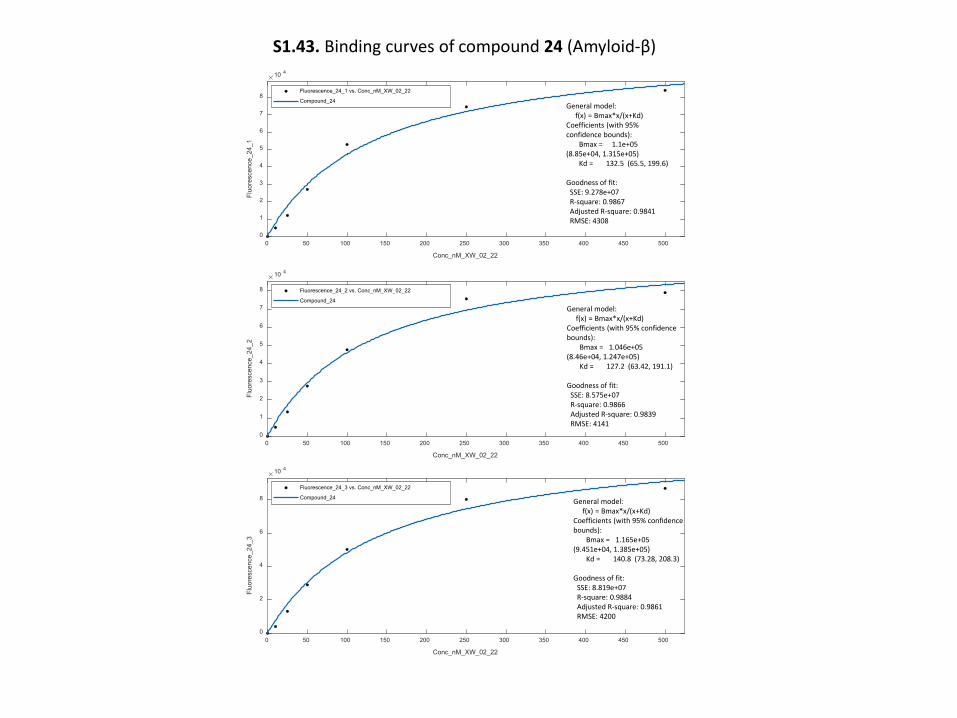
0 50 100 150 200 250 300 350 400 450 500
Conc_nM_XW_02_22
0
1
2
3
4
5
6
7
8
Fluo
resc
ence
_24_
1
10 4
Fluorescence_24_1 vs. Conc_nM_XW_02_22
Compound_24General model:
f(x) = Bmax*x/(x+Kd)Coefficients (with 95% confidence bounds):
Bmax = 1.1e+05 (8.85e+04, 1.315e+05)
Kd = 132.5 (65.5, 199.6)
Goodness of fit:SSE: 9.278e+07R-square: 0.9867Adjusted R-square: 0.9841RMSE: 4308
0 50 100 150 200 250 300 350 400 450 500
Conc_nM_XW_02_22
0
1
2
3
4
5
6
7
8
Fluo
resc
ence
_24_
2
10 4
Fluorescence_24_2 vs. Conc_nM_XW_02_22
Compound_24General model:
f(x) = Bmax*x/(x+Kd)Coefficients (with 95% confidence bounds):
Bmax = 1.046e+05 (8.46e+04, 1.247e+05)
Kd = 127.2 (63.42, 191.1)
Goodness of fit:SSE: 8.575e+07R-square: 0.9866Adjusted R-square: 0.9839RMSE: 4141
0 50 100 150 200 250 300 350 400 450 500
Conc_nM_XW_02_22
0
2
4
6
8
Fluo
resc
ence
_24_
3
10 4
Fluorescence_24_3 vs. Conc_nM_XW_02_22
Compound_24 General model:f(x) = Bmax*x/(x+Kd)
Coefficients (with 95% confidence bounds):
Bmax = 1.165e+05 (9.451e+04, 1.385e+05)
Kd = 140.8 (73.28, 208.3)
Goodness of fit:SSE: 8.819e+07R-square: 0.9884Adjusted R-square: 0.9861RMSE: 4200
S1.43. Binding curves of compound 24 (Amyloid-β)
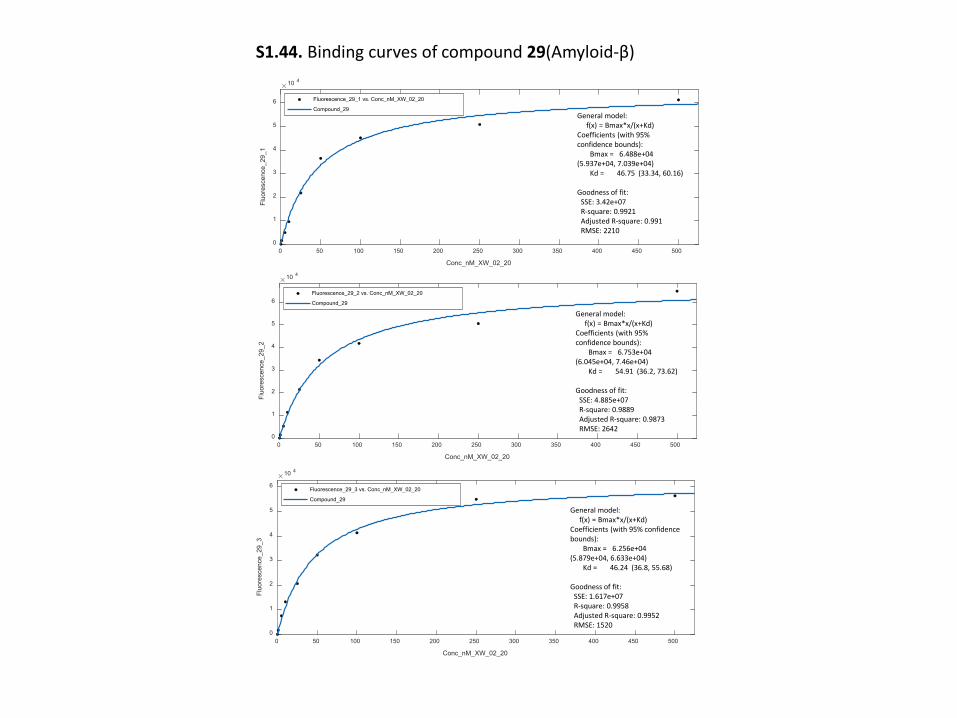
0 50 100 150 200 250 300 350 400 450 500
Conc_nM_XW_02_20
0
1
2
3
4
5
6
Fluo
resc
ence
_29_
1
10 4
Fluorescence_29_1 vs. Conc_nM_XW_02_20
Compound_29General model:
f(x) = Bmax*x/(x+Kd)Coefficients (with 95% confidence bounds):
Bmax = 6.488e+04 (5.937e+04, 7.039e+04)
Kd = 46.75 (33.34, 60.16)
Goodness of fit:SSE: 3.42e+07R-square: 0.9921Adjusted R-square: 0.991RMSE: 2210
0 50 100 150 200 250 300 350 400 450 500
Conc_nM_XW_02_20
0
1
2
3
4
5
6
Fluo
resc
ence
_29_
2
10 4
Fluorescence_29_2 vs. Conc_nM_XW_02_20
Compound_29
General model:f(x) = Bmax*x/(x+Kd)
Coefficients (with 95% confidence bounds):
Bmax = 6.753e+04 (6.045e+04, 7.46e+04)
Kd = 54.91 (36.2, 73.62)
Goodness of fit:SSE: 4.885e+07R-square: 0.9889Adjusted R-square: 0.9873RMSE: 2642
0 50 100 150 200 250 300 350 400 450 500
Conc_nM_XW_02_20
0
1
2
3
4
5
6
Fluo
resc
ence
_29_
3
10 4
Fluorescence_29_3 vs. Conc_nM_XW_02_20
Compound_29
General model:f(x) = Bmax*x/(x+Kd)
Coefficients (with 95% confidence bounds):
Bmax = 6.256e+04 (5.879e+04, 6.633e+04)
Kd = 46.24 (36.8, 55.68)
Goodness of fit:SSE: 1.617e+07R-square: 0.9958Adjusted R-square: 0.9952RMSE: 1520
S1.44. Binding curves of compound 29(Amyloid-β)
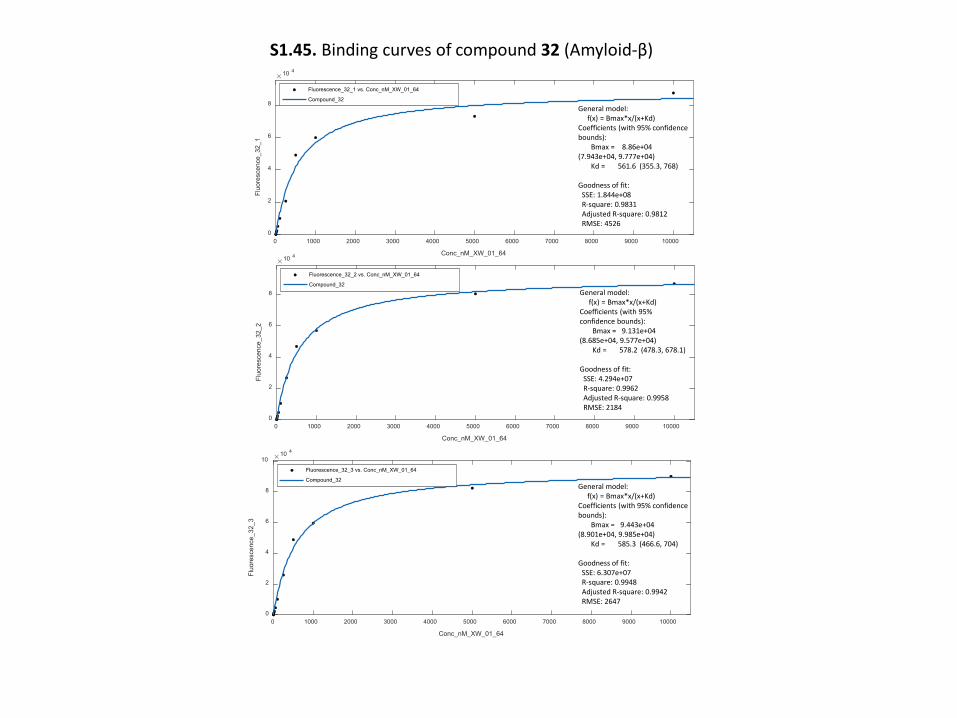
0 1000 2000 3000 4000 5000 6000 7000 8000 9000 10000
Conc_nM_XW_01_64
0
2
4
6
8
Fluo
resc
ence
_32_
1
10 4
Fluorescence_32_1 vs. Conc_nM_XW_01_64
Compound_32
General model:f(x) = Bmax*x/(x+Kd)
Coefficients (with 95% confidence bounds):
Bmax = 8.86e+04 (7.943e+04, 9.777e+04)
Kd = 561.6 (355.3, 768)
Goodness of fit:SSE: 1.844e+08R-square: 0.9831Adjusted R-square: 0.9812RMSE: 4526
0 1000 2000 3000 4000 5000 6000 7000 8000 9000 10000
Conc_nM_XW_01_64
0
2
4
6
8
Fluo
resc
ence
_32_
210 4
Fluorescence_32_2 vs. Conc_nM_XW_01_64
Compound_32General model:
f(x) = Bmax*x/(x+Kd)Coefficients (with 95% confidence bounds):
Bmax = 9.131e+04 (8.685e+04, 9.577e+04)
Kd = 578.2 (478.3, 678.1)
Goodness of fit:SSE: 4.294e+07R-square: 0.9962Adjusted R-square: 0.9958RMSE: 2184
0 1000 2000 3000 4000 5000 6000 7000 8000 9000 10000
Conc_nM_XW_01_64
0
2
4
6
8
10
Fluo
resc
ence
_32_
3
10 4
Fluorescence_32_3 vs. Conc_nM_XW_01_64
Compound_32General model:
f(x) = Bmax*x/(x+Kd)Coefficients (with 95% confidence bounds):
Bmax = 9.443e+04 (8.901e+04, 9.985e+04)
Kd = 585.3 (466.6, 704)
Goodness of fit:SSE: 6.307e+07R-square: 0.9948Adjusted R-square: 0.9942RMSE: 2647
S1.45. Binding curves of compound 32 (Amyloid-β)
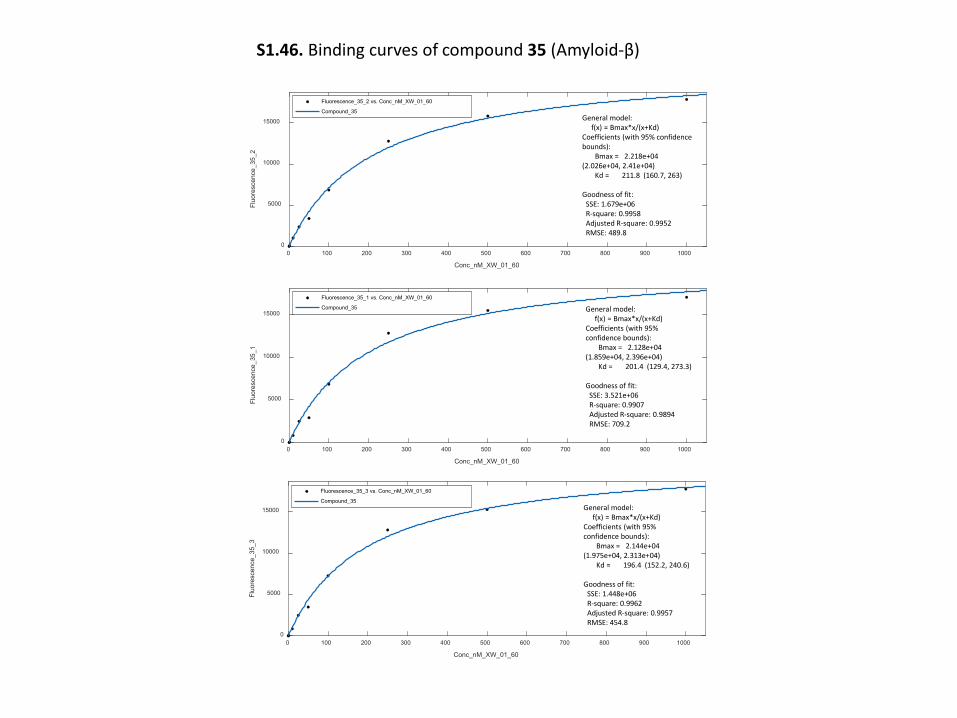
0 100 200 300 400 500 600 700 800 900 1000
Conc_nM_XW_01_60
0
5000
10000
15000
Fluo
resc
ence
_35_
1
Fluorescence_35_1 vs. Conc_nM_XW_01_60
Compound_35 General model:f(x) = Bmax*x/(x+Kd)
Coefficients (with 95% confidence bounds):
Bmax = 2.128e+04 (1.859e+04, 2.396e+04)
Kd = 201.4 (129.4, 273.3)
Goodness of fit:SSE: 3.521e+06R-square: 0.9907Adjusted R-square: 0.9894RMSE: 709.2
0 100 200 300 400 500 600 700 800 900 1000
Conc_nM_XW_01_60
0
5000
10000
15000
Fluo
resc
ence
_35_
2
Fluorescence_35_2 vs. Conc_nM_XW_01_60
Compound_35General model:
f(x) = Bmax*x/(x+Kd)Coefficients (with 95% confidence bounds):
Bmax = 2.218e+04 (2.026e+04, 2.41e+04)
Kd = 211.8 (160.7, 263)
Goodness of fit:SSE: 1.679e+06R-square: 0.9958Adjusted R-square: 0.9952RMSE: 489.8
0 100 200 300 400 500 600 700 800 900 1000
Conc_nM_XW_01_60
0
5000
10000
15000
Fluo
resc
ence
_35_
3
Fluorescence_35_3 vs. Conc_nM_XW_01_60
Compound_35General model:
f(x) = Bmax*x/(x+Kd)Coefficients (with 95% confidence bounds):
Bmax = 2.144e+04 (1.975e+04, 2.313e+04)
Kd = 196.4 (152.2, 240.6)
Goodness of fit:SSE: 1.448e+06R-square: 0.9962Adjusted R-square: 0.9957RMSE: 454.8
S1.46. Binding curves of compound 35 (Amyloid-β)
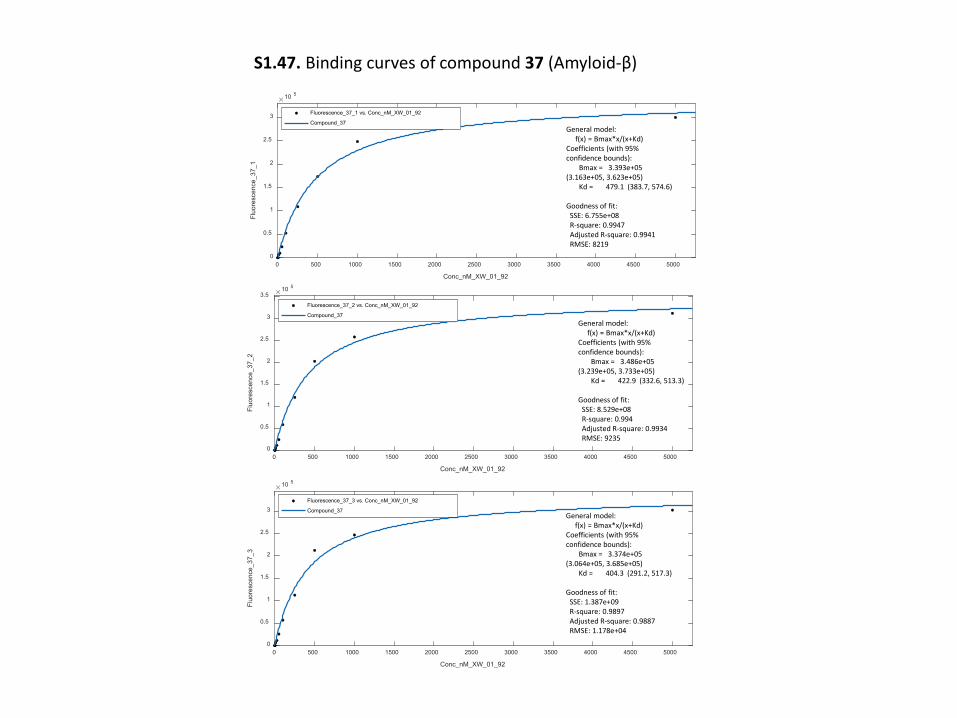
0 500 1000 1500 2000 2500 3000 3500 4000 4500 5000
Conc_nM_XW_01_92
0
0.5
1
1.5
2
2.5
3
Fluo
resc
ence
_37_
1
10 5
Fluorescence_37_1 vs. Conc_nM_XW_01_92
Compound_37General model:
f(x) = Bmax*x/(x+Kd)Coefficients (with 95% confidence bounds):
Bmax = 3.393e+05 (3.163e+05, 3.623e+05)
Kd = 479.1 (383.7, 574.6)
Goodness of fit:SSE: 6.755e+08R-square: 0.9947Adjusted R-square: 0.9941RMSE: 8219
0 500 1000 1500 2000 2500 3000 3500 4000 4500 5000
Conc_nM_XW_01_92
0
0.5
1
1.5
2
2.5
3
3.5
Fluo
resc
ence
_37_
2
10 5
Fluorescence_37_2 vs. Conc_nM_XW_01_92
Compound_37General model:
f(x) = Bmax*x/(x+Kd)Coefficients (with 95% confidence bounds):
Bmax = 3.486e+05 (3.239e+05, 3.733e+05)
Kd = 422.9 (332.6, 513.3)
Goodness of fit:SSE: 8.529e+08R-square: 0.994Adjusted R-square: 0.9934RMSE: 9235
0 500 1000 1500 2000 2500 3000 3500 4000 4500 5000
Conc_nM_XW_01_92
0
0.5
1
1.5
2
2.5
3
Fluo
resc
ence
_37_
3
10 5
Fluorescence_37_3 vs. Conc_nM_XW_01_92
Compound_37General model:
f(x) = Bmax*x/(x+Kd)Coefficients (with 95% confidence bounds):
Bmax = 3.374e+05 (3.064e+05, 3.685e+05)
Kd = 404.3 (291.2, 517.3)
Goodness of fit:SSE: 1.387e+09R-square: 0.9897Adjusted R-square: 0.9887RMSE: 1.178e+04
S1.47. Binding curves of compound 37 (Amyloid-β)
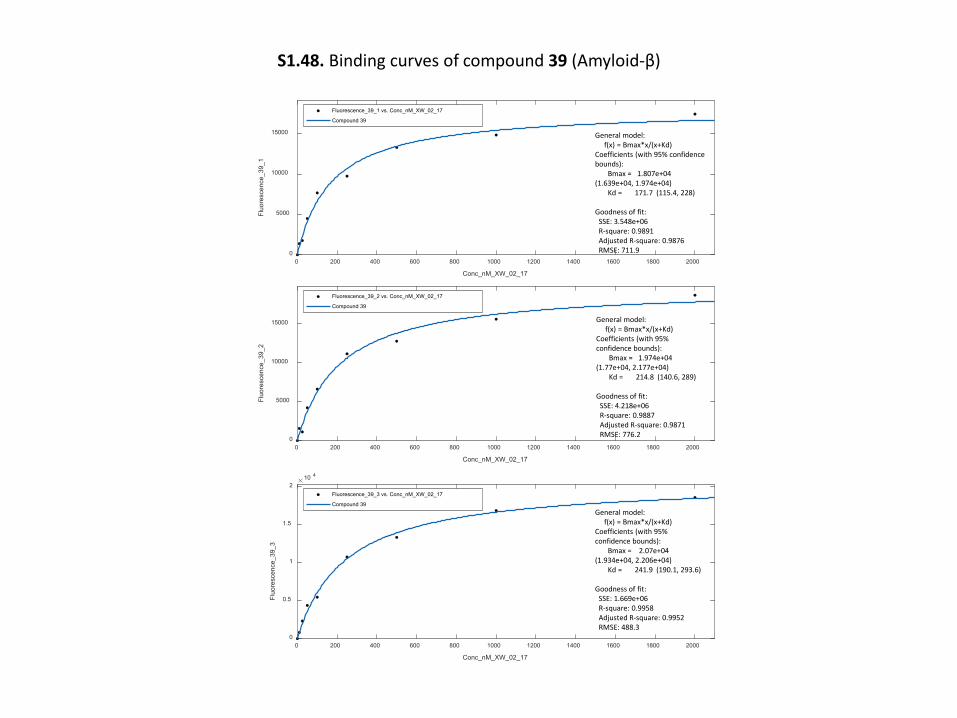
0 200 400 600 800 1000 1200 1400 1600 1800 2000
Conc_nM_XW_02_17
0
5000
10000
15000
Fluo
resc
ence
_39_
1
Fluorescence_39_1 vs. Conc_nM_XW_02_17
Compound 39
General model:f(x) = Bmax*x/(x+Kd)
Coefficients (with 95% confidence bounds):
Bmax = 1.807e+04 (1.639e+04, 1.974e+04)
Kd = 171.7 (115.4, 228)
Goodness of fit:SSE: 3.548e+06R-square: 0.9891Adjusted R-square: 0.9876RMSE: 711.9
0 200 400 600 800 1000 1200 1400 1600 1800 2000
Conc_nM_XW_02_17
0
5000
10000
15000
Fluo
resc
ence
_39_
2
Fluorescence_39_2 vs. Conc_nM_XW_02_17
Compound 39
General model:f(x) = Bmax*x/(x+Kd)
Coefficients (with 95% confidence bounds):
Bmax = 1.974e+04 (1.77e+04, 2.177e+04)
Kd = 214.8 (140.6, 289)
Goodness of fit:SSE: 4.218e+06R-square: 0.9887Adjusted R-square: 0.9871RMSE: 776.2
0 200 400 600 800 1000 1200 1400 1600 1800 2000
Conc_nM_XW_02_17
0
0.5
1
1.5
2
Fluo
resc
ence
_39_
3
10 4
Fluorescence_39_3 vs. Conc_nM_XW_02_17
Compound 39General model:
f(x) = Bmax*x/(x+Kd)Coefficients (with 95% confidence bounds):
Bmax = 2.07e+04 (1.934e+04, 2.206e+04)
Kd = 241.9 (190.1, 293.6)
Goodness of fit:SSE: 1.669e+06R-square: 0.9958Adjusted R-square: 0.9952RMSE: 488.3
S1.48. Binding curves of compound 39 (Amyloid-β)
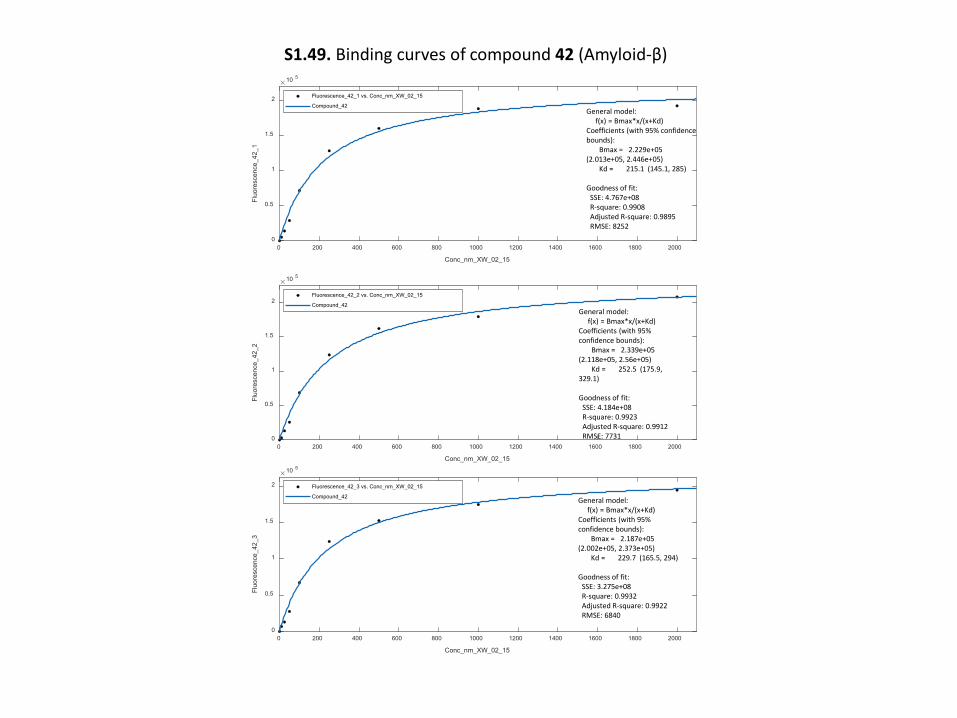
0 200 400 600 800 1000 1200 1400 1600 1800 2000
Conc_nm_XW_02_15
0
0.5
1
1.5
2
Fluo
resc
ence
_42_
1
10 5
Fluorescence_42_1 vs. Conc_nm_XW_02_15
Compound_42General model:
f(x) = Bmax*x/(x+Kd)Coefficients (with 95% confidence bounds):
Bmax = 2.229e+05 (2.013e+05, 2.446e+05)
Kd = 215.1 (145.1, 285)
Goodness of fit:SSE: 4.767e+08R-square: 0.9908Adjusted R-square: 0.9895RMSE: 8252
0 200 400 600 800 1000 1200 1400 1600 1800 2000
Conc_nm_XW_02_15
0
0.5
1
1.5
2
Fluo
resc
ence
_42_
2
10 5
Fluorescence_42_2 vs. Conc_nm_XW_02_15
Compound_42General model:
f(x) = Bmax*x/(x+Kd)Coefficients (with 95% confidence bounds):
Bmax = 2.339e+05 (2.118e+05, 2.56e+05)
Kd = 252.5 (175.9, 329.1)
Goodness of fit:SSE: 4.184e+08R-square: 0.9923Adjusted R-square: 0.9912RMSE: 7731
0 200 400 600 800 1000 1200 1400 1600 1800 2000
Conc_nm_XW_02_15
0
0.5
1
1.5
2
Fluo
resc
ence
_42_
3
10 5
Fluorescence_42_3 vs. Conc_nm_XW_02_15
Compound_42 General model:f(x) = Bmax*x/(x+Kd)
Coefficients (with 95% confidence bounds):
Bmax = 2.187e+05 (2.002e+05, 2.373e+05)
Kd = 229.7 (165.5, 294)
Goodness of fit:SSE: 3.275e+08R-square: 0.9932Adjusted R-square: 0.9922RMSE: 6840
S1.49. Binding curves of compound 42 (Amyloid-β)
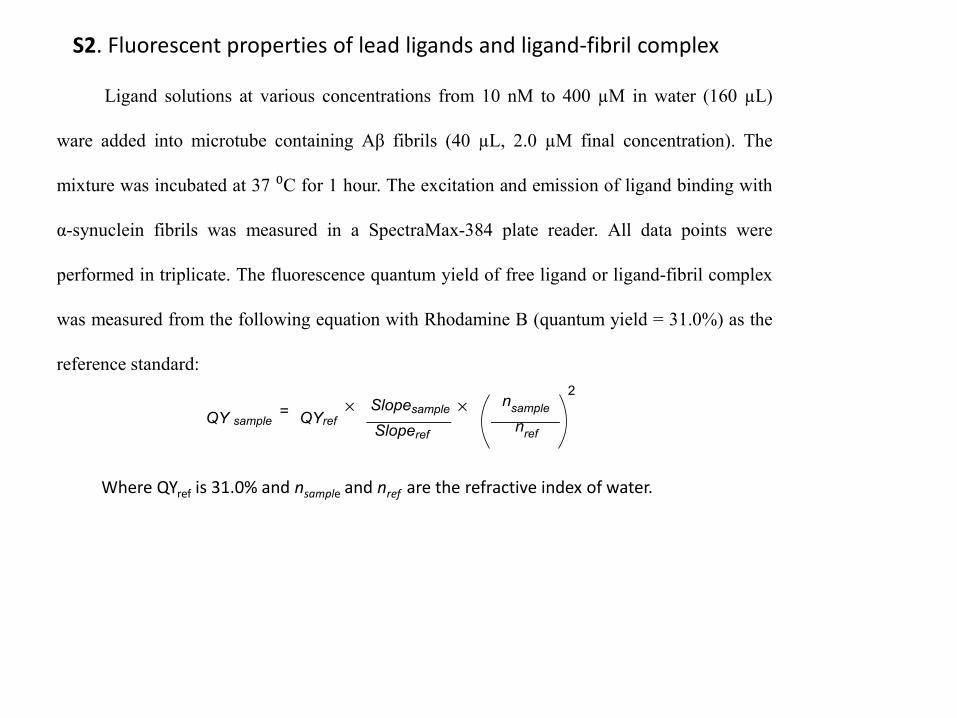
S2. Fluorescent properties of lead ligands and ligand-fibril complex
Ligand solutions at various concentrations from 10 nM to 400 µM in water (160 µL)
ware added into microtube containing Aβ fibrils (40 µL, 2.0 µM final concentration). The
mixture was incubated at 37 ⁰C for 1 hour. The excitation and emission of ligand binding with
α-synuclein fibrils was measured in a SpectraMax-384 plate reader. All data points were
performed in triplicate. The fluorescence quantum yield of free ligand or ligand-fibril complex
was measured from the following equation with Rhodamine B (quantum yield = 31.0%) as the
reference standard:
QY sample×= QYref
Slopesample
Sloperef
nsamplenref
2×
Where QYref is 31.0% and nsample and nref are the refractive index of water.
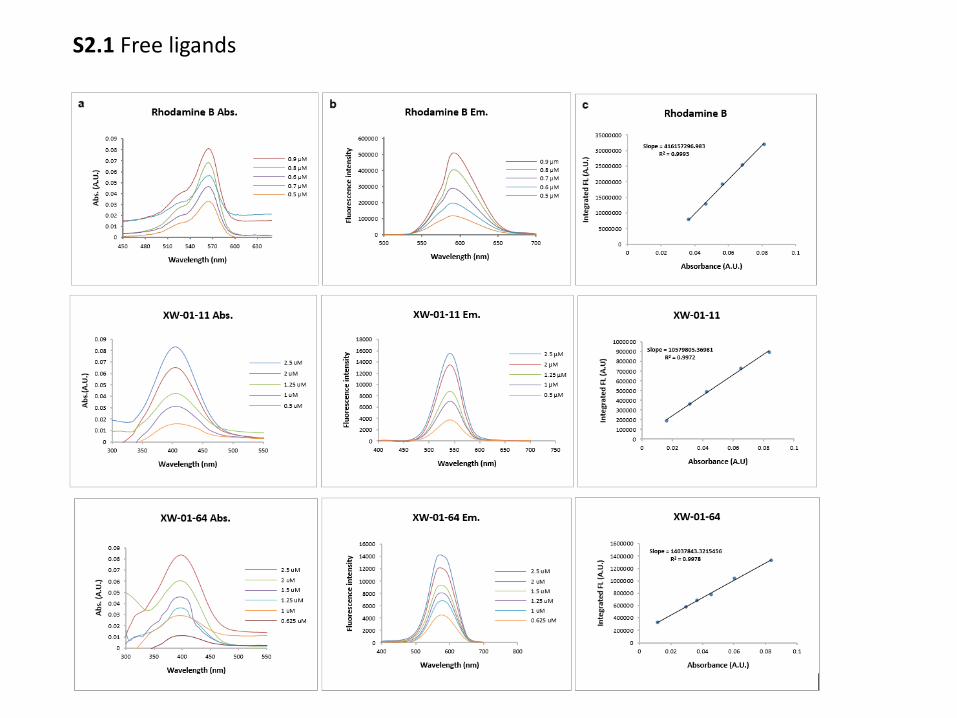
S2.1 Free ligands
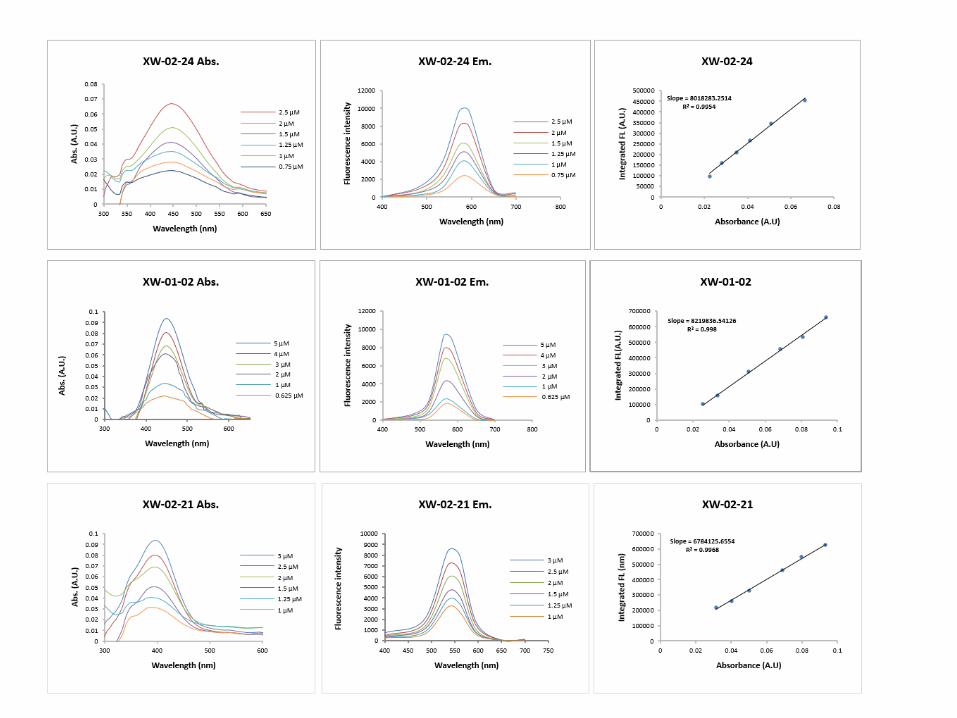
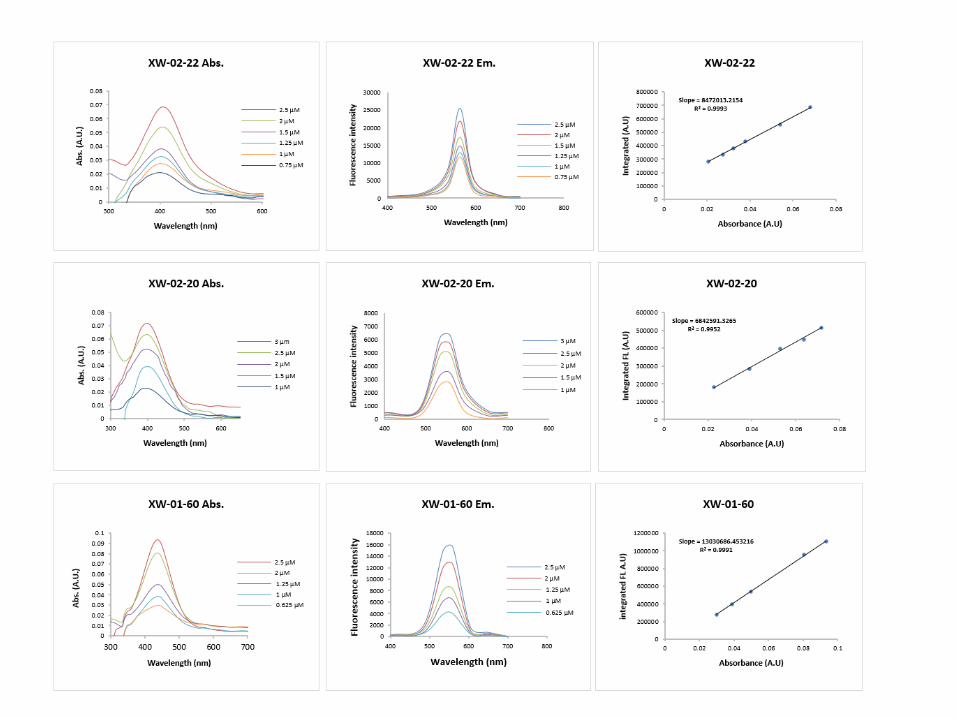
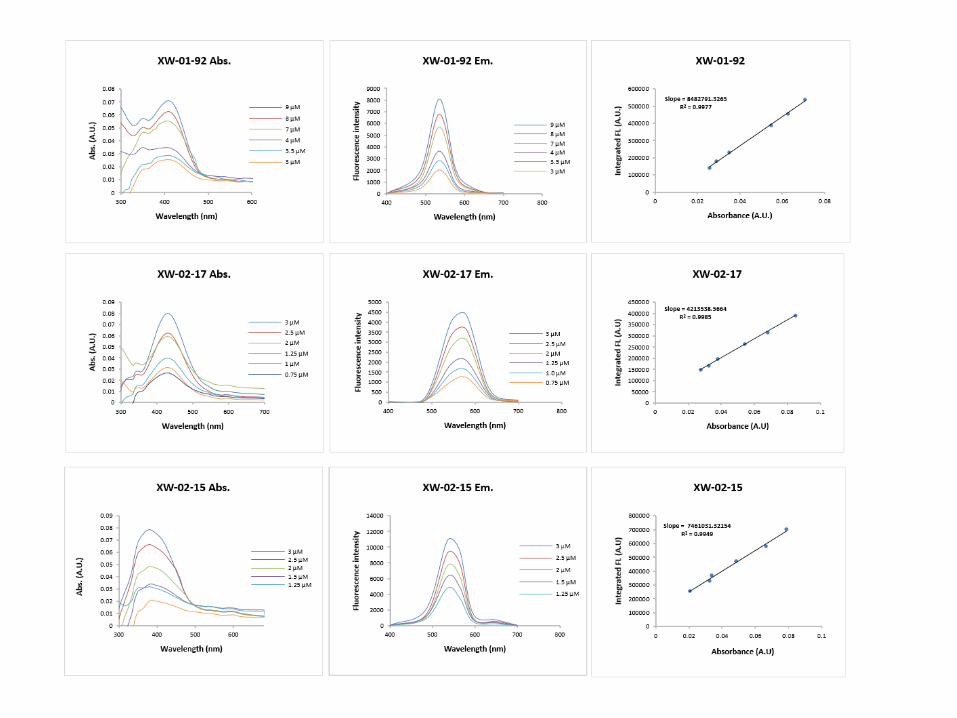
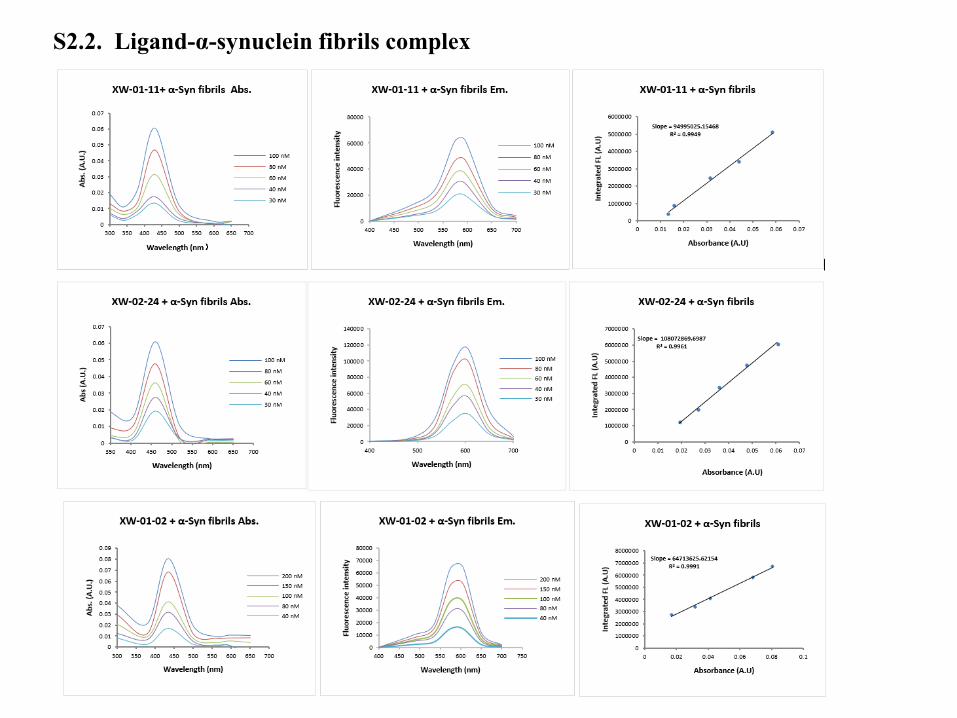
S2.2. Ligand-α-synuclein fibrils complex
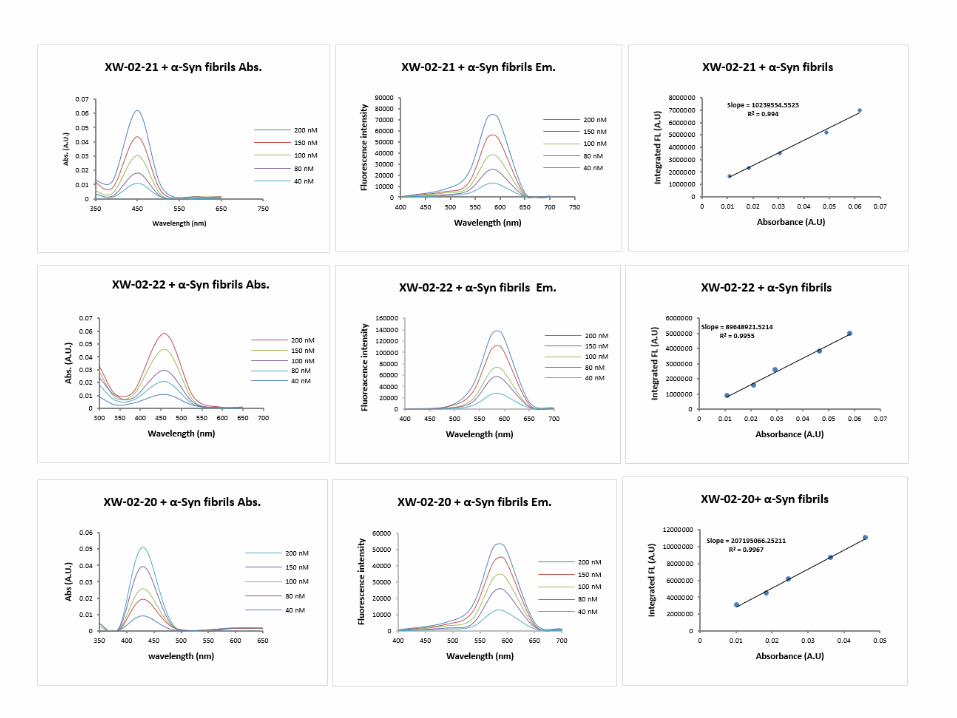
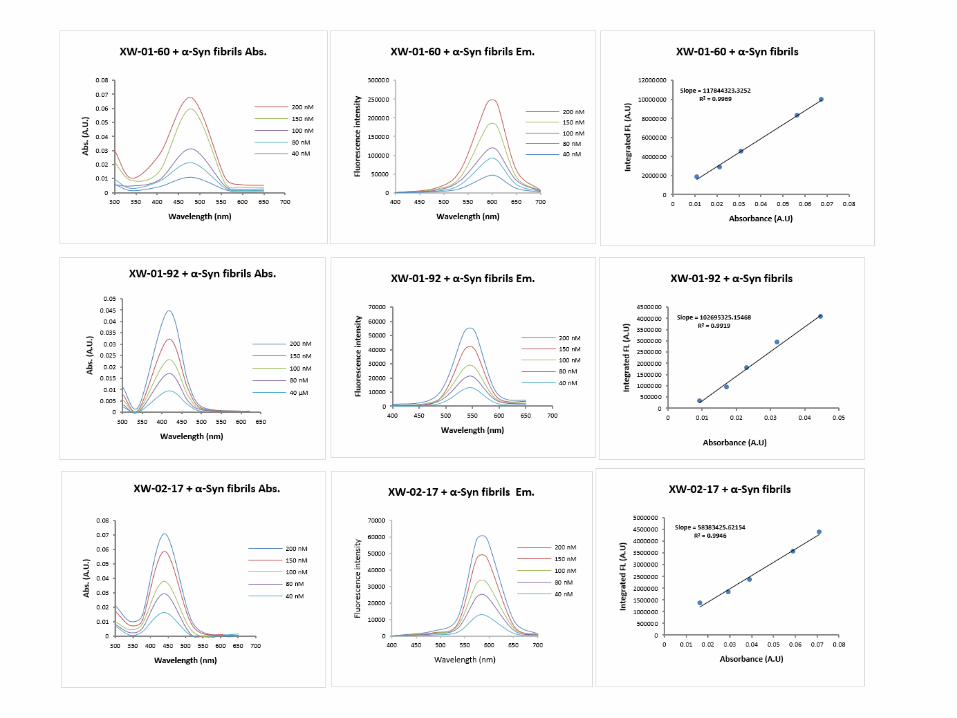
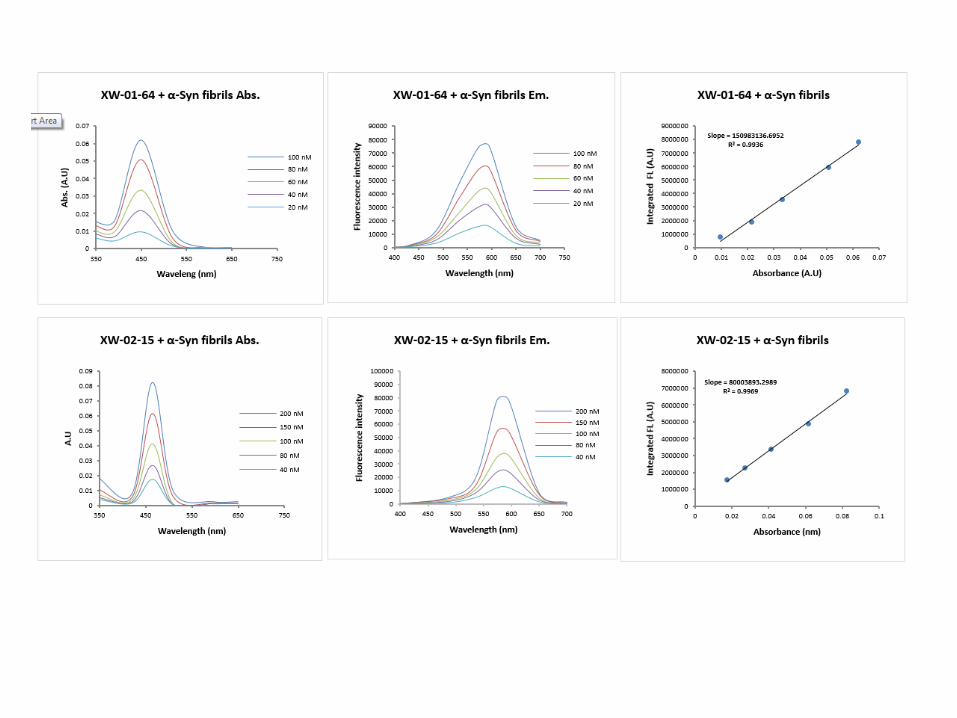
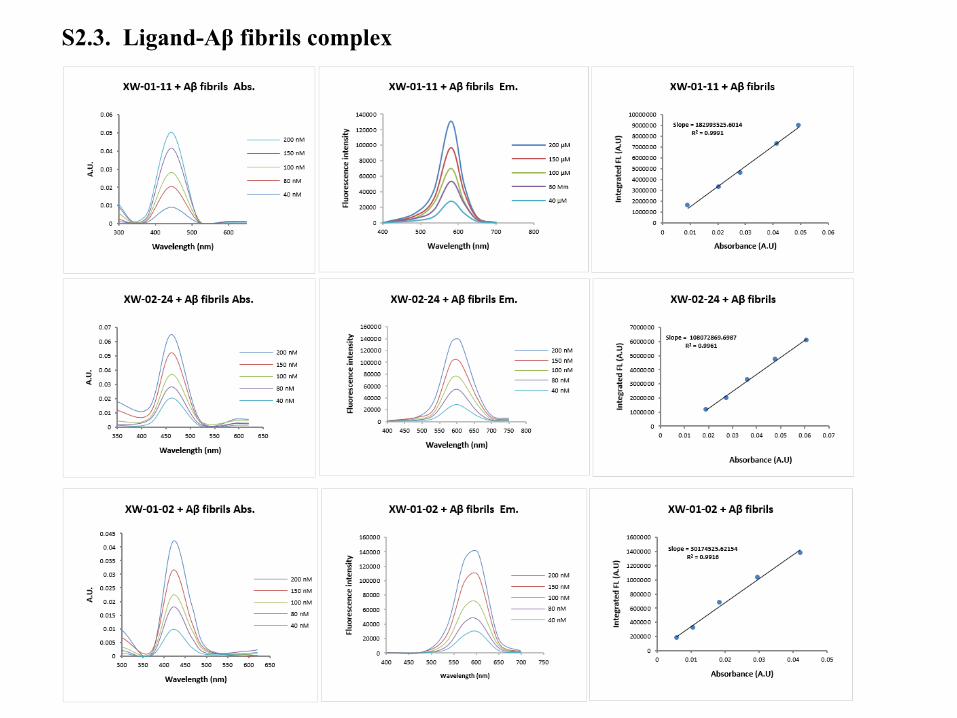
S2.3. Ligand-Aβ fibrils complex
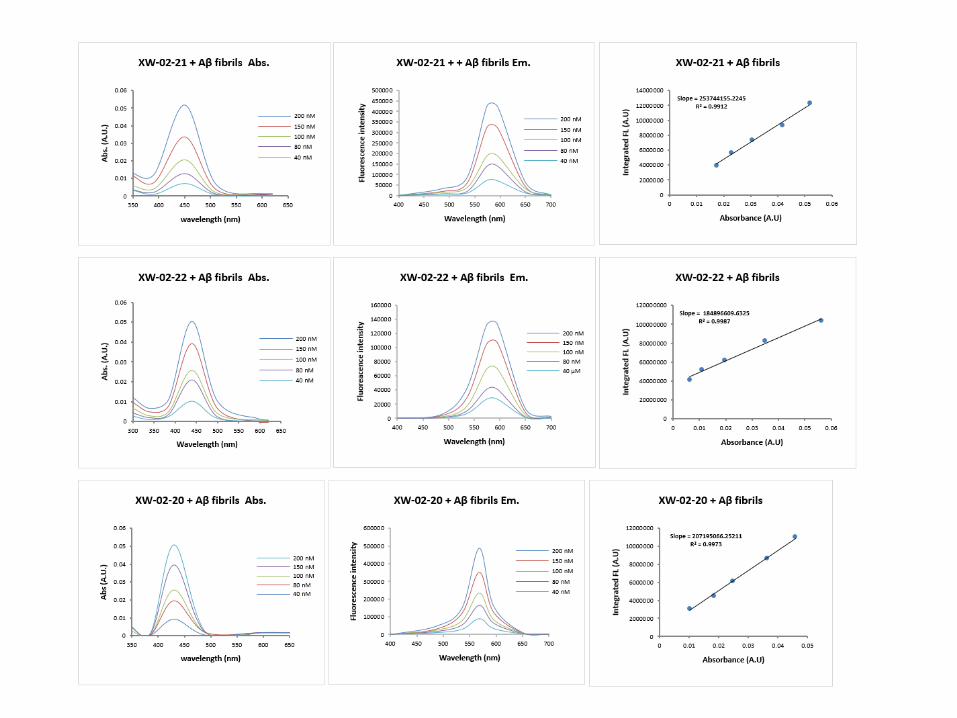
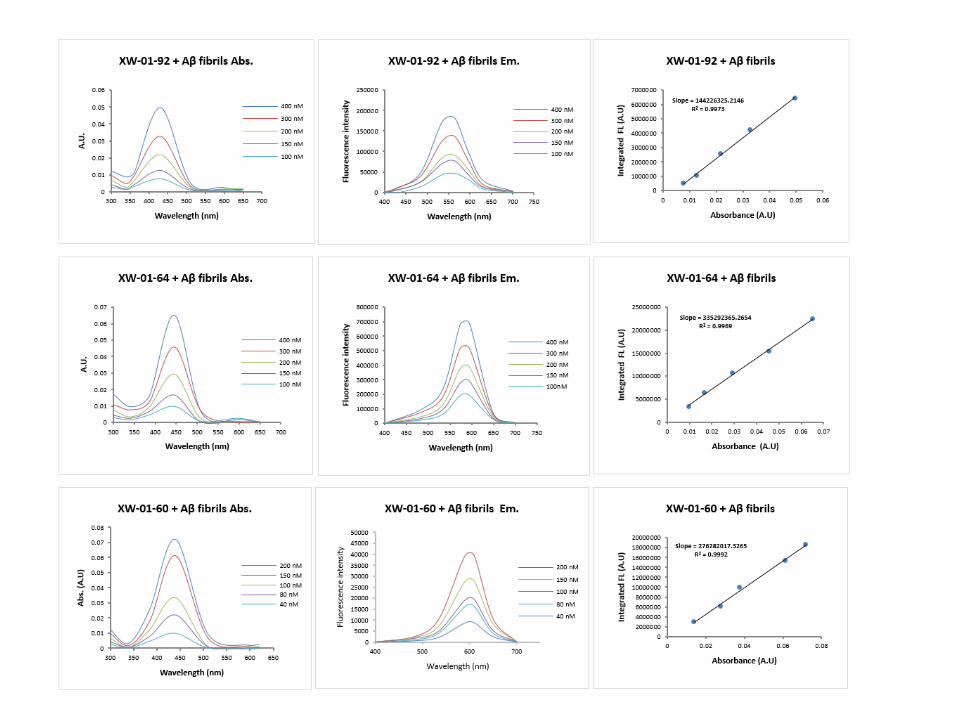
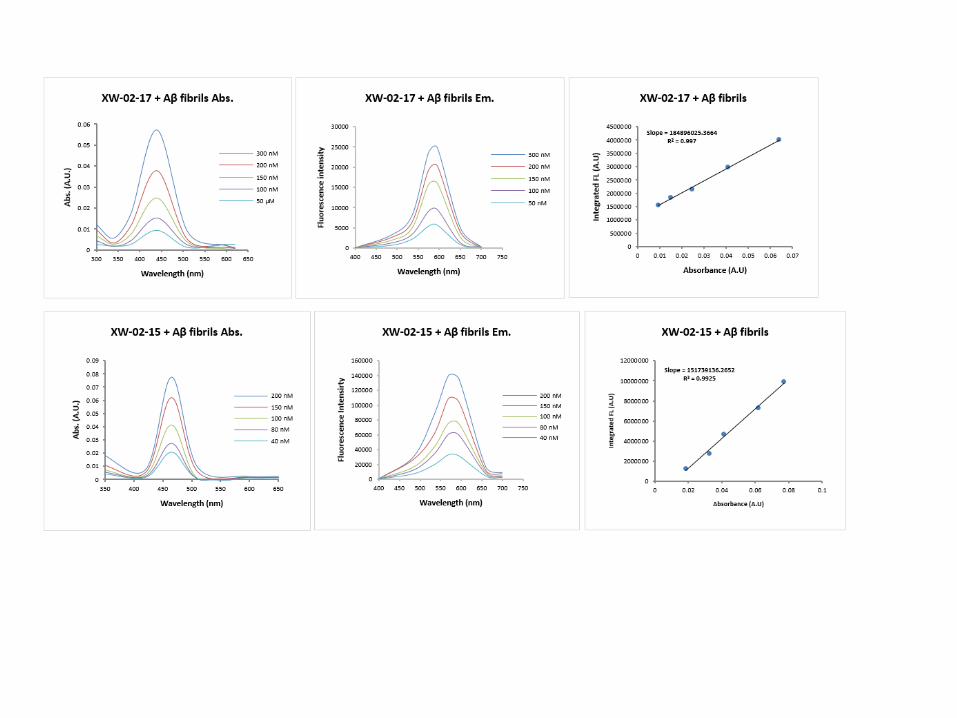
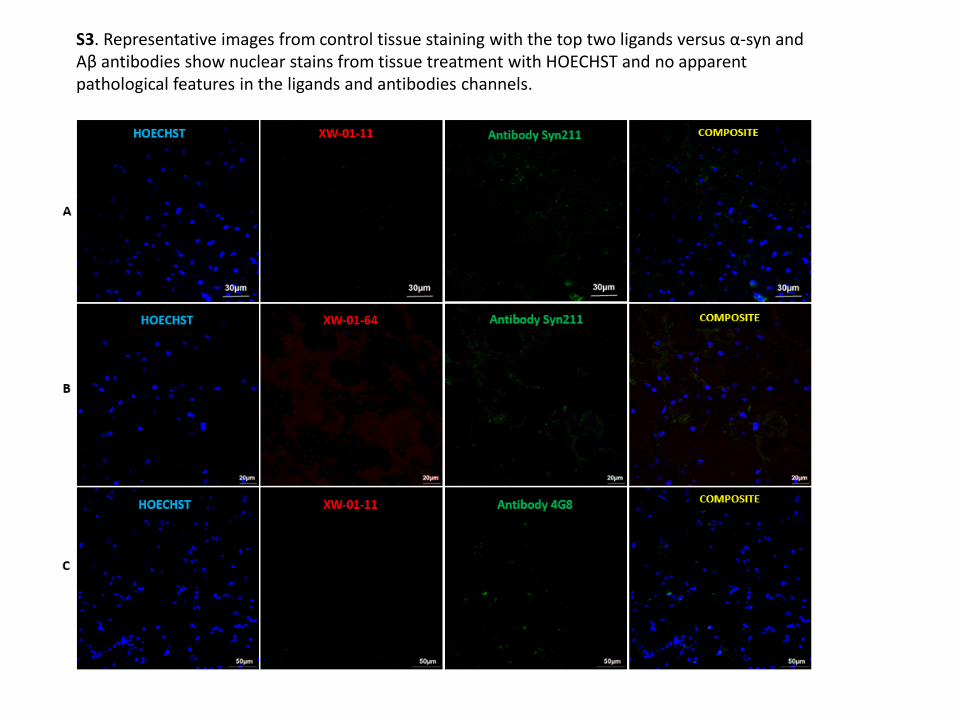
S3. Representative images from control tissue staining with the top two ligands versus α-syn and Aβ antibodies show nuclear stains from tissue treatment with HOECHST and no apparent pathological features in the ligands and antibodies channels.
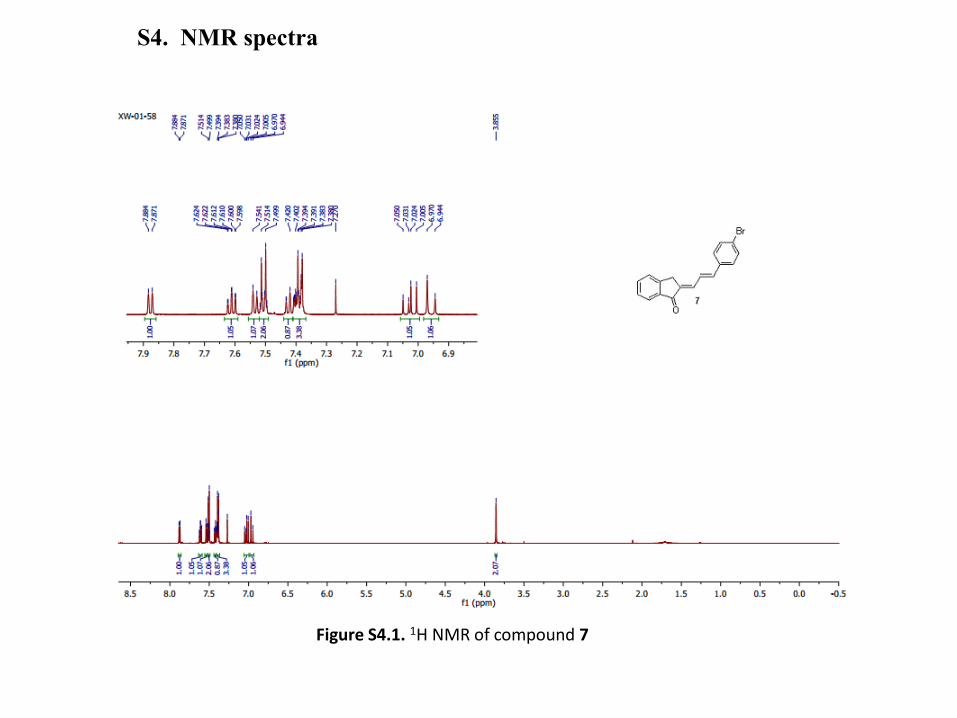
Figure S4.1. 1H NMR of compound 7
S4. NMR spectra
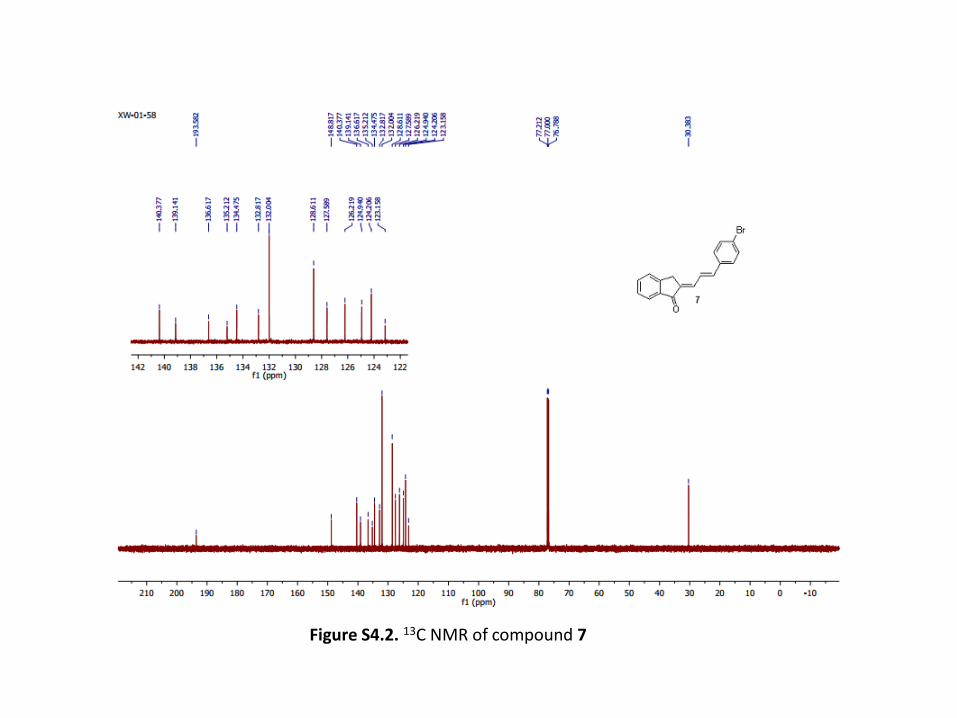
Figure S4.2. 13C NMR of compound 7
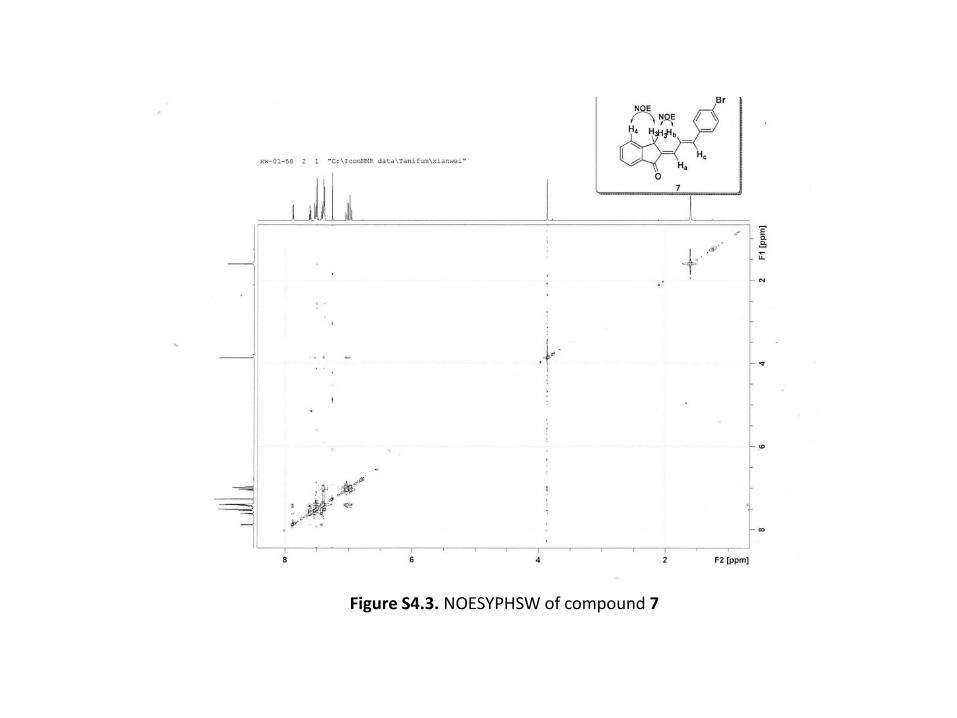
Figure S4.3. NOESYPHSW of compound 7
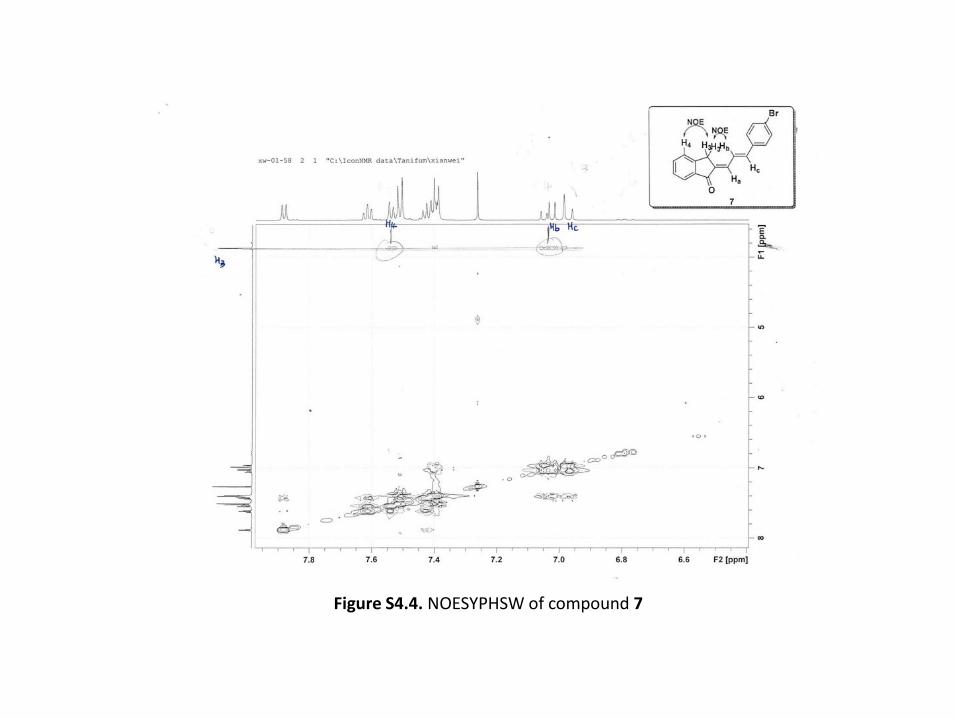
Figure S4.4. NOESYPHSW of compound 7
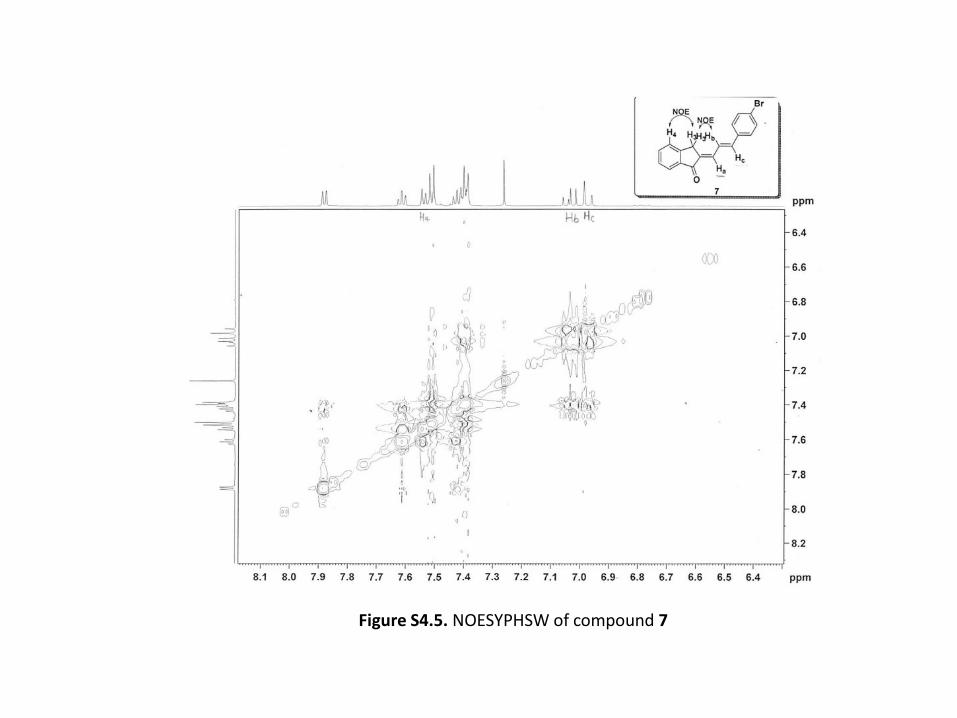
Figure S4.5. NOESYPHSW of compound 7
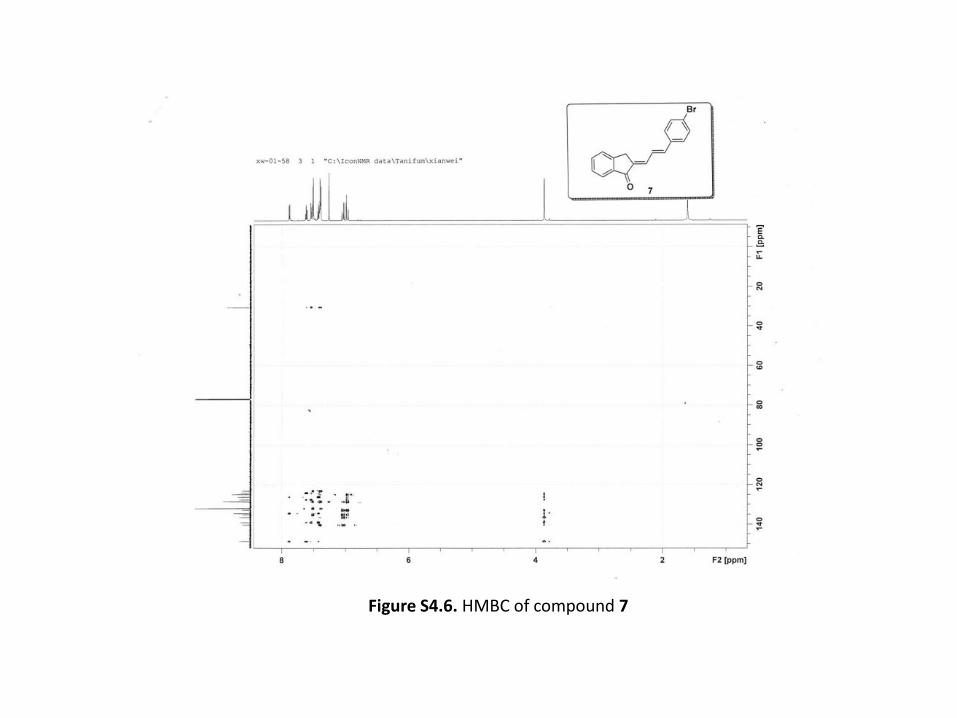
Figure S4.6. HMBC of compound 7
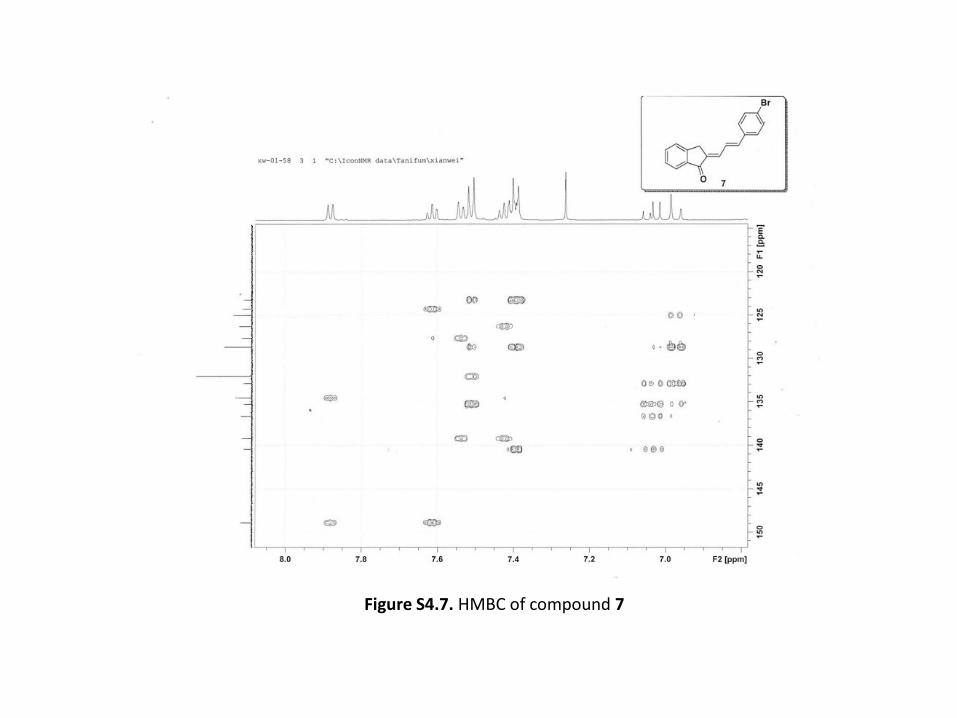
Figure S4.7. HMBC of compound 7
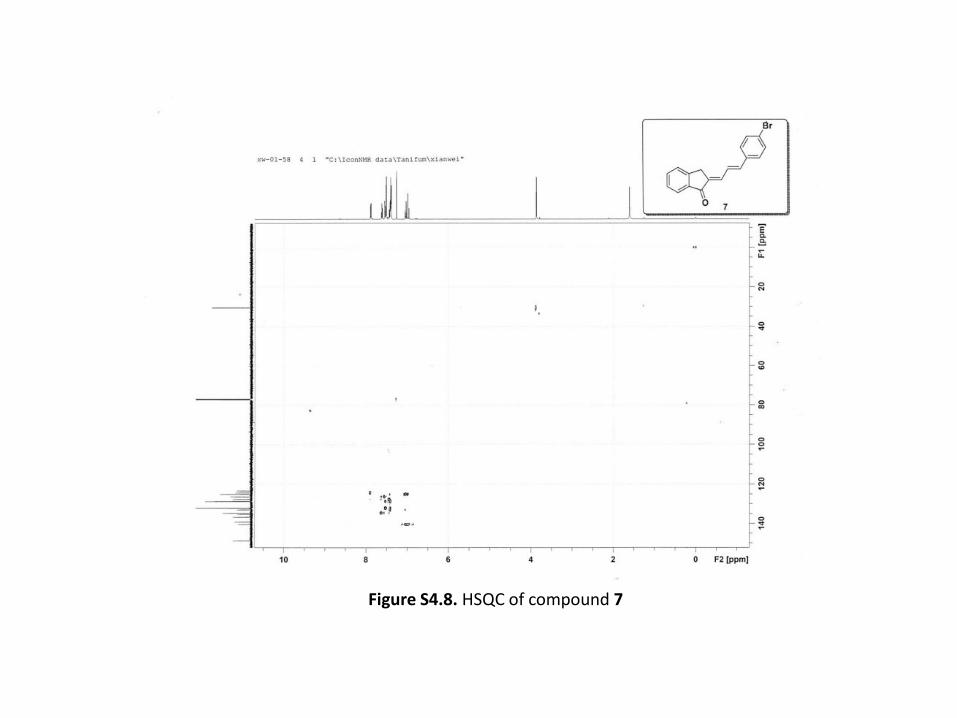
Figure S4.8. HSQC of compound 7
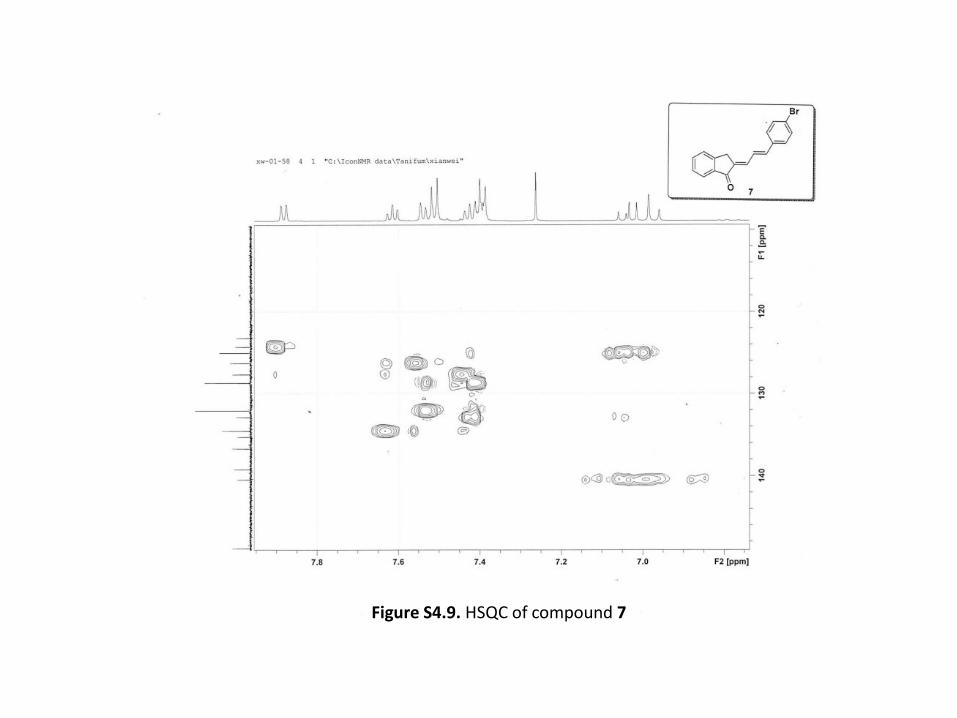
Figure S4.9. HSQC of compound 7
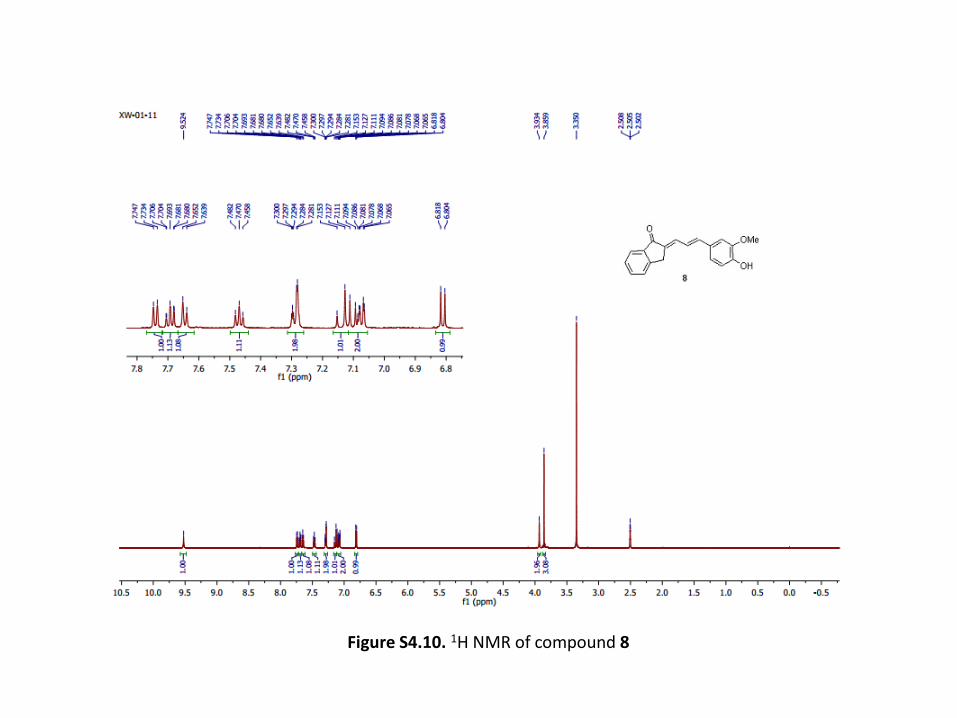
Figure S4.10. 1H NMR of compound 8
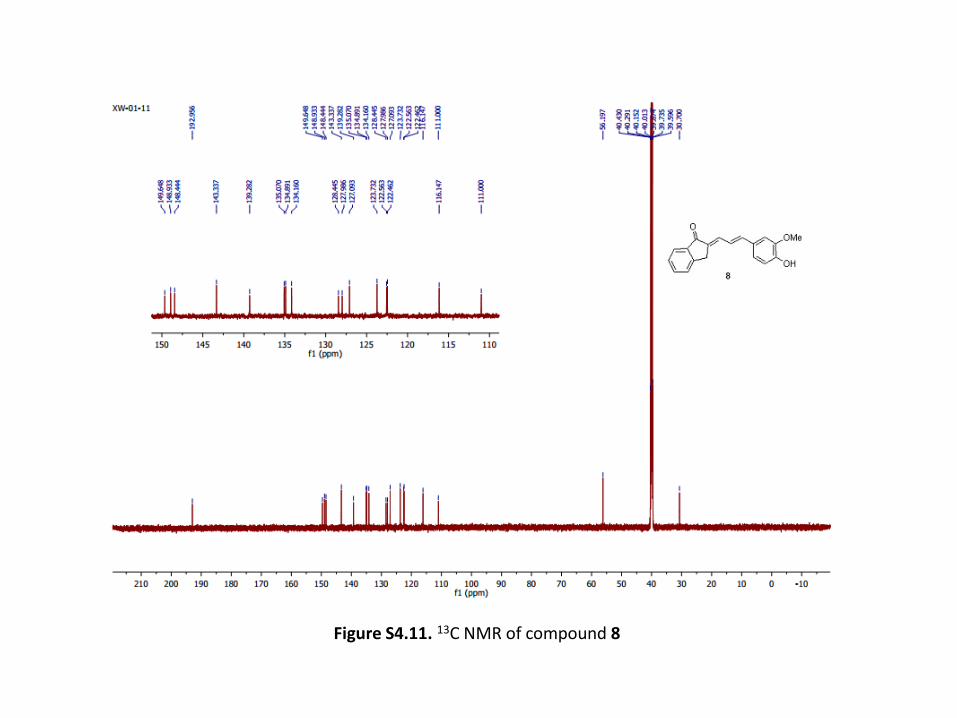
Figure S4.11. 13C NMR of compound 8
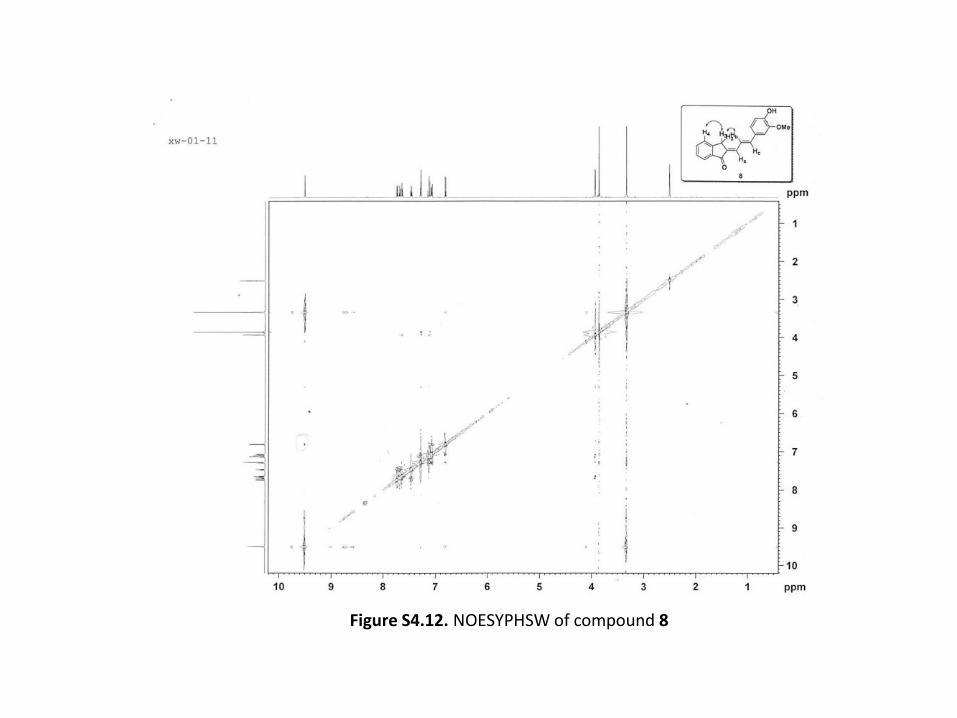
Figure S4.12. NOESYPHSW of compound 8
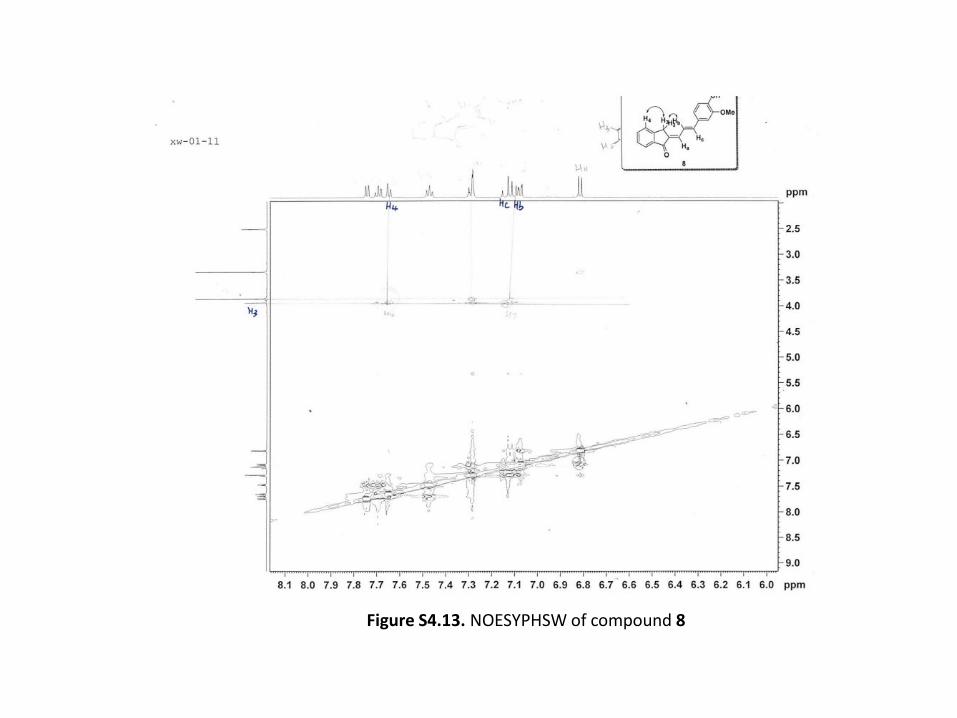
Figure S4.13. NOESYPHSW of compound 8
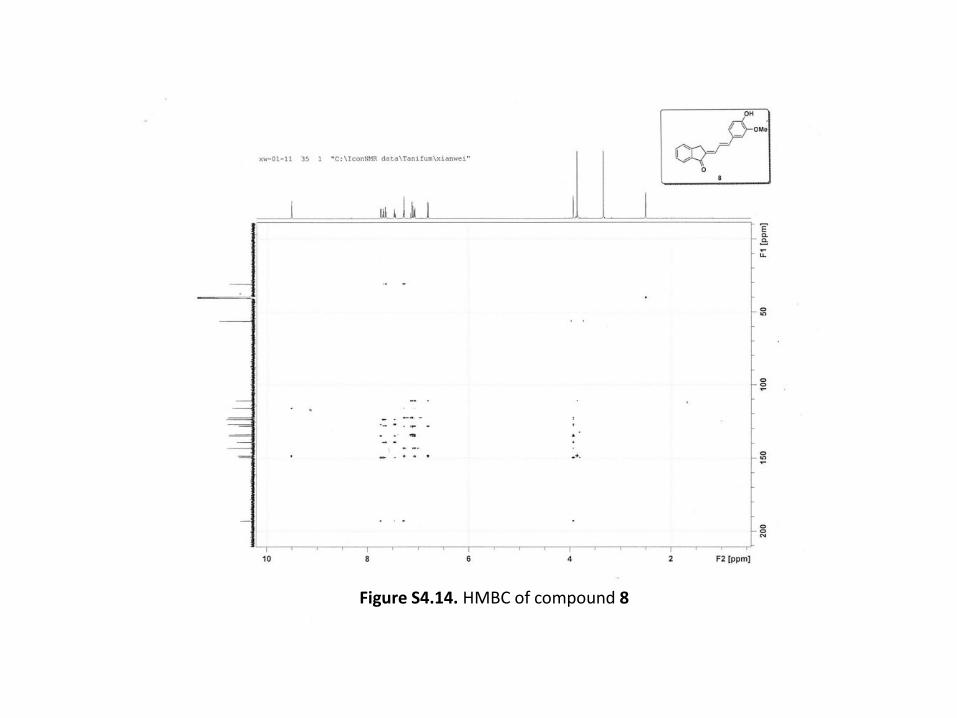
Figure S4.14. HMBC of compound 8
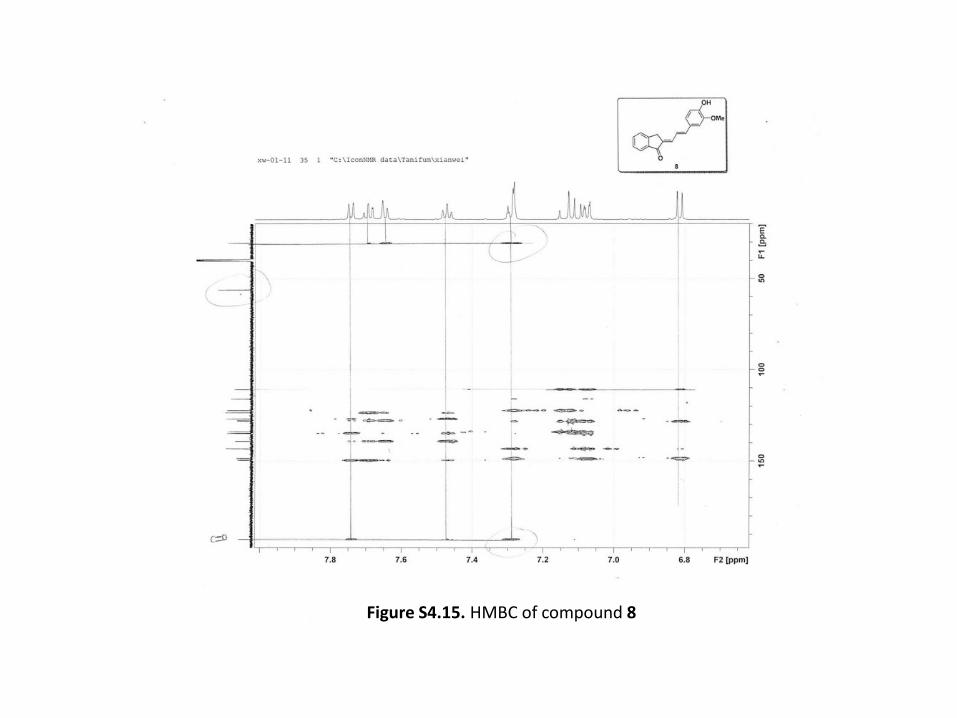
Figure S4.15. HMBC of compound 8
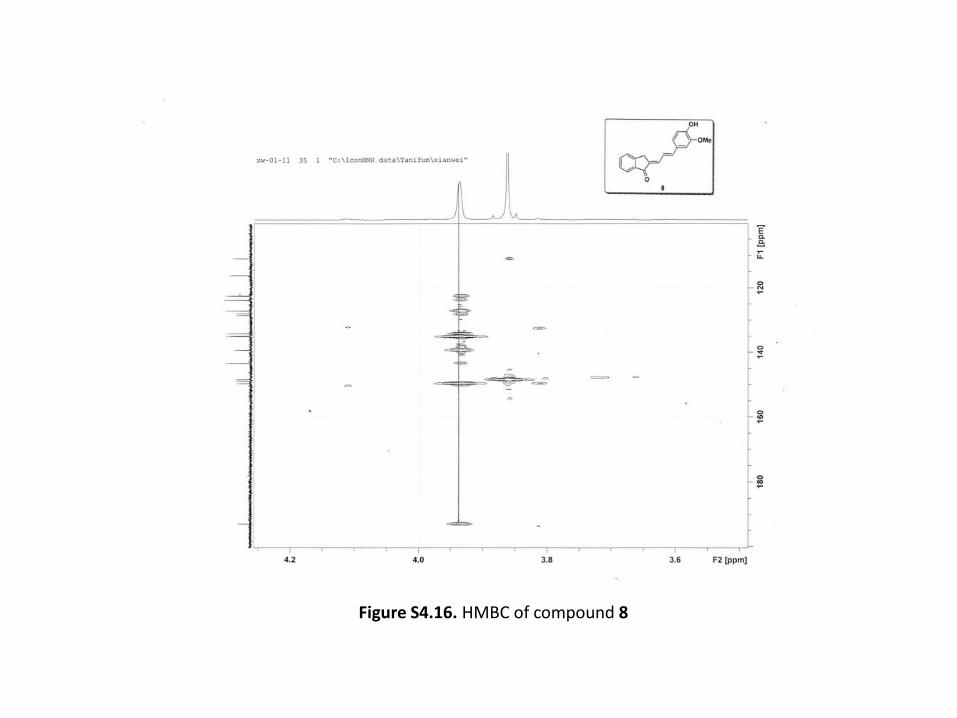
Figure S4.16. HMBC of compound 8
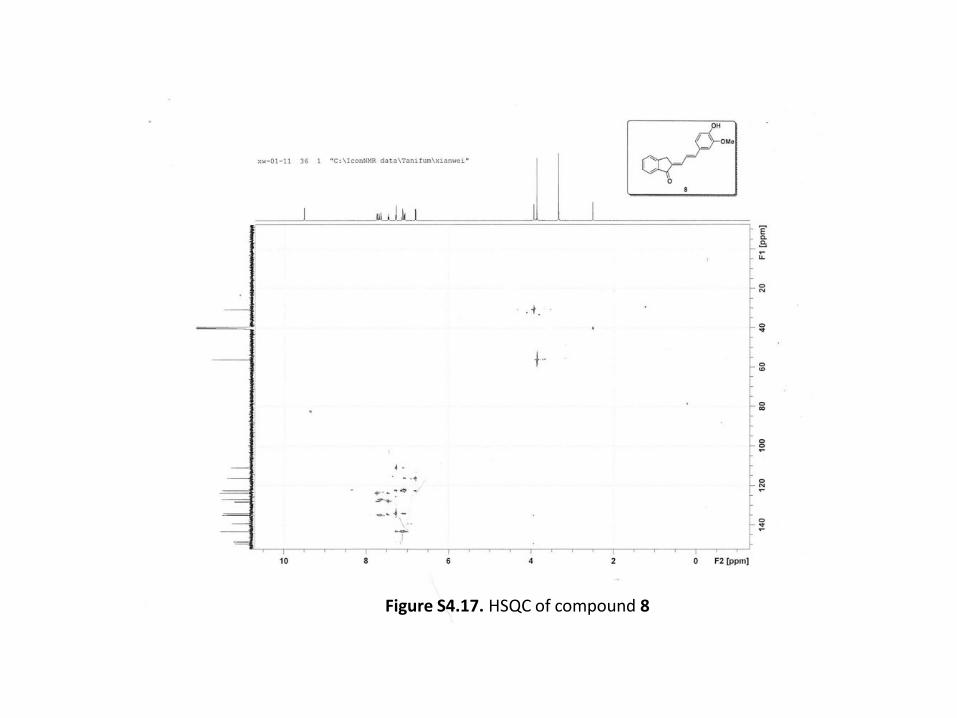
Figure S4.17. HSQC of compound 8
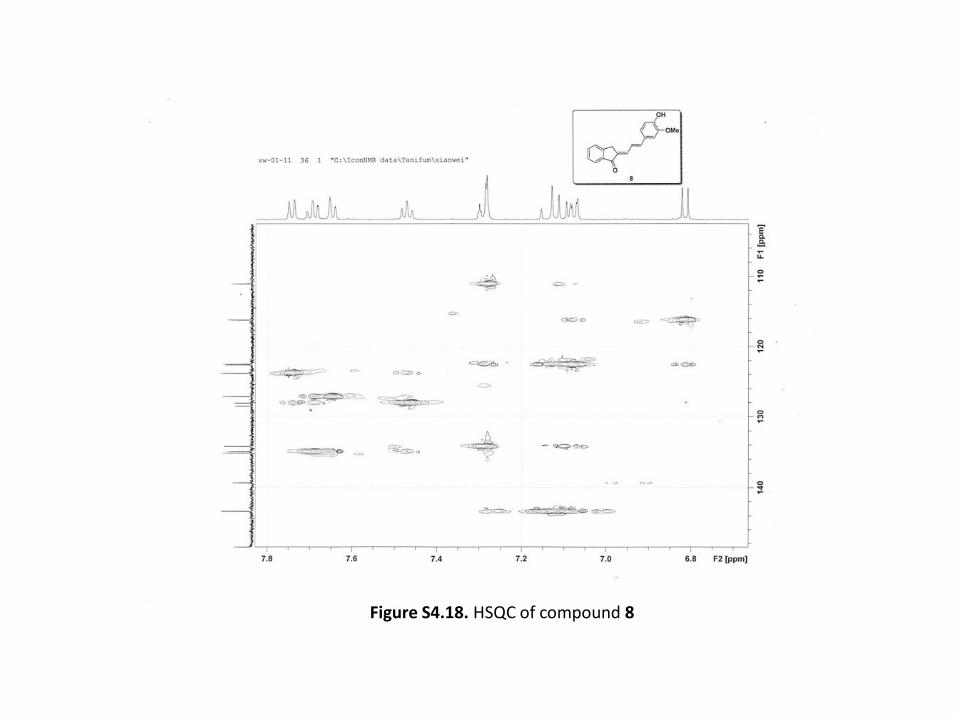
Figure S4.18. HSQC of compound 8
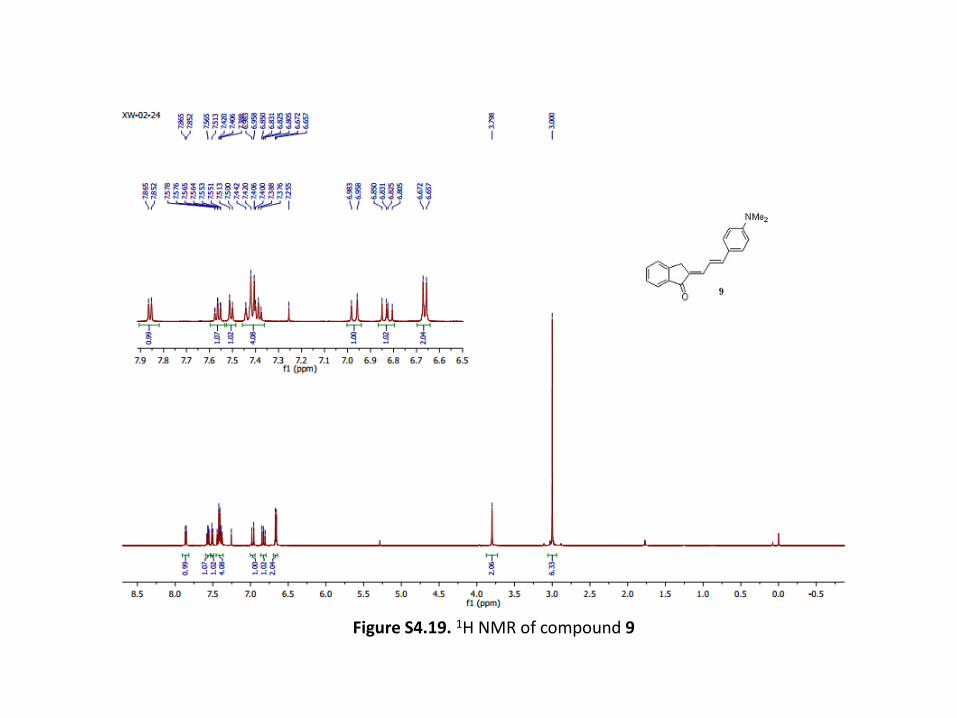
Figure S4.19. 1H NMR of compound 9
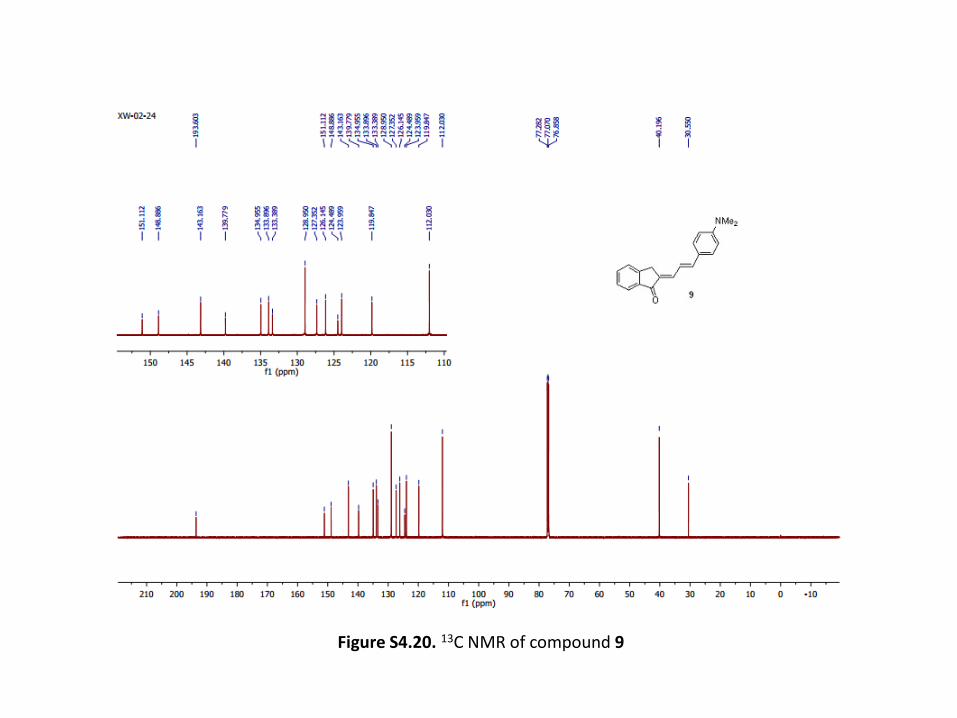
Figure S4.20. 13C NMR of compound 9
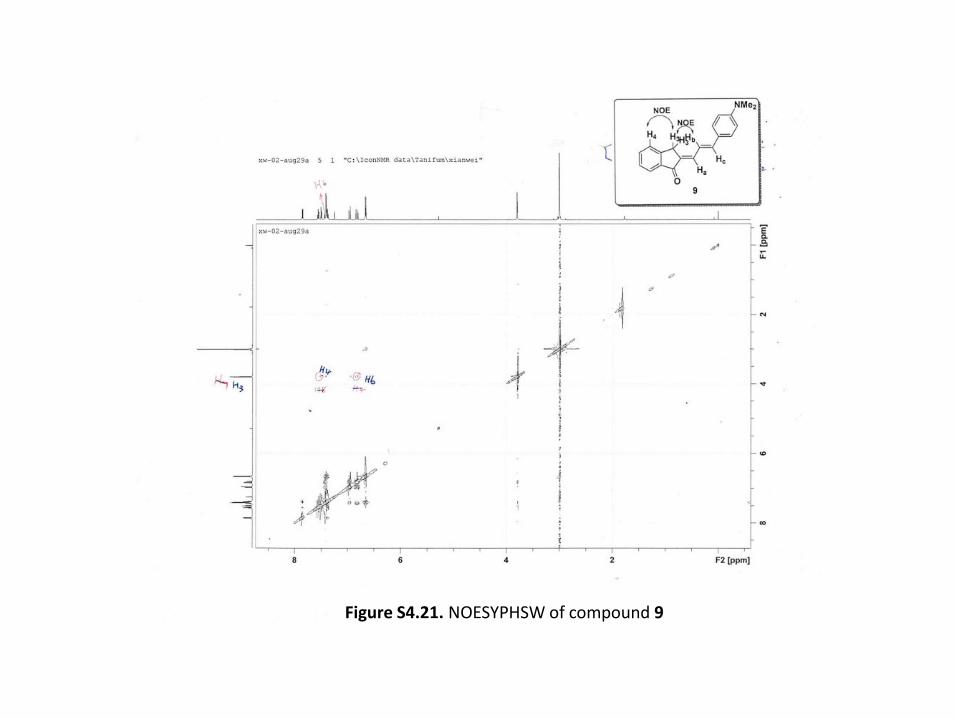
Figure S4.21. NOESYPHSW of compound 9
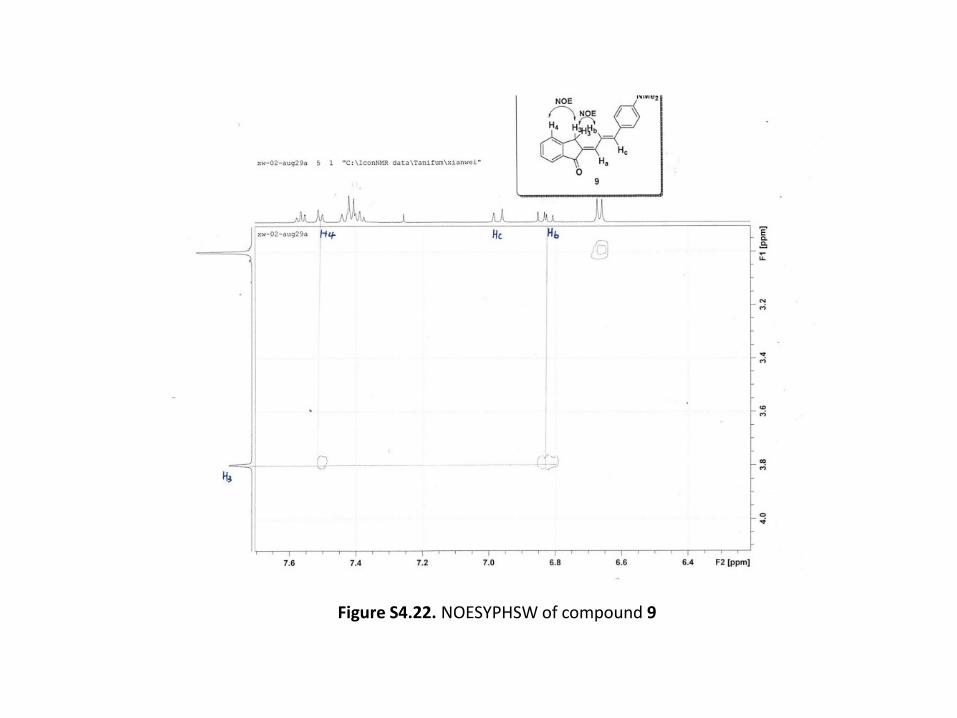
Figure S4.22. NOESYPHSW of compound 9
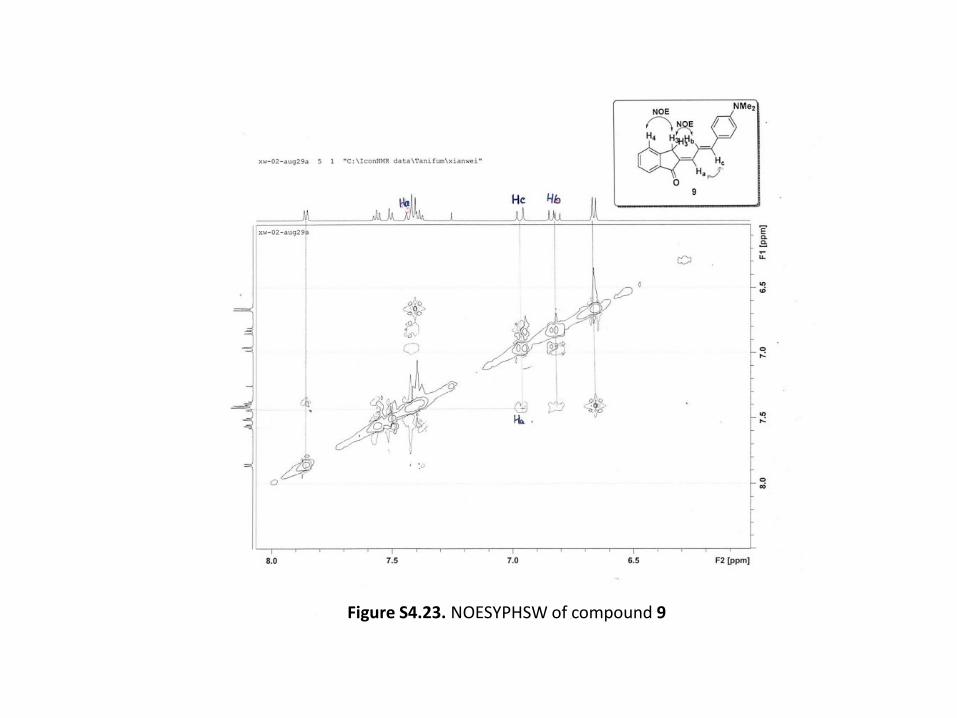
Figure S4.23. NOESYPHSW of compound 9
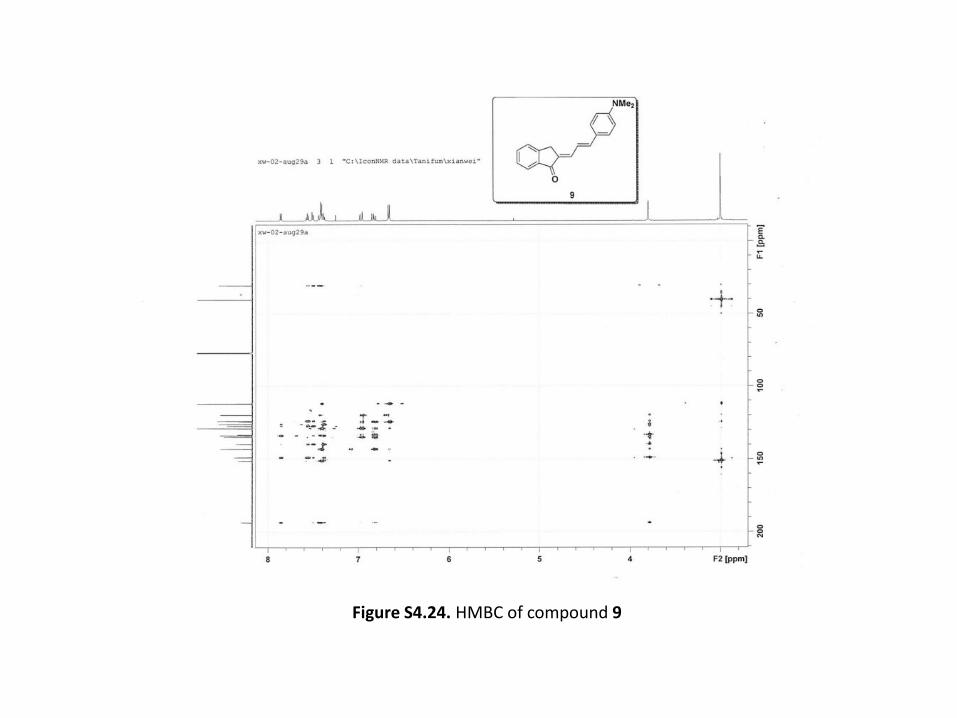
Figure S4.24. HMBC of compound 9
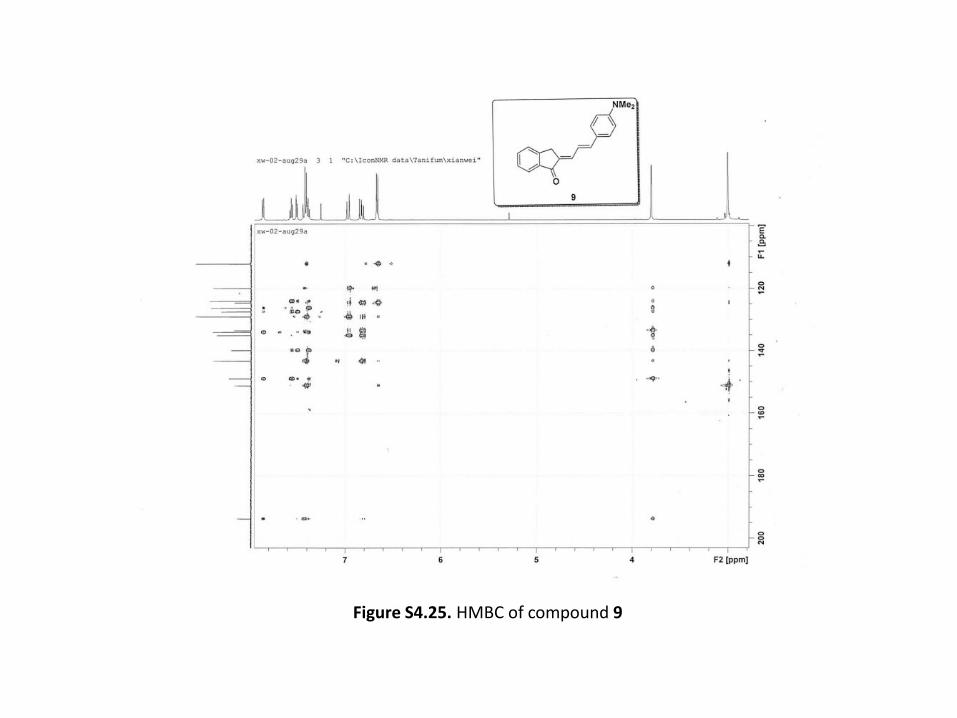
Figure S4.25. HMBC of compound 9
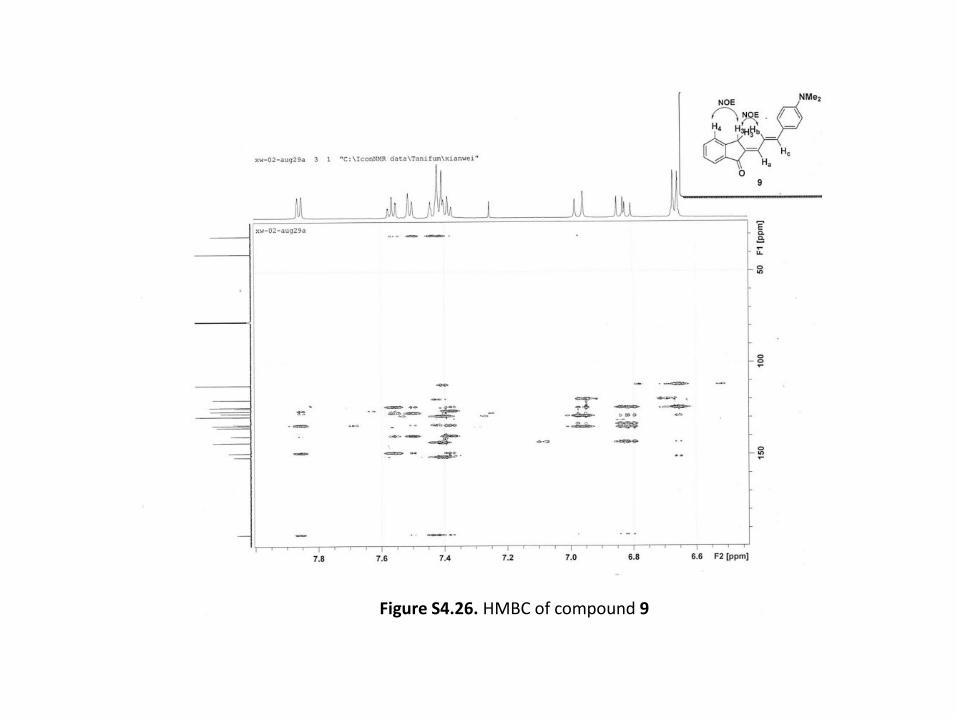
Figure S4.26. HMBC of compound 9
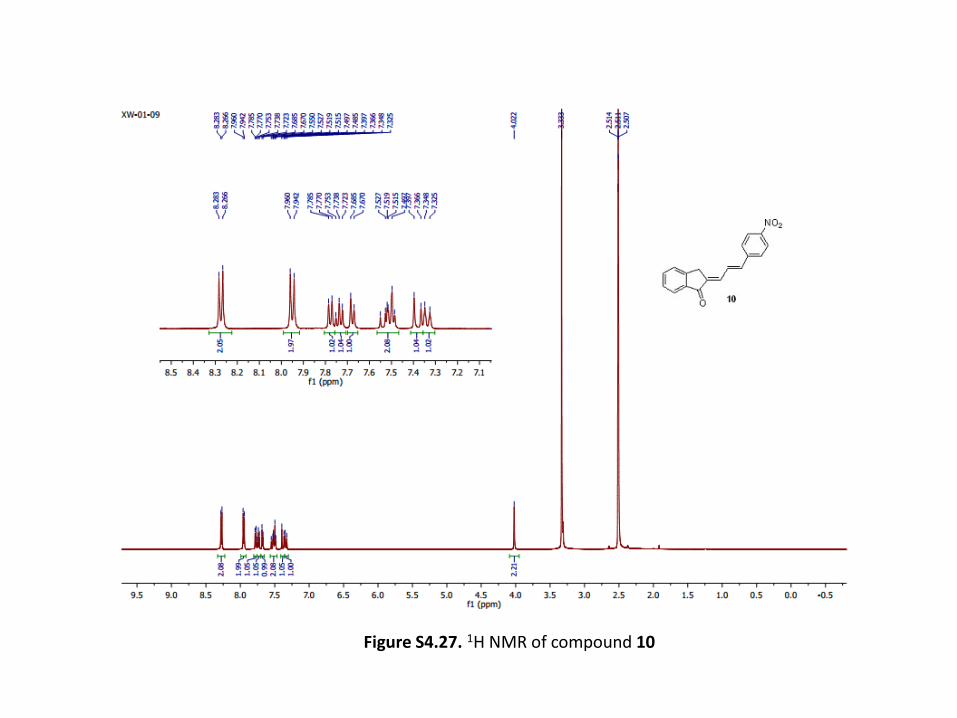
Figure S4.27. 1H NMR of compound 10
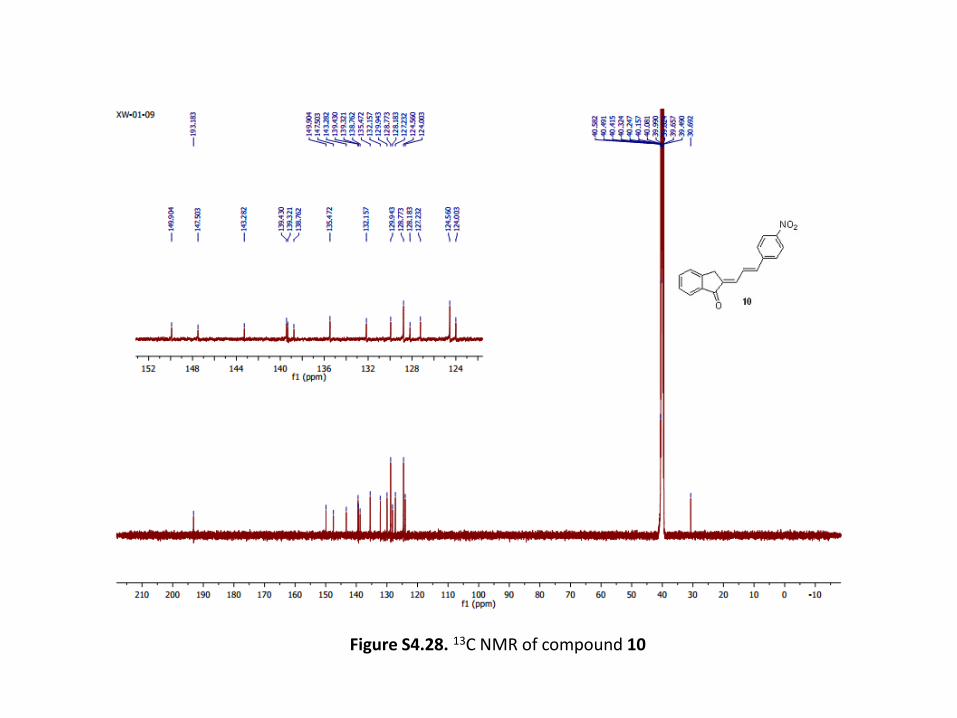
Figure S4.28. 13C NMR of compound 10
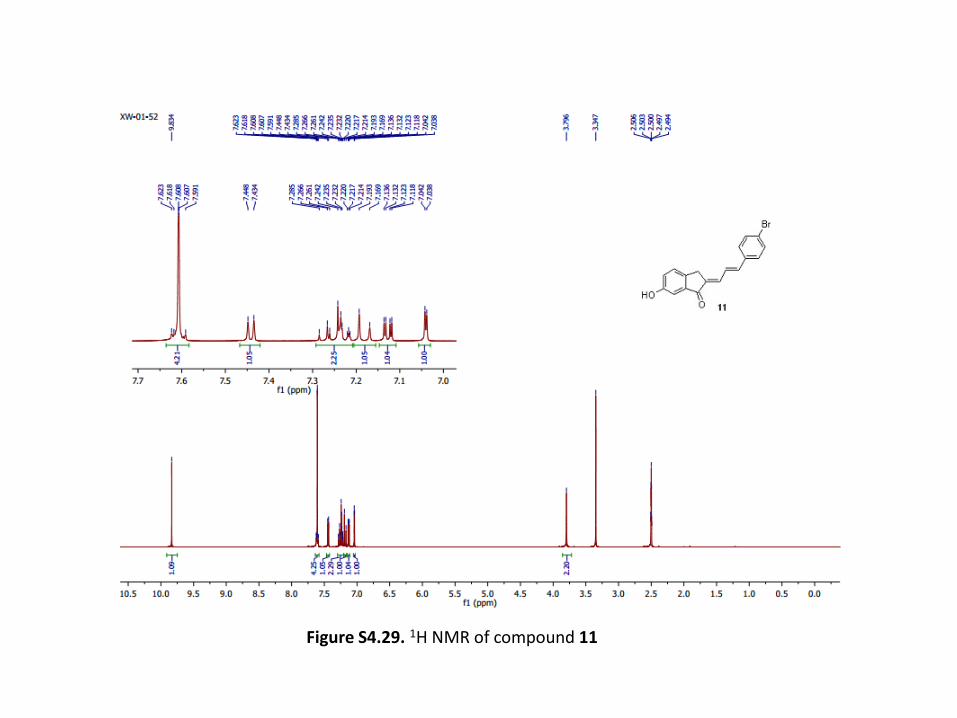
Figure S4.29. 1H NMR of compound 11
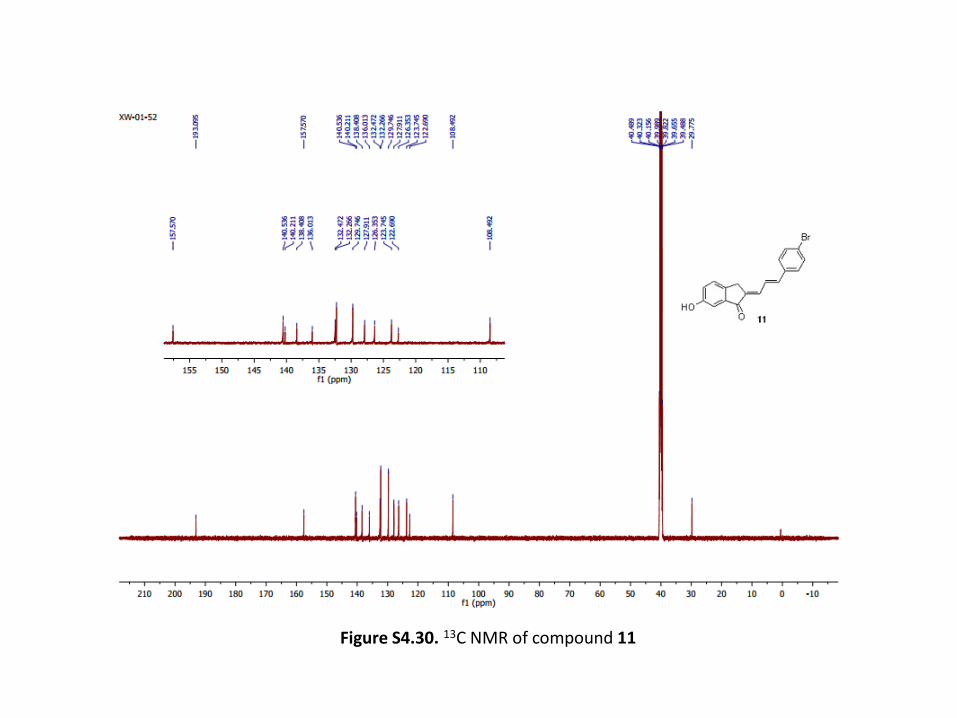
Figure S4.30. 13C NMR of compound 11
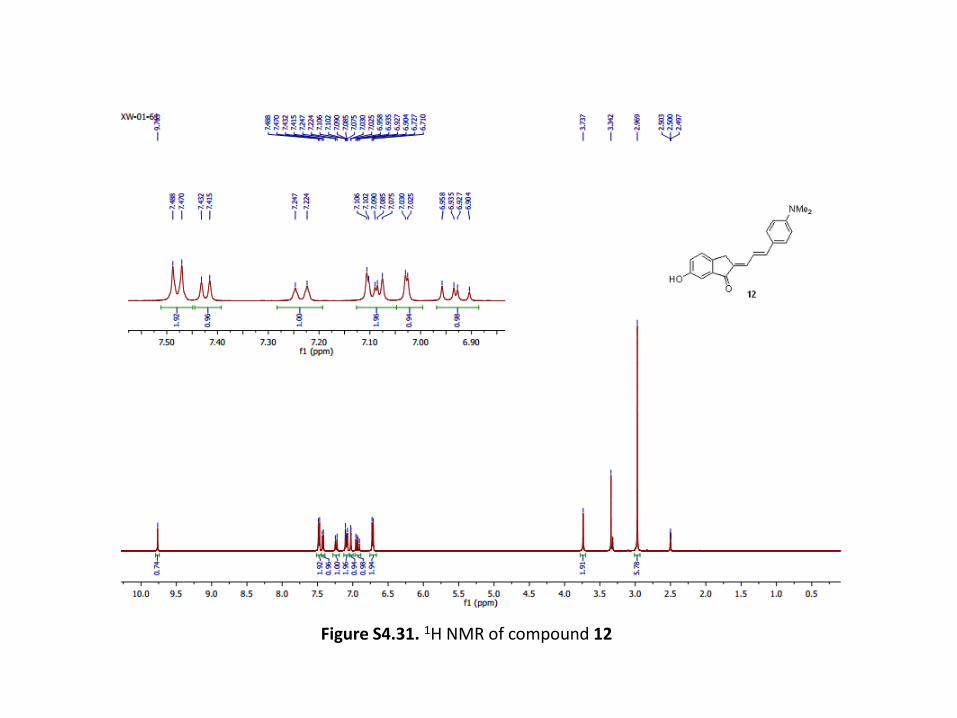
Figure S4.31. 1H NMR of compound 12
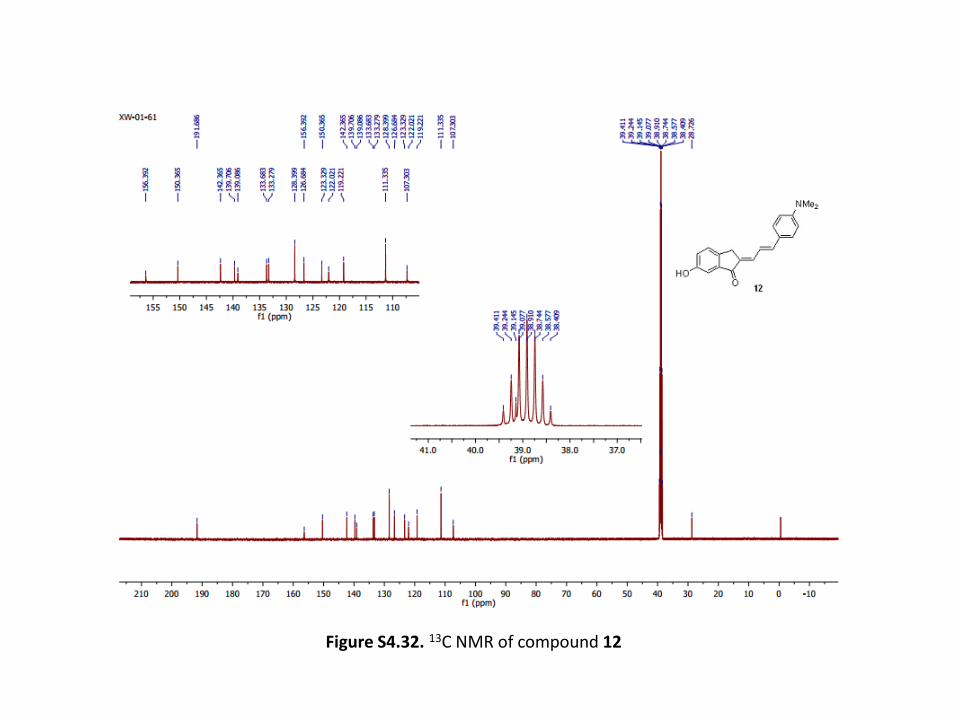
Figure S4.32. 13C NMR of compound 12
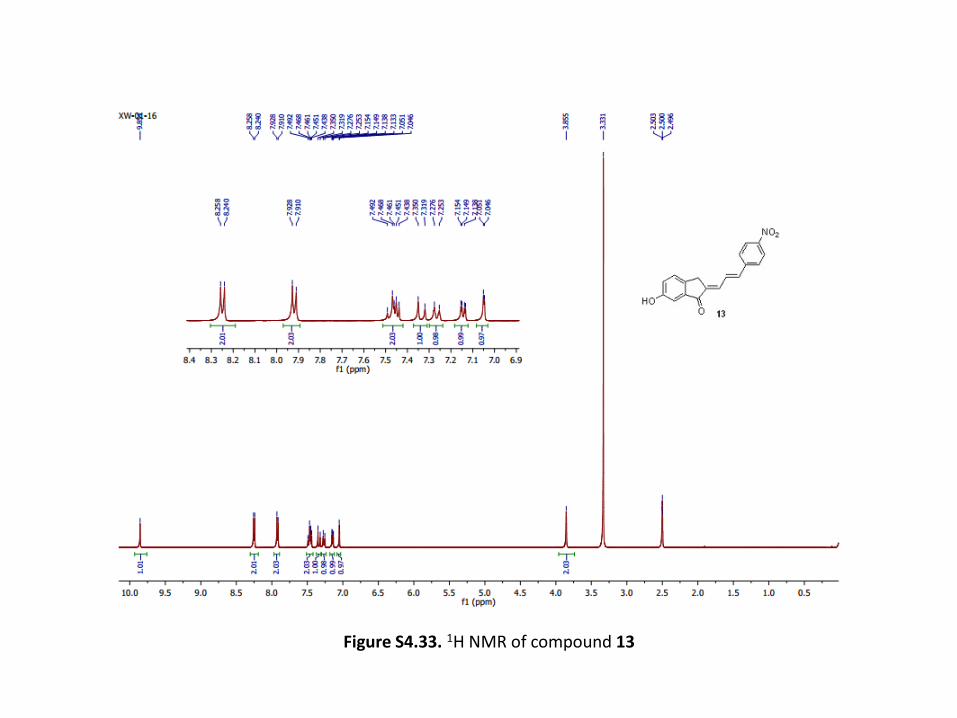
Figure S4.33. 1H NMR of compound 13
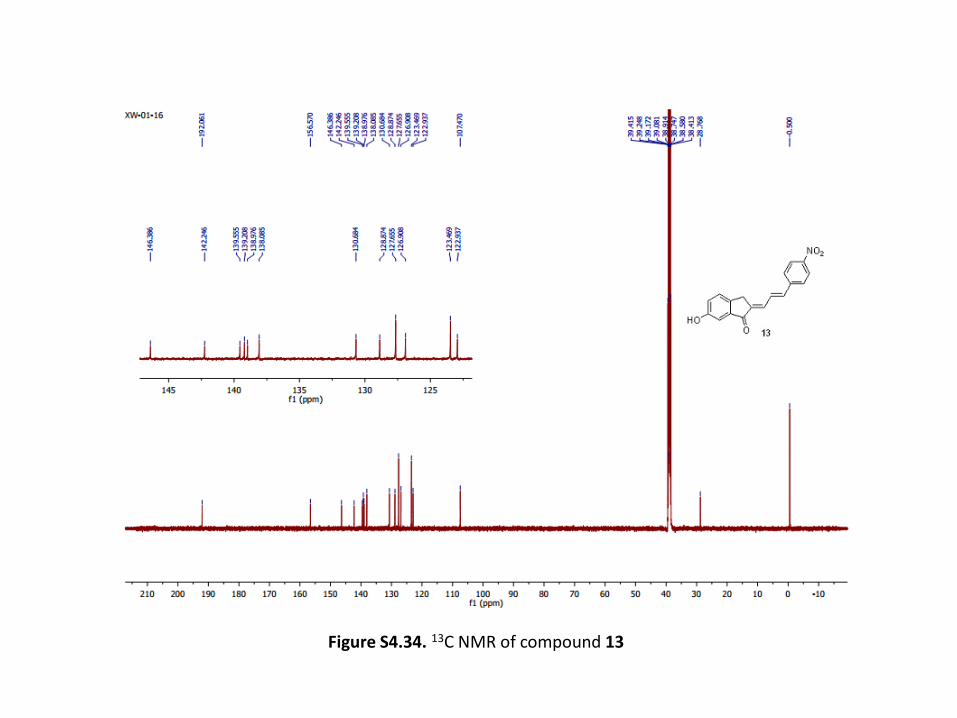
Figure S4.34. 13C NMR of compound 13
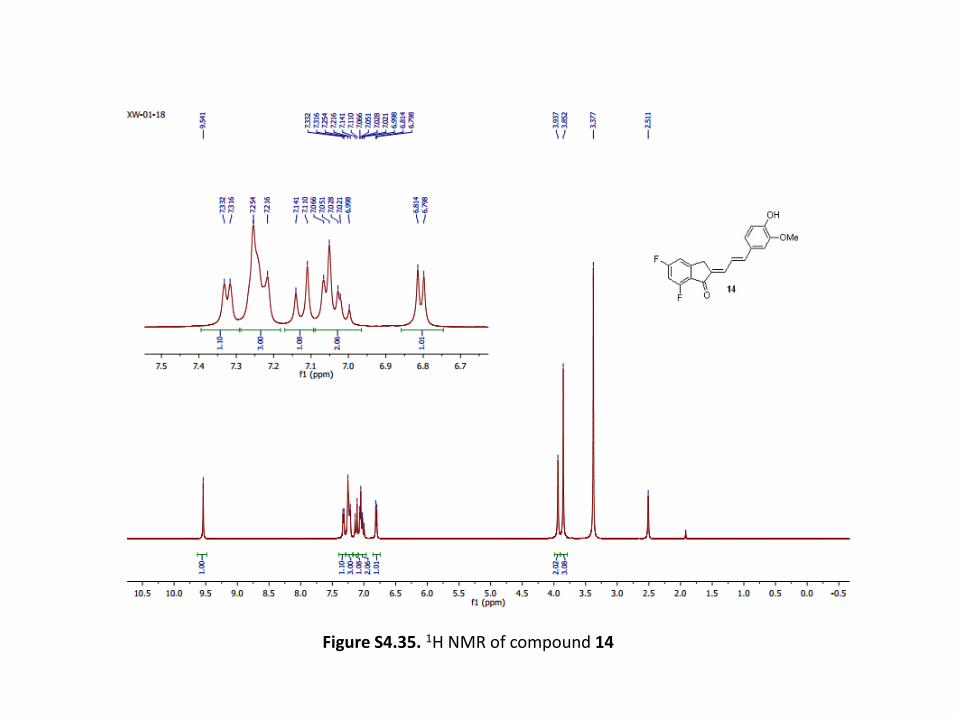
Figure S4.35. 1H NMR of compound 14
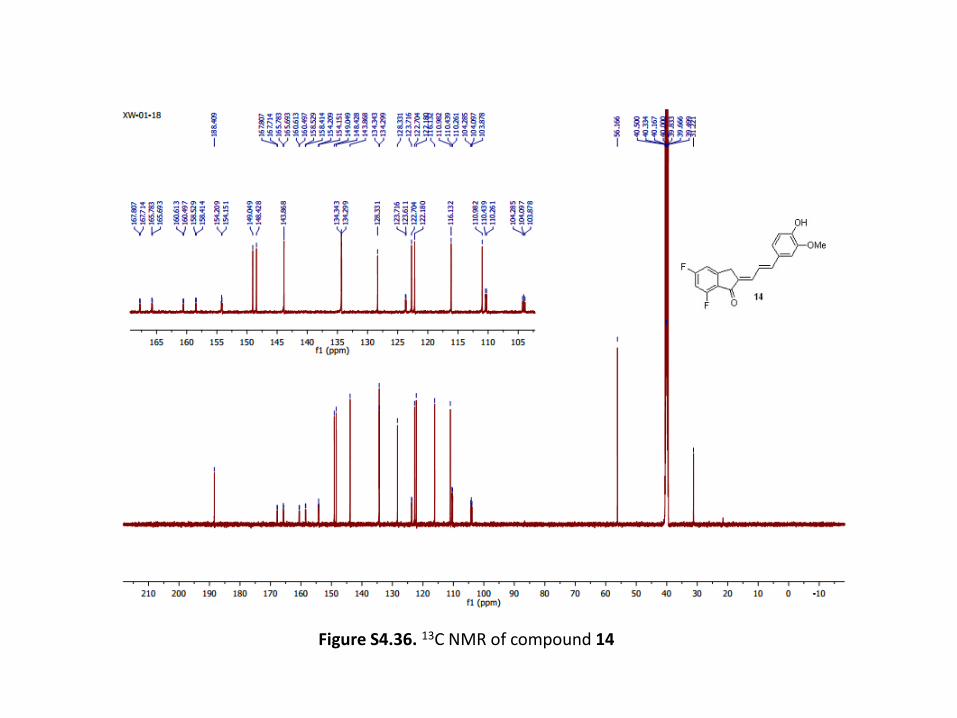
Figure S4.36. 13C NMR of compound 14
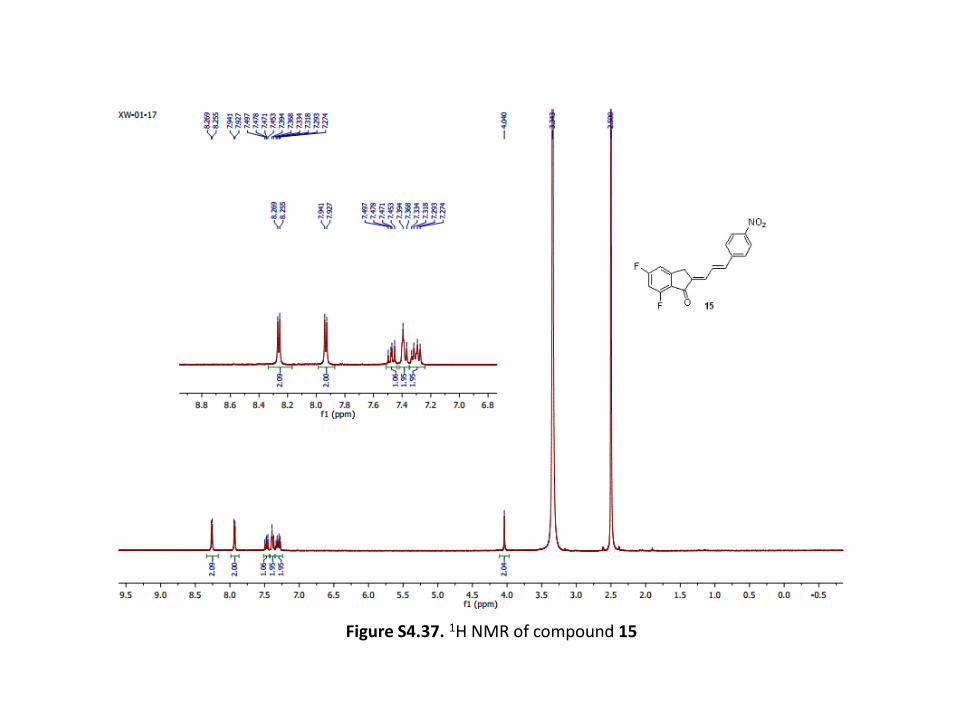
Figure S4.37. 1H NMR of compound 15
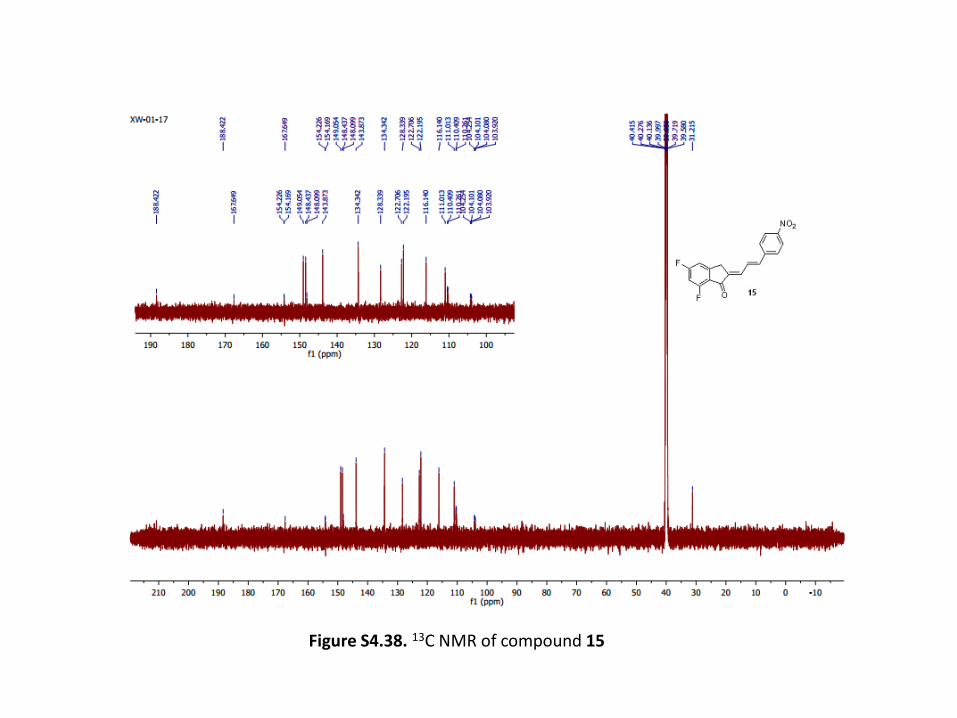
Figure S4.38. 13C NMR of compound 15
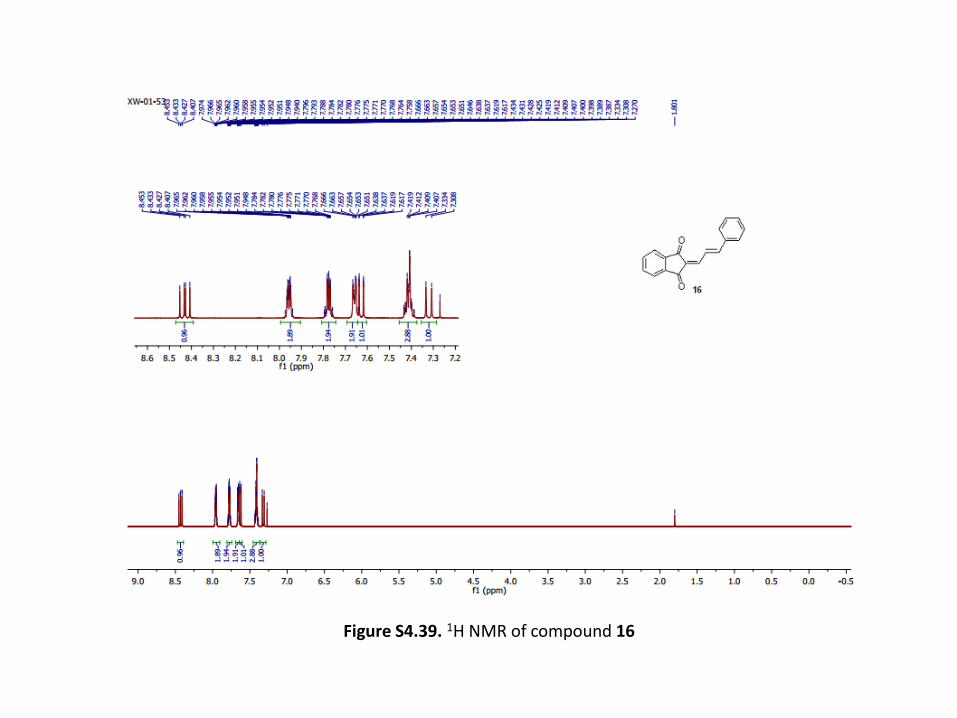
Figure S4.39. 1H NMR of compound 16
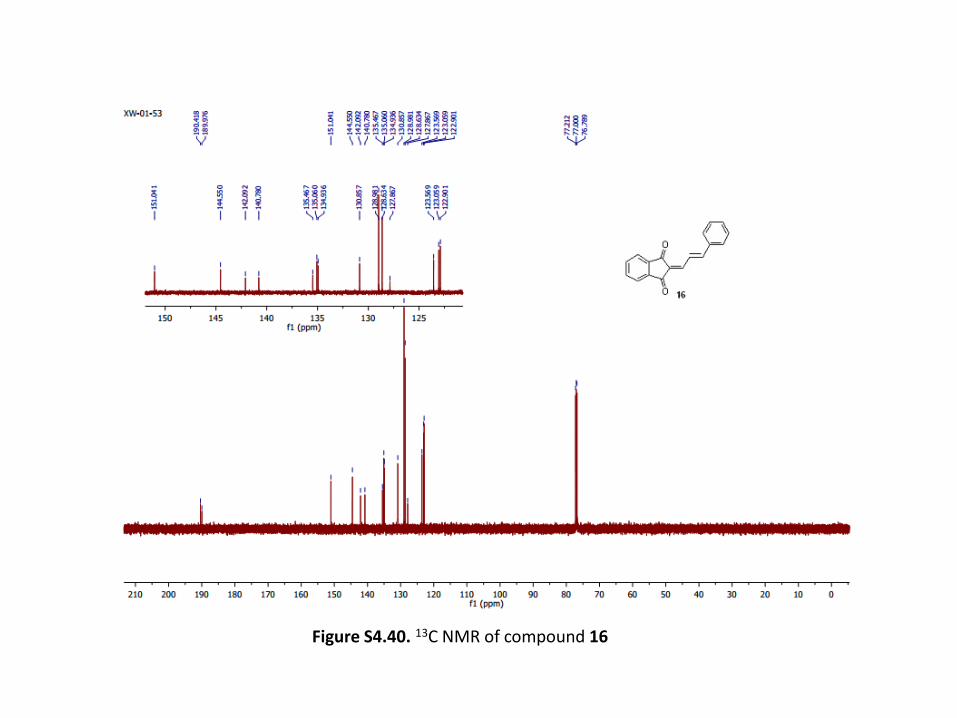
Figure S4.40. 13C NMR of compound 16
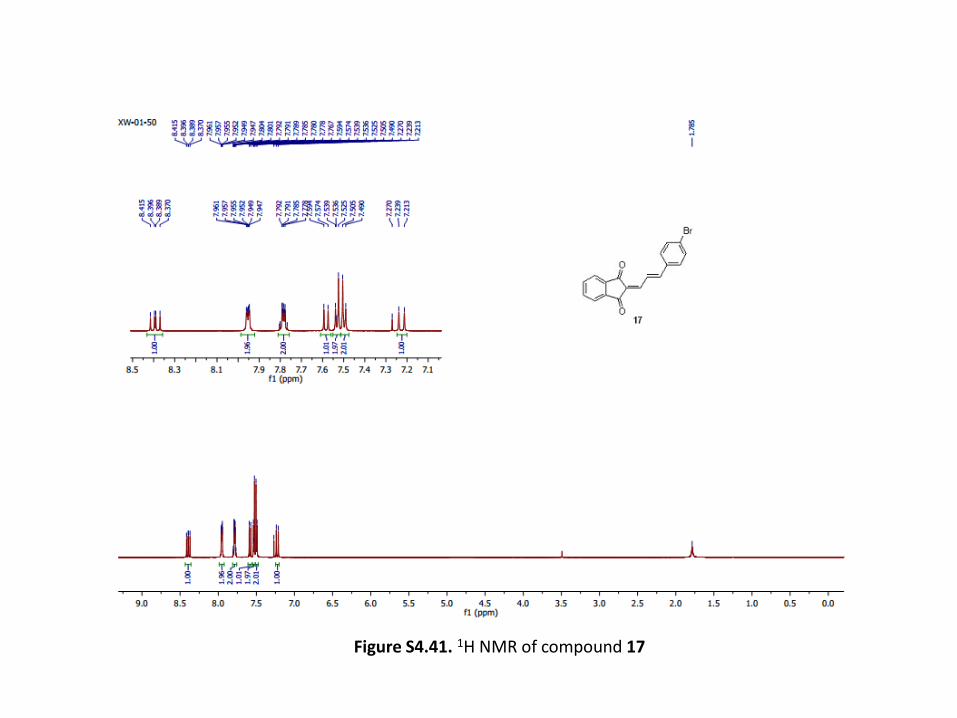
Figure S4.41. 1H NMR of compound 17
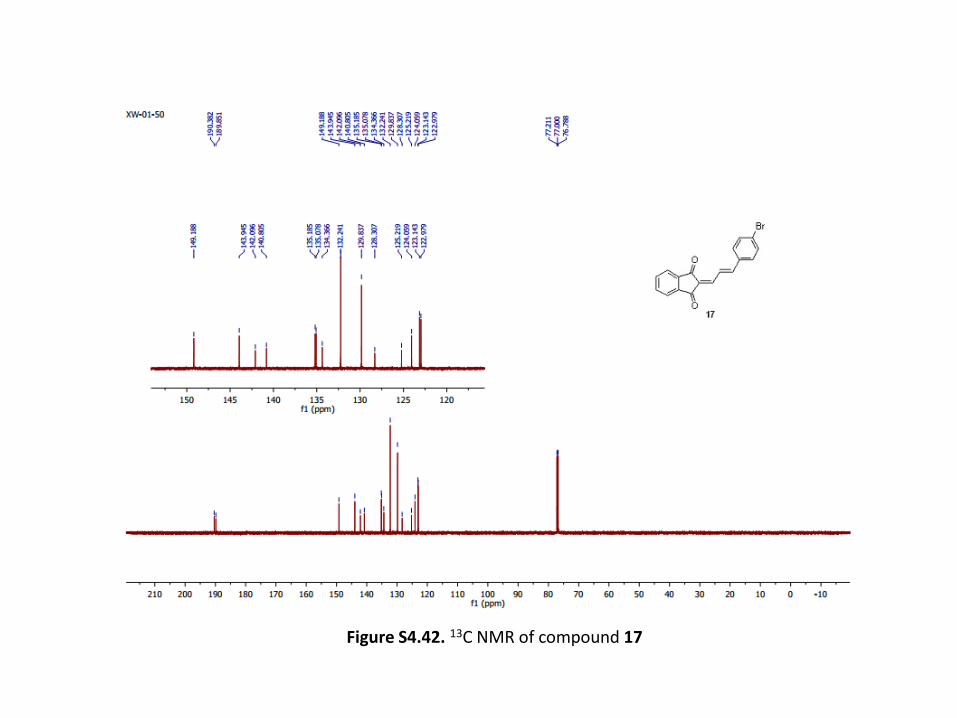
Figure S4.42. 13C NMR of compound 17
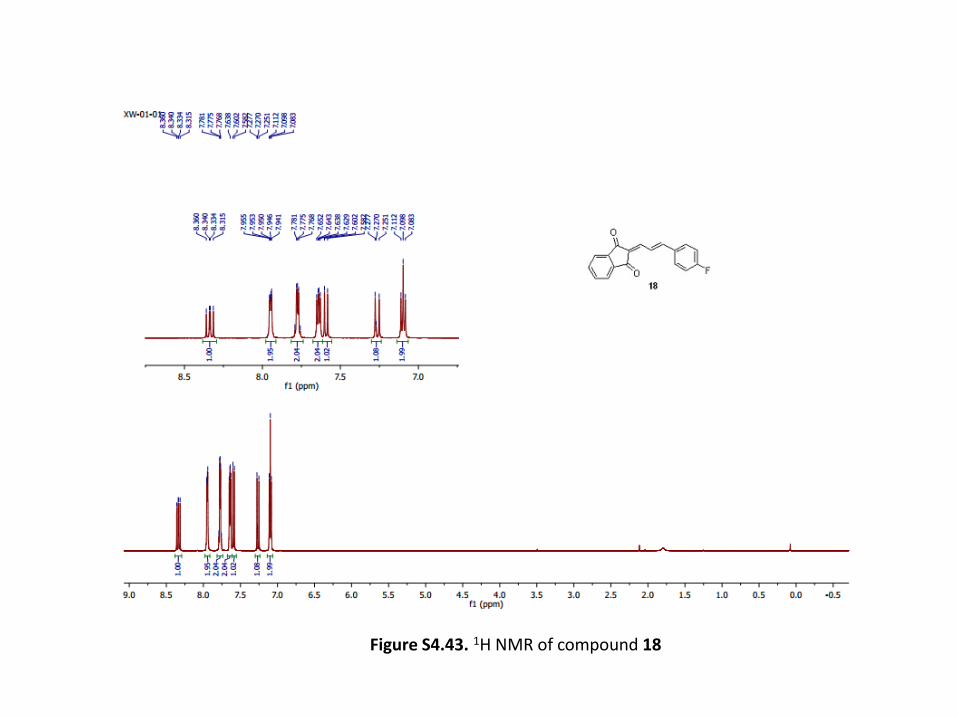
Figure S4.43. 1H NMR of compound 18
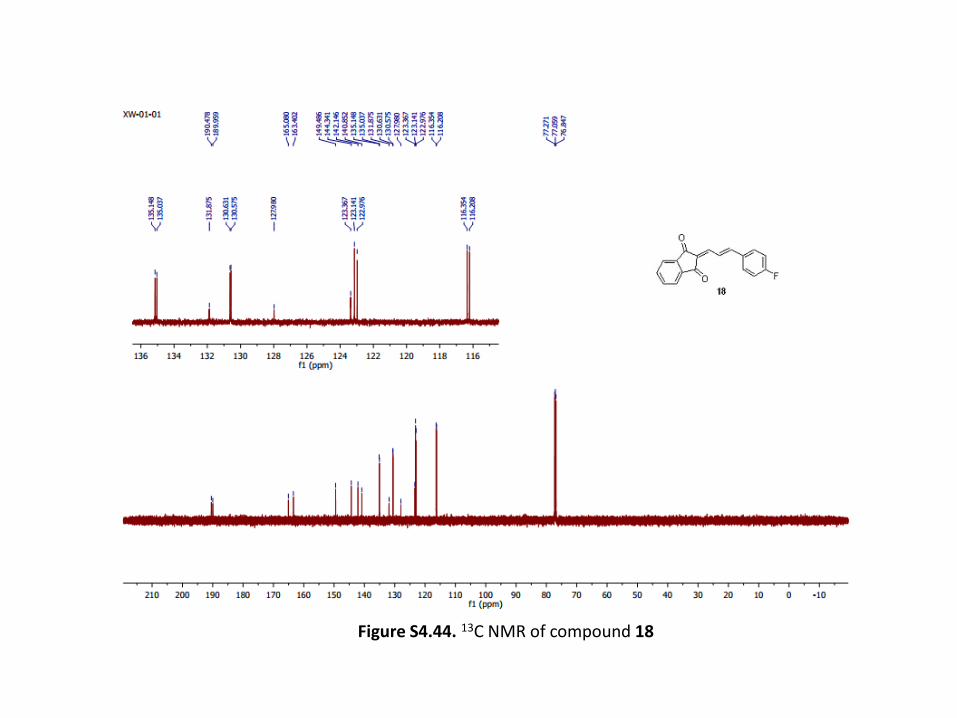
Figure S4.44. 13C NMR of compound 18
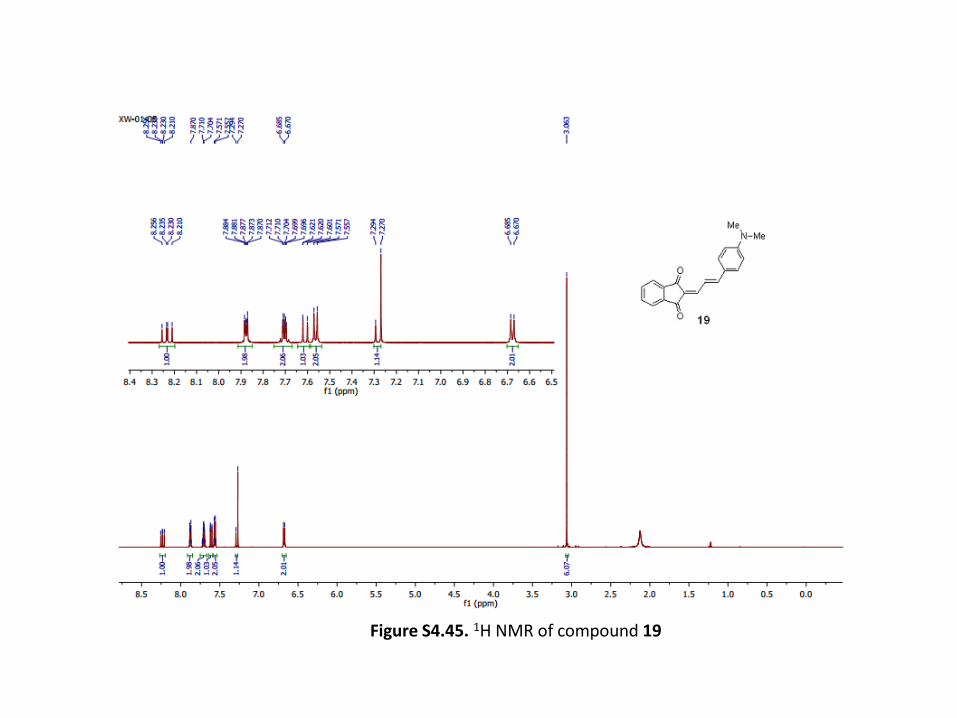
Figure S4.45. 1H NMR of compound 19
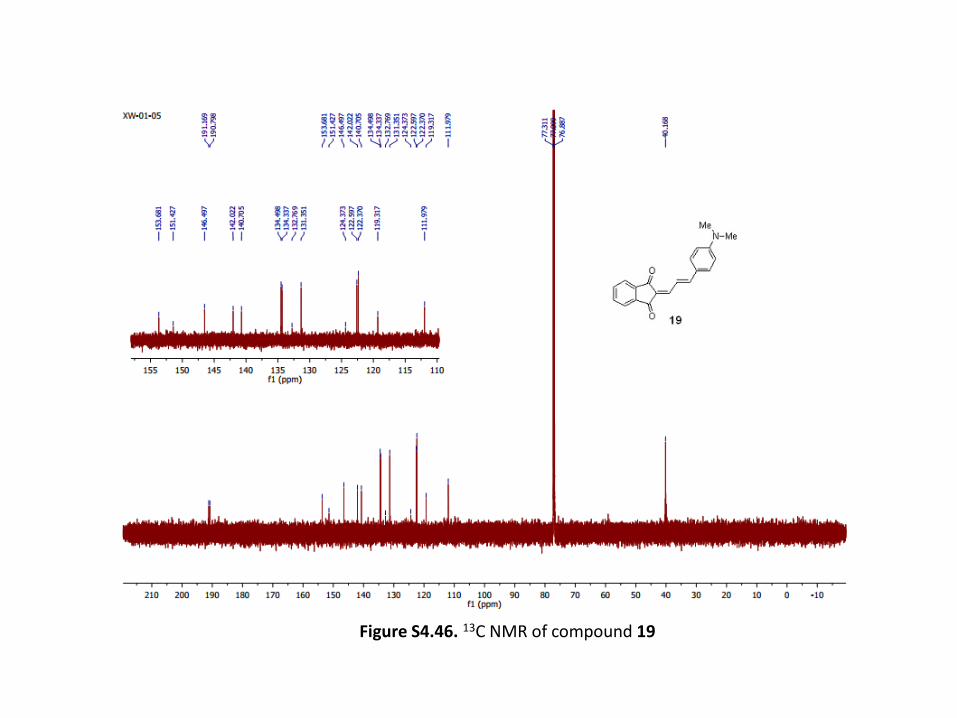
Figure S4.46. 13C NMR of compound 19
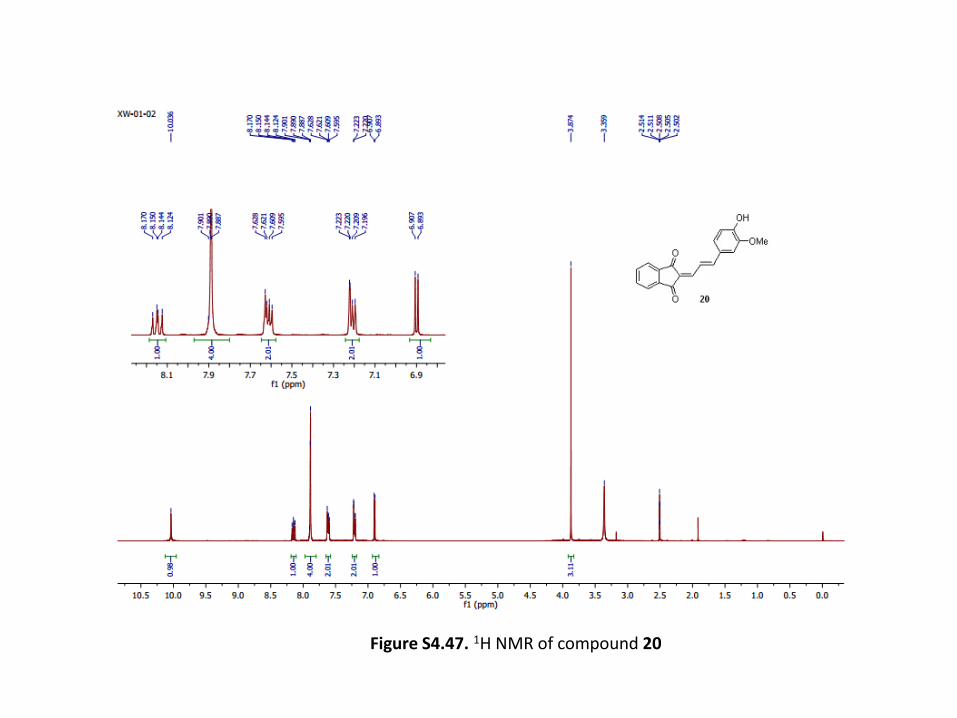
Figure S4.47. 1H NMR of compound 20
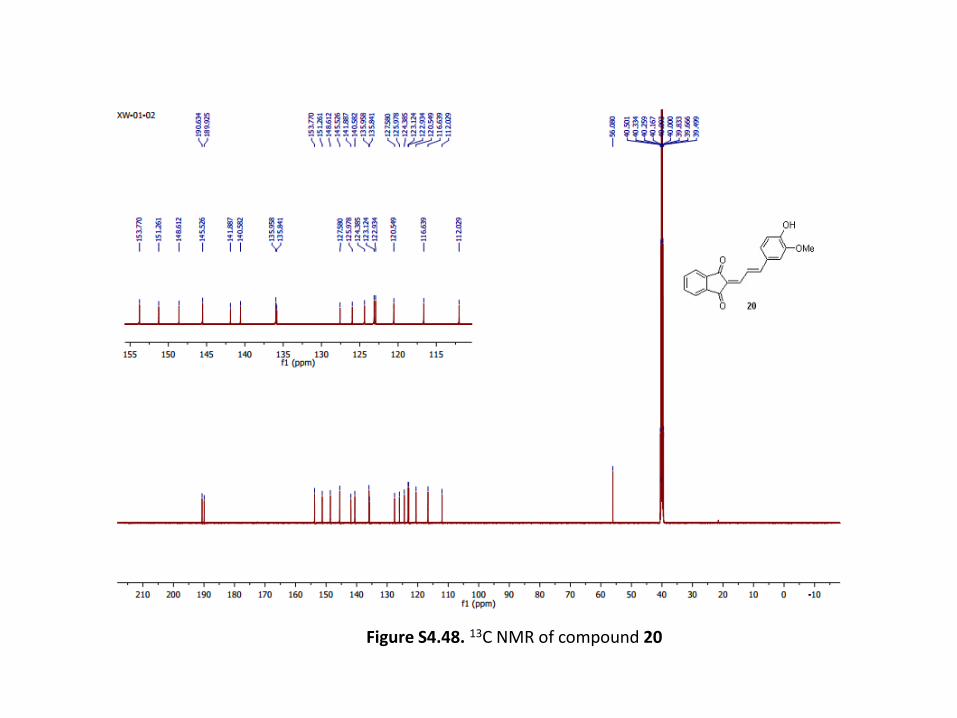
Figure S4.48. 13C NMR of compound 20
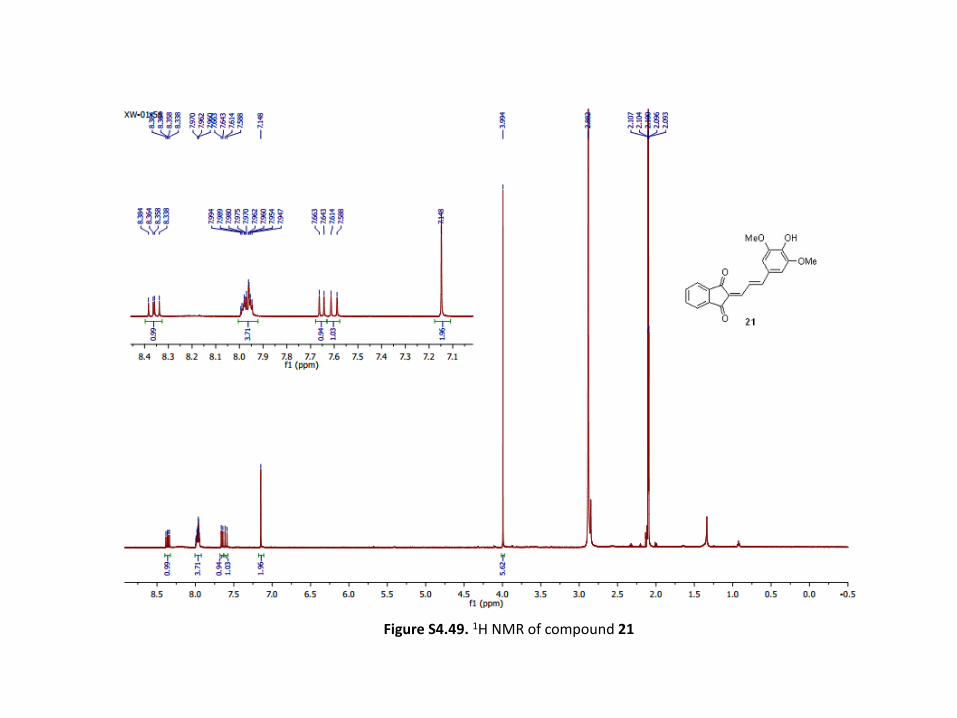
Figure S4.49. 1H NMR of compound 21
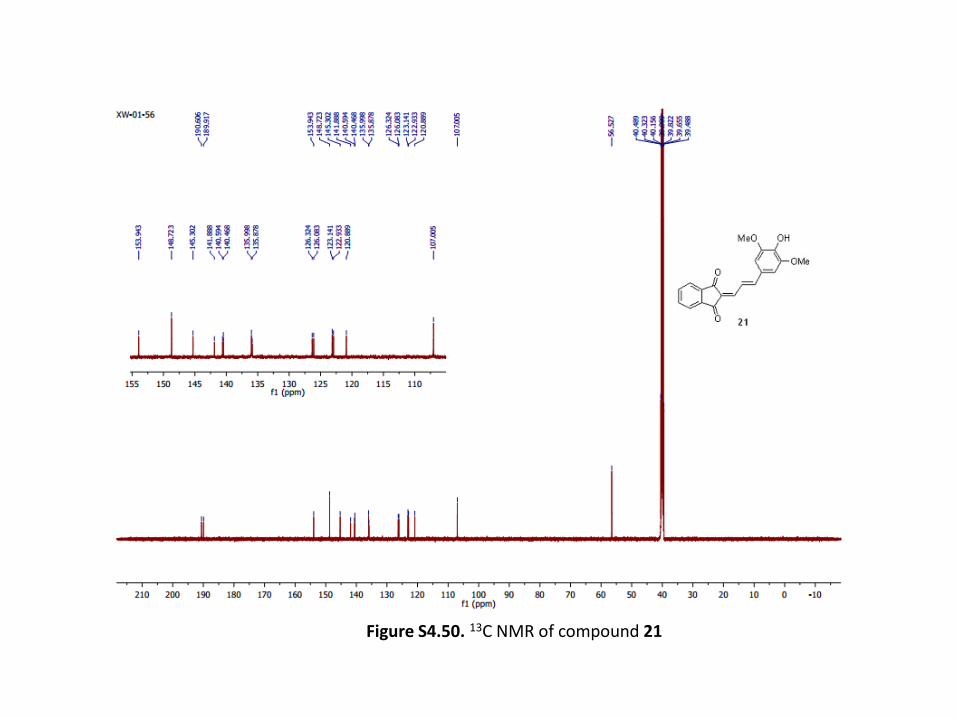
Figure S4.50. 13C NMR of compound 21
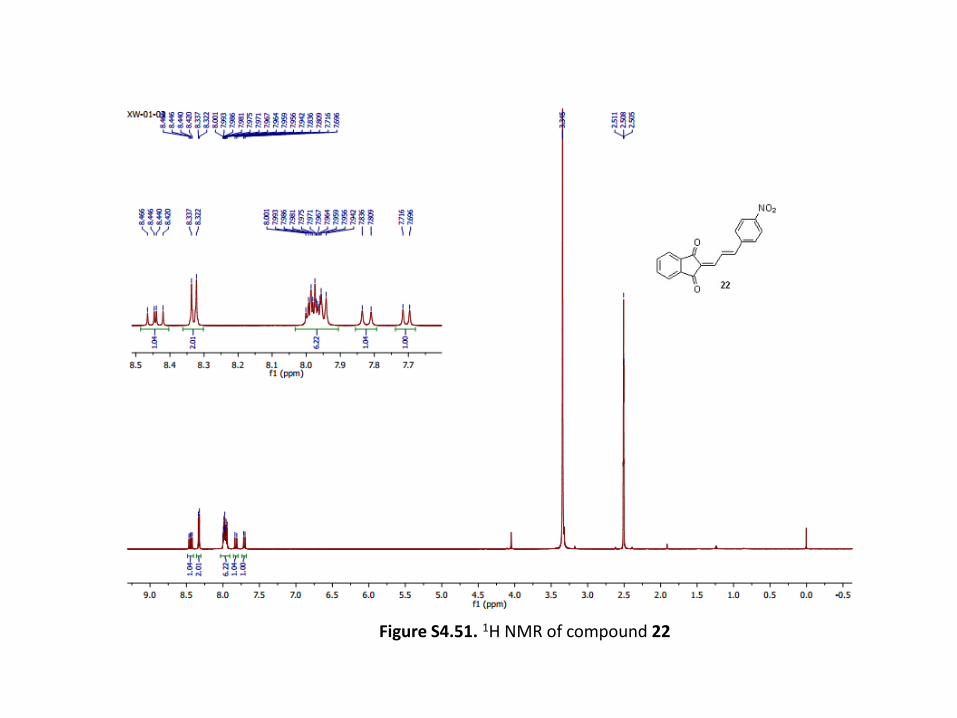
Figure S4.51. 1H NMR of compound 22
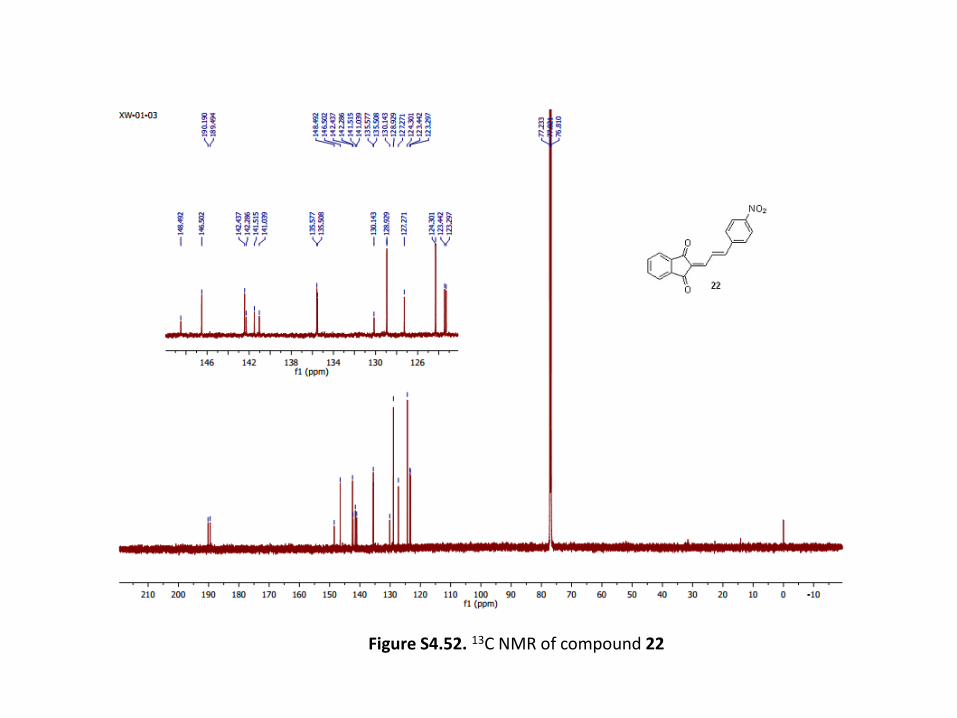
Figure S4.52. 13C NMR of compound 22
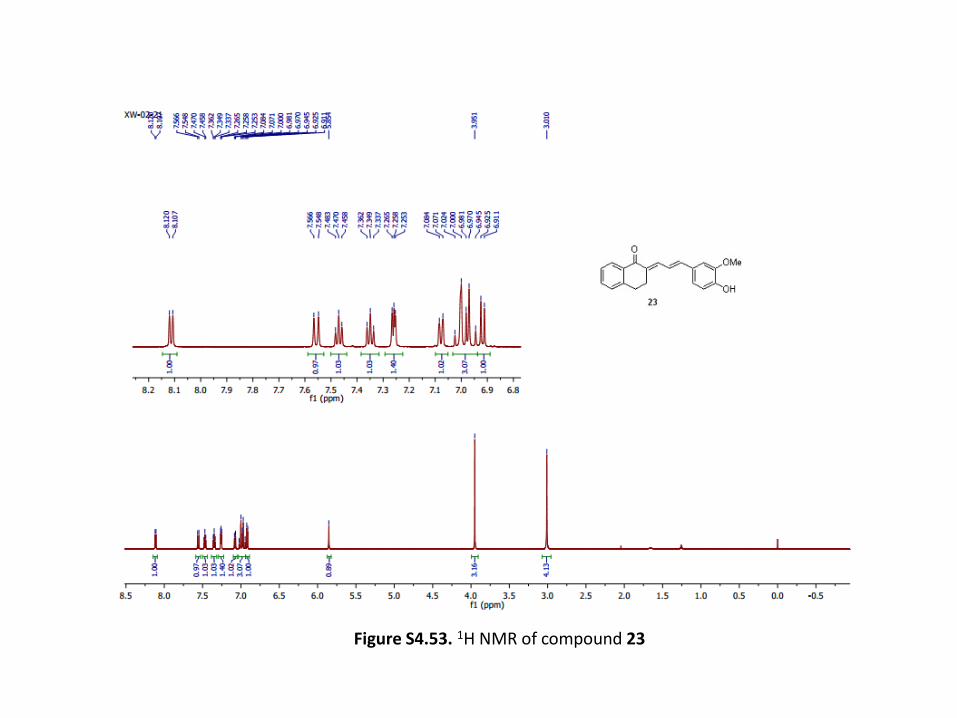
Figure S4.53. 1H NMR of compound 23
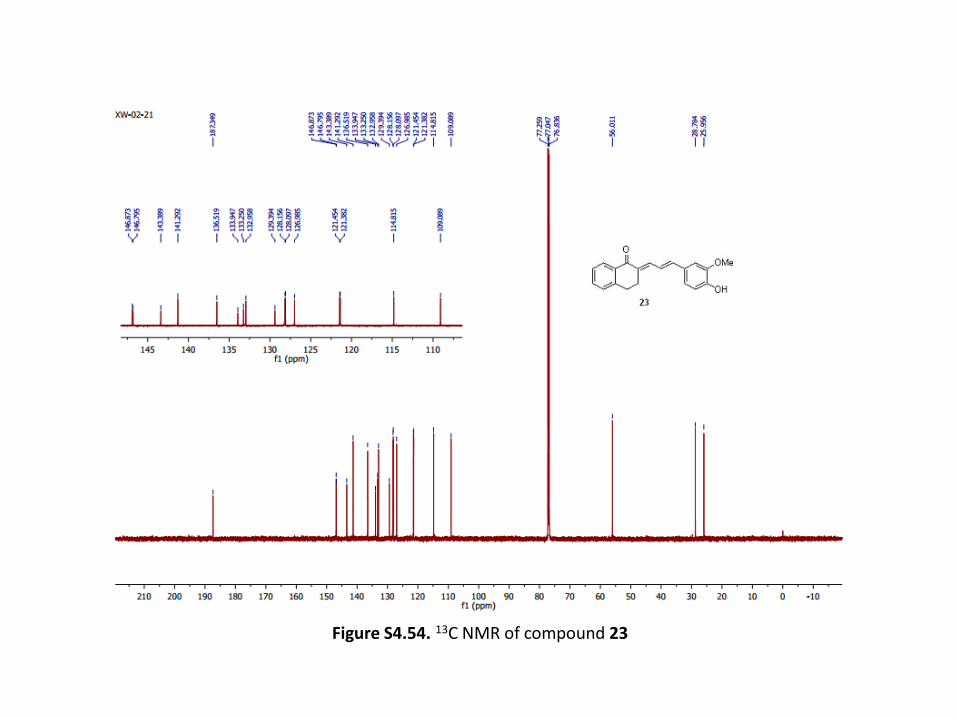
Figure S4.54. 13C NMR of compound 23
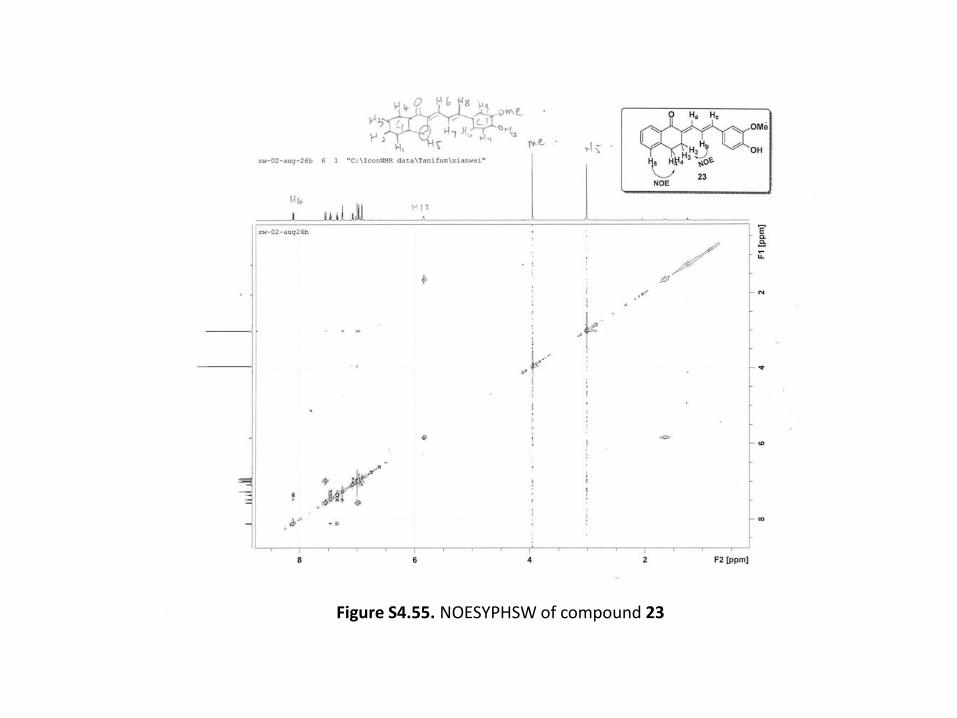
Figure S4.55. NOESYPHSW of compound 23
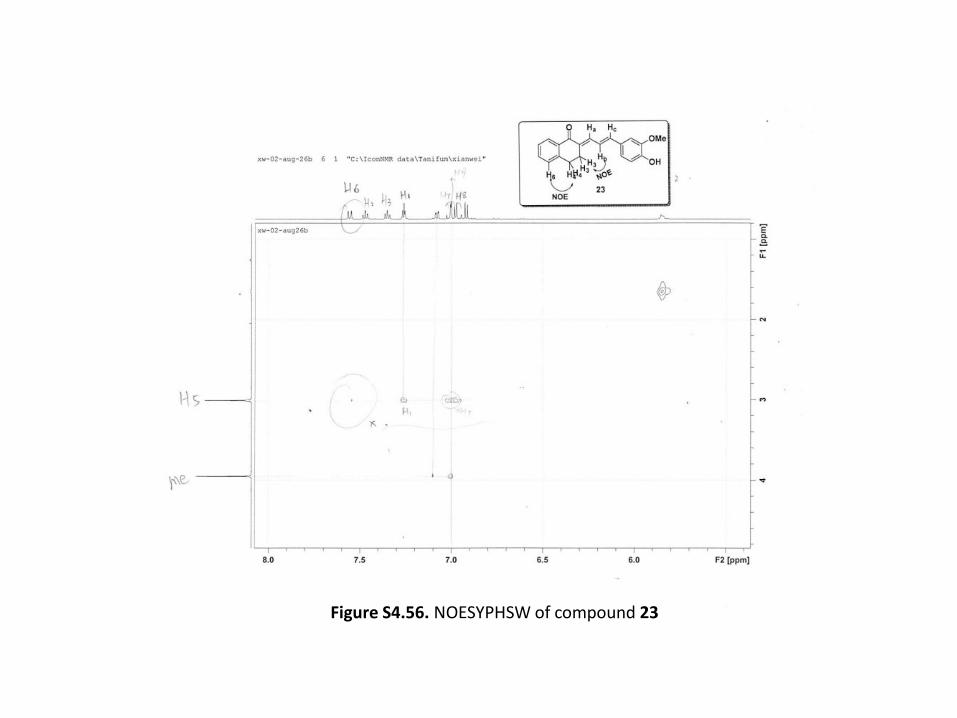
Figure S4.56. NOESYPHSW of compound 23
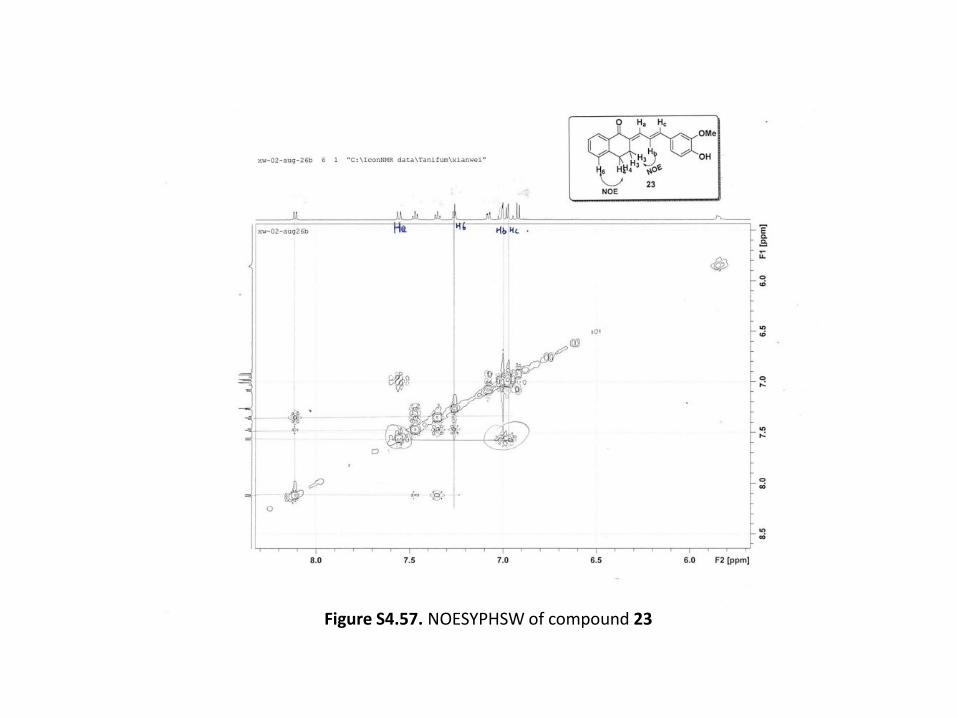
Figure S4.57. NOESYPHSW of compound 23
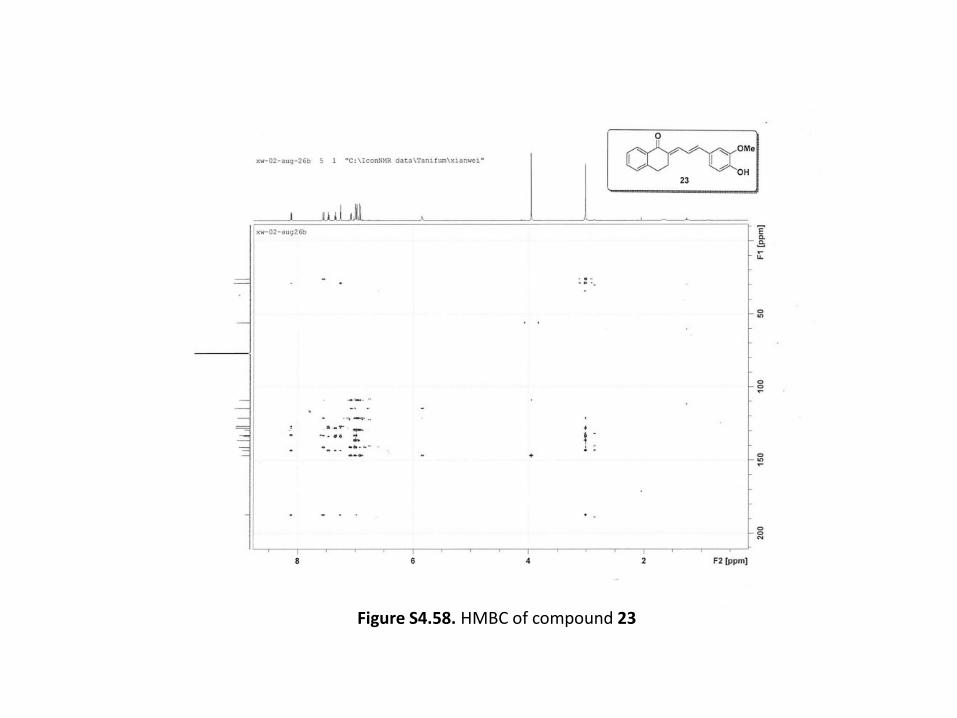
Figure S4.58. HMBC of compound 23
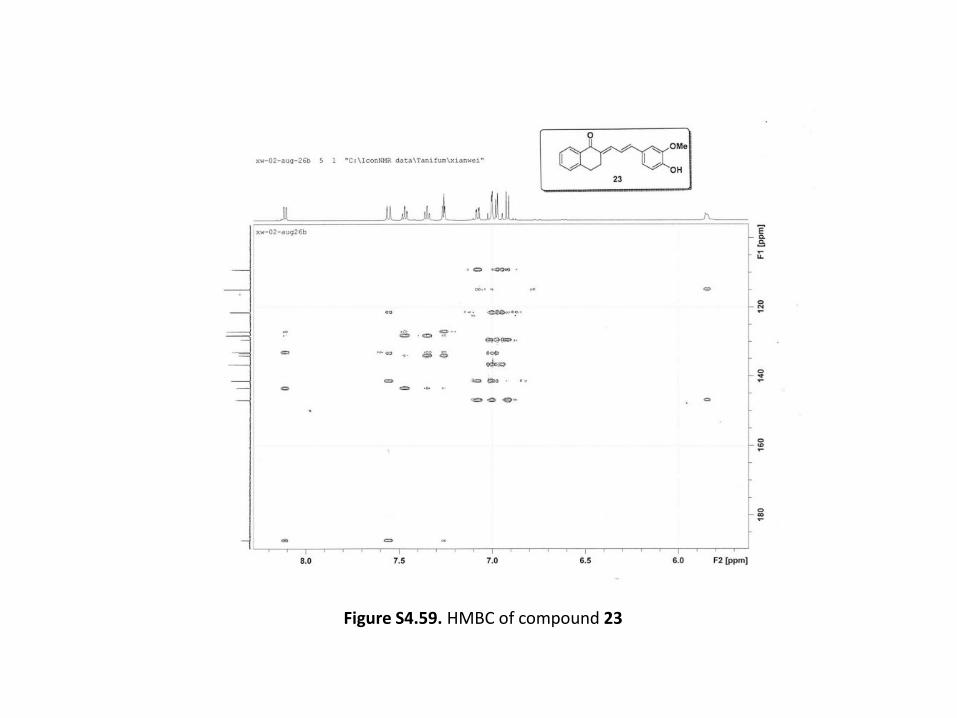
Figure S4.59. HMBC of compound 23
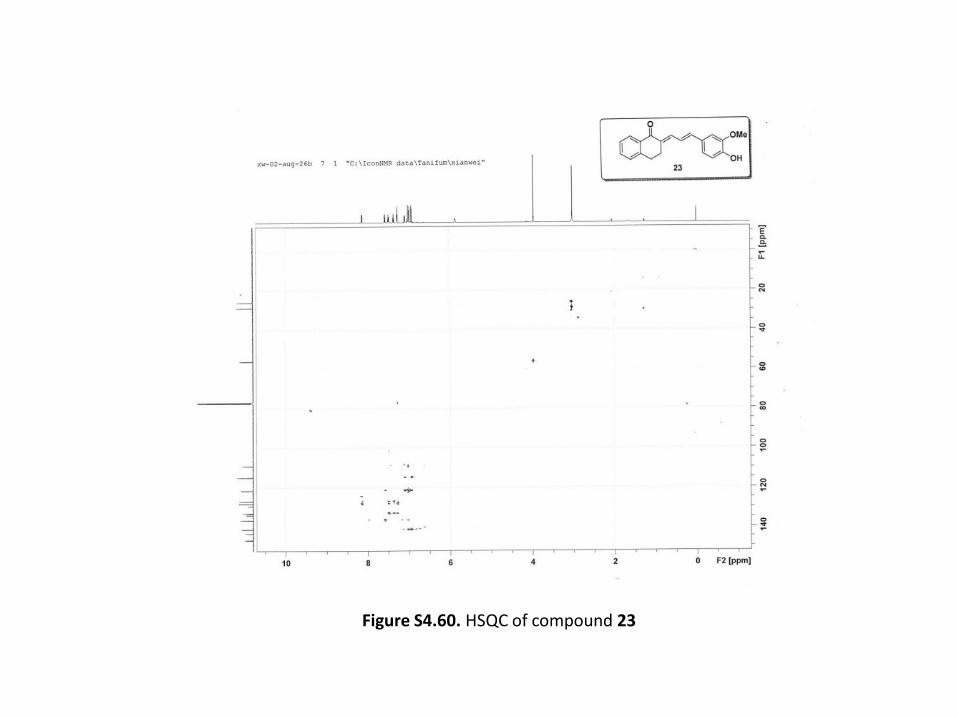
Figure S4.60. HSQC of compound 23
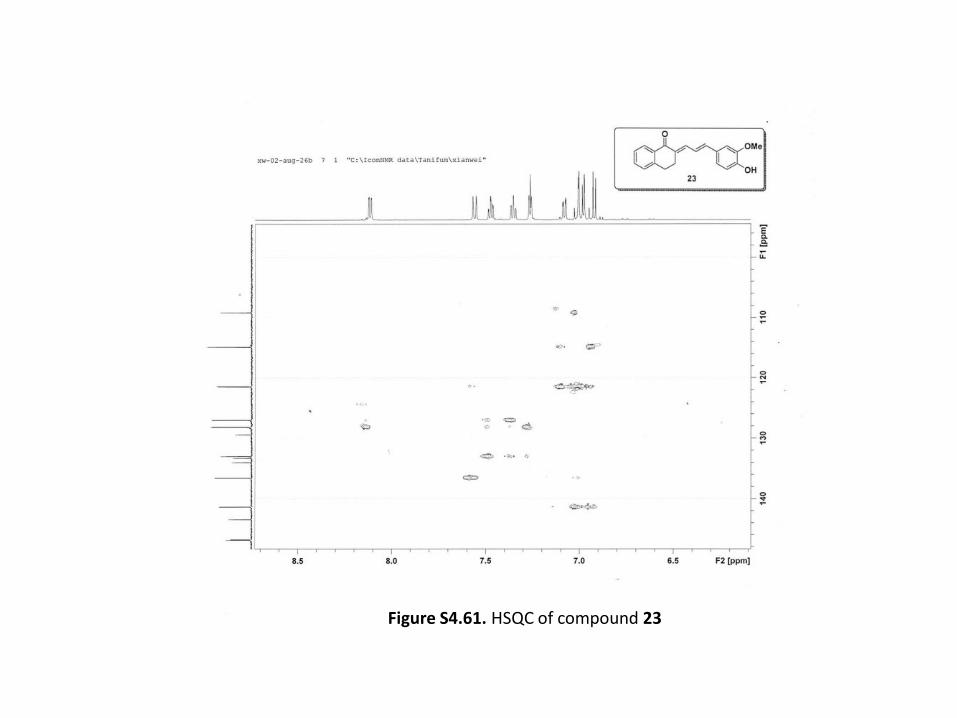
Figure S4.61. HSQC of compound 23
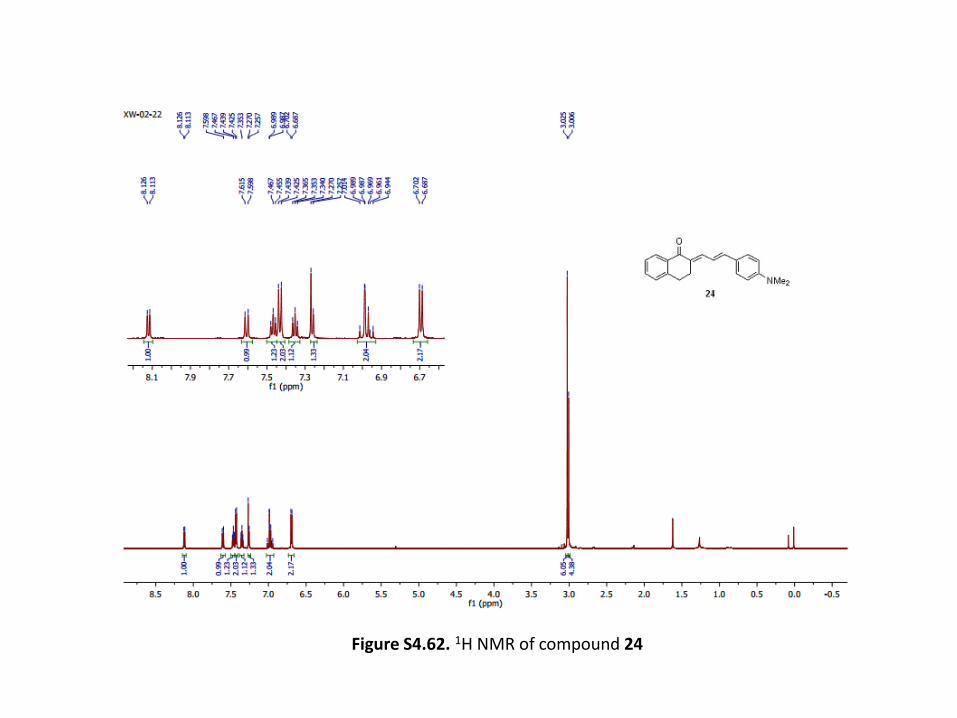
Figure S4.62. 1H NMR of compound 24
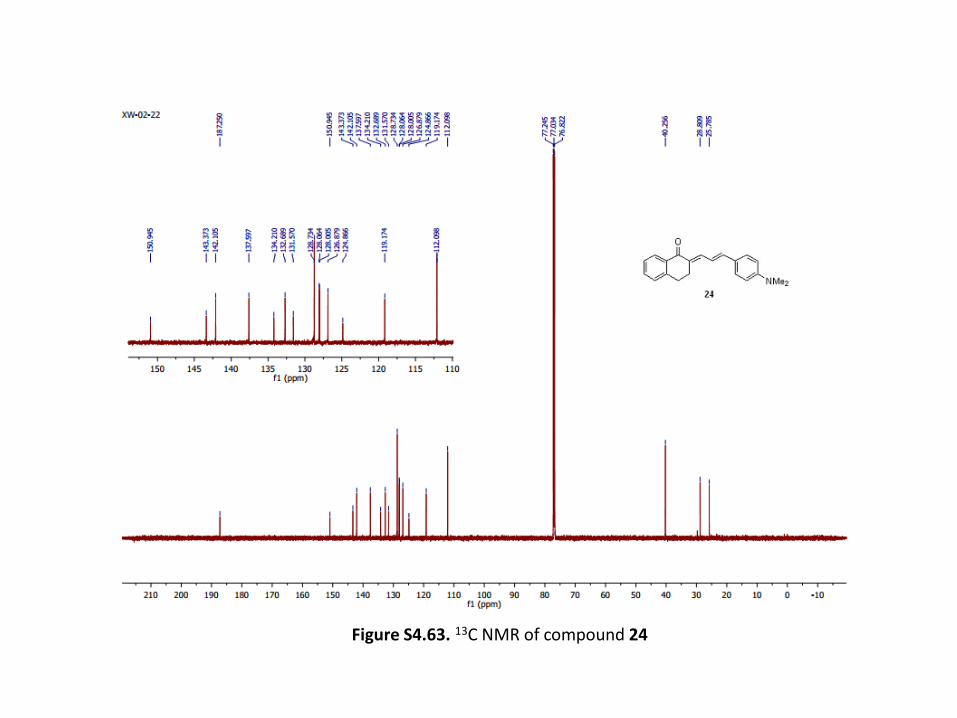
Figure S4.63. 13C NMR of compound 24
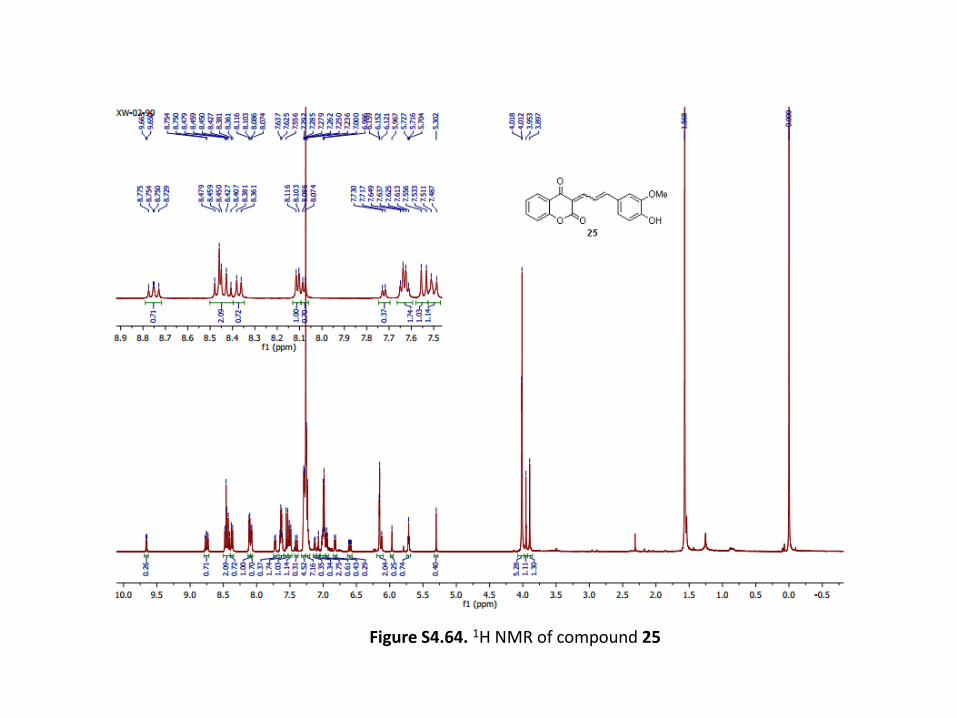
Figure S4.64. 1H NMR of compound 25
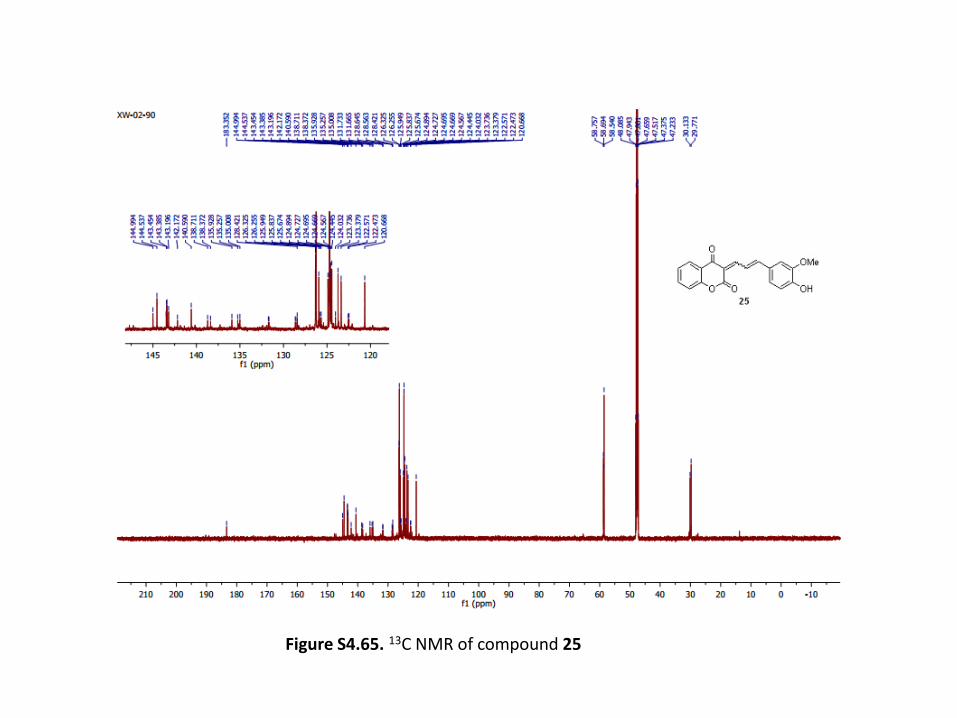
Figure S4.65. 13C NMR of compound 25
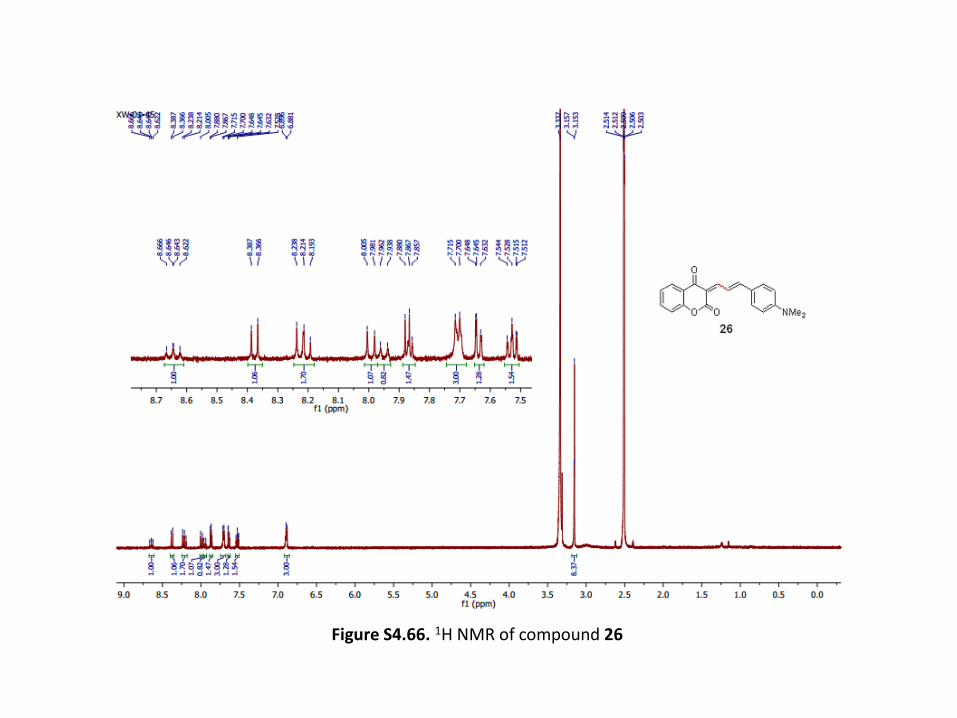
Figure S4.66. 1H NMR of compound 26
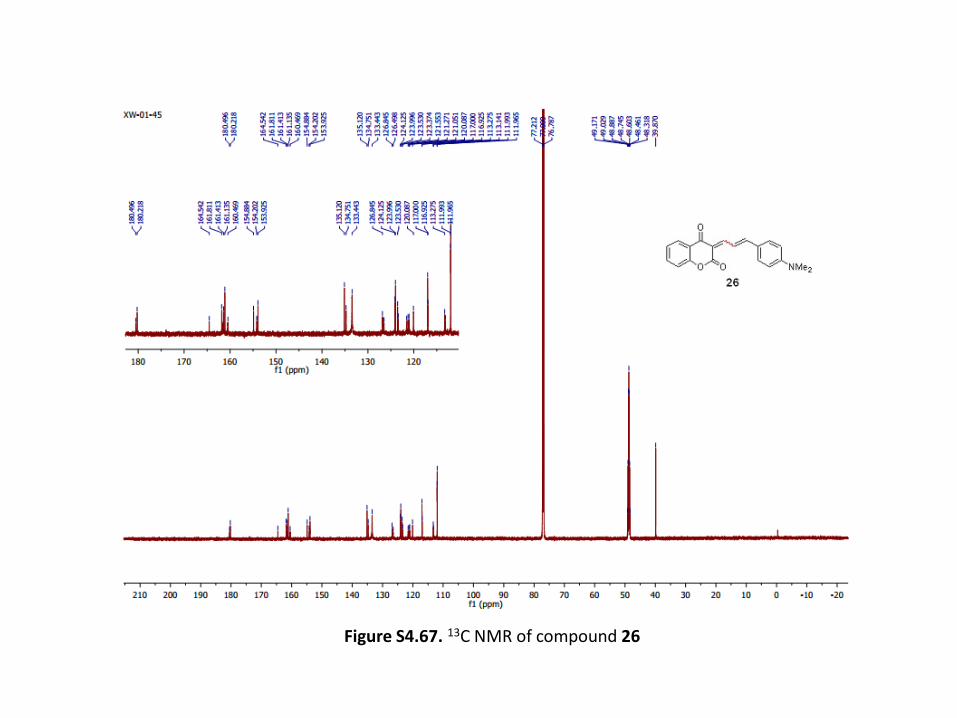
Figure S4.67. 13C NMR of compound 26
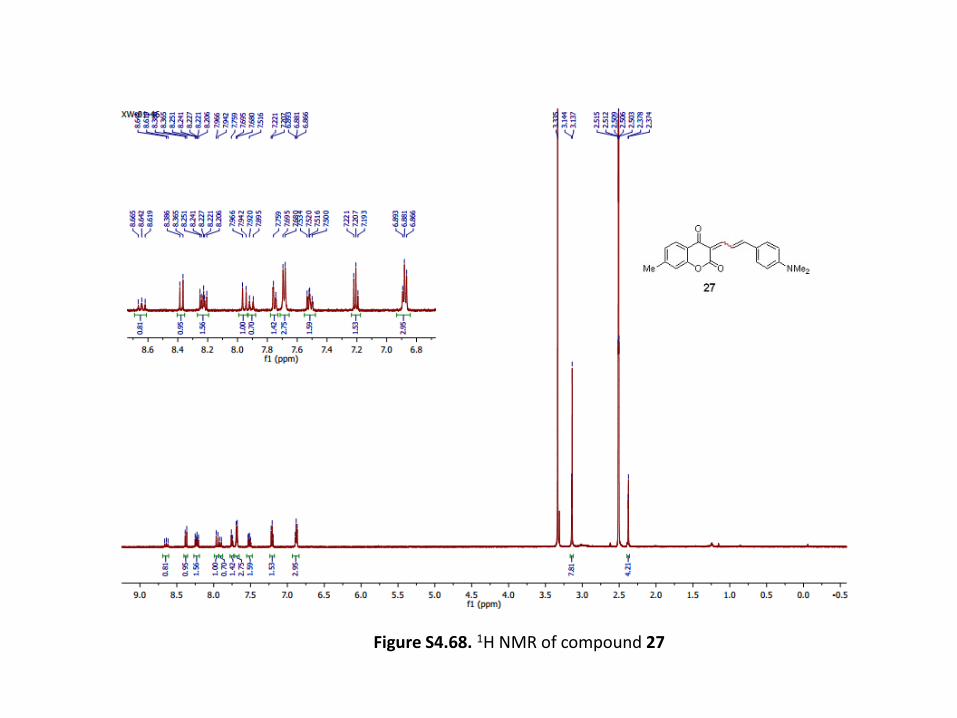
Figure S4.68. 1H NMR of compound 27
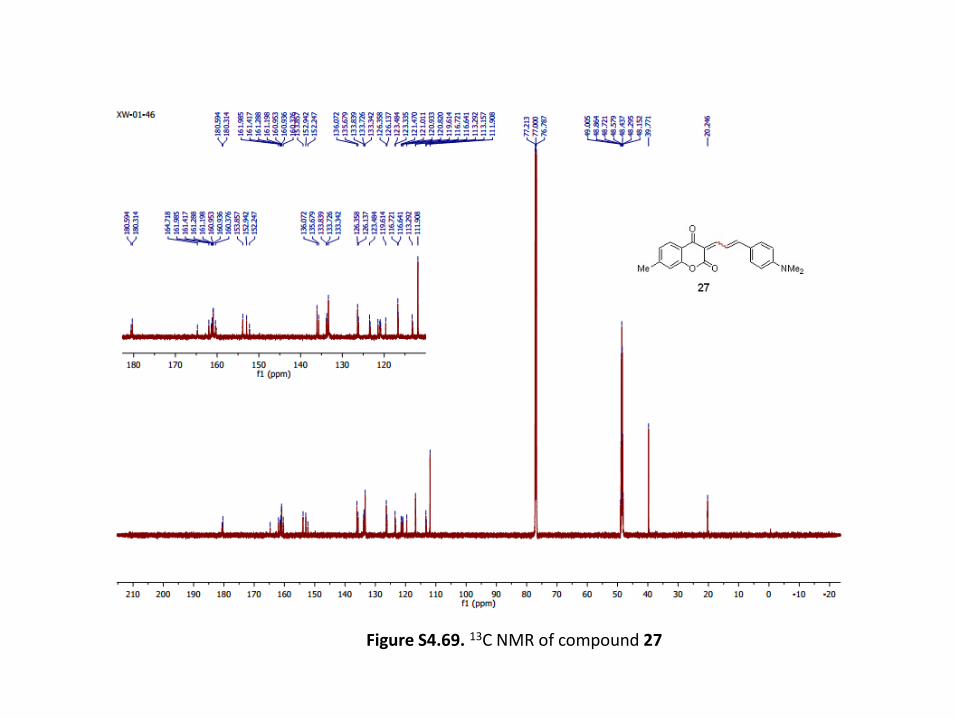
Figure S4.69. 13C NMR of compound 27
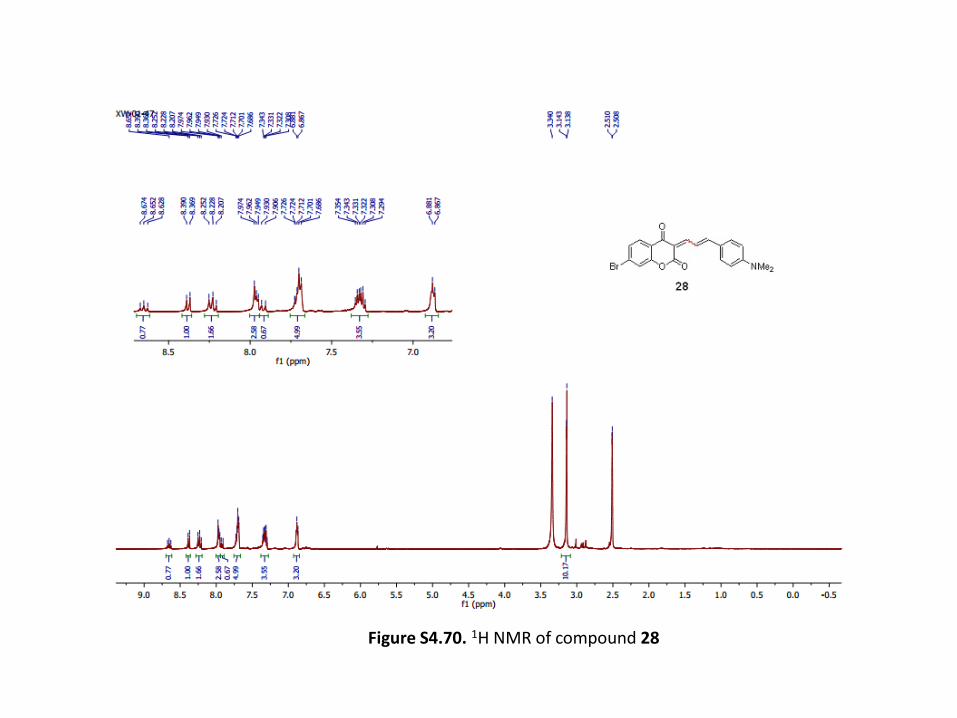
Figure S4.70. 1H NMR of compound 28
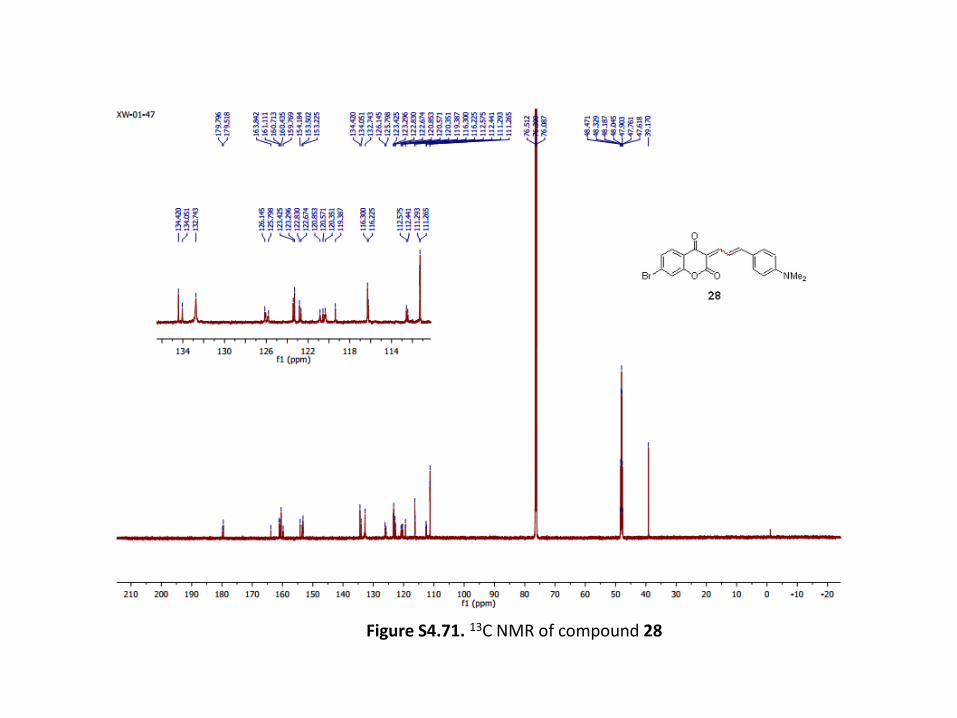
Figure S4.71. 13C NMR of compound 28
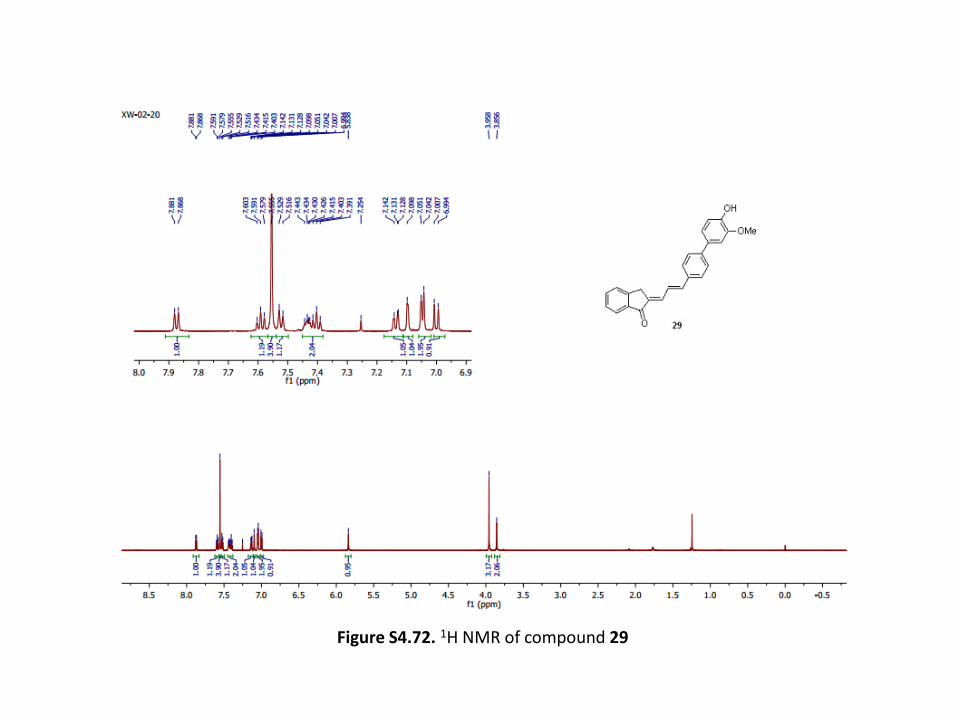
Figure S4.72. 1H NMR of compound 29
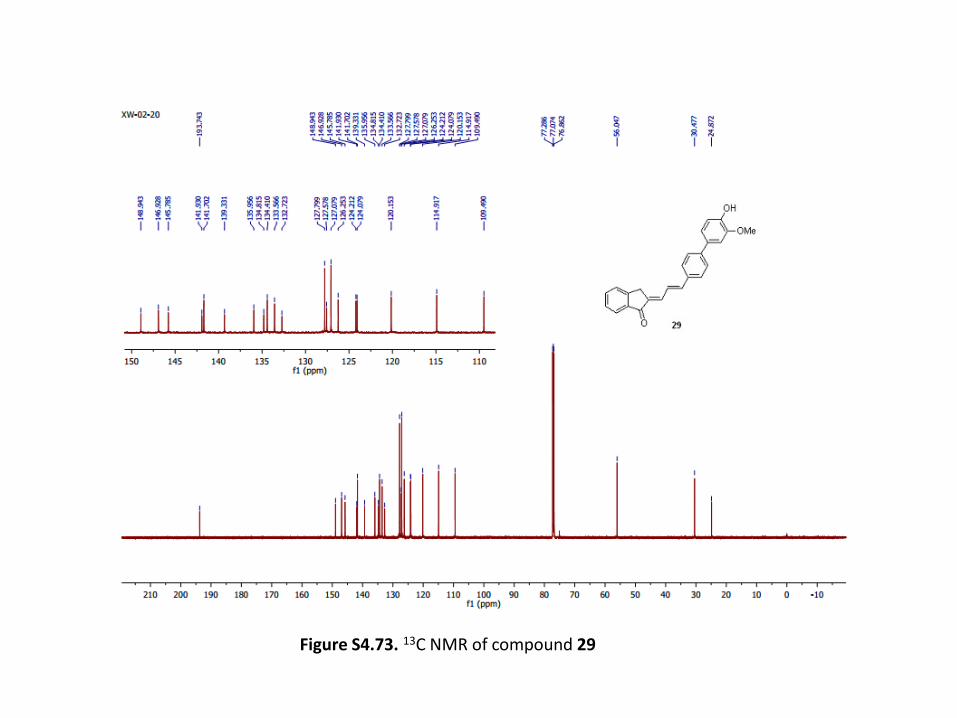
Figure S4.73. 13C NMR of compound 29
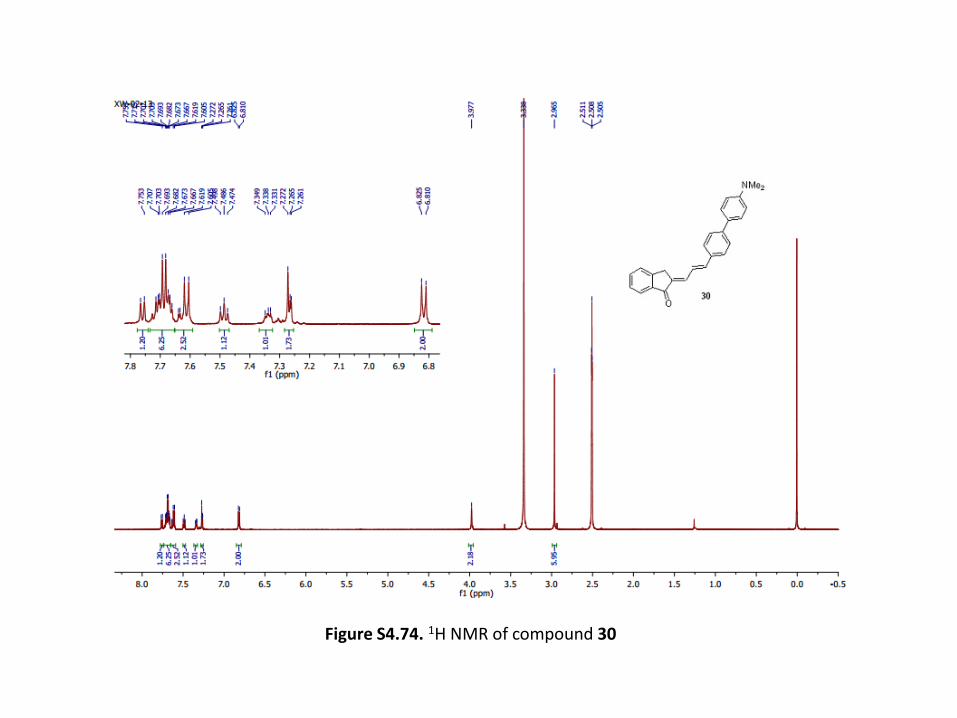
Figure S4.74. 1H NMR of compound 30
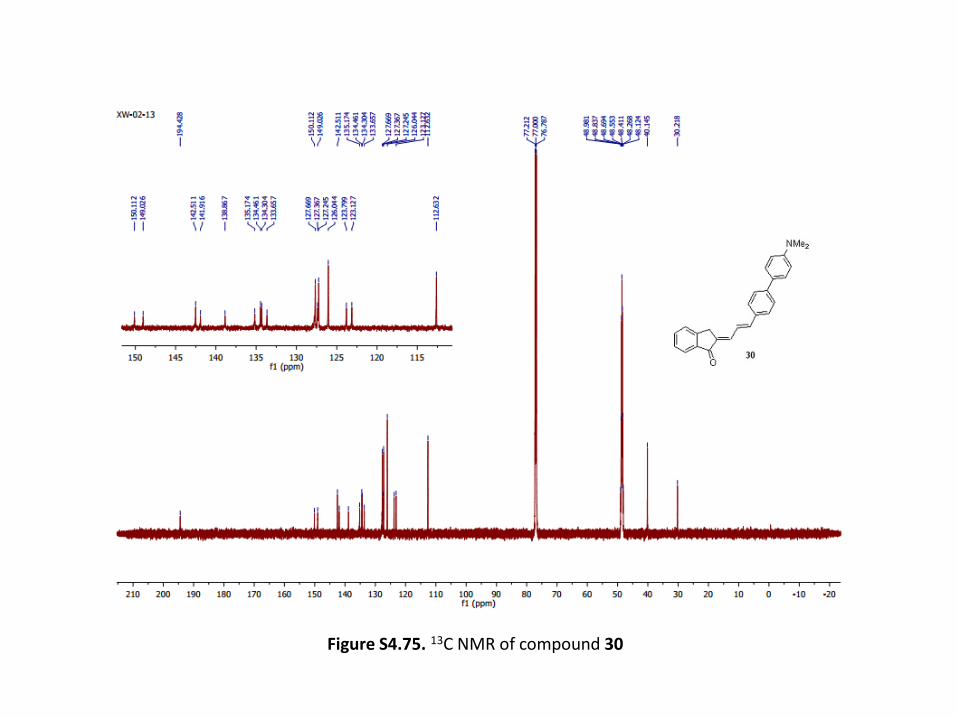
Figure S4.75. 13C NMR of compound 30
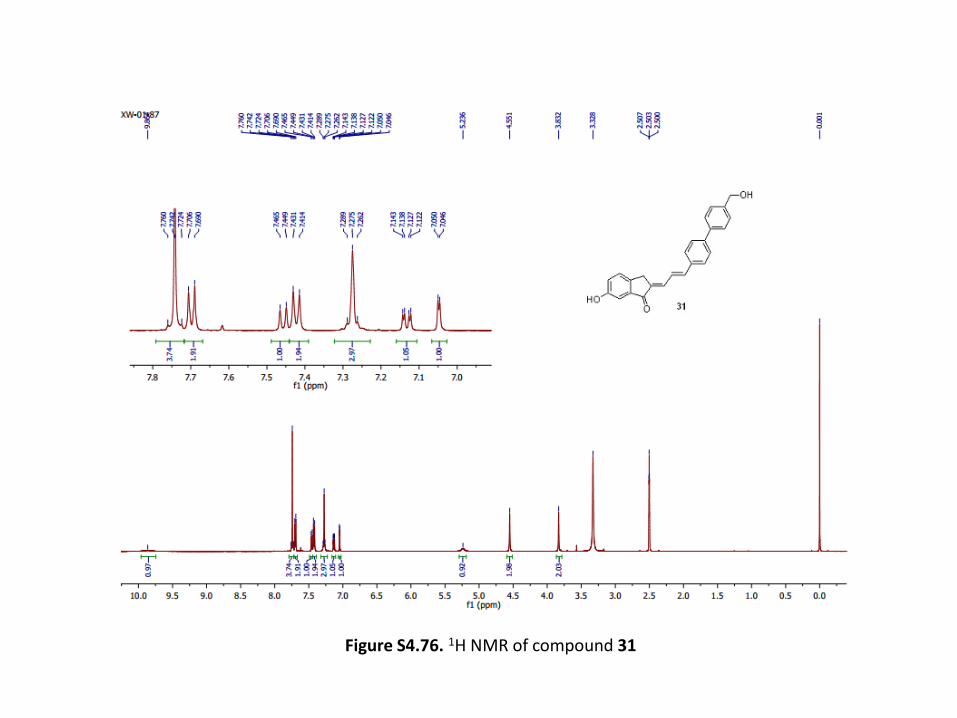
Figure S4.76. 1H NMR of compound 31
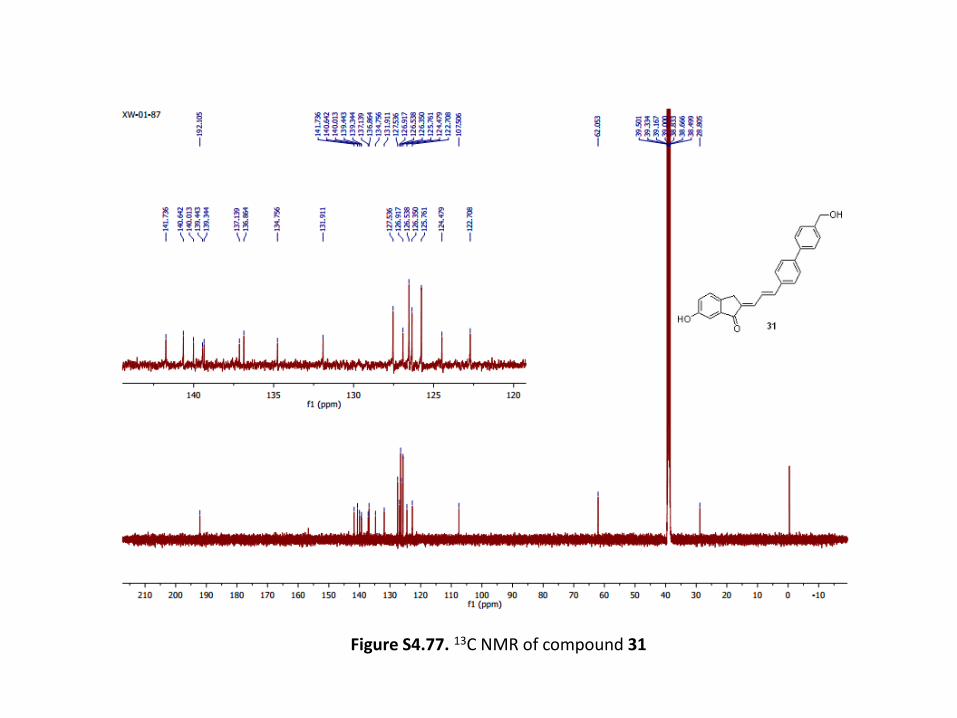
Figure S4.77. 13C NMR of compound 31
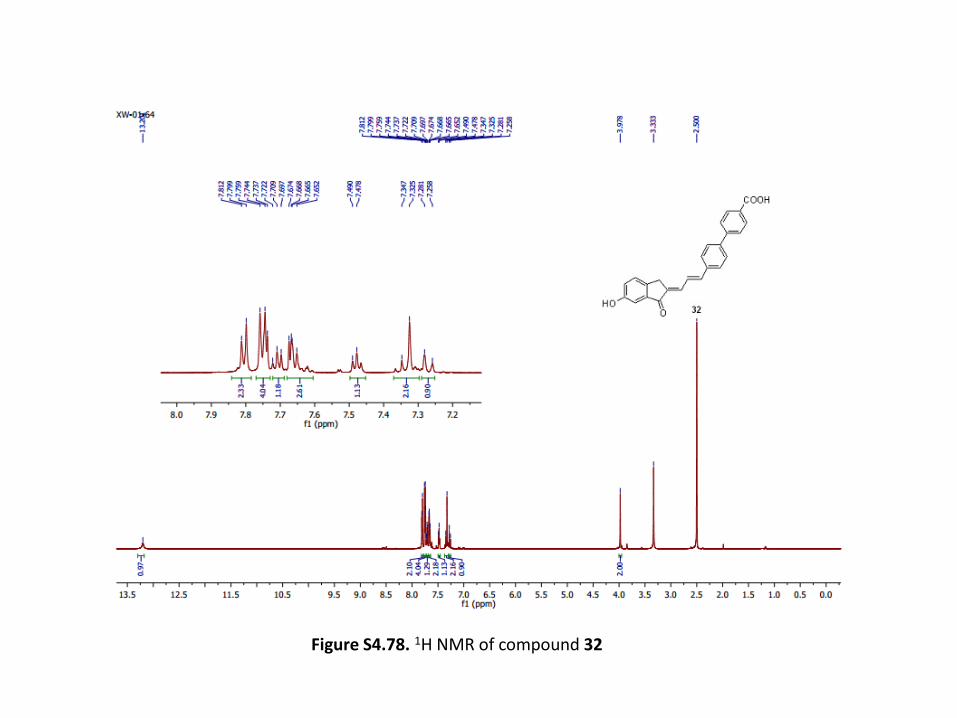
Figure S4.78. 1H NMR of compound 32
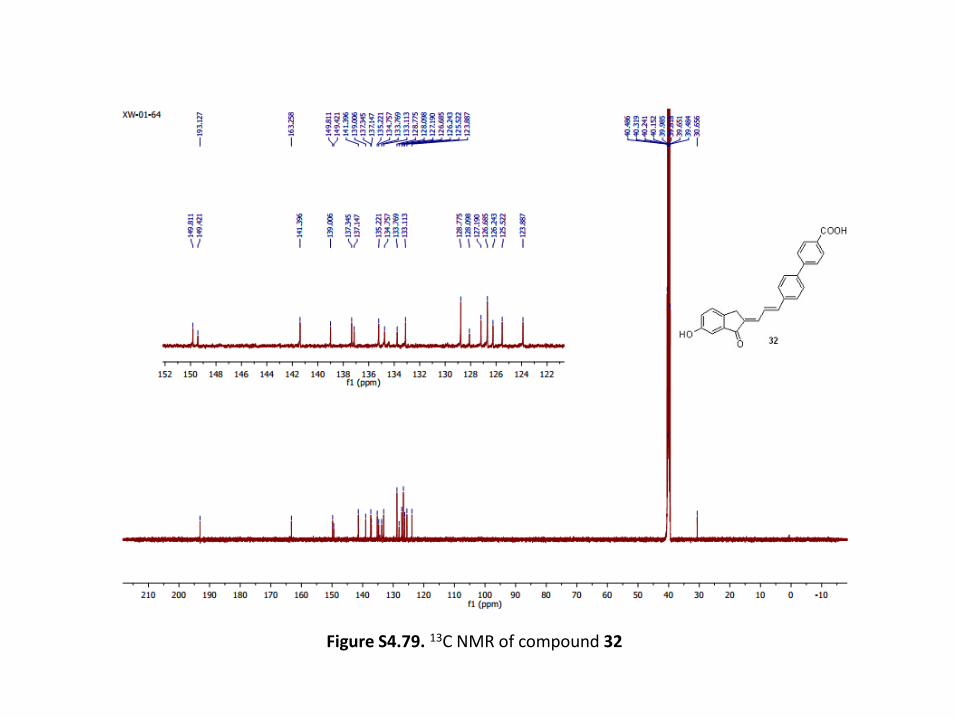
Figure S4.79. 13C NMR of compound 32
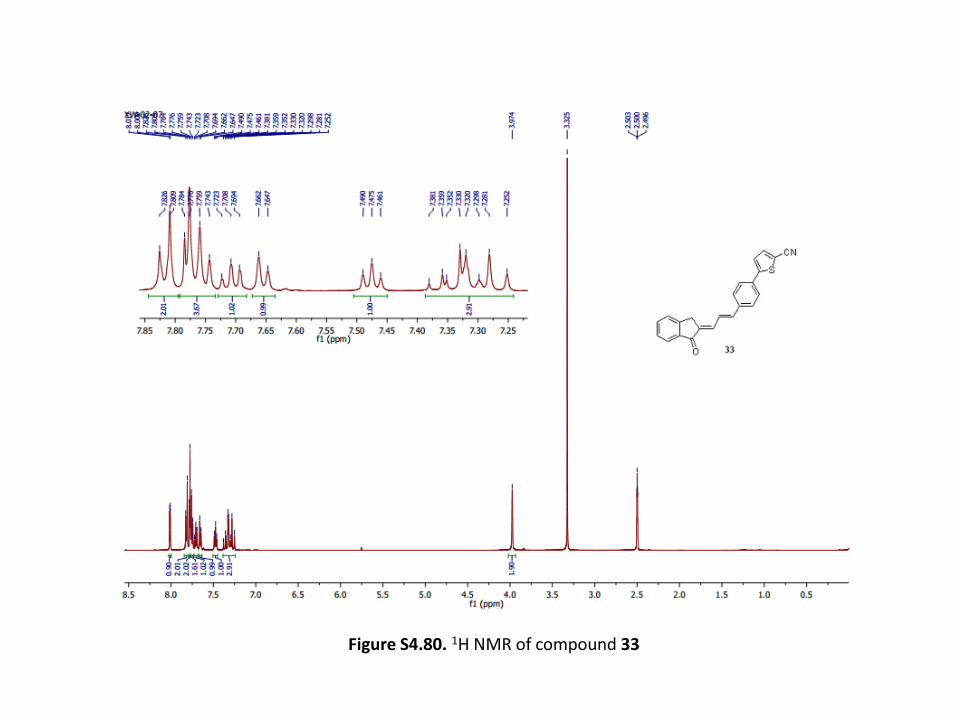
Figure S4.80. 1H NMR of compound 33
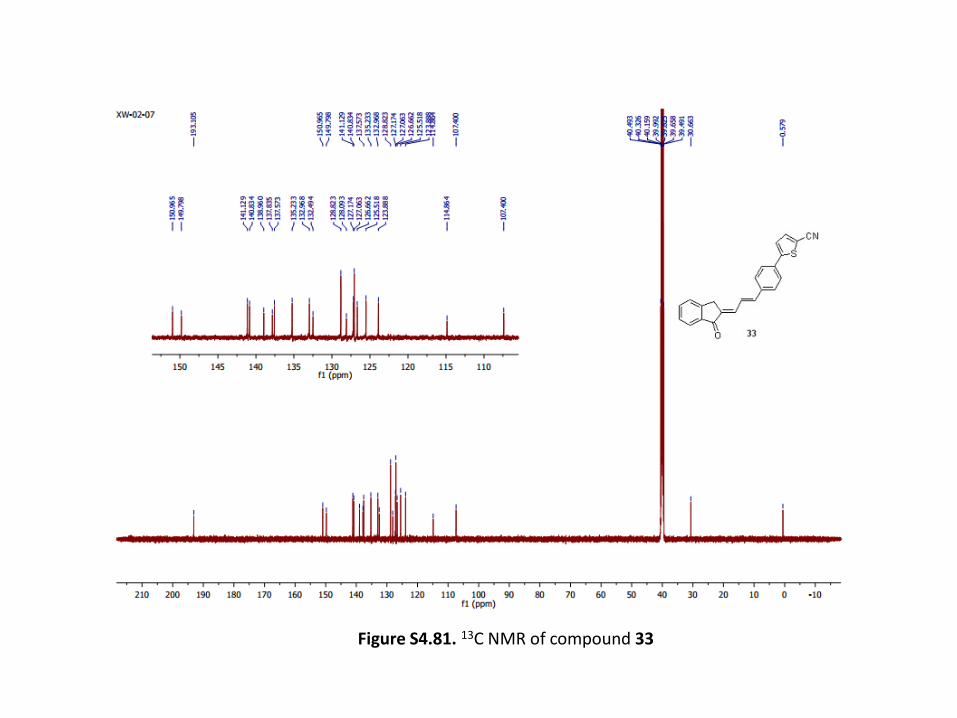
Figure S4.81. 13C NMR of compound 33
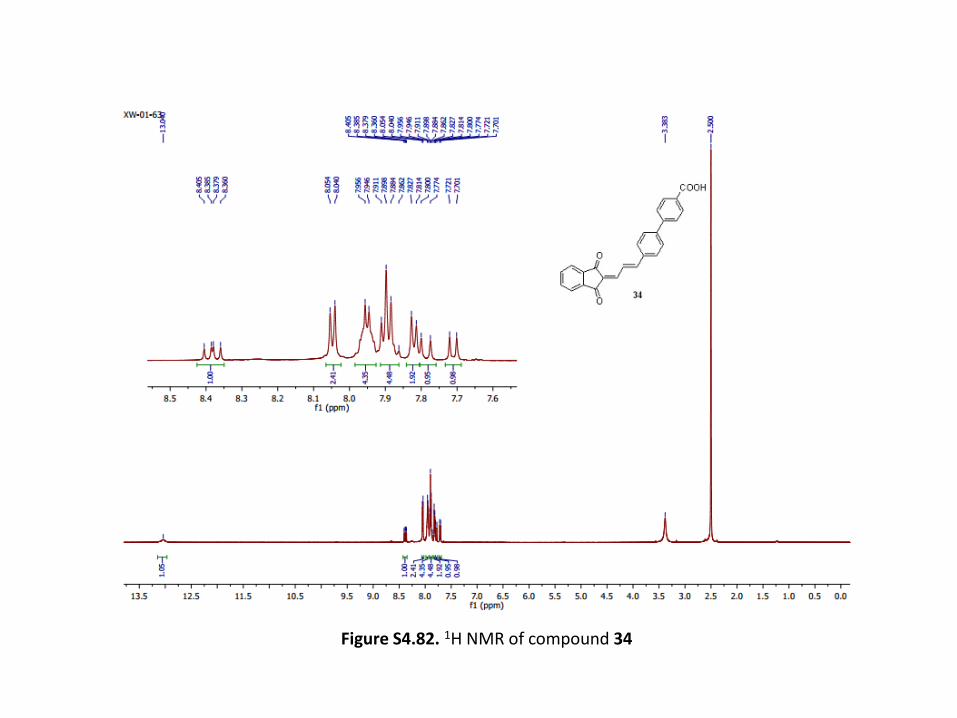
Figure S4.82. 1H NMR of compound 34
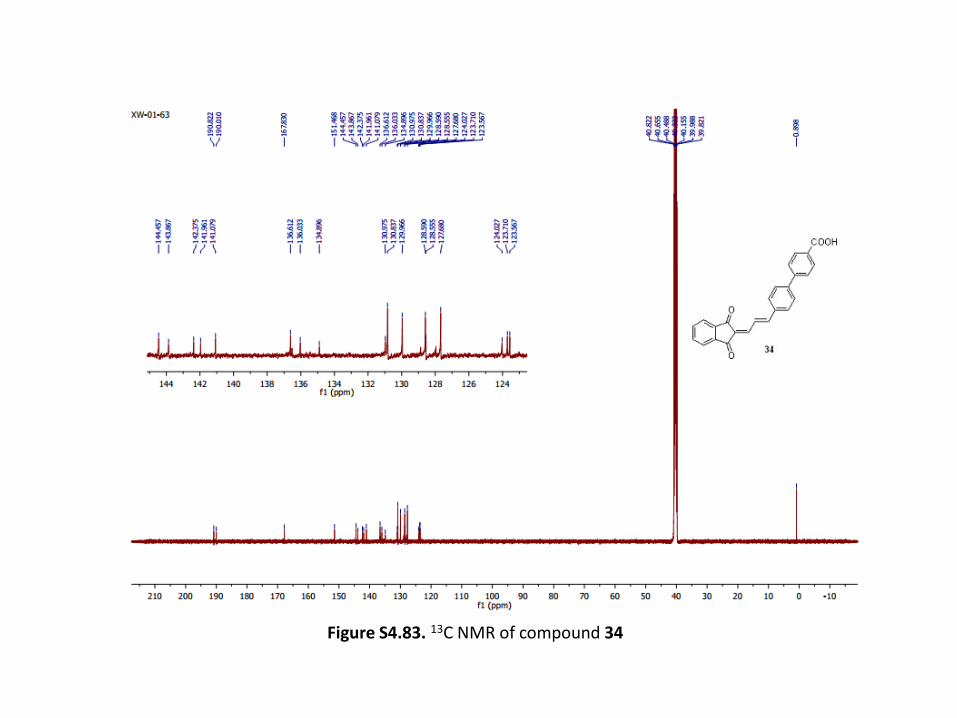
Figure S4.83. 13C NMR of compound 34
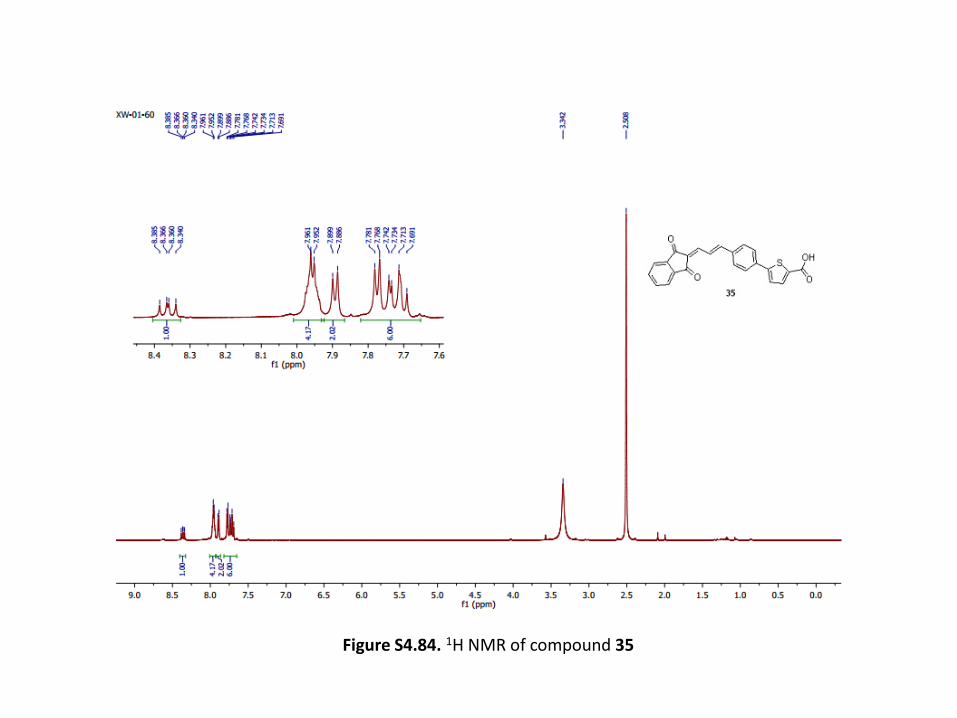
Figure S4.84. 1H NMR of compound 35
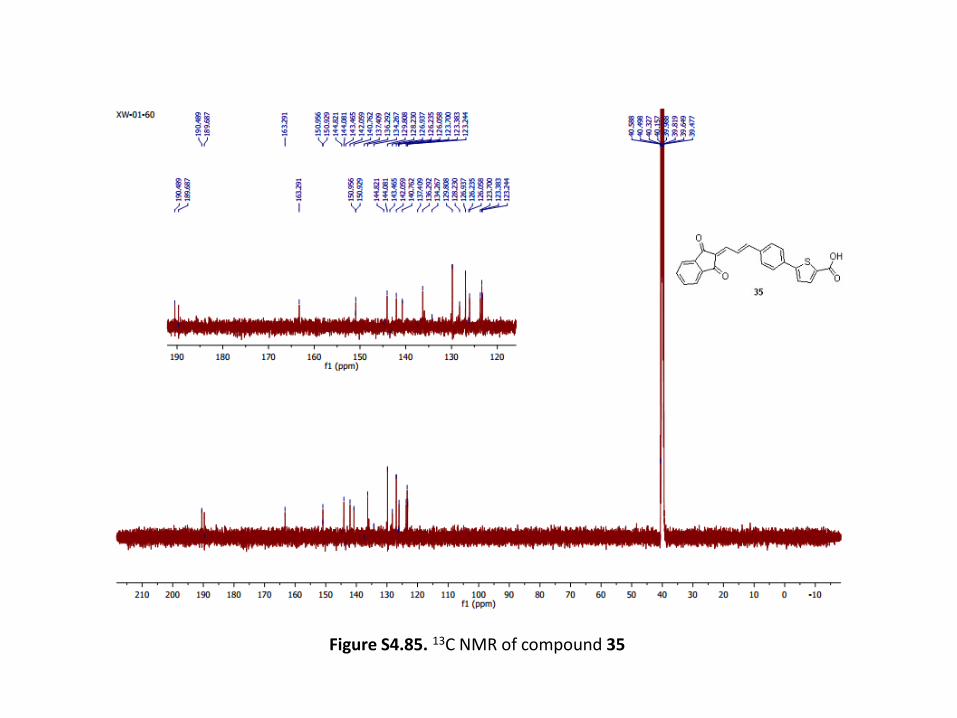
Figure S4.85. 13C NMR of compound 35
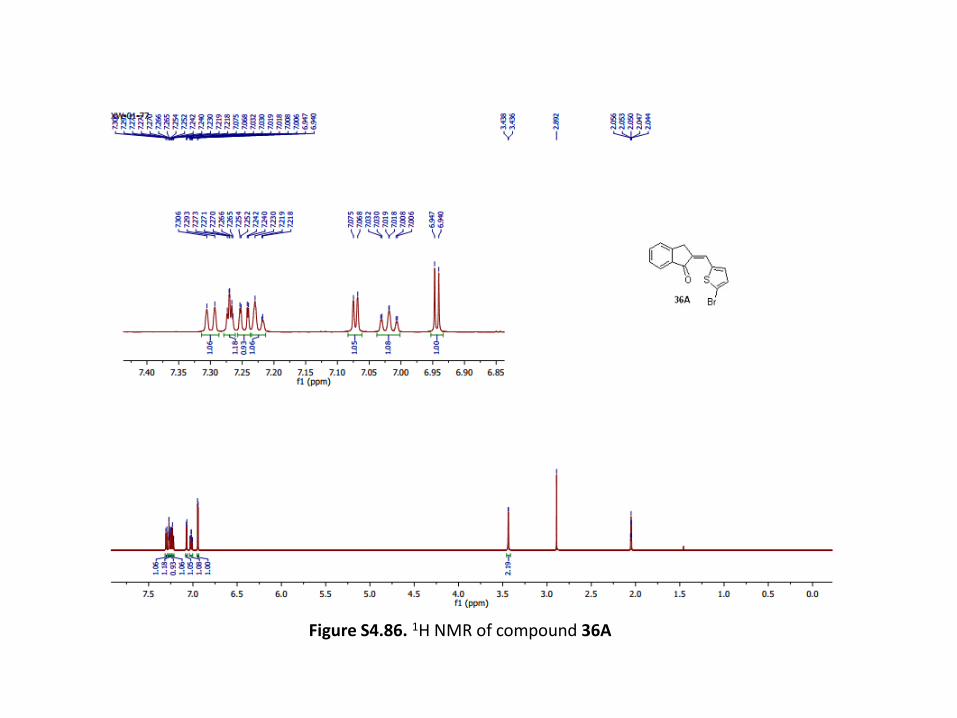
Figure S4.86. 1H NMR of compound 36A
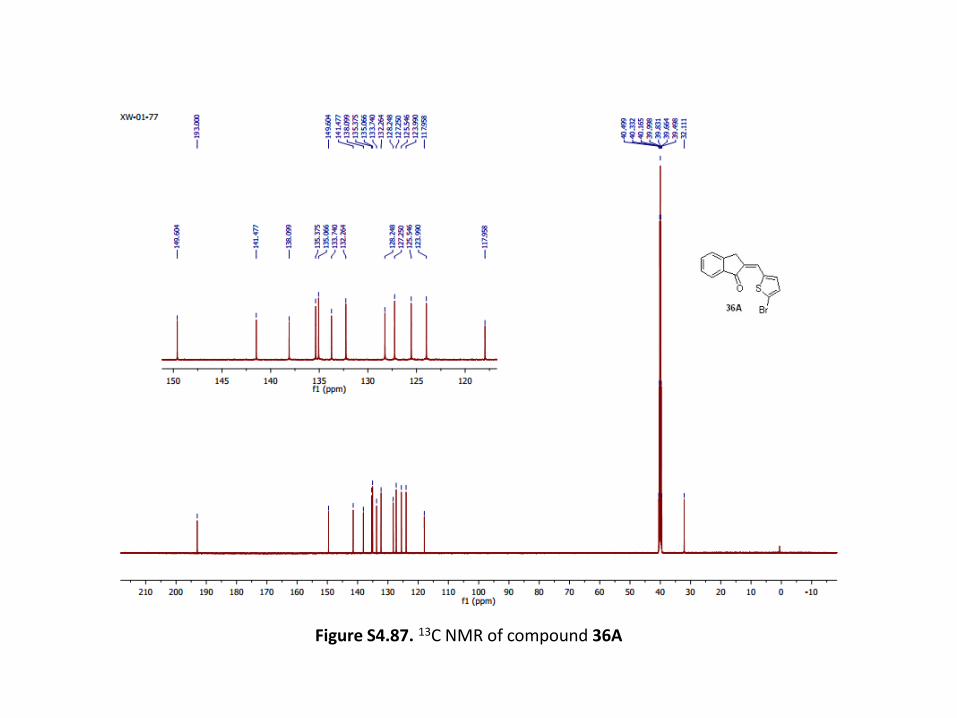
Figure S4.87. 13C NMR of compound 36A
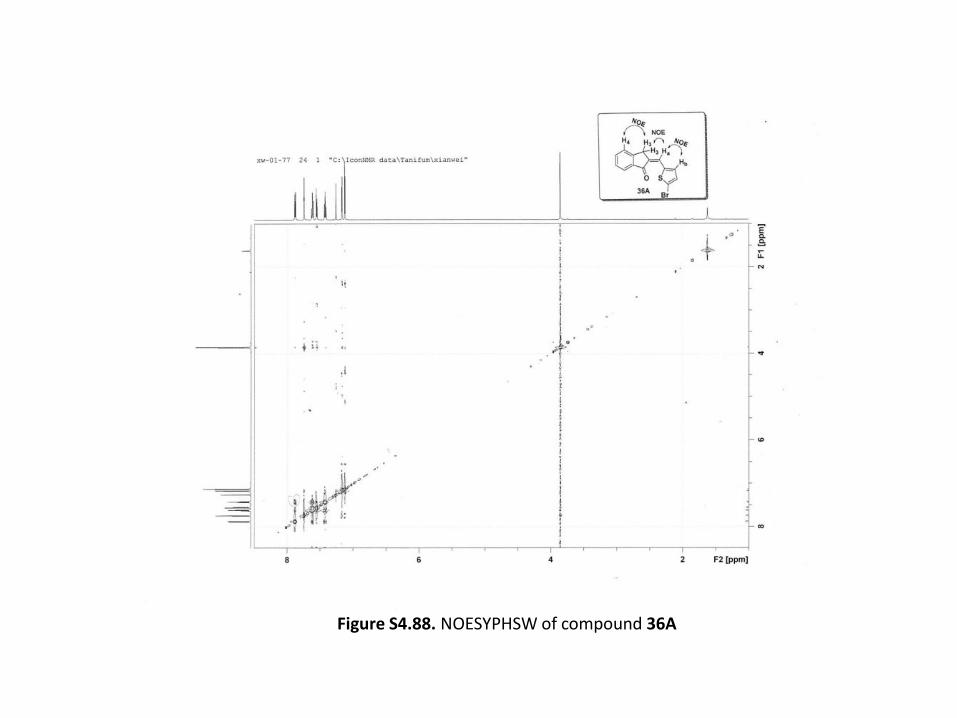
Figure S4.88. NOESYPHSW of compound 36A
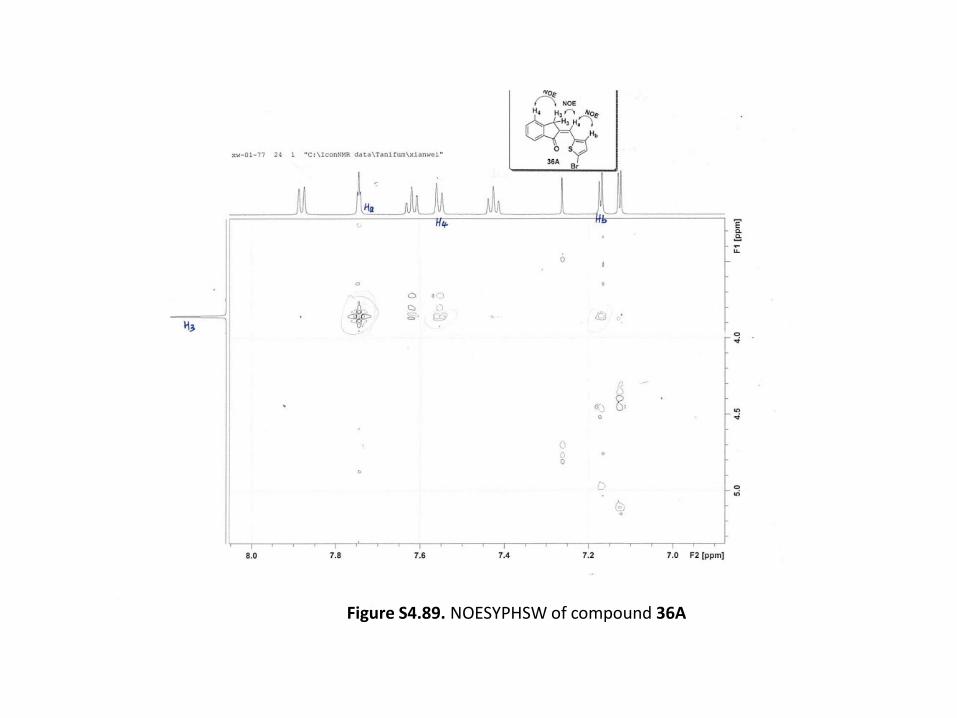
Figure S4.89. NOESYPHSW of compound 36A
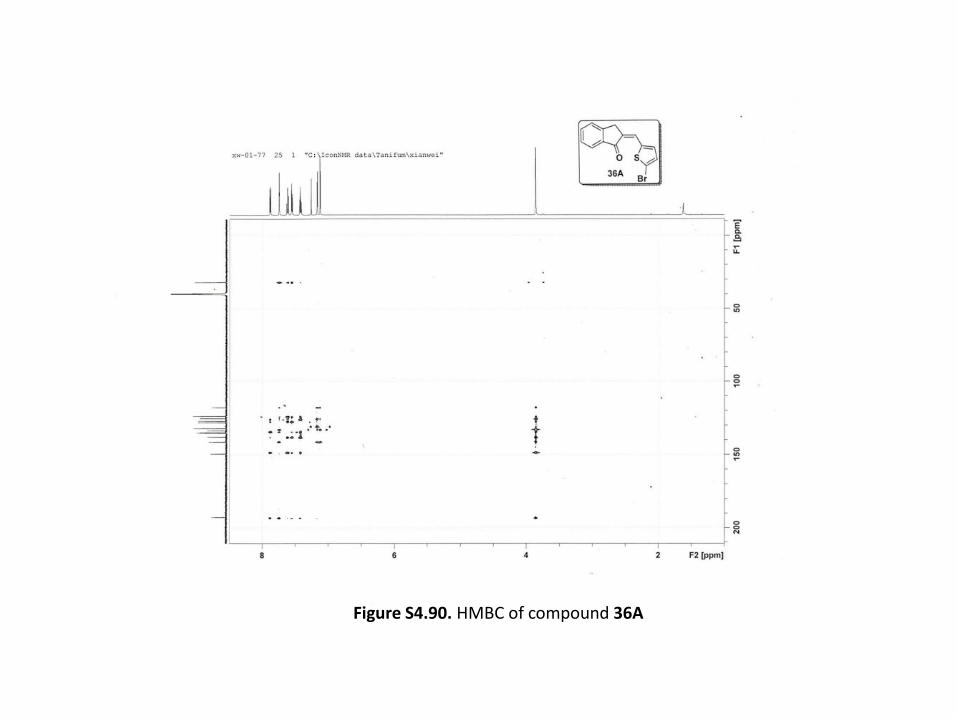
Figure S4.90. HMBC of compound 36A
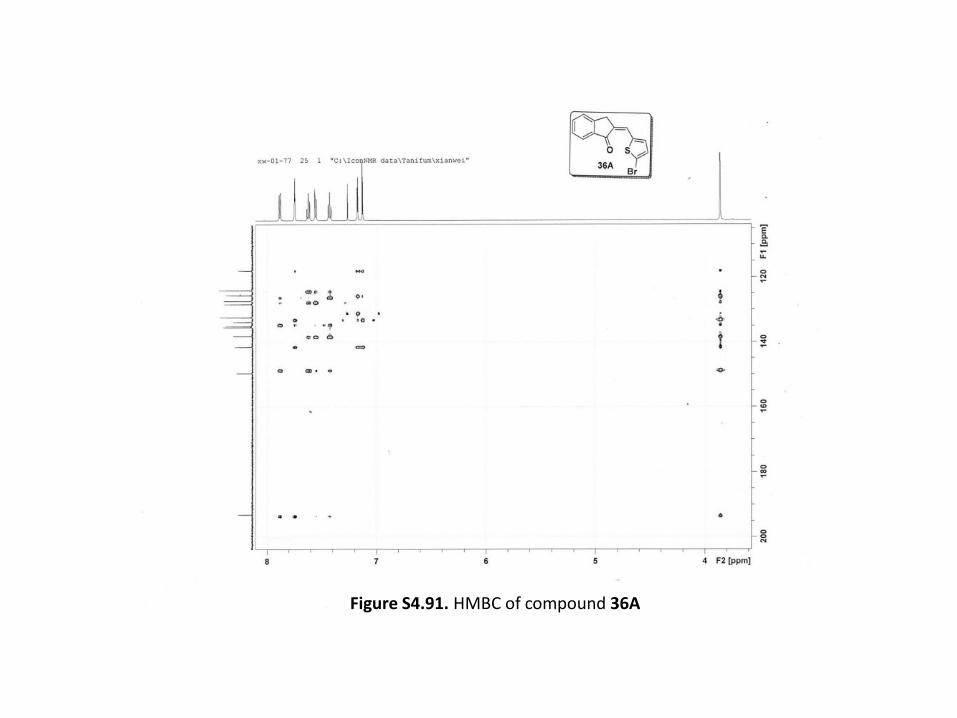
Figure S4.91. HMBC of compound 36A
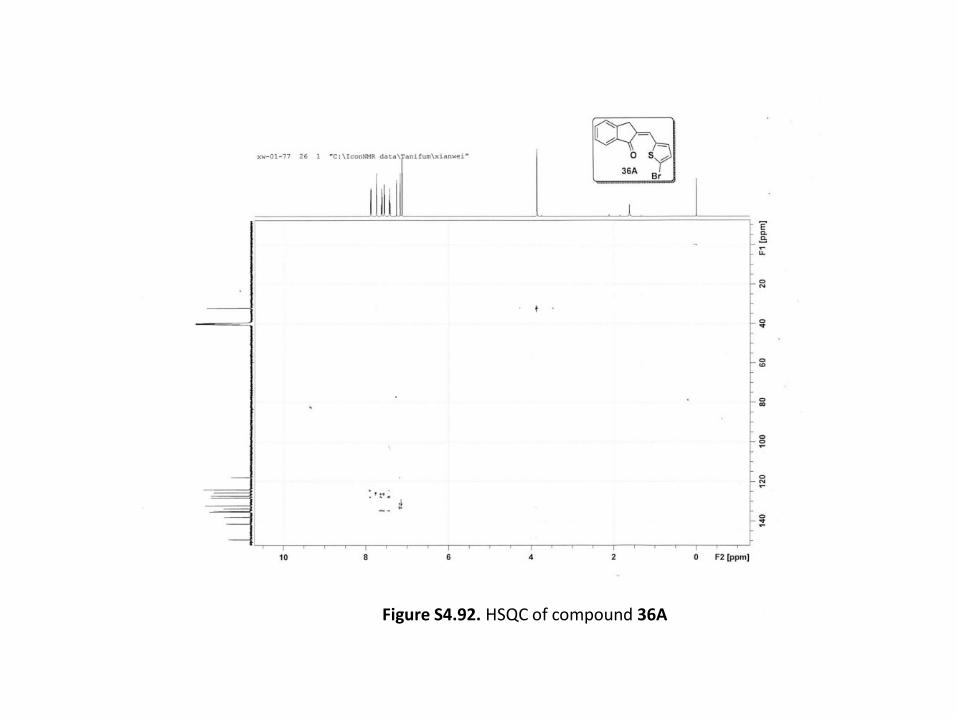
Figure S4.92. HSQC of compound 36A
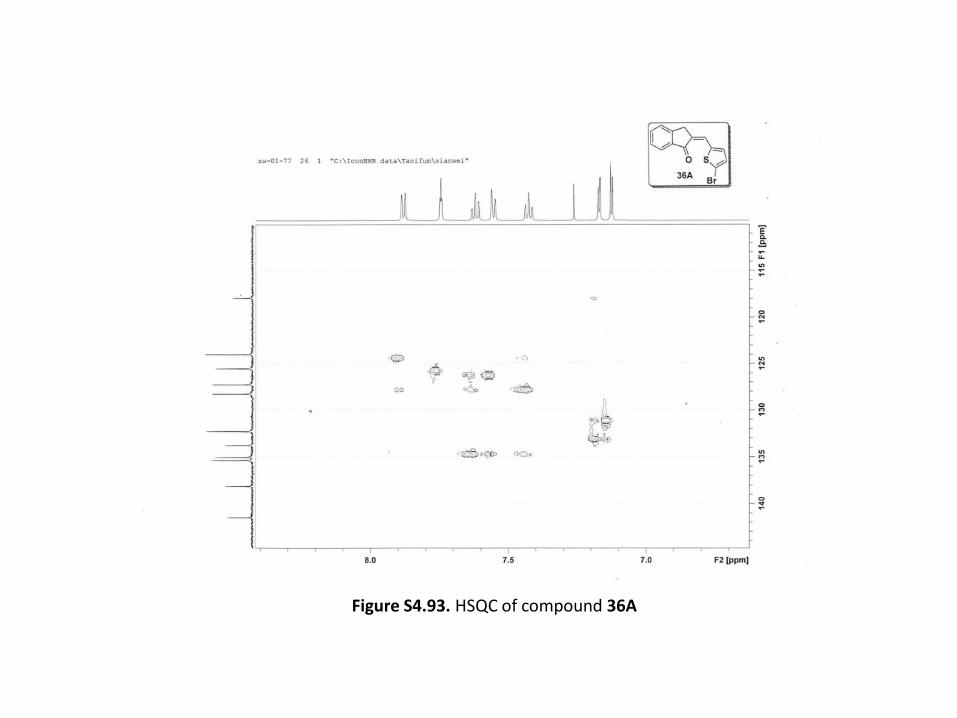
Figure S4.93. HSQC of compound 36A
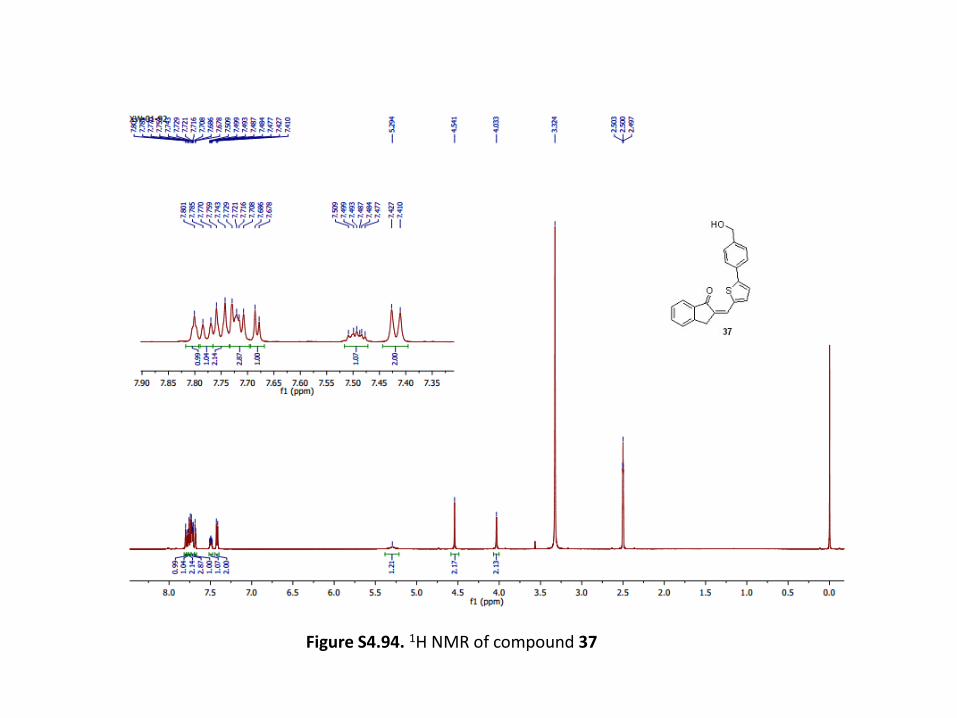
Figure S4.94. 1H NMR of compound 37
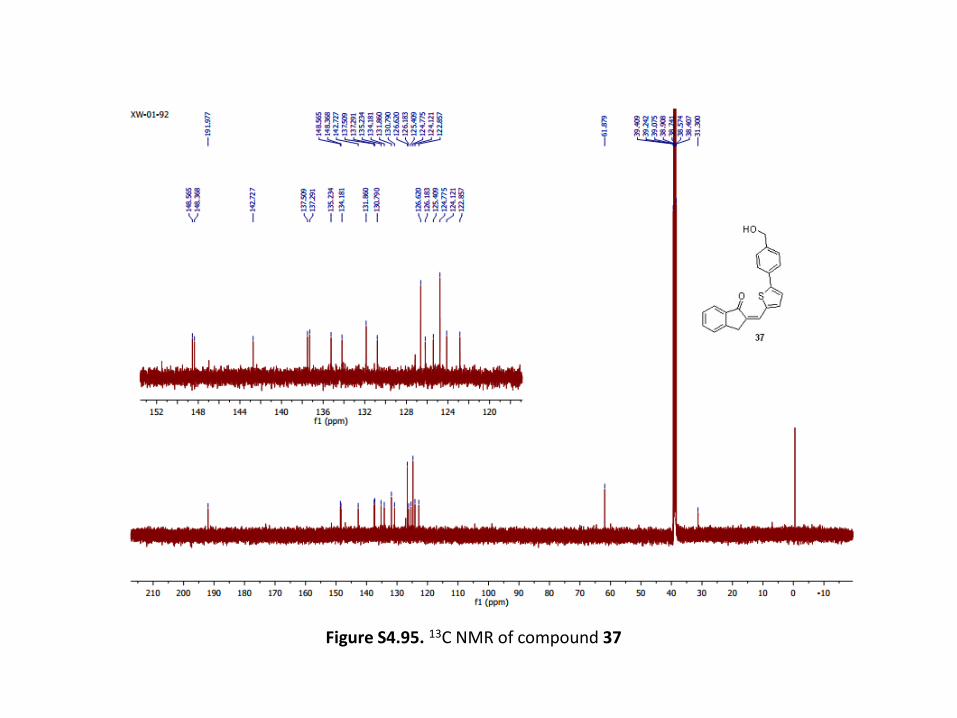
Figure S4.95. 13C NMR of compound 37
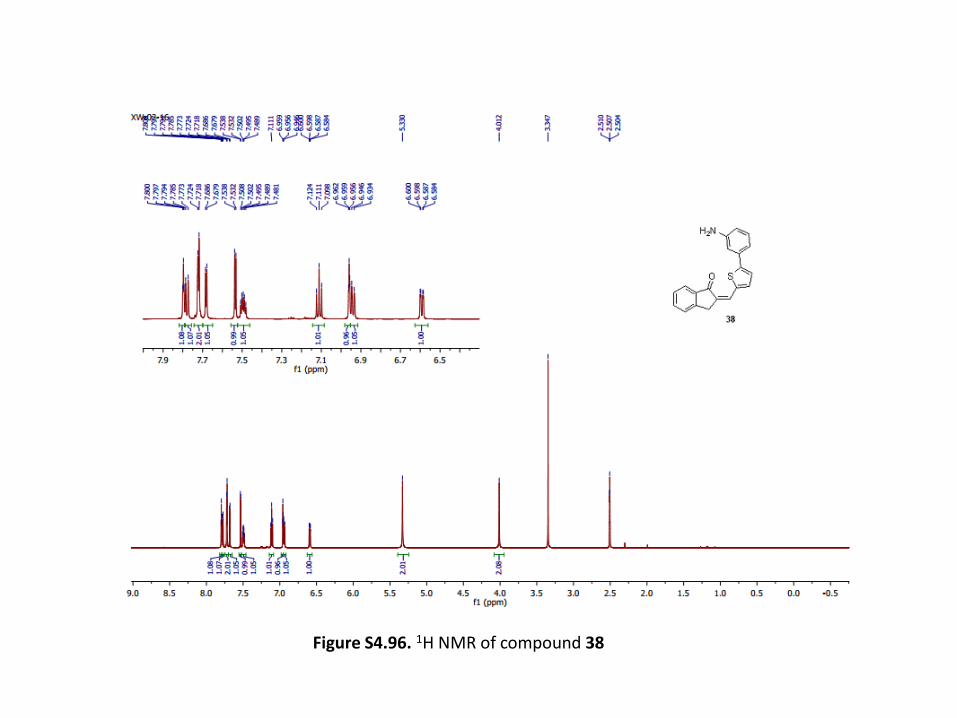
Figure S4.96. 1H NMR of compound 38
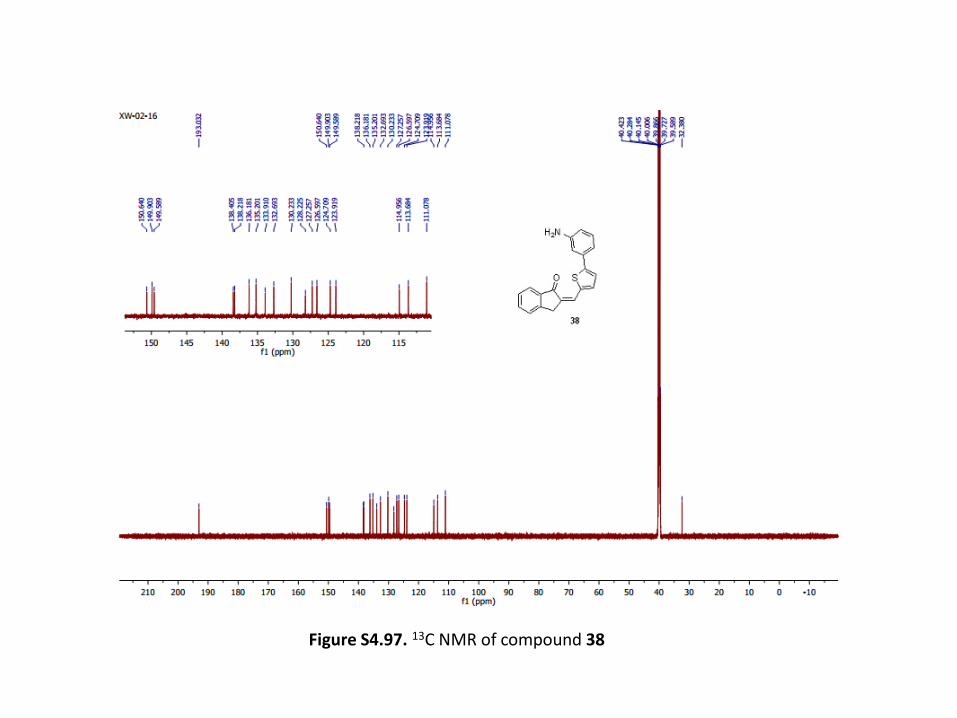
Figure S4.97. 13C NMR of compound 38
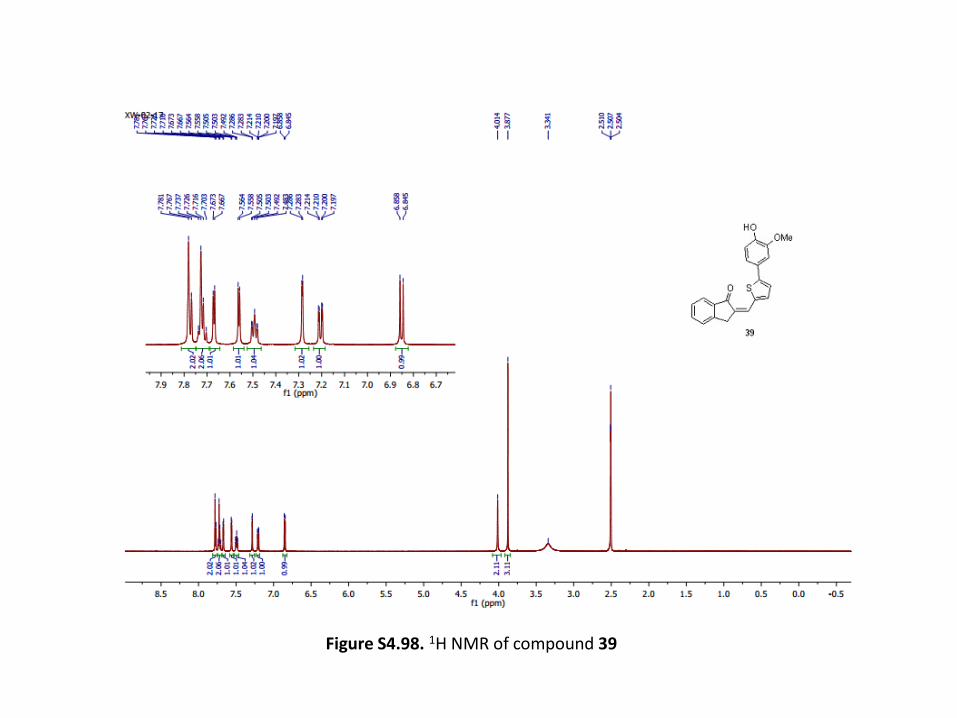
Figure S4.98. 1H NMR of compound 39
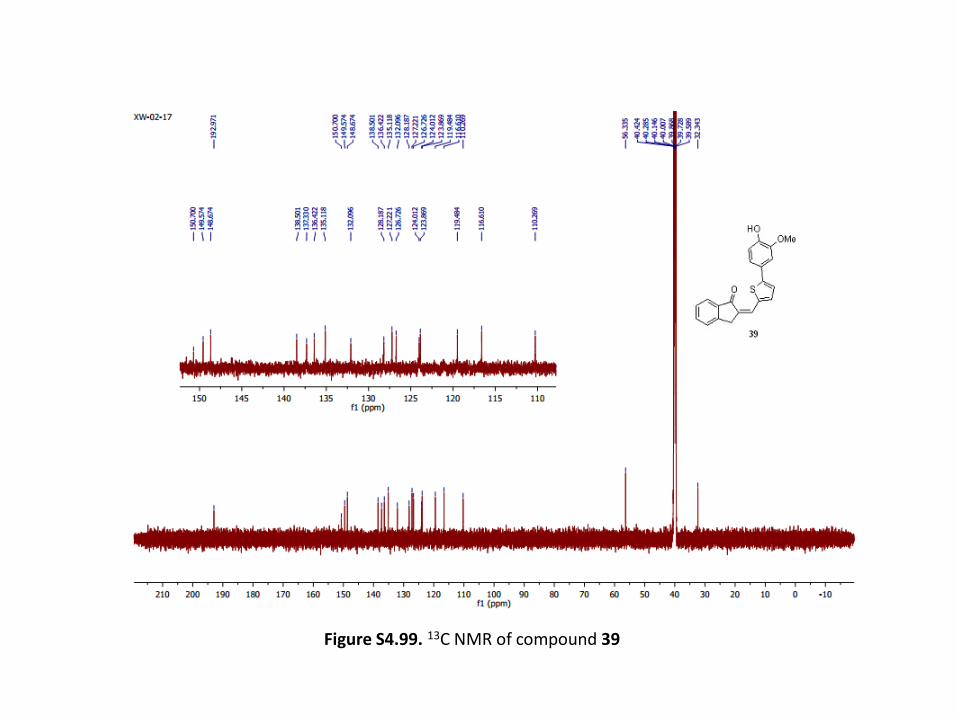
Figure S4.99. 13C NMR of compound 39
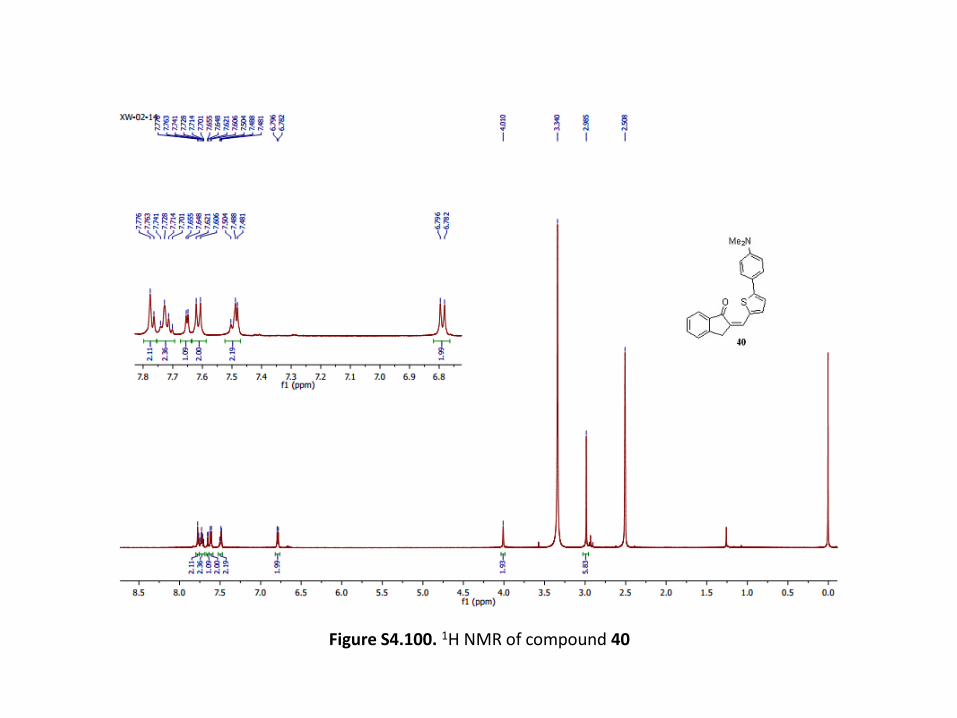
Figure S4.100. 1H NMR of compound 40
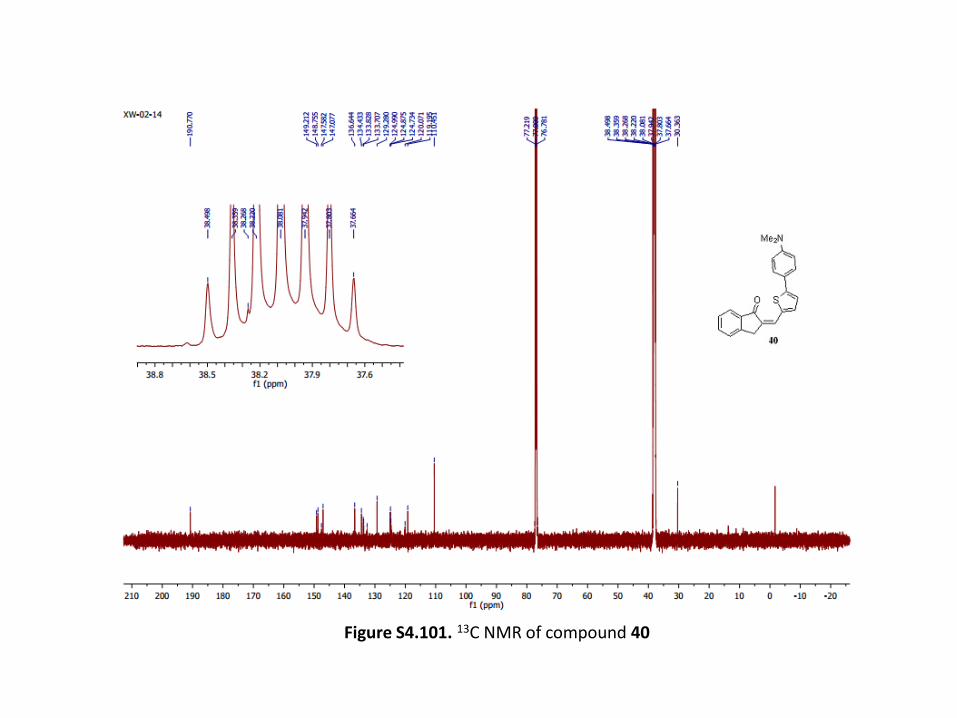
Figure S4.101. 13C NMR of compound 40
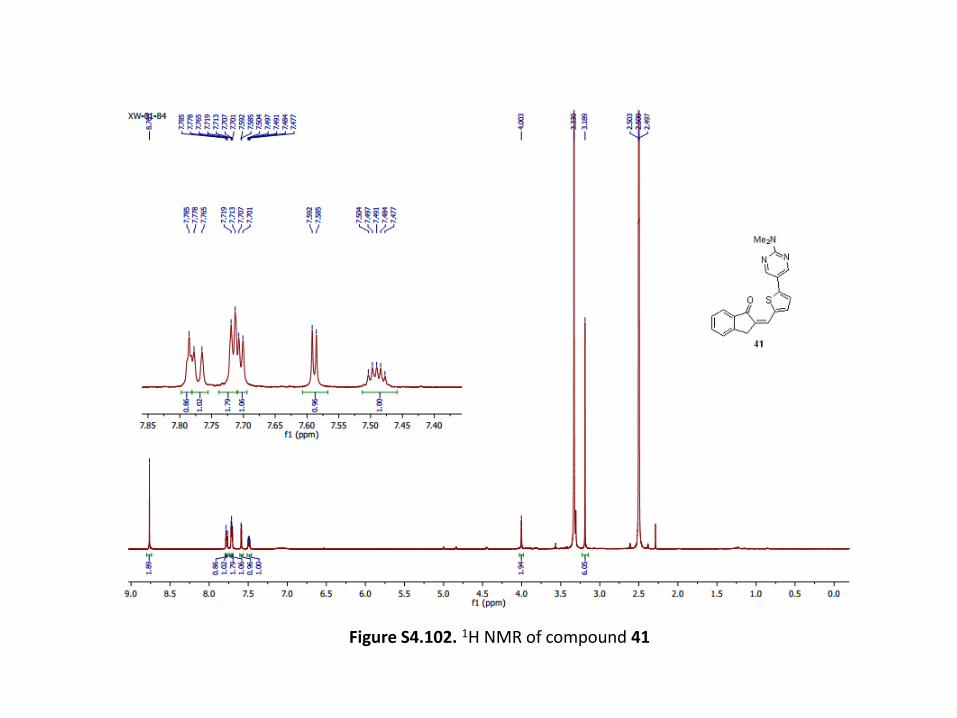
Figure S4.102. 1H NMR of compound 41
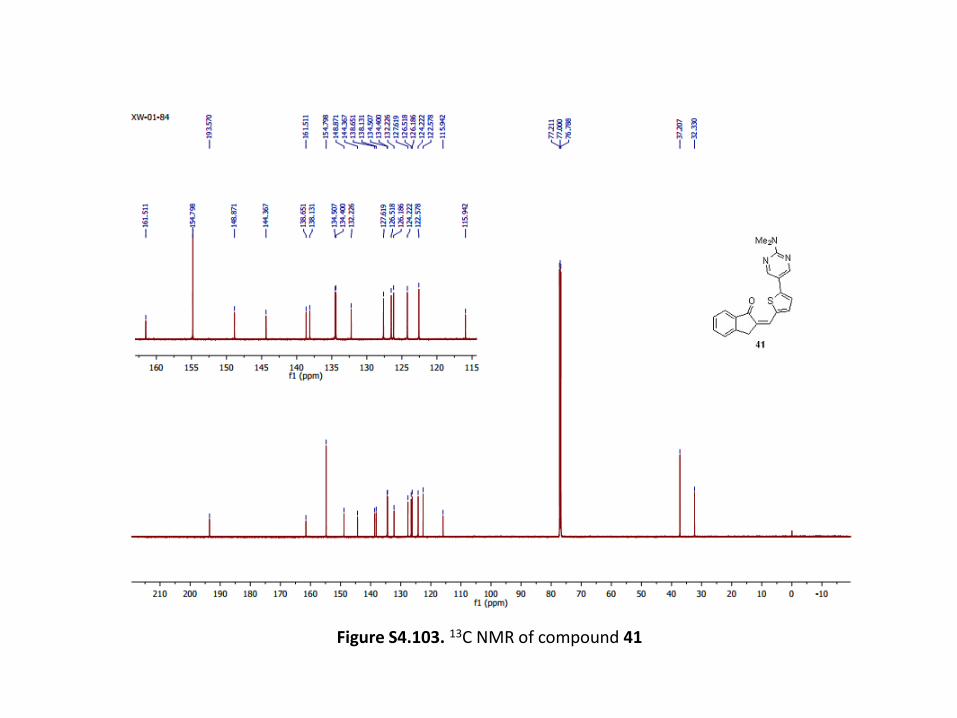
Figure S4.103. 13C NMR of compound 41
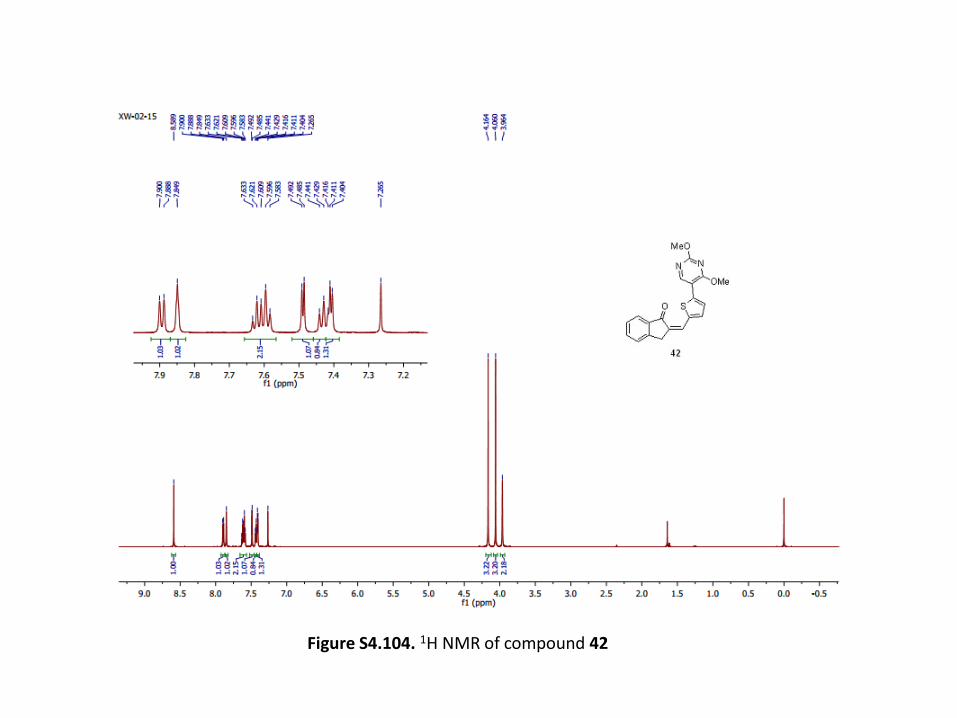
Figure S4.104. 1H NMR of compound 42
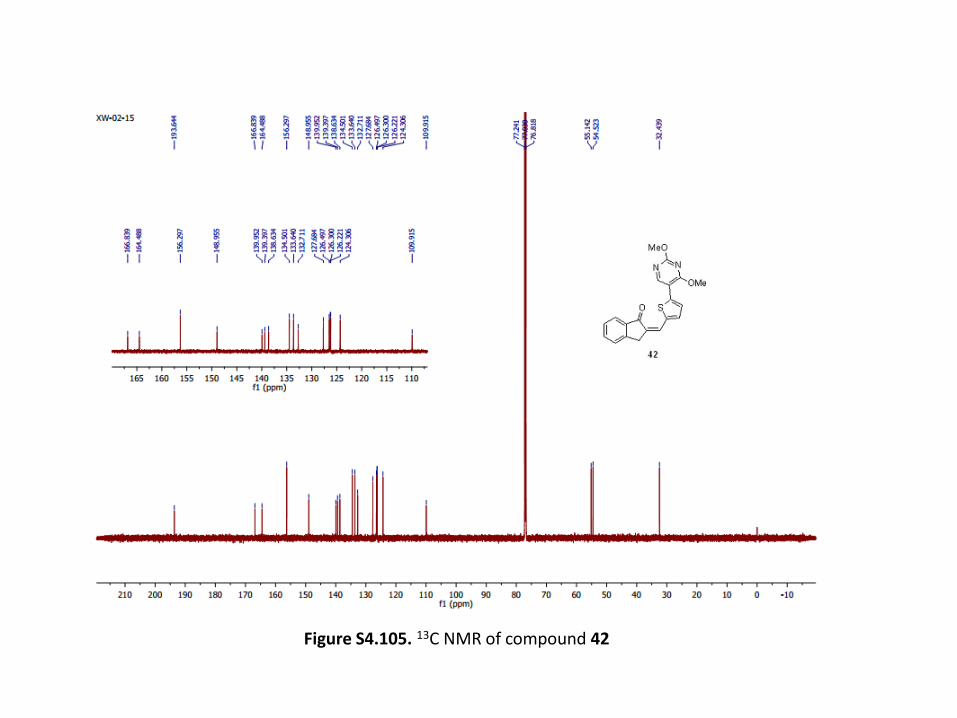
Figure S4.105. 13C NMR of compound 42
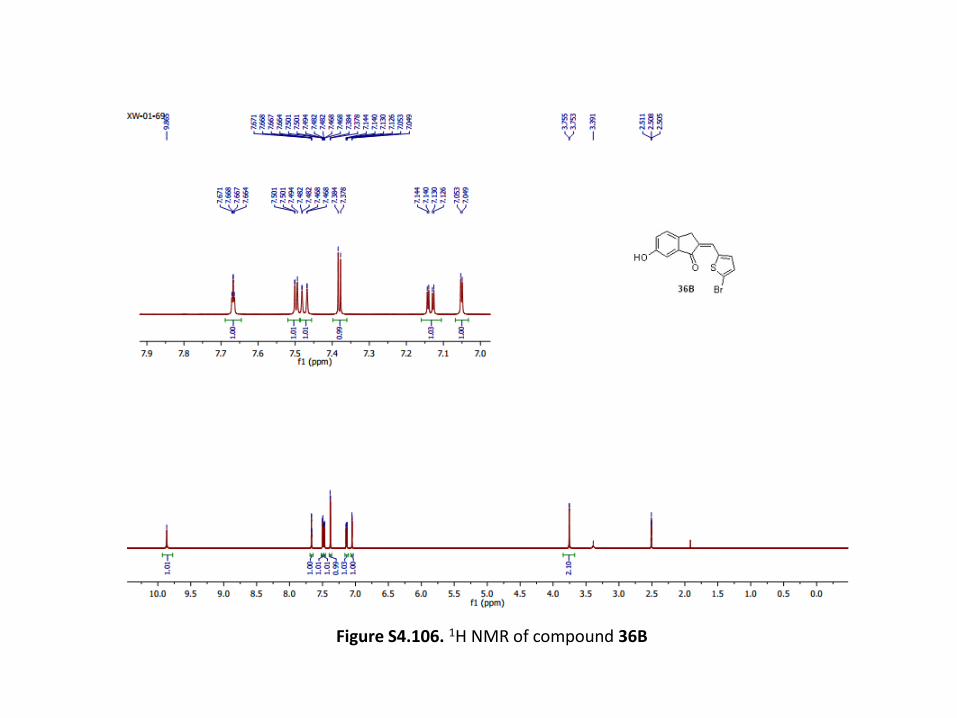
Figure S4.106. 1H NMR of compound 36B
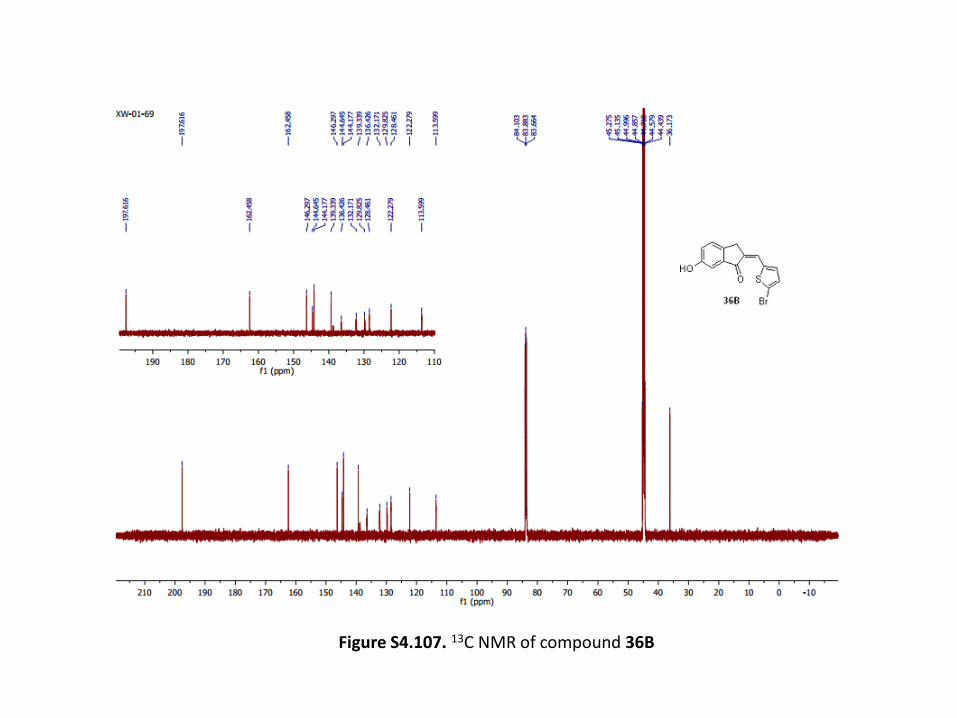
Figure S4.107. 13C NMR of compound 36B
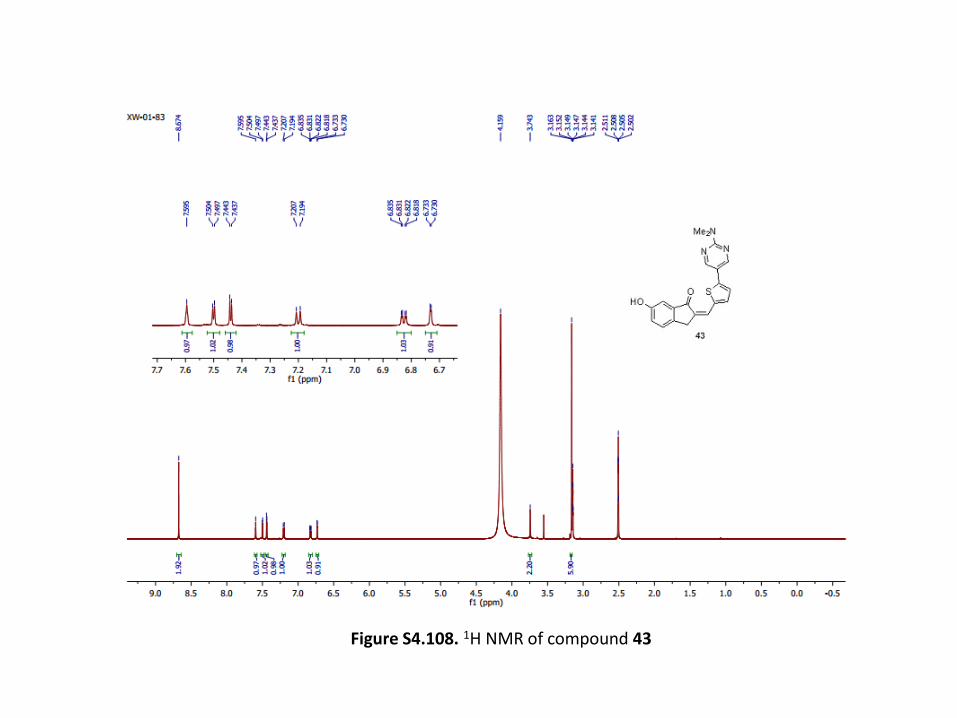
Figure S4.108. 1H NMR of compound 43
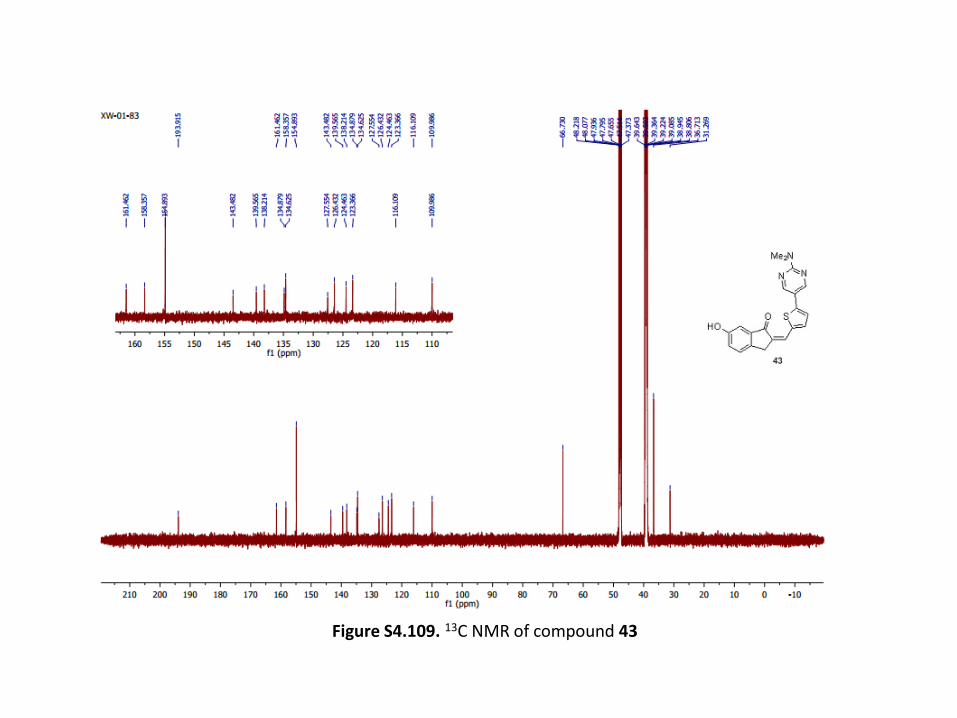
Figure S4.109. 13C NMR of compound 43
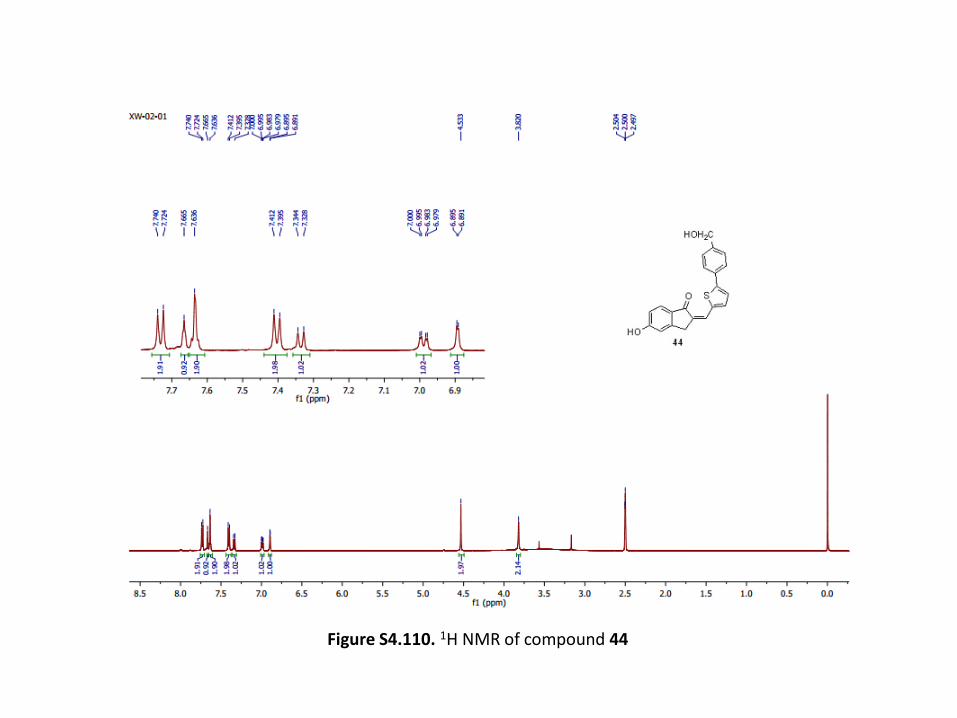
Figure S4.110. 1H NMR of compound 44
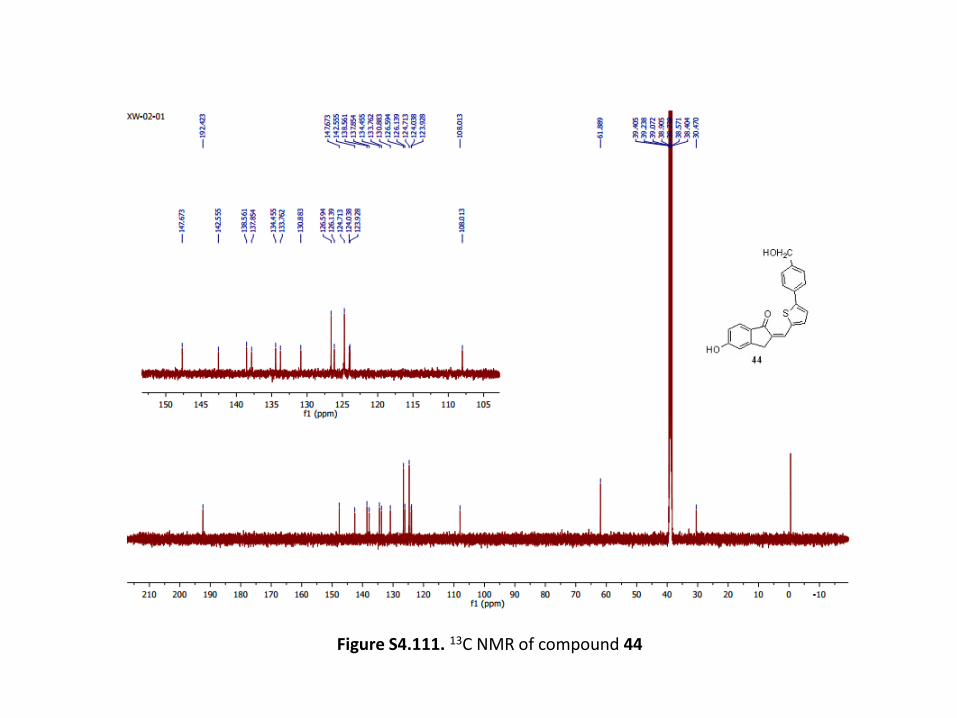
Figure S4.111. 13C NMR of compound 44
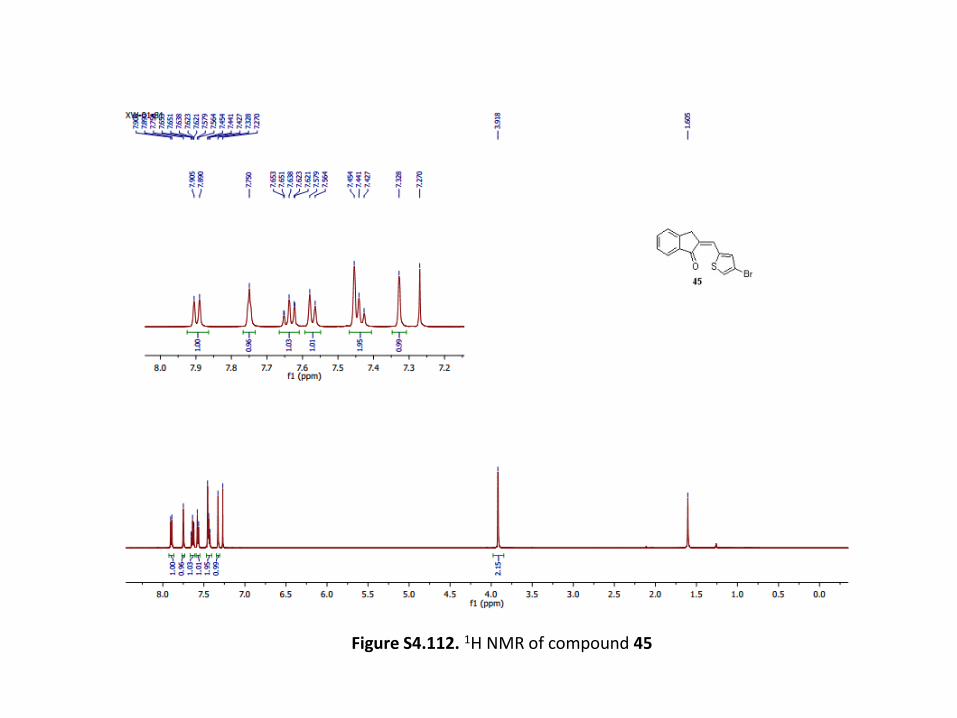
Figure S4.112. 1H NMR of compound 45
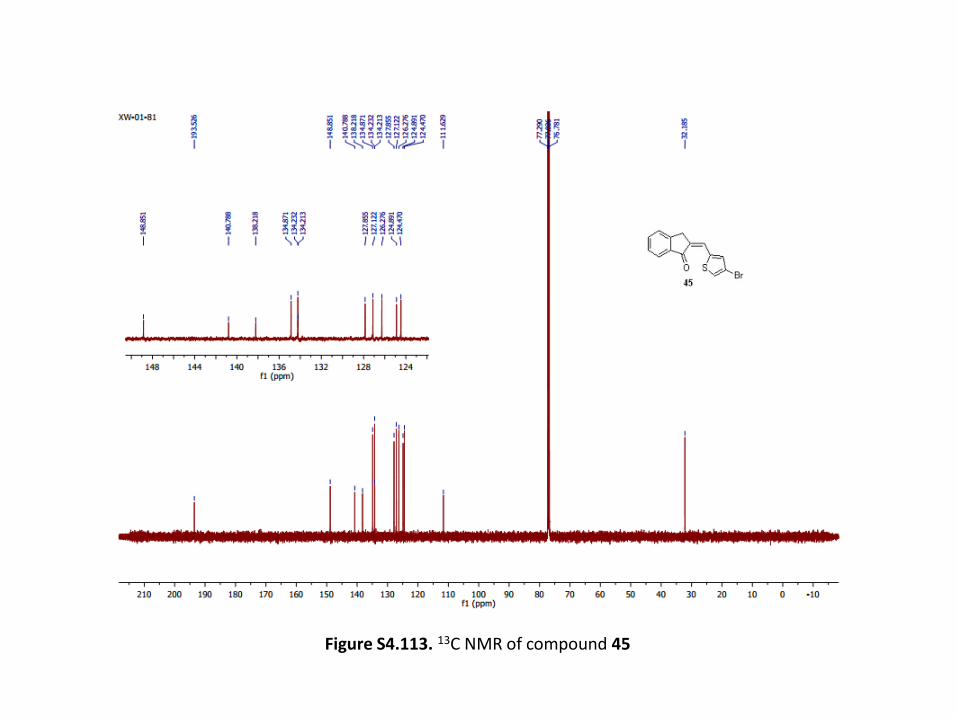
Figure S4.113. 13C NMR of compound 45
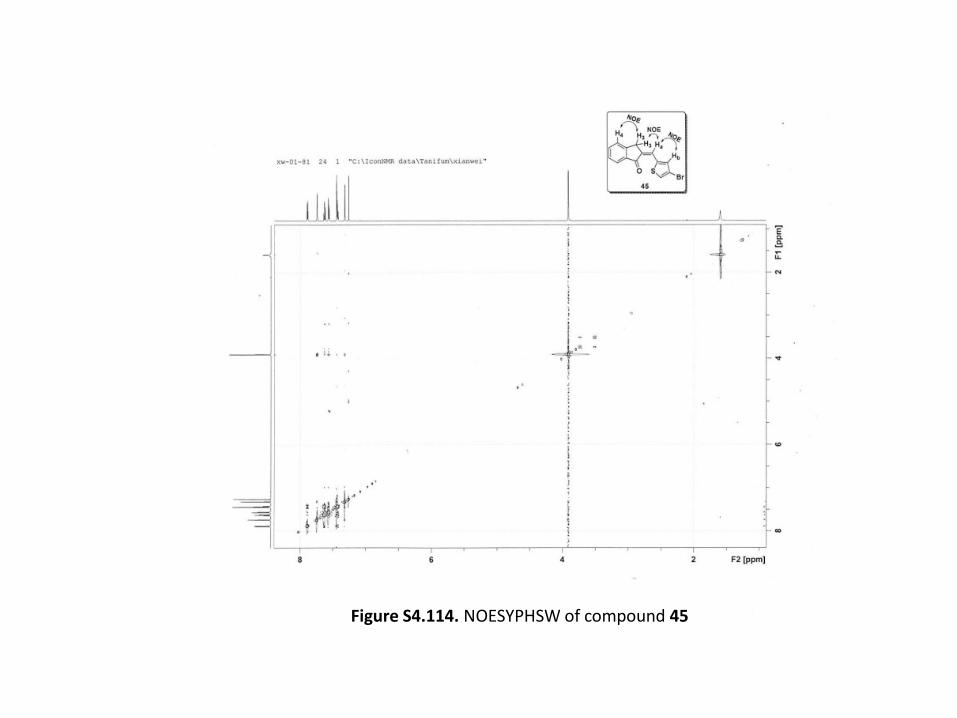
Figure S4.114. NOESYPHSW of compound 45
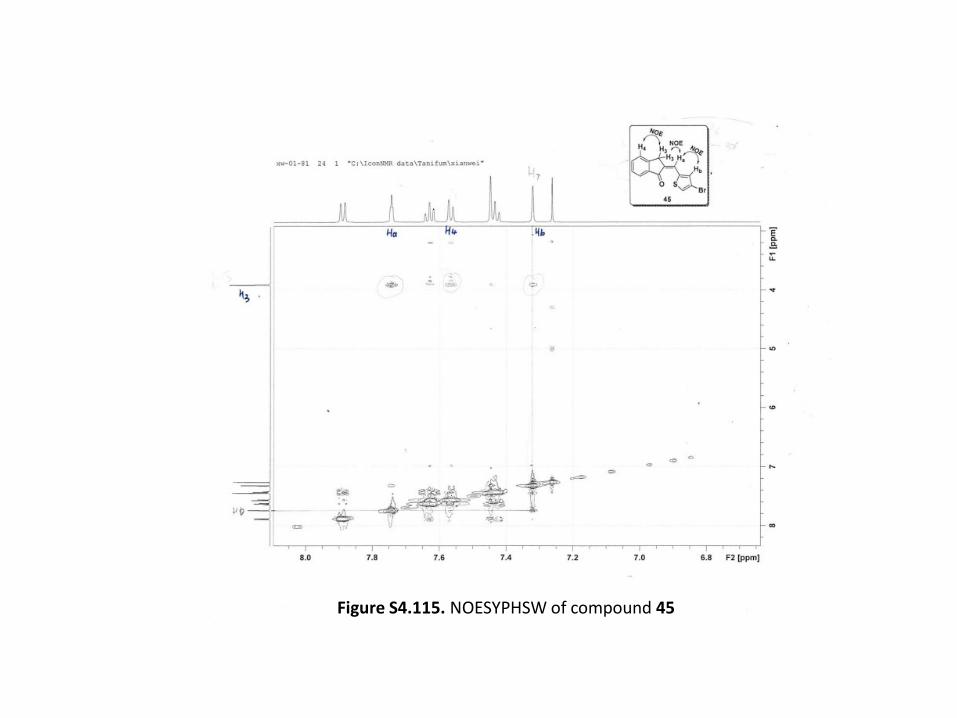
Figure S4.115. NOESYPHSW of compound 45
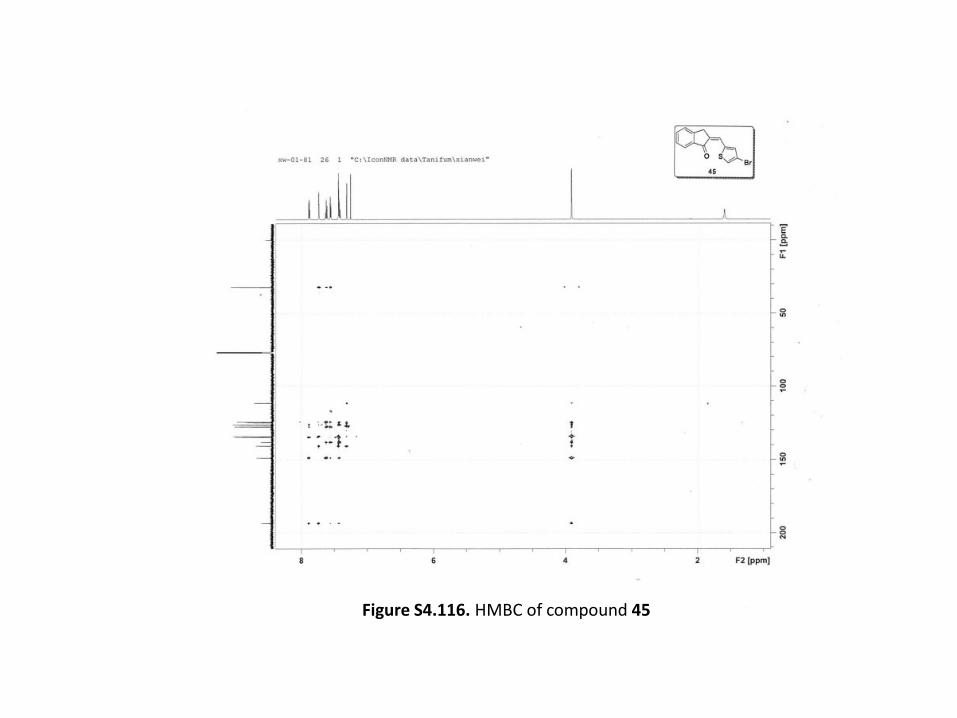
Figure S4.116. HMBC of compound 45
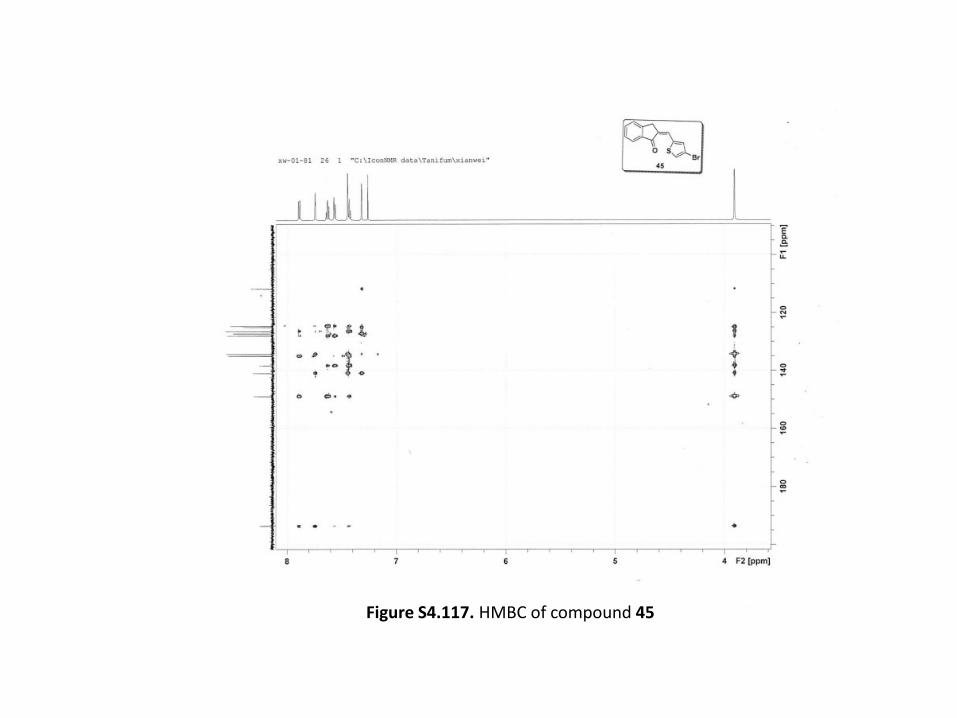
Figure S4.117. HMBC of compound 45
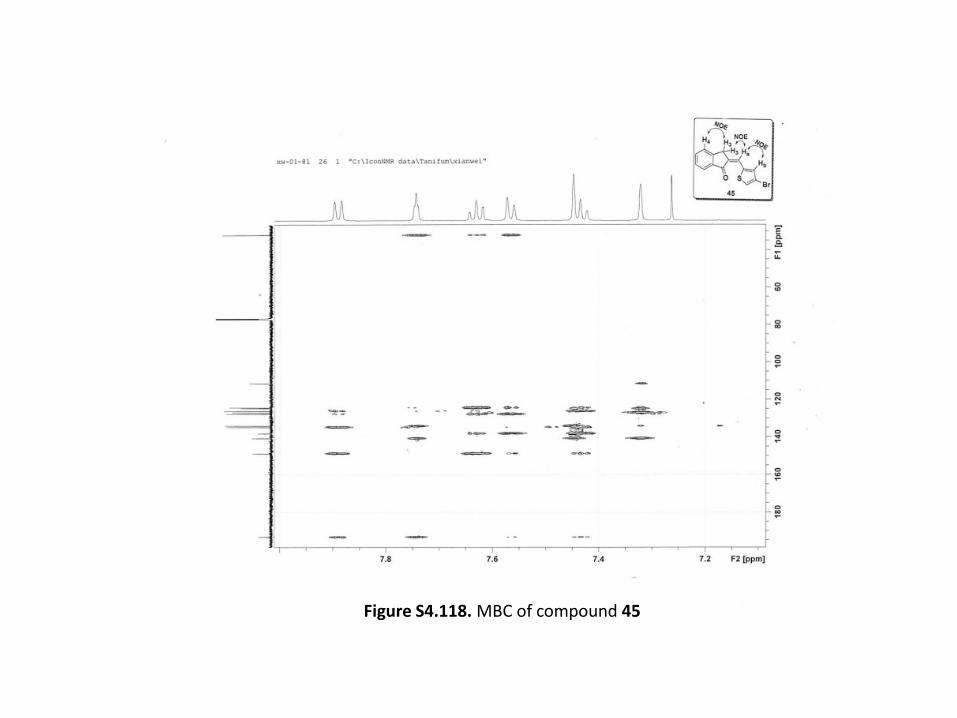
Figure S4.118. MBC of compound 45
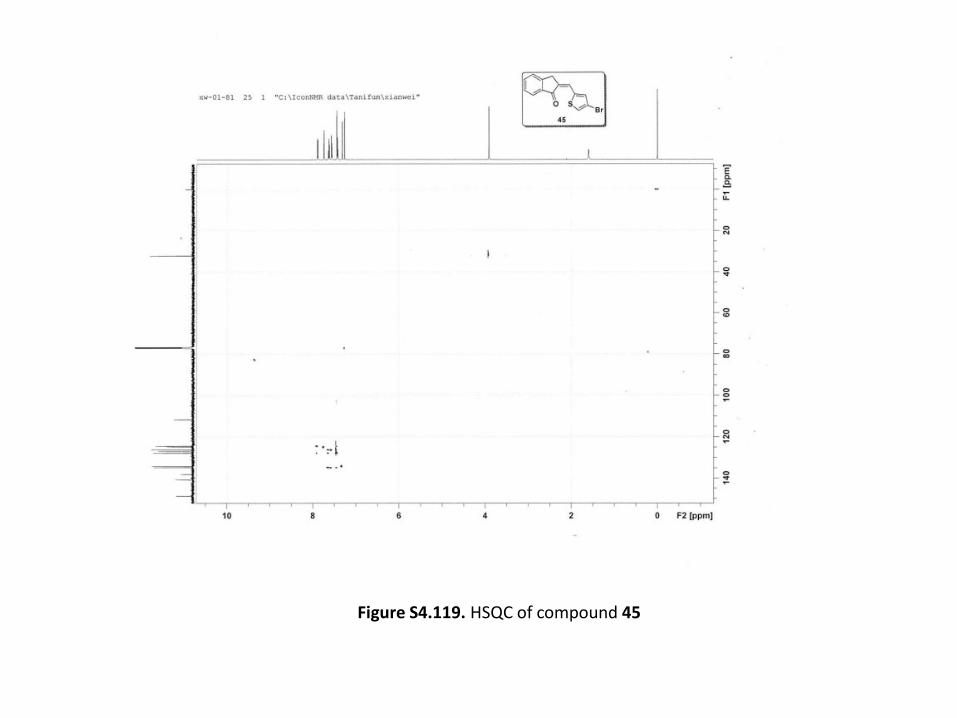
Figure S4.119. HSQC of compound 45
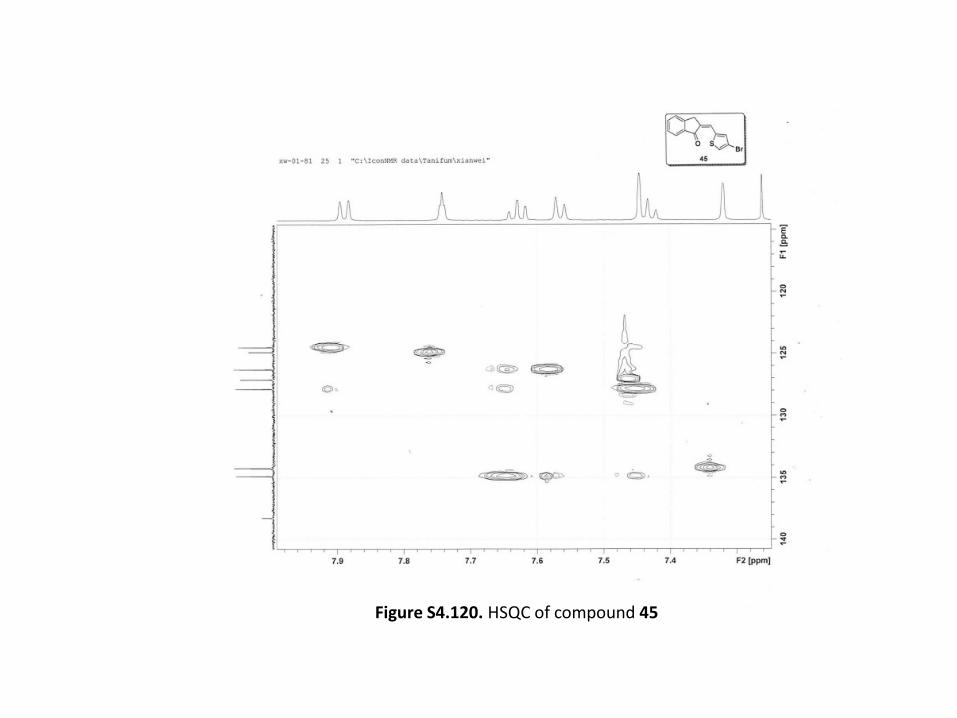
Figure S4.120. HSQC of compound 45
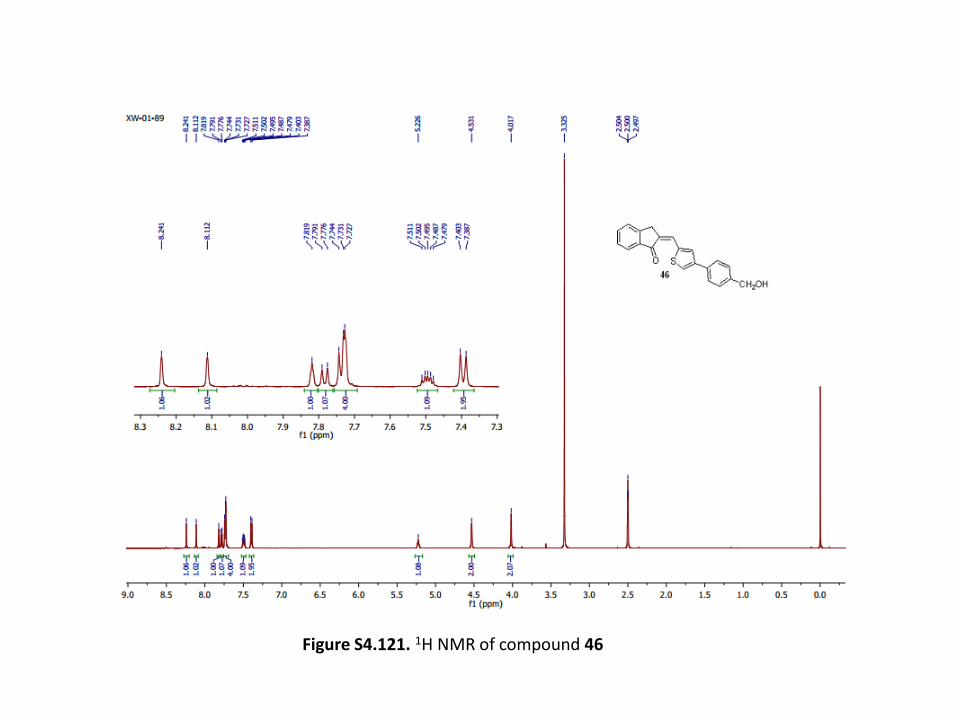
Figure S4.121. 1H NMR of compound 46
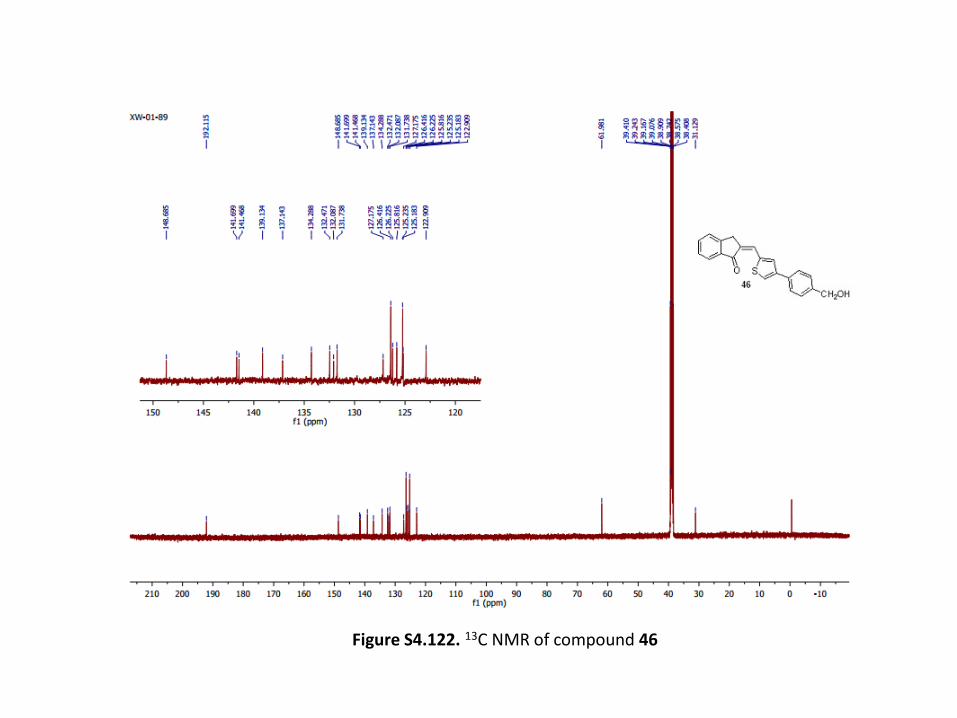
Figure S4.122. 13C NMR of compound 46
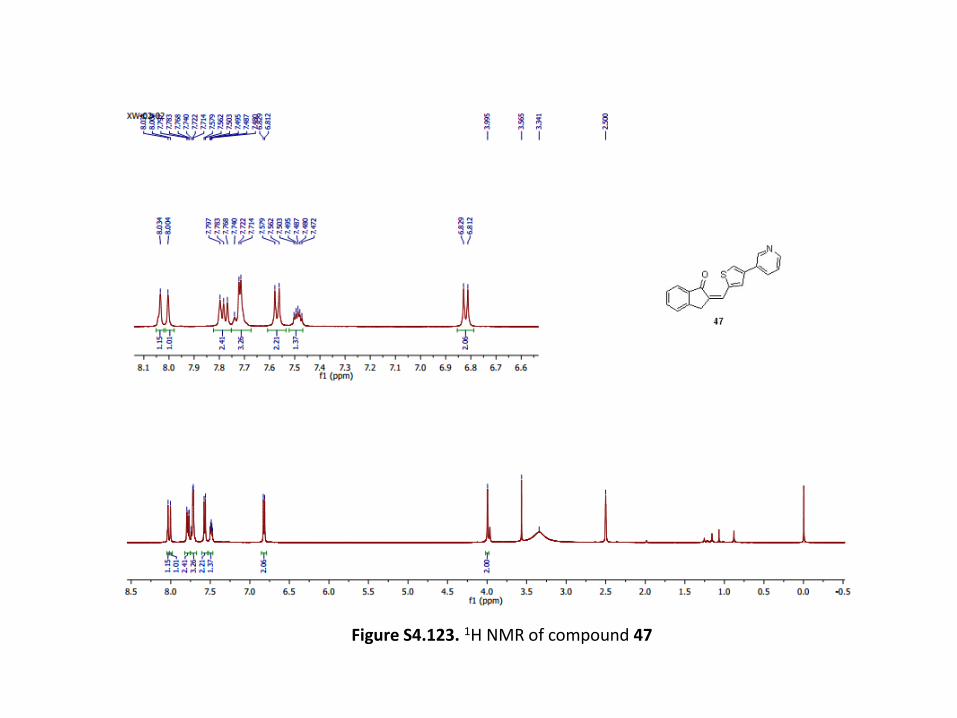
Figure S4.123. 1H NMR of compound 47
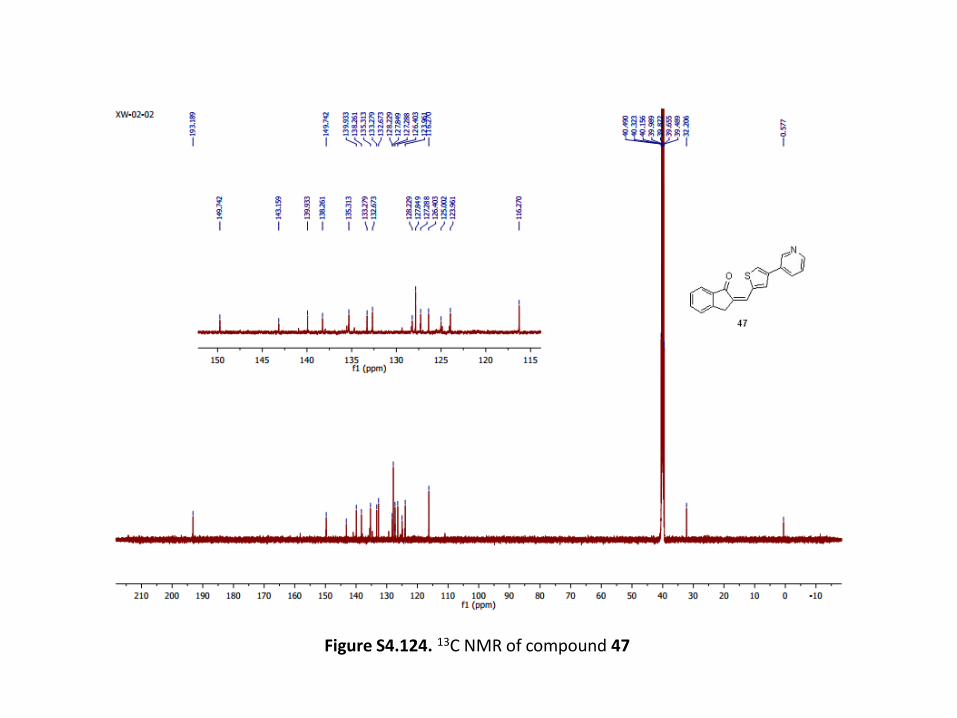
Figure S4.124. 13C NMR of compound 47
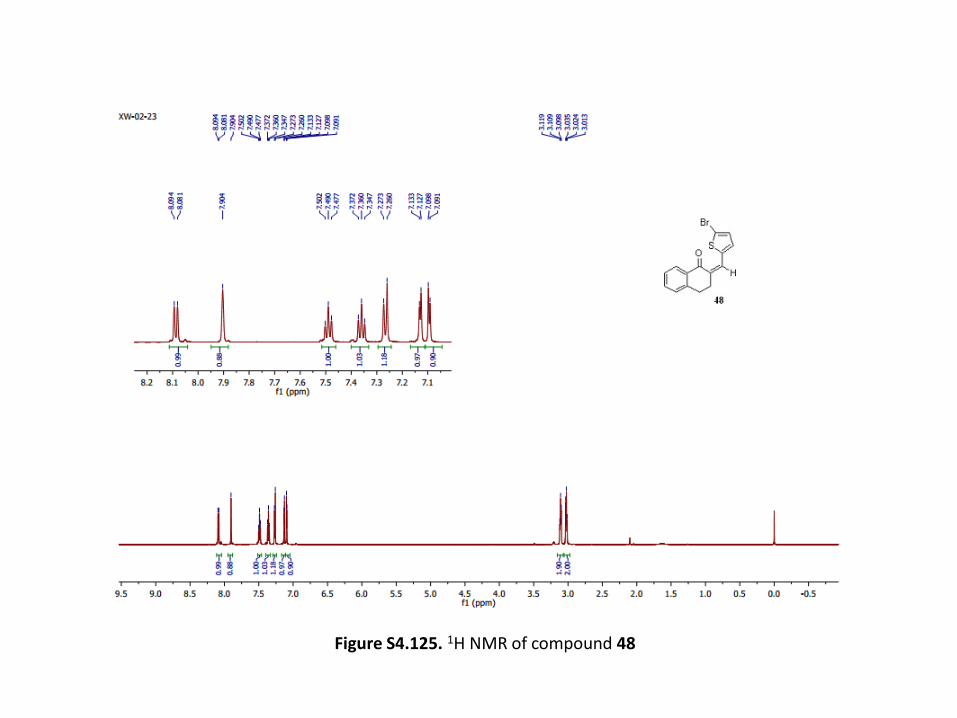
Figure S4.125. 1H NMR of compound 48
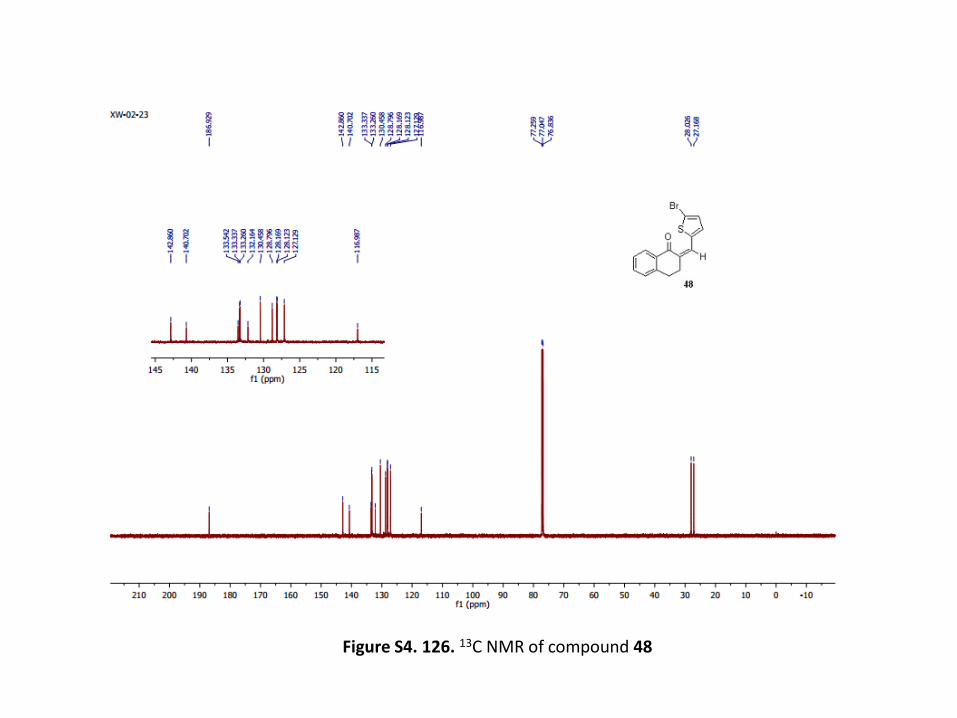
Figure S4. 126. 13C NMR of compound 48
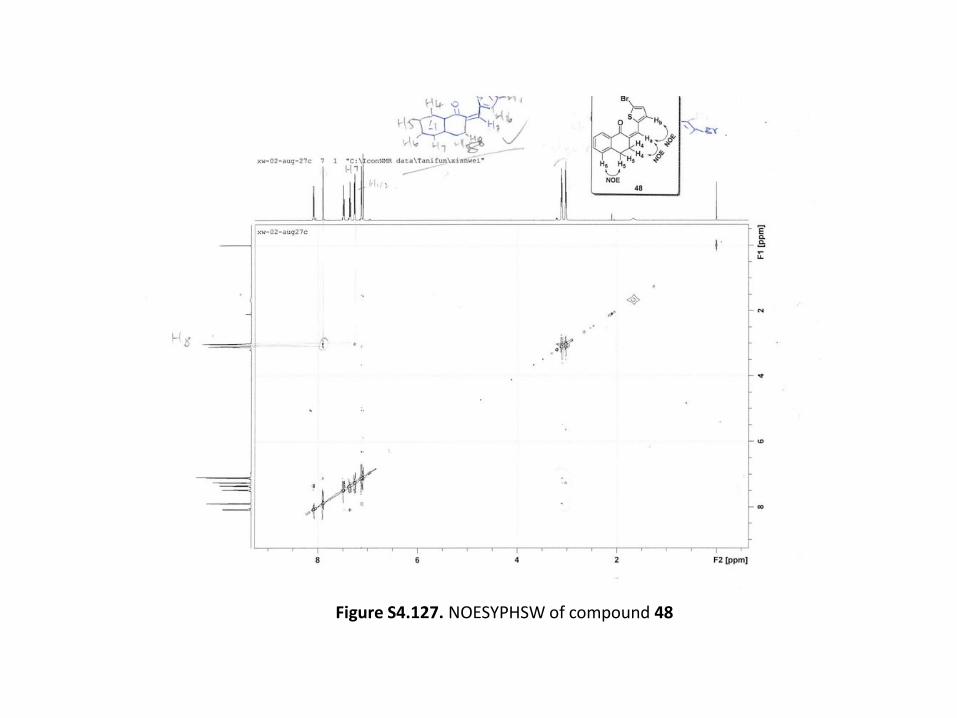
Figure S4.127. NOESYPHSW of compound 48
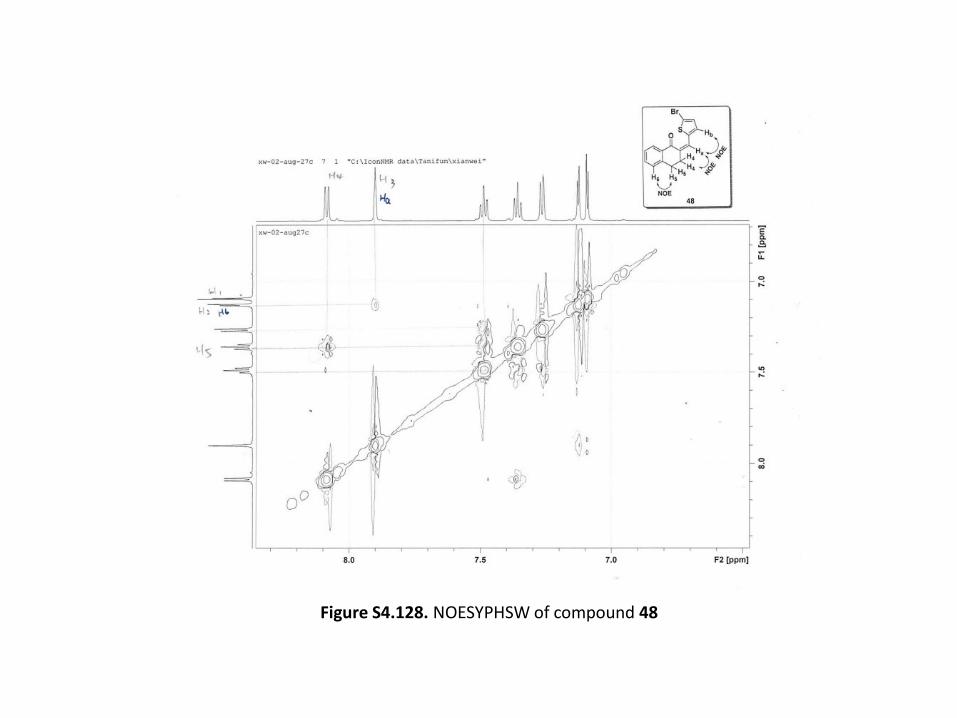
Figure S4.128. NOESYPHSW of compound 48
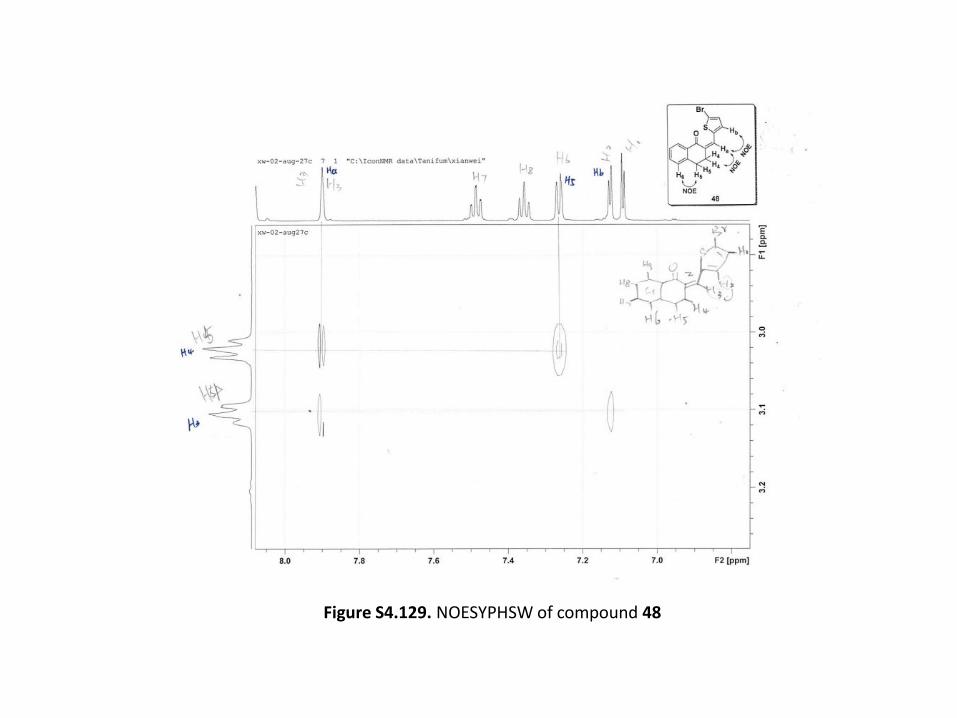
Figure S4.129. NOESYPHSW of compound 48
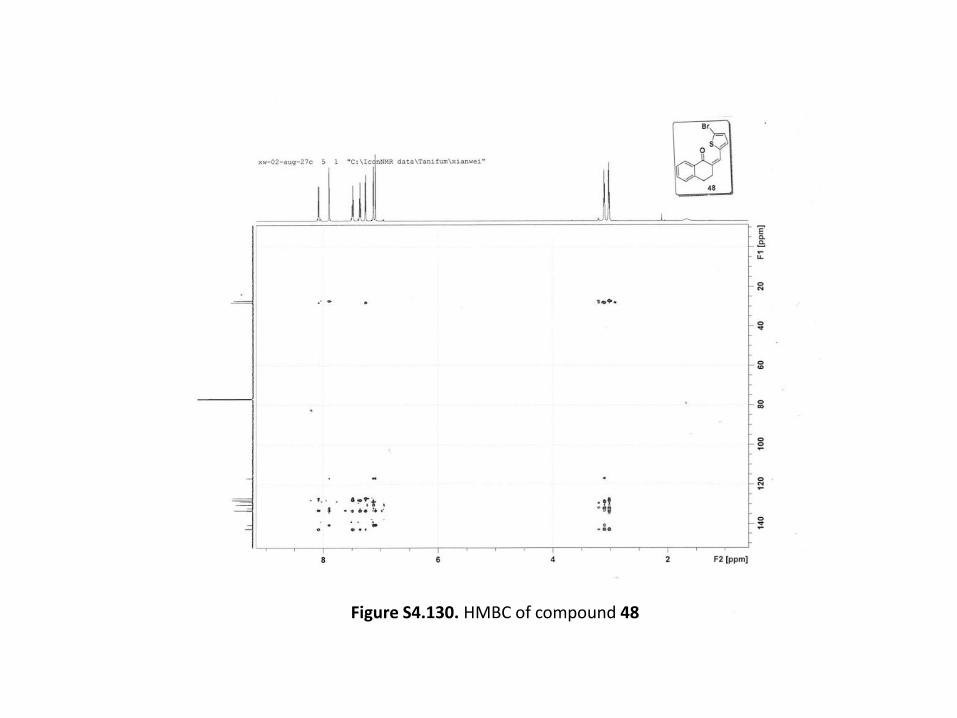
Figure S4.130. HMBC of compound 48
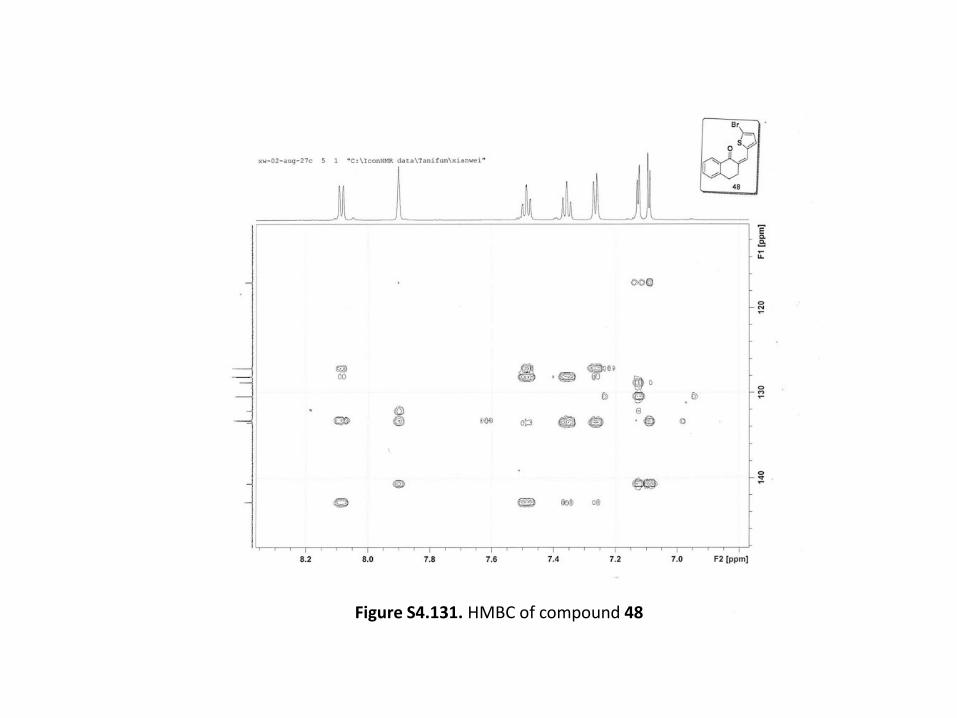
Figure S4.131. HMBC of compound 48
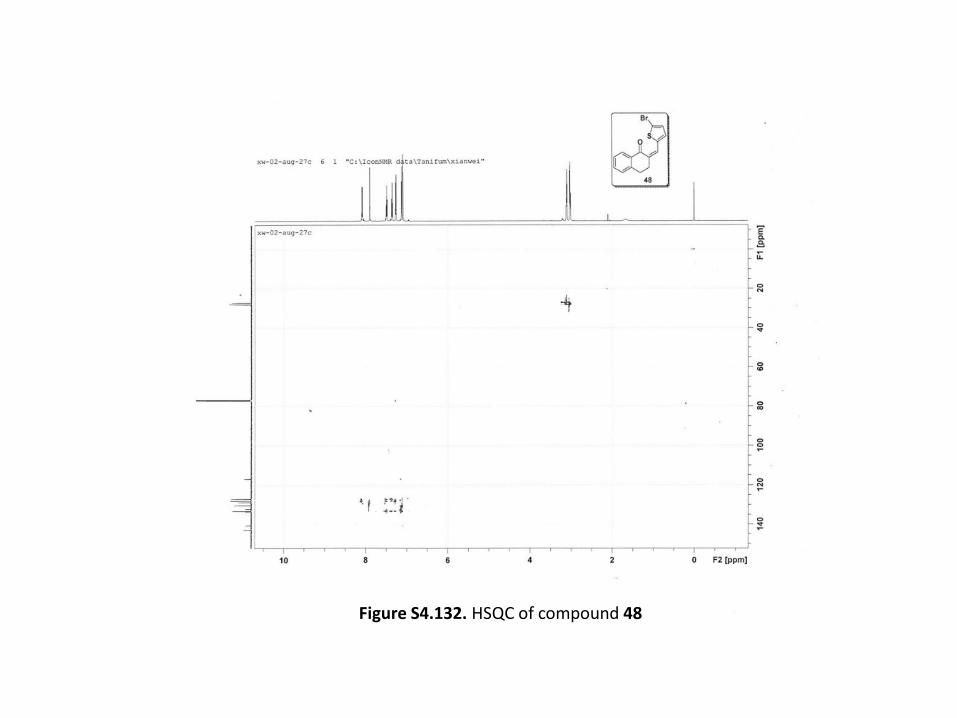
Figure S4.132. HSQC of compound 48
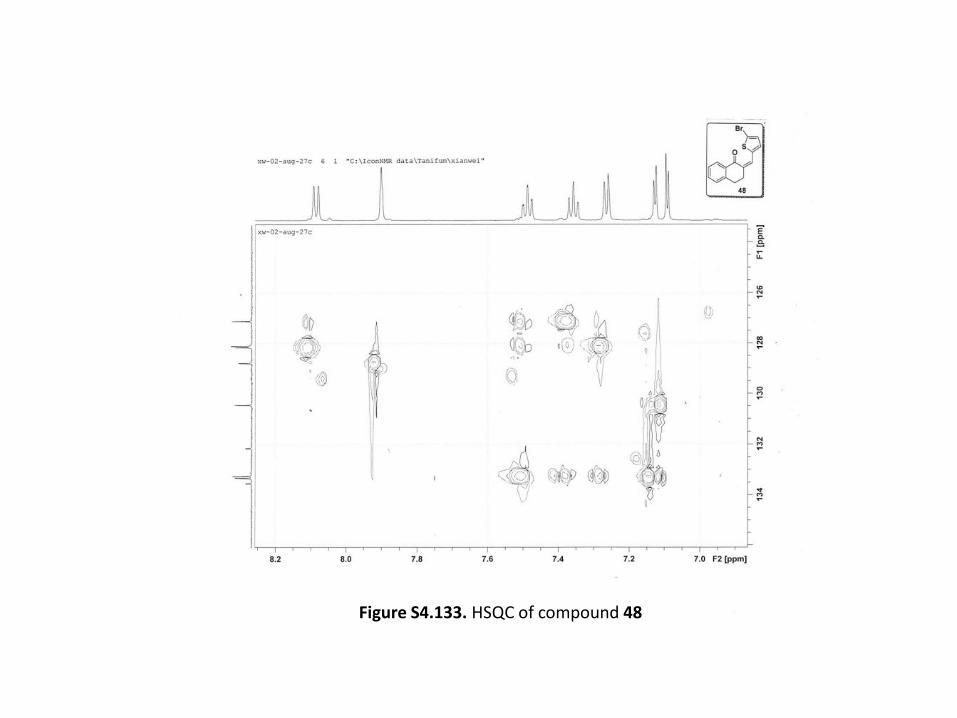
Figure S4.133. HSQC of compound 48
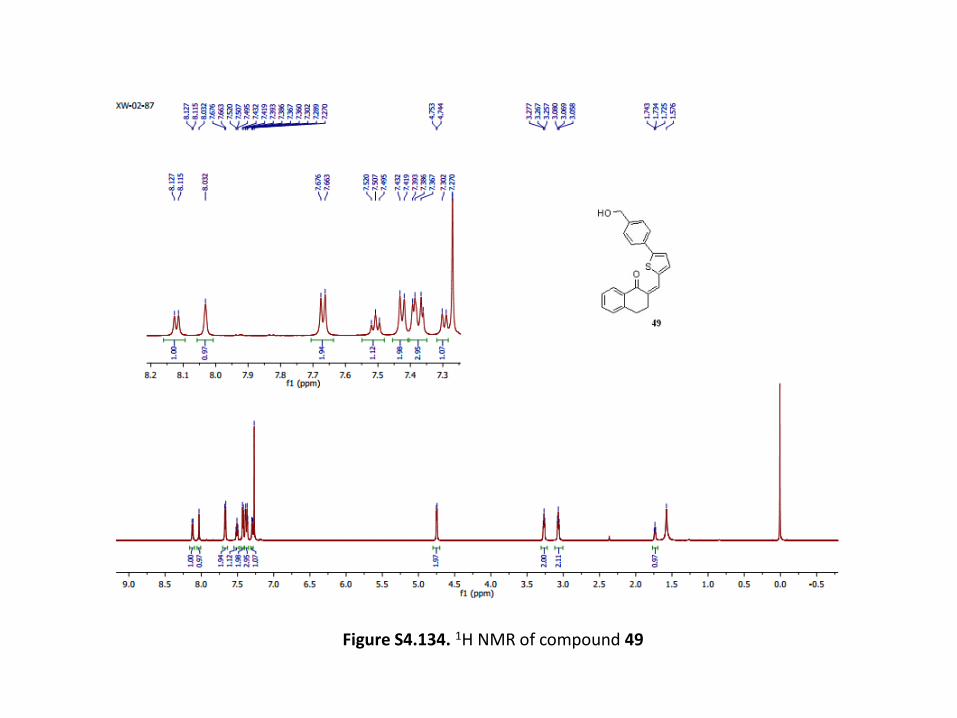
Figure S4.134. 1H NMR of compound 49
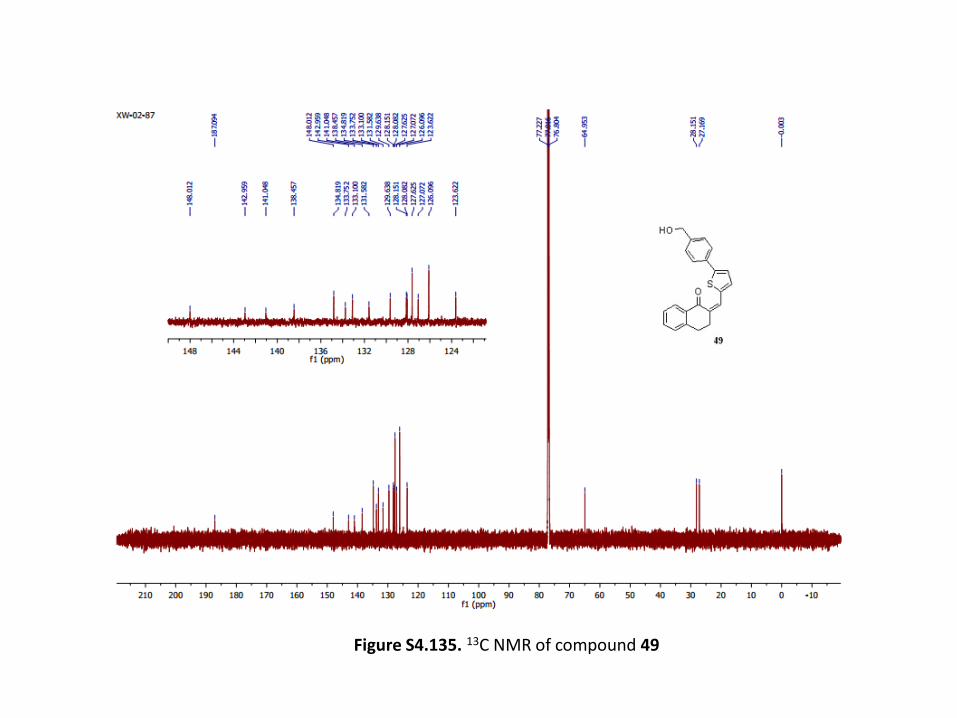
Figure S4.135. 13C NMR of compound 49
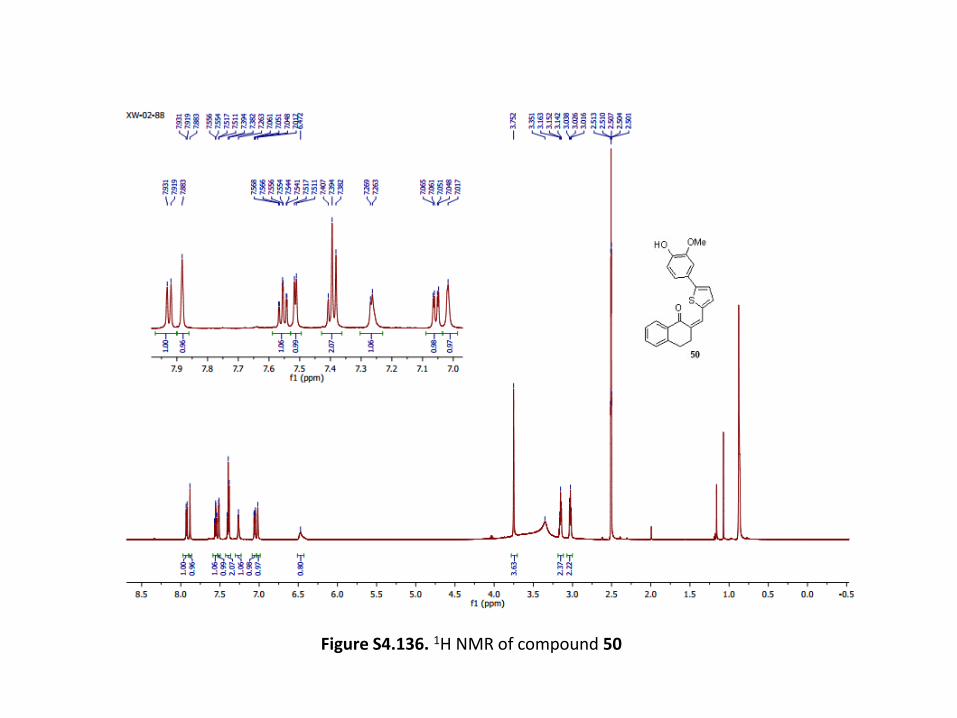
Figure S4.136. 1H NMR of compound 50
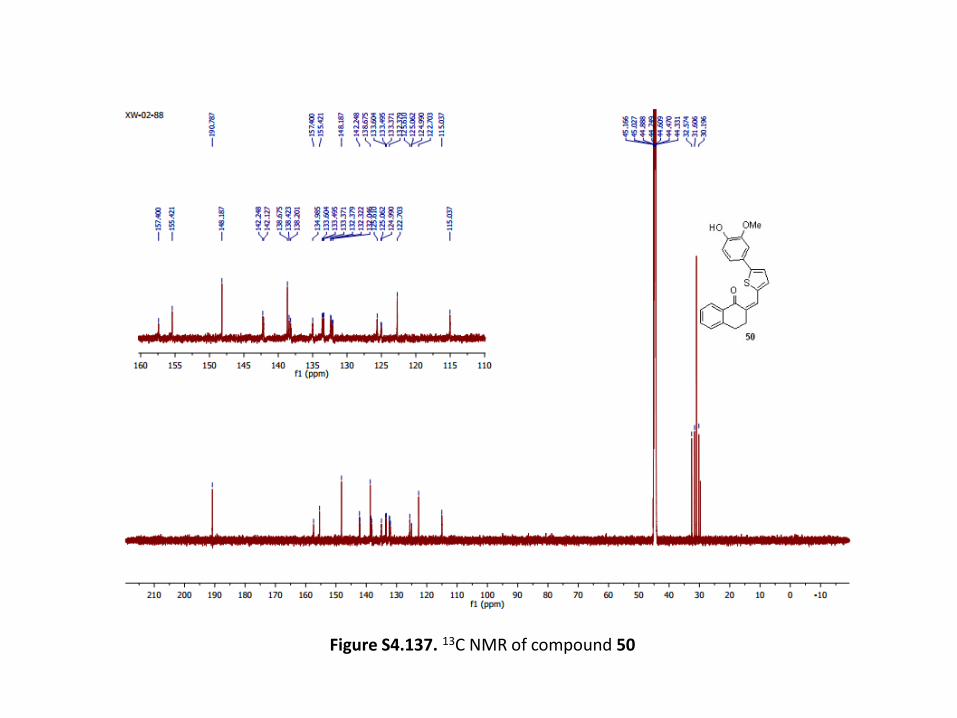
Figure S4.137. 13C NMR of compound 50
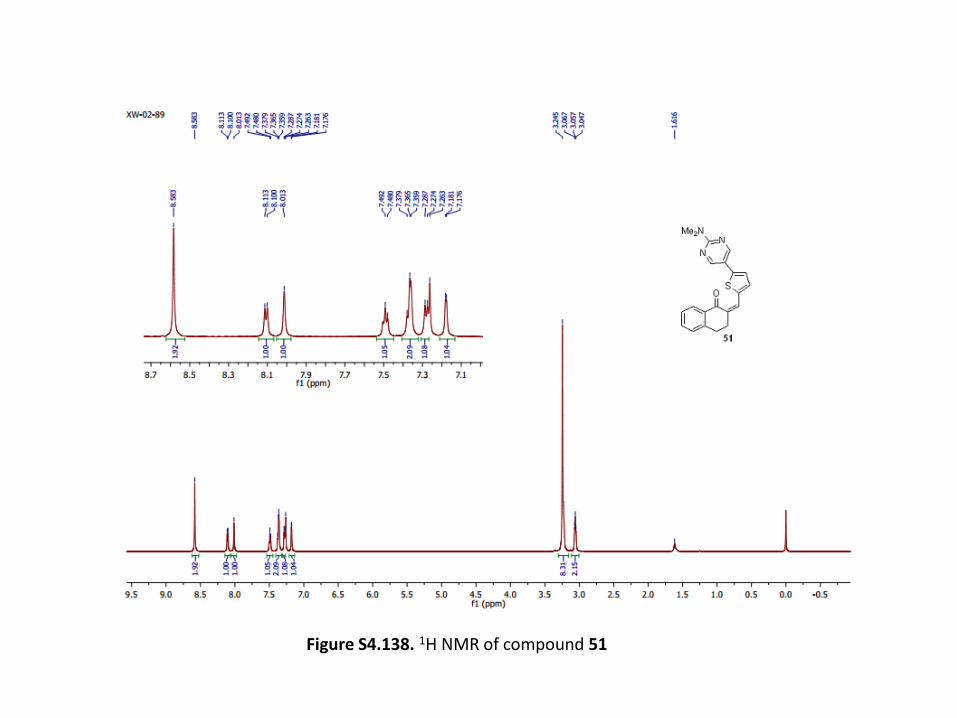
Figure S4.138. 1H NMR of compound 51
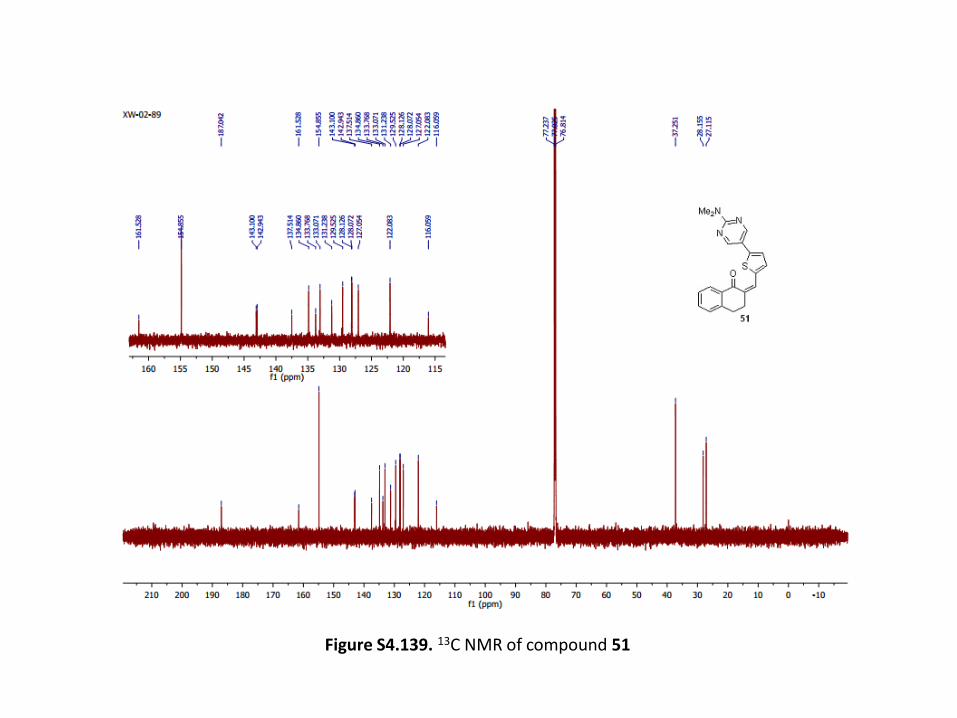
Figure S4.139. 13C NMR of compound 51
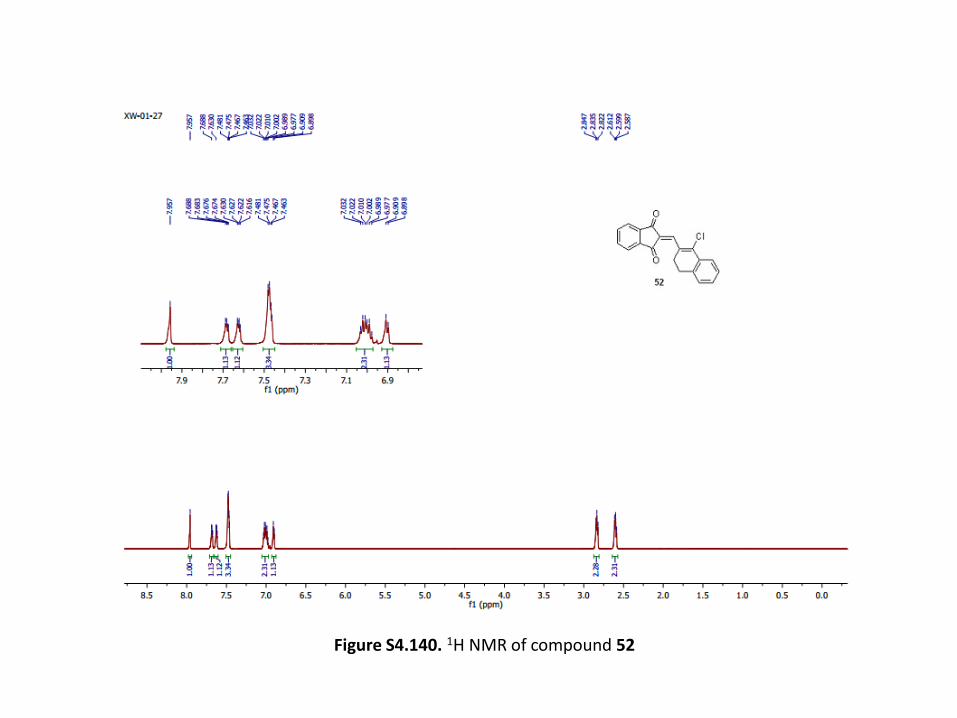
Figure S4.140. 1H NMR of compound 52
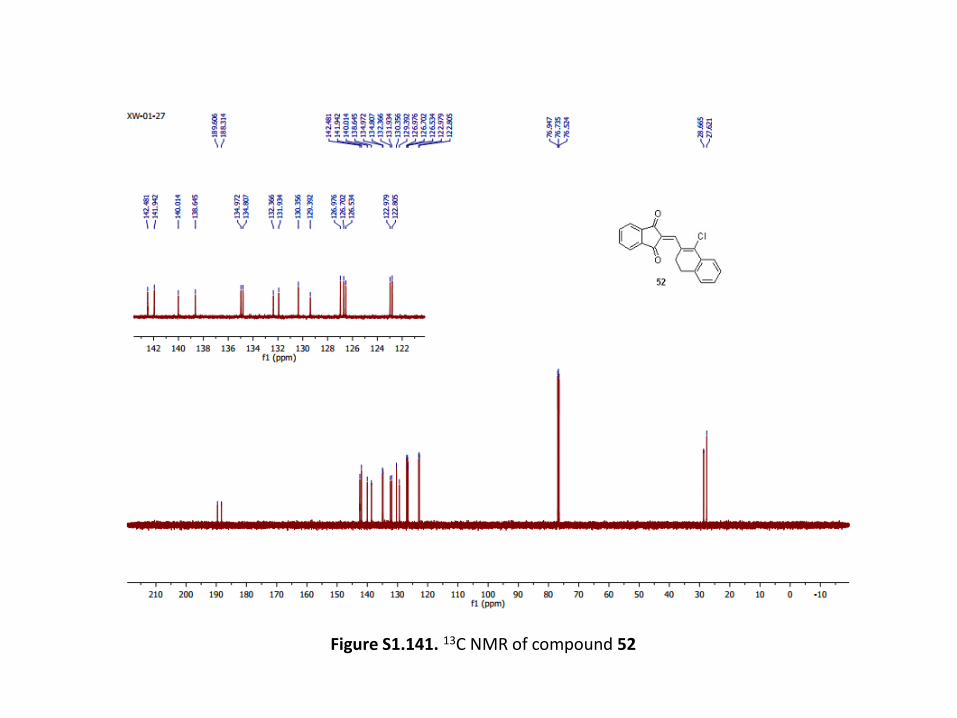
Figure S1.141. 13C NMR of compound 52
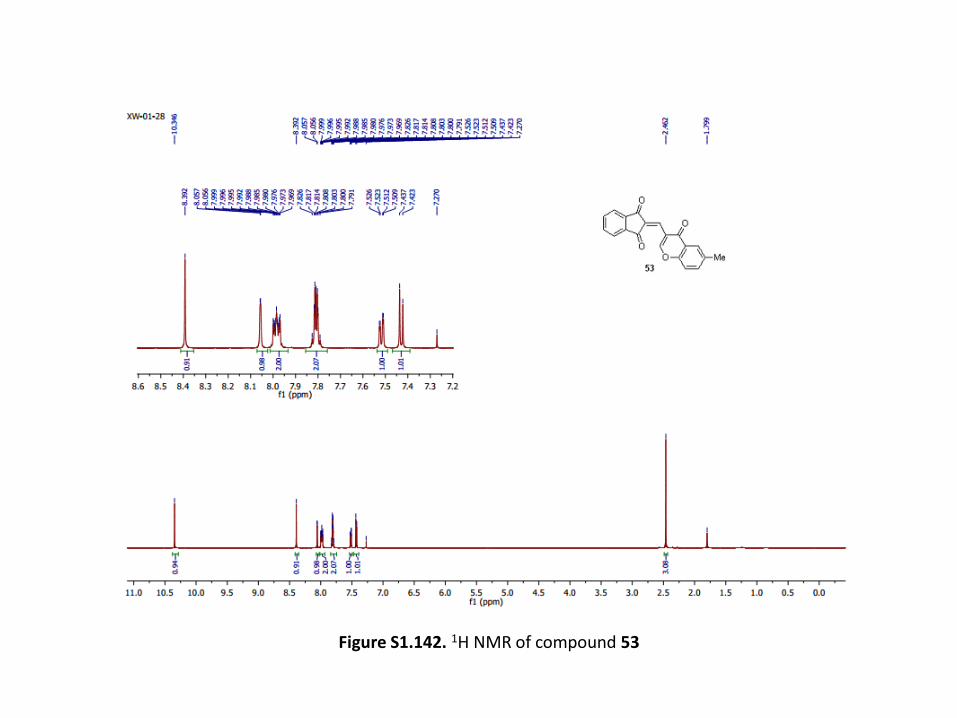
Figure S1.142. 1H NMR of compound 53
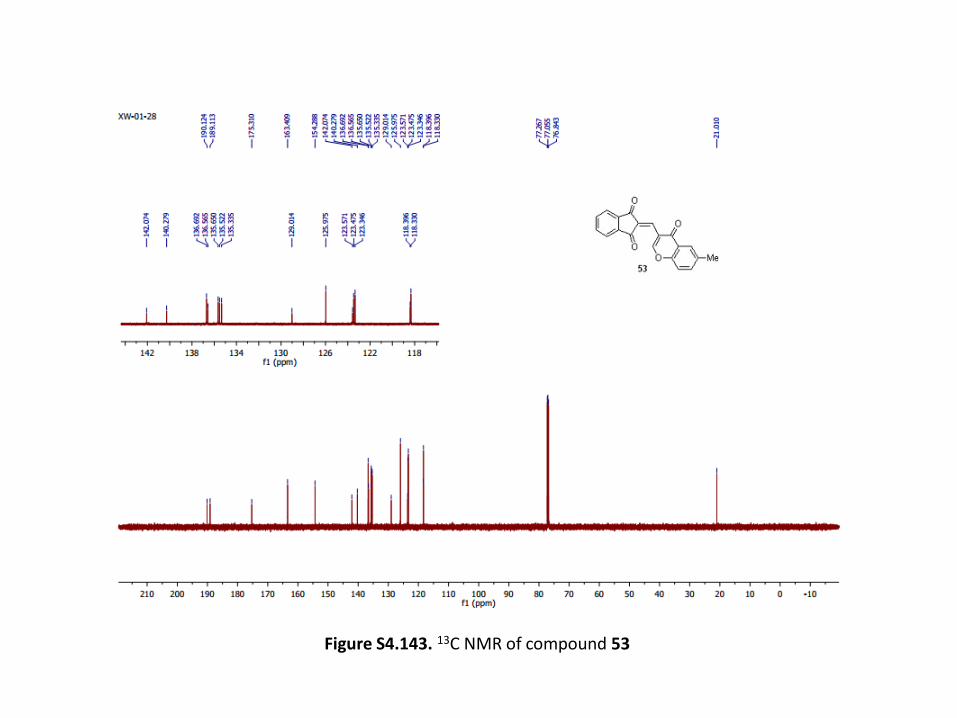
Figure S4.143. 13C NMR of compound 53
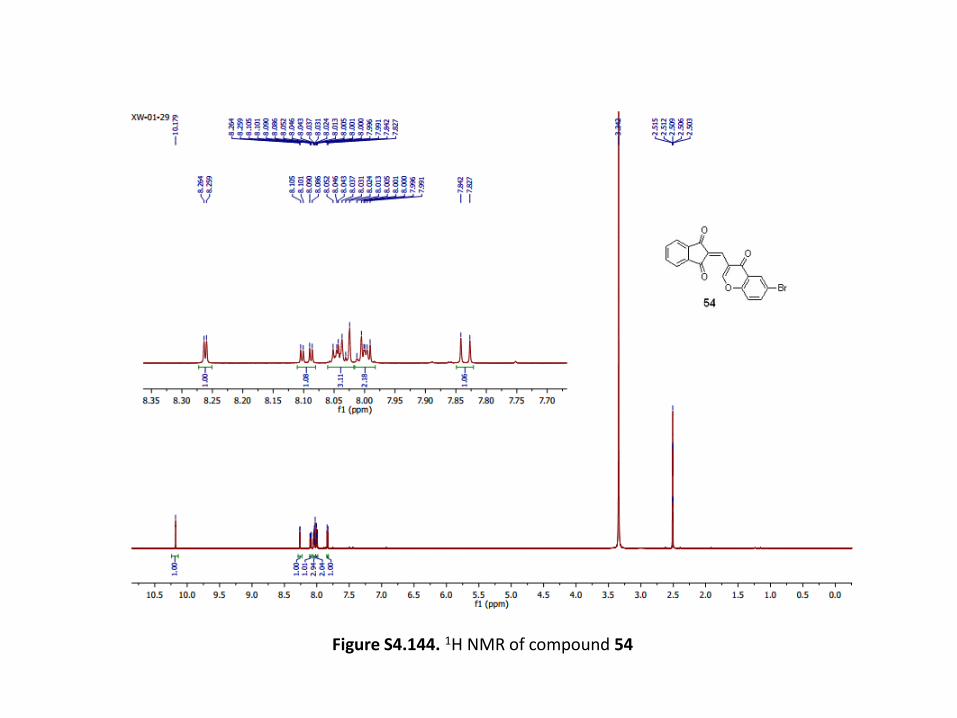
Figure S4.144. 1H NMR of compound 54
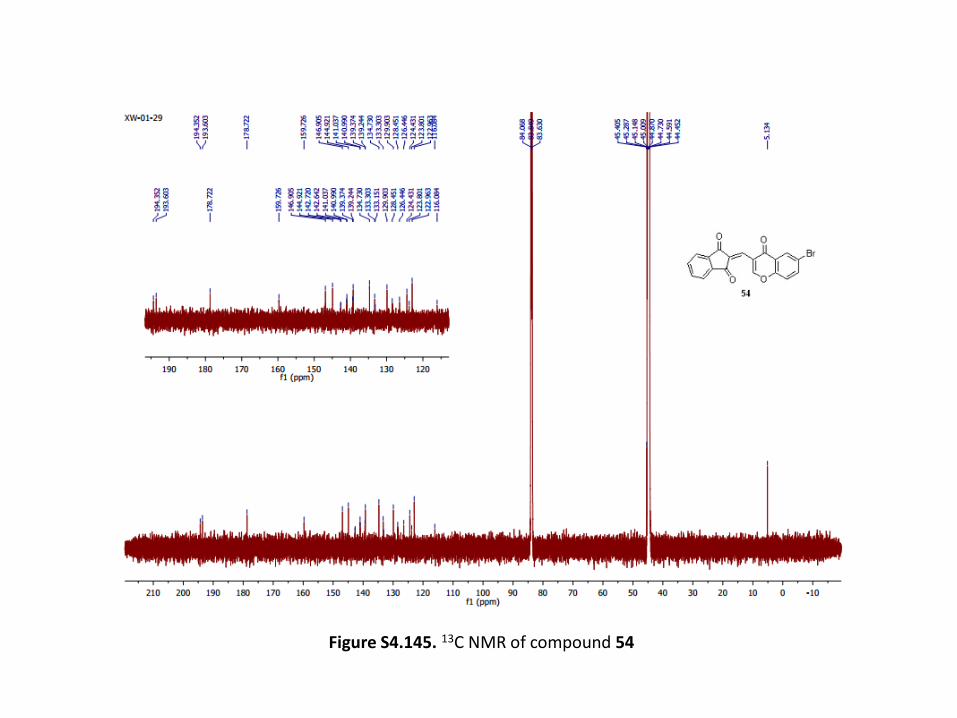
Figure S4.145. 13C NMR of compound 54
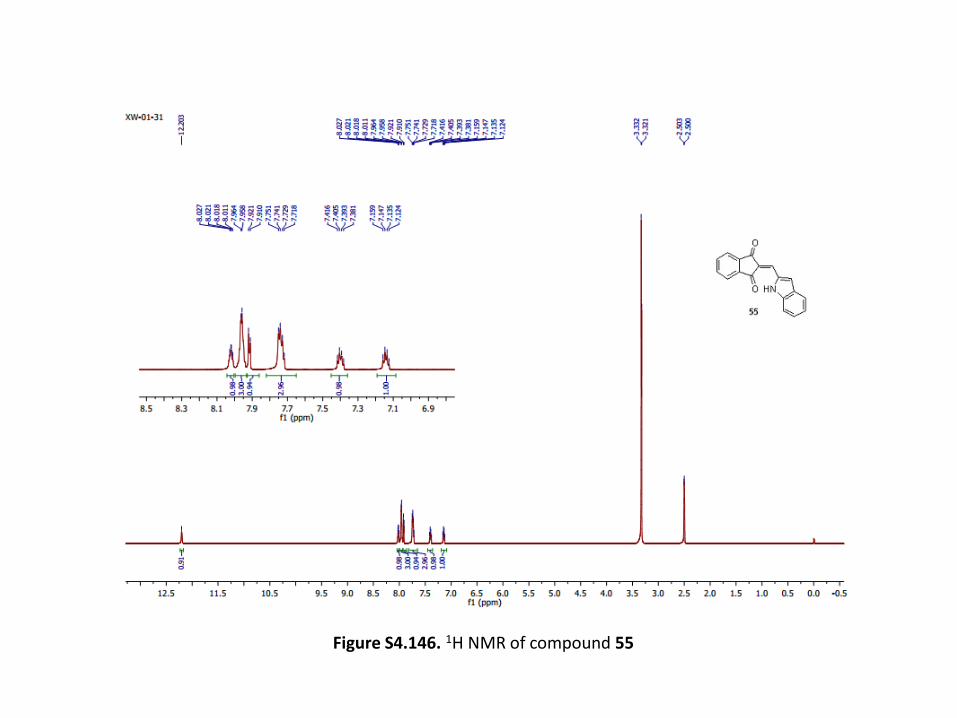
Figure S4.146. 1H NMR of compound 55
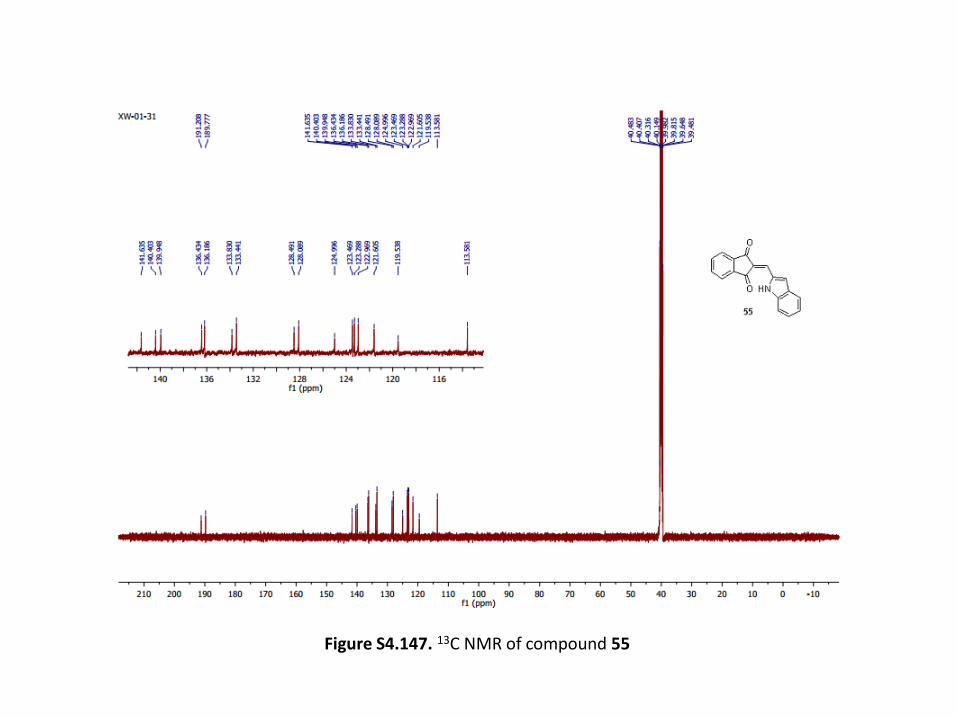
Figure S4.147. 13C NMR of compound 55
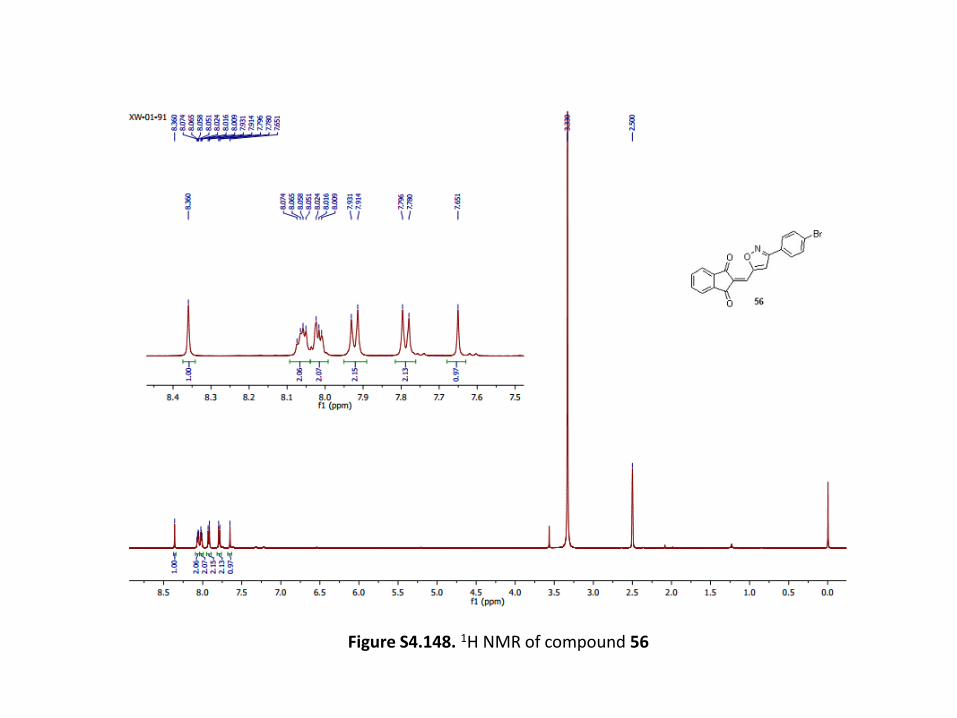
Figure S4.148. 1H NMR of compound 56
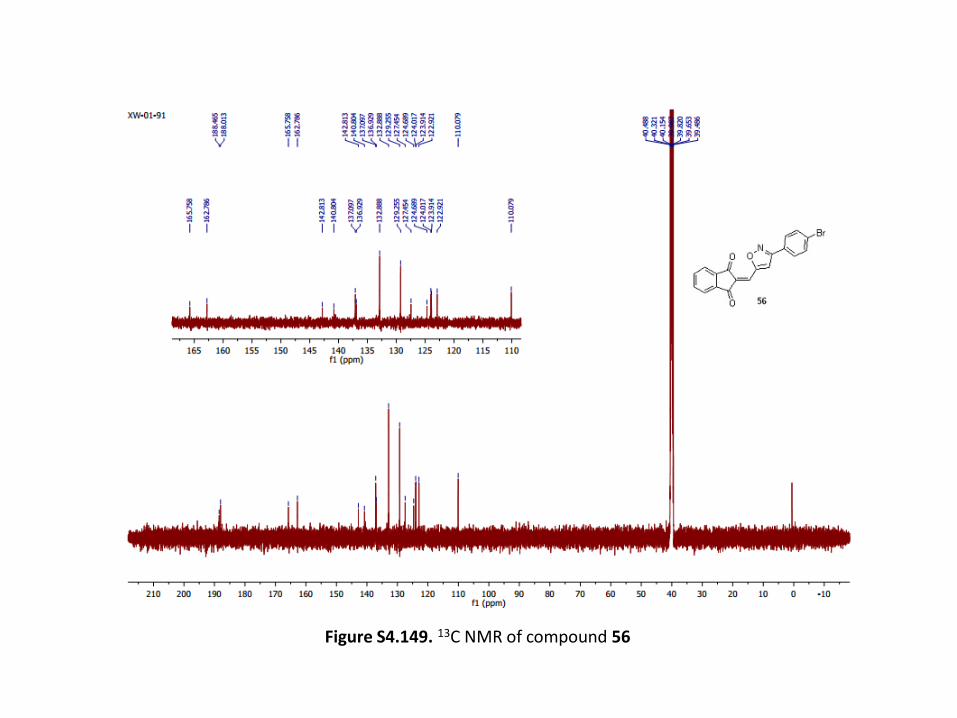
Figure S4.149. 13C NMR of compound 56
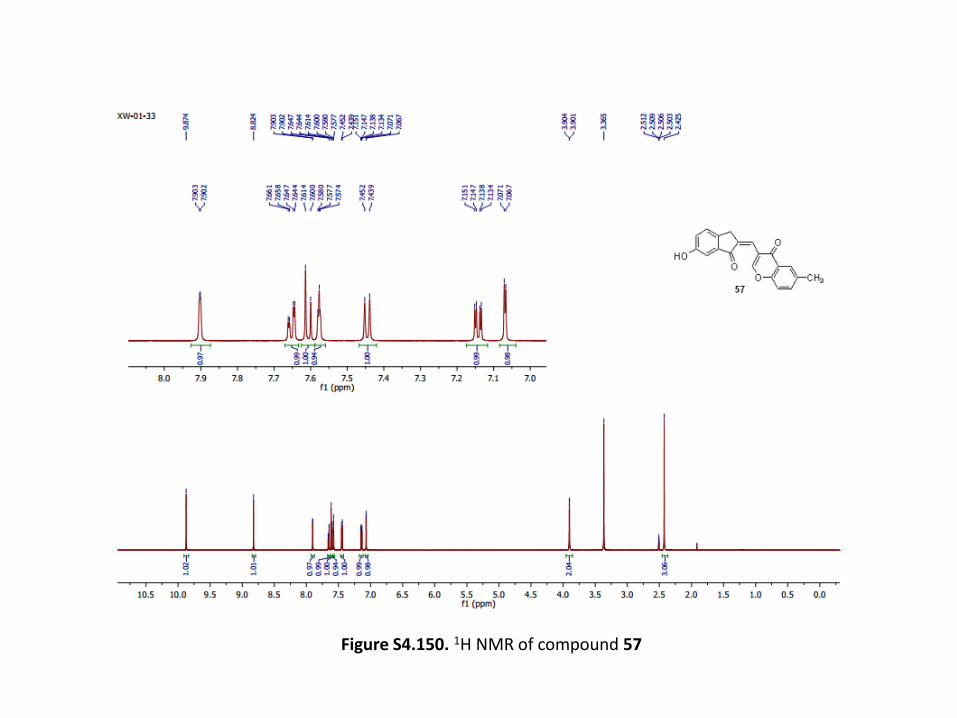
Figure S4.150. 1H NMR of compound 57
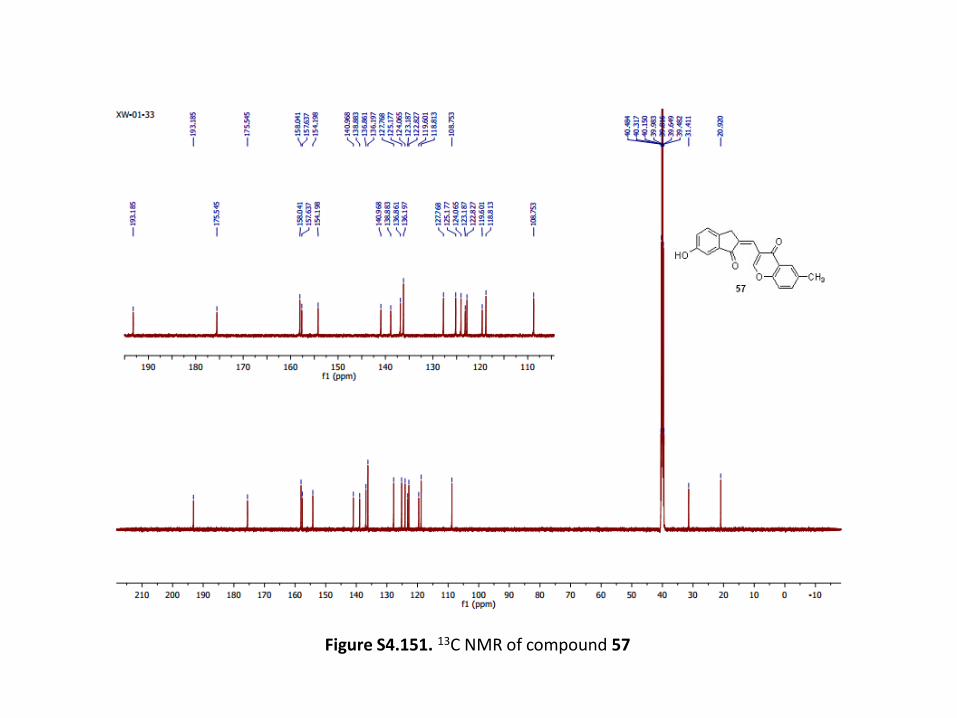
Figure S4.151. 13C NMR of compound 57
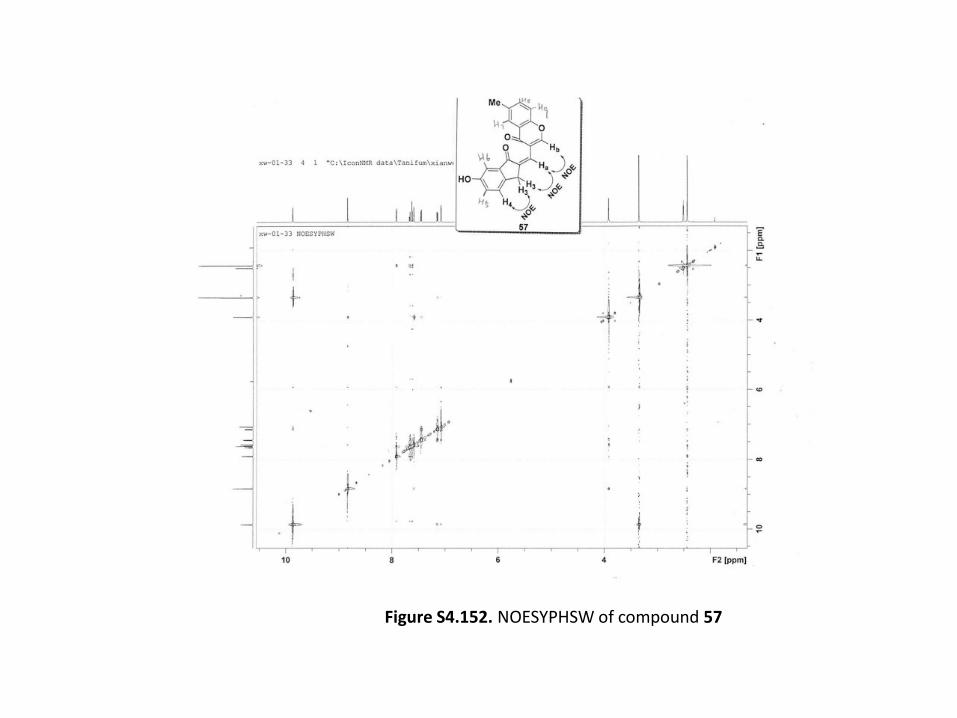
Figure S4.152. NOESYPHSW of compound 57
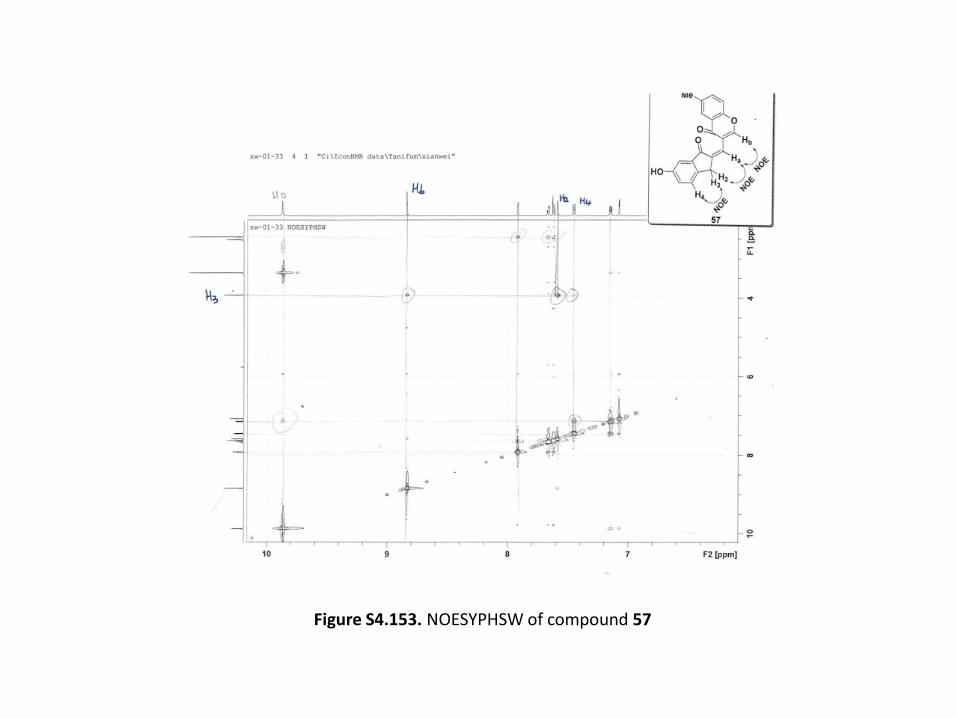
Figure S4.153. NOESYPHSW of compound 57
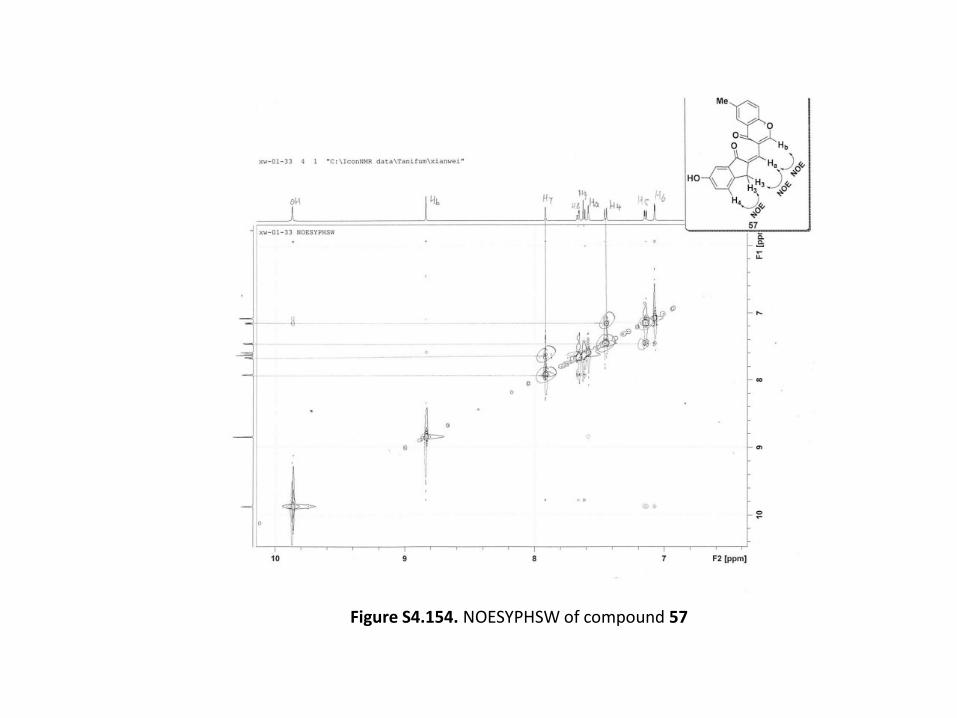
Figure S4.154. NOESYPHSW of compound 57
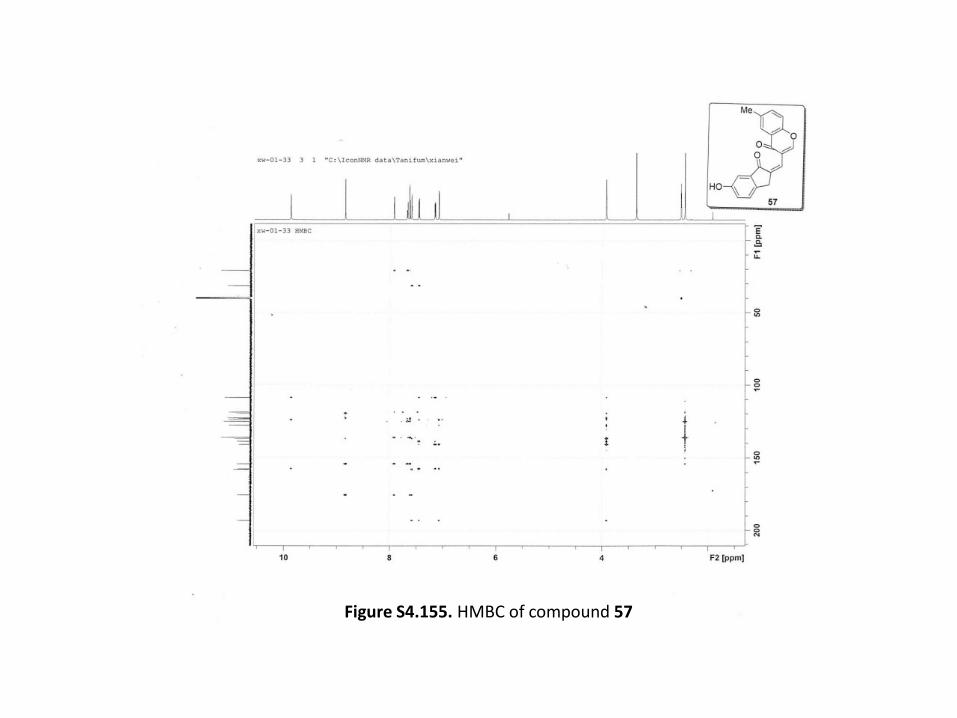
Figure S4.155. HMBC of compound 57
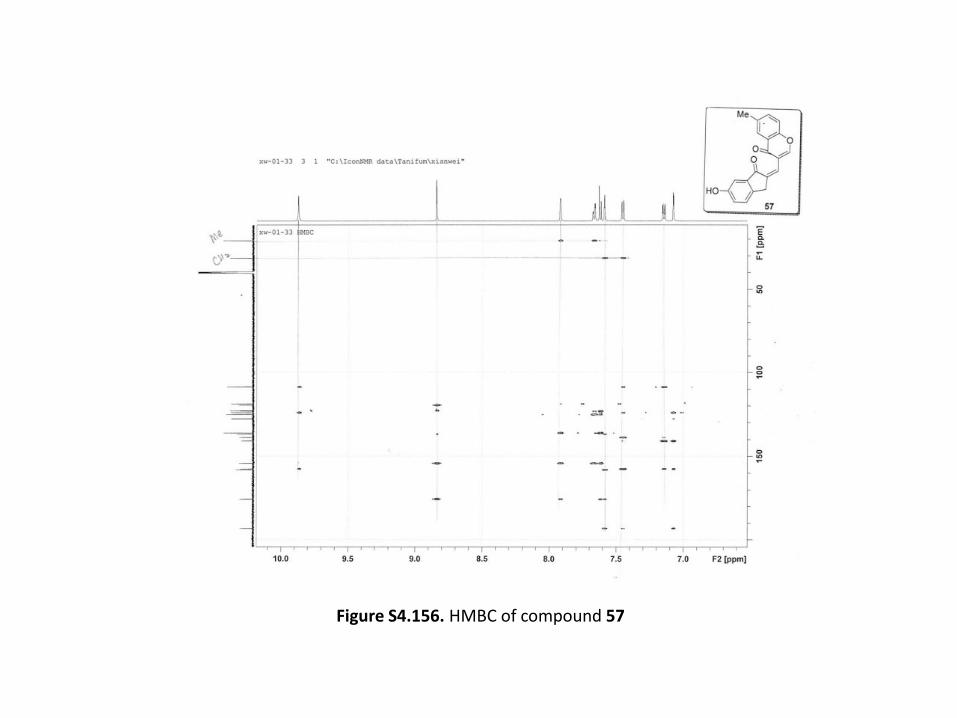
Figure S4.156. HMBC of compound 57
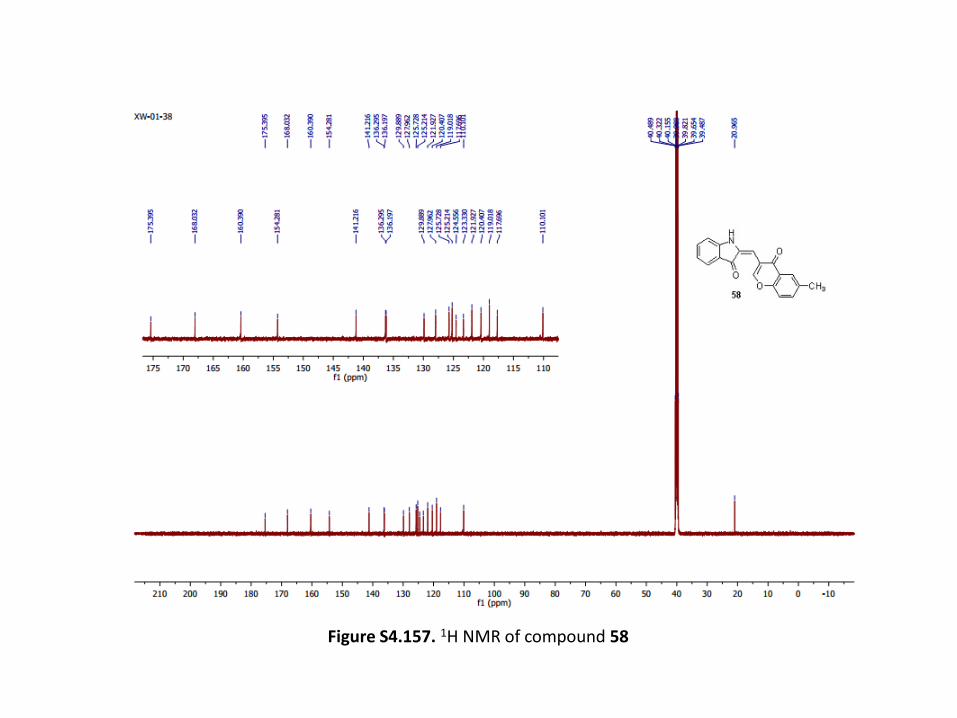
Figure S4.157. 1H NMR of compound 58
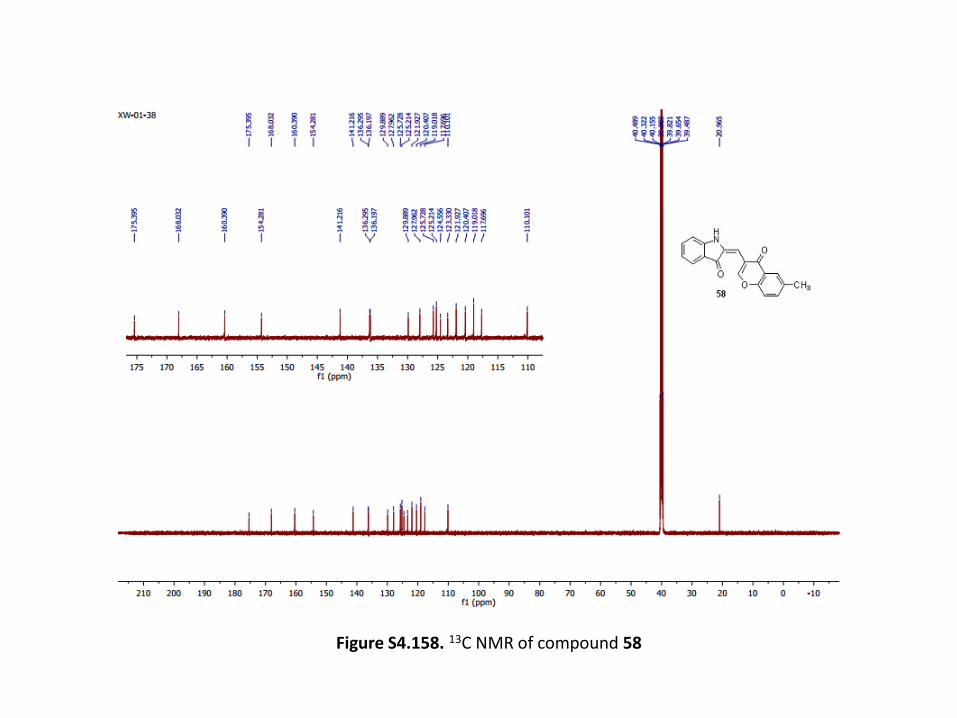
Figure S4.158. 13C NMR of compound 58

download fileview on ChemRxivSupporting Information.pdf (9.03 MiB)


![Total Synthesis and Evaluation of [ψ[CH 2 NH]Tpg 4 ] Vancomycin Aglycon: Reengineering Vancomycin for Dual D -Ala- D - Ala and D -Ala- D -Lac Binding Brendan.](https://static.fdocument.org/doc/165x107/56649d1b5503460f949f12a1/total-synthesis-and-evaluation-of-ch-2-nhtpg-4-vancomycin-aglycon-reengineering.jpg)