Structure and properties of a model oxide-supported...
15
Structure and properties of a model oxide-supported catalyst under redox conditions: WO x /α-Fe 2 O 3 (0001) M.E. McBriarty a, b , M.J. Bedzyk a, b, c , D.E. Ellis b, c, d, ⁎ a Dept. of Materials Science & Engineering, Northwestern University, Evanston, IL 60208, United States b Institute for Catalysis in Energy Processes, Northwestern University, Evanston, IL 60208, United States c Dept. of Physics & Astronomy, Northwestern University, Evanston, IL 60208, United States d Dept. of Chemistry, Northwestern University, Evanston, IL 60208, United States abstract article info Article history: Received 25 October 2011 Accepted 23 April 2012 Available online 16 May 2012 Keywords: Oxide surface Metal adsorption Density functional X-ray standing wave XAFS Relaxed structures and the related electronic environments of atomic monolayers and half-monolayers of tungsten with varying degrees of oxidation on the (0001) surface of hematite (α-Fe 2 O 3 ) are modeled using first-principles density functional theory (DFT). This report focuses on the effect of nominally oxidizing and reducing chemical environments on surface structure and chemistry. By considering the position of W atoms relative to the substrate, calculated surface structures are compared to synchrotron X-ray standing wave (XSW) imaging results recently reported for this system. The question of W valence state, previously reported as nominally W 5+ or W 6+ in reducing or oxidizing surroundings, respectively, is addressed and discussed in light of X-ray photoelectron spectroscopy (XPS) and extended X-ray absorption fine structure (XAFS) results to clarify the relationship between valence state, oxygen coordination, and bond lengths. © 2012 Elsevier B.V. All rights reserved. 1. Introduction Low-coverage layers of transition metals or their oxides atop oxide substrates of different compositions are of interest for various applications, most notably gas sensing and catalysis [1,2]. For oxide- supported heterogeneous catalysts, the catalytic selectivity and activity for specific reactions are defined by the composition of both the oxide substrate and the metal or metal oxide overlayer and the structure of the interface. The atomic and electronic structures of surface active sites must be well defined in order to understand the catalytic mechanism and for the rational design of reaction pathways with catalysts [3]. In previous work [4,5], density functional theory (DFT) has been combined with surface-sensitive X-ray techniques to characterize monolayer and sub-monolayer coverage vanadium oxides (VO x ) on α-Fe 2 O 3 (hematite) (0001) surfaces under relevant chemical conditions. X-ray photoelectron spectroscopy (XPS) was employed to probe chem- ical changes when the surface was subjected to oxidizing and reducing conditions [6]. X-ray standing wave (XSW) imaging provided a sub- atomic-scale map of V positions relative to the hematite lattice under the same chemical conditions. Each of these methods revealed that chemically induced changes in the surface structure were reversible, in- dicating “redox reversibility”, an important quality in catalytic behavior. With the use of the same experimental methodology, the structure and chemical properties of a similar heterogeneous catalyst [7], tungsten oxide (WO x ) atop the hematite (0001) surface, have recently been elu- cidated [8]. While XSW has provided insight on the positions of metal cations at the surface with respect to bulk cation positions, it is not possible to resolve the configuration of surface oxygen and iron atoms with the present experimental methodology. These details of surface stoichi- ometry and reconstruction are necessary to elucidate the chemical mechanisms underpinning catalysis and the contributions of both W and Fe, which provide acidic sites for catalytic reactions [9–11]. For example, mixed W–Fe catalysts are considered for potential heavy gas oil hydrotreatment needed for extraction of petroleum from oil sands and tars. The interactions between the two metals and with the oxide support in forming active catalytic complexes which lead to desirable ac- tivity and selectivity remain essentially unknown. In this work, DFT is employed to explore several proposed surface structures under both ideal (dry) and hydroxylated conditions. EXAFS results for 1/3 monolayer (ML) WO x on hematite (0001) are also discussed in light of theoretical predictions based upon embedded cluster models. Slab model DFT calculations were performed for half-ML and ML W on O- and Fe-terminated hematite (0001) surfaces. Self-consistent struc- tural relaxations were carried out, followed by detailed density of states (DOS) calculations. After the details of the methodology are outlined, re- sults will be presented for half-ML W coverage on O-terminated hematite (0001), revealing the consequences of varying O coordination, hydroxyl- ation, and surface O vacancies on the surface structure and chemical properties. The effect of additional surface Fe will be discussed under the same light, as well as full ML coverage of W. After a short commentary on corrections for well-known strongly correlated electron effects in iron Surface Science 606 (2012) 1367–1381 ⁎ Corresponding author at: Dept. of Physics & Astronomy, Northwestern University, Evanston, IL 60208, United States. Tel.: +847-491-3665; fax: +847 491 9982. E-mail address: [email protected] (D.E. Ellis). 0039-6028/$ – see front matter © 2012 Elsevier B.V. All rights reserved. doi:10.1016/j.susc.2012.04.023 Contents lists available at SciVerse ScienceDirect Surface Science journal homepage: www.elsevier.com/locate/susc
Transcript of Structure and properties of a model oxide-supported...
Surface Science 606 (2012) 1367–1381
Contents lists available at SciVerse ScienceDirect
Surface Science
j ourna l homepage: www.e lsev ie r .com/ locate /susc
Structure and properties of a model oxide-supported catalyst under redox conditions:WOx/α-Fe2O3 (0001)
M.E. McBriarty a,b, M.J. Bedzyk a,b,c, D.E. Ellis b,c,d,⁎a Dept. of Materials Science & Engineering, Northwestern University, Evanston, IL 60208, United Statesb Institute for Catalysis in Energy Processes, Northwestern University, Evanston, IL 60208, United Statesc Dept. of Physics & Astronomy, Northwestern University, Evanston, IL 60208, United Statesd Dept. of Chemistry, Northwestern University, Evanston, IL 60208, United States
⁎ Corresponding author at: Dept. of Physics & AstronoEvanston, IL 60208, United States. Tel.: +847-491-3665
E-mail address: [email protected] (D.E. El
0039-6028/$ – see front matter © 2012 Elsevier B.V. Alldoi:10.1016/j.susc.2012.04.023
a b s t r a c t
a r t i c l e i n f oArticle history:Received 25 October 2011Accepted 23 April 2012Available online 16 May 2012
Keywords:Oxide surfaceMetal adsorptionDensity functionalX-ray standing waveXAFS
Relaxed structures and the related electronic environments of atomic monolayers and half-monolayers oftungsten with varying degrees of oxidation on the (0001) surface of hematite (α-Fe2O3) are modeled usingfirst-principles density functional theory (DFT). This report focuses on the effect of nominally oxidizingand reducing chemical environments on surface structure and chemistry. By considering the position of Watoms relative to the substrate, calculated surface structures are compared to synchrotron X-ray standing wave(XSW) imaging results recently reported for this system. The question of W valence state, previously reportedas nominally W5+ or W6+ in reducing or oxidizing surroundings, respectively, is addressed and discussed inlight of X-ray photoelectron spectroscopy (XPS) and extended X-ray absorption fine structure (XAFS) results toclarify the relationship between valence state, oxygen coordination, and bond lengths.
© 2012 Elsevier B.V. All rights reserved.
1. Introduction
Low-coverage layers of transition metals or their oxides atopoxide substrates of different compositions are of interest for variousapplications, most notably gas sensing and catalysis [1,2]. For oxide-supported heterogeneous catalysts, the catalytic selectivity and activityfor specific reactions are defined by the composition of both the oxidesubstrate and the metal or metal oxide overlayer and the structure ofthe interface. The atomic and electronic structures of surface active sitesmust be well defined in order to understand the catalytic mechanismand for the rational design of reaction pathways with catalysts [3].
In previous work [4,5], density functional theory (DFT) has beencombined with surface-sensitive X-ray techniques to characterizemonolayer and sub-monolayer coverage vanadium oxides (VOx) onα-Fe2O3 (hematite) (0001) surfaces under relevant chemical conditions.X-ray photoelectron spectroscopy (XPS) was employed to probe chem-ical changes when the surface was subjected to oxidizing and reducingconditions [6]. X-ray standing wave (XSW) imaging provided a sub-atomic-scale map of V positions relative to the hematite lattice underthe same chemical conditions. Each of these methods revealed thatchemically induced changes in the surface structure were reversible, in-dicating “redox reversibility”, an important quality in catalytic behavior.With the use of the same experimental methodology, the structure andchemical properties of a similar heterogeneous catalyst [7], tungsten
my, Northwestern University,; fax: +847 491 9982.lis).
rights reserved.
oxide (WOx) atop the hematite (0001) surface, have recently been elu-cidated [8].
While XSW has provided insight on the positions of metal cationsat the surface with respect to bulk cation positions, it is not possible toresolve the configuration of surface oxygen and iron atoms with thepresent experimental methodology. These details of surface stoichi-ometry and reconstruction are necessary to elucidate the chemicalmechanisms underpinning catalysis and the contributions of both Wand Fe, which provide acidic sites for catalytic reactions [9–11]. Forexample, mixed W–Fe catalysts are considered for potential heavy gasoil hydrotreatment needed for extraction of petroleum from oil sandsand tars. The interactions between the two metals and with the oxidesupport in forming active catalytic complexes which lead to desirable ac-tivity and selectivity remain essentially unknown. In this work, DFT isemployed to explore several proposed surface structures under bothideal (dry) andhydroxylated conditions. EXAFS results for 1/3 monolayer(ML) WOx on hematite (0001) are also discussed in light of theoreticalpredictions based upon embedded cluster models.
Slab model DFT calculations were performed for half-ML and ML Won O- and Fe-terminated hematite (0001) surfaces. Self-consistent struc-tural relaxations were carried out, followed by detailed density of states(DOS) calculations. After the details of the methodology are outlined, re-sultswill be presented for half-MLWcoverage onO-terminated hematite(0001), revealing the consequences of varying O coordination, hydroxyl-ation, and surface O vacancies on the surface structure and chemicalproperties. The effect of additional surface Fe will be discussed underthe same light, aswell as fullML coverage ofW. After a short commentaryon corrections for well-known strongly correlated electron effects in iron
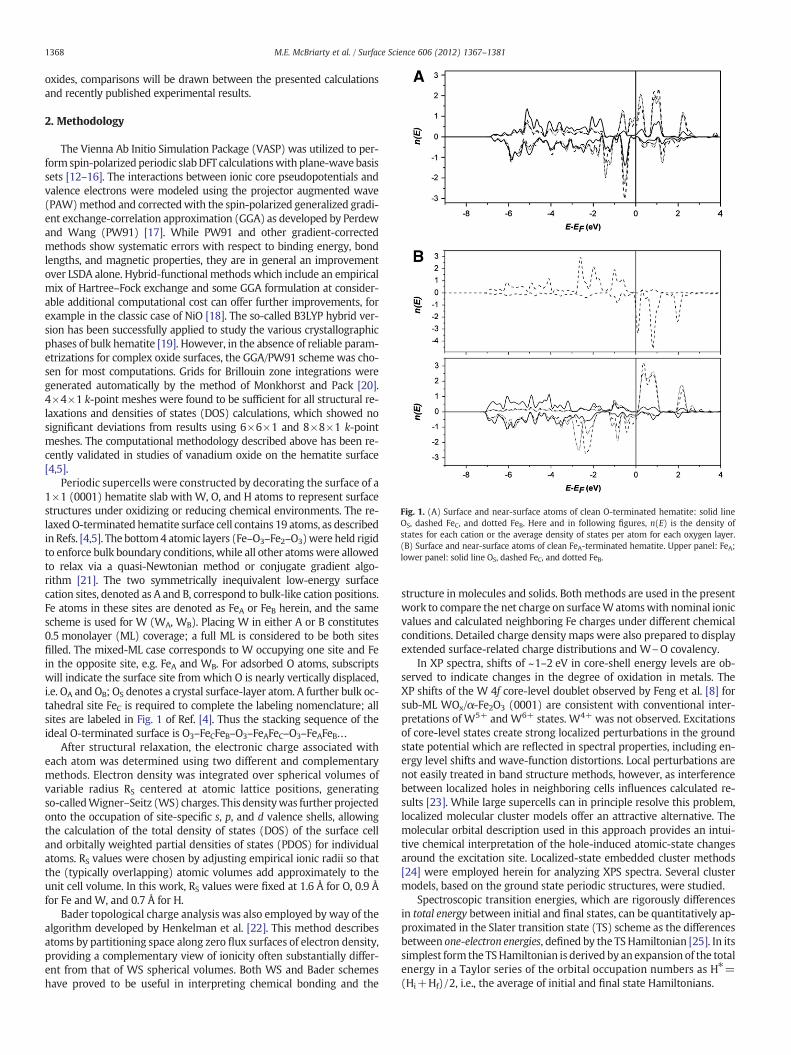
Fig. 1. (A) Surface and near-surface atoms of clean O-terminated hematite: solid lineOS, dashed FeC, and dotted FeB. Here and in following figures, n(E) is the density ofstates for each cation or the average density of states per atom for each oxygen layer.(B) Surface and near-surface atoms of clean FeA-terminated hematite. Upper panel: FeA;lower panel: solid line OS, dashed FeC, and dotted FeB.
1368 M.E. McBriarty et al. / Surface Science 606 (2012) 1367–1381
oxides, comparisons will be drawn between the presented calculationsand recently published experimental results.
2. Methodology
The Vienna Ab Initio Simulation Package (VASP) was utilized to per-form spin-polarized periodic slabDFT calculationswith plane-wave basissets [12–16]. The interactions between ionic core pseudopotentials andvalence electrons were modeled using the projector augmented wave(PAW)method and correctedwith the spin-polarized generalized gradi-ent exchange-correlation approximation (GGA) as developed by Perdewand Wang (PW91) [17]. While PW91 and other gradient-correctedmethods show systematic errors with respect to binding energy, bondlengths, and magnetic properties, they are in general an improvementover LSDA alone. Hybrid-functional methods which include an empiricalmix of Hartree–Fock exchange and some GGA formulation at consider-able additional computational cost can offer further improvements, forexample in the classic case of NiO [18]. The so-called B3LYP hybrid ver-sion has been successfully applied to study the various crystallographicphases of bulk hematite [19]. However, in the absence of reliable param-etrizations for complex oxide surfaces, the GGA/PW91 scheme was cho-sen for most computations. Grids for Brillouin zone integrations weregenerated automatically by the method of Monkhorst and Pack [20].4×4×1 k-point meshes were found to be sufficient for all structural re-laxations and densities of states (DOS) calculations, which showed nosignificant deviations from results using 6×6×1 and 8×8×1 k-pointmeshes. The computational methodology described above has been re-cently validated in studies of vanadium oxide on the hematite surface[4,5].
Periodic supercells were constructed by decorating the surface of a1×1 (0001) hematite slab with W, O, and H atoms to represent surfacestructures under oxidizing or reducing chemical environments. The re-laxedO-terminated hematite surface cell contains 19 atoms, as describedin Refs. [4,5]. The bottom4 atomic layers (Fe–O3–Fe2–O3)were held rigidto enforce bulk boundary conditions, while all other atomswere allowedto relax via a quasi-Newtonian method or conjugate gradient algo-rithm [21]. The two symmetrically inequivalent low-energy surfacecation sites, denoted as A and B, correspond to bulk-like cation positions.Fe atoms in these sites are denoted as FeA or FeB herein, and the samescheme is used for W (WA, WB). Placing W in either A or B constitutes0.5 monolayer (ML) coverage; a full ML is considered to be both sitesfilled. The mixed-ML case corresponds to W occupying one site and Fein the opposite site, e.g. FeA and WB. For adsorbed O atoms, subscriptswill indicate the surface site from which O is nearly vertically displaced,i.e. OA and OB; OS denotes a crystal surface-layer atom. A further bulk oc-tahedral site FeC is required to complete the labeling nomenclature; allsites are labeled in Fig. 1 of Ref. [4]. Thus the stacking sequence of theideal O-terminated surface is O3–FeCFeB–O3–FeAFeC–O3–FeAFeB…
After structural relaxation, the electronic charge associated witheach atom was determined using two different and complementarymethods. Electron density was integrated over spherical volumes ofvariable radius RS centered at atomic lattice positions, generatingso-calledWigner–Seitz (WS) charges. This densitywas further projectedonto the occupation of site-specific s, p, and d valence shells, allowingthe calculation of the total density of states (DOS) of the surface celland orbitally weighted partial densities of states (PDOS) for individualatoms. RS values were chosen by adjusting empirical ionic radii so thatthe (typically overlapping) atomic volumes add approximately to theunit cell volume. In this work, RS values were fixed at 1.6 Å for O, 0.9 Åfor Fe andW, and 0.7 Å for H.
Bader topological charge analysis was also employed by way of thealgorithm developed by Henkelman et al. [22]. This method describesatoms by partitioning space along zero flux surfaces of electron density,providing a complementary view of ionicity often substantially differ-ent from that of WS spherical volumes. Both WS and Bader schemeshave proved to be useful in interpreting chemical bonding and the
structure in molecules and solids. Bothmethods are used in the presentwork to compare the net charge on surfaceWatomswith nominal ionicvalues and calculated neighboring Fe charges under different chemicalconditions. Detailed charge density maps were also prepared to displayextended surface-related charge distributions and W\O covalency.
In XP spectra, shifts of ~1–2 eV in core-shell energy levels are ob-served to indicate changes in the degree of oxidation in metals. TheXP shifts of the W 4f core-level doublet observed by Feng et al. [8] forsub-ML WOx/α-Fe2O3 (0001) are consistent with conventional inter-pretations of W5+ and W6+ states. W4+ was not observed. Excitationsof core-level states create strong localized perturbations in the groundstate potential which are reflected in spectral properties, including en-ergy level shifts and wave-function distortions. Local perturbations arenot easily treated in band structure methods, however, as interferencebetween localized holes in neighboring cells influences calculated re-sults [23]. While large supercells can in principle resolve this problem,localized molecular cluster models offer an attractive alternative. Themolecular orbital description used in this approach provides an intui-tive chemical interpretation of the hole-induced atomic-state changesaround the excitation site. Localized-state embedded cluster methods[24] were employed herein for analyzing XPS spectra. Several clustermodels, based on the ground state periodic structures, were studied.
Spectroscopic transition energies, which are rigorously differencesin total energy between initial and final states, can be quantitatively ap-proximated in the Slater transition state (TS) scheme as the differencesbetween one-electron energies, defined by the TSHamiltonian [25]. In itssimplest form the TSHamiltonian is derived by an expansion of the totalenergy in a Taylor series of the orbital occupation numbers as H⁎=(Hi+Hf)/2, i.e., the average of initial and final state Hamiltonians.
1369M.E. McBriarty et al. / Surface Science 606 (2012) 1367–1381
This procedure is easily implemented in Hartree–Fock and DFTcodes, and it is used in the present work to model shifts in W 4f XPspectra.
3. Results
The interlayer spacings of clean hematite surfaces with differentoxygen coverages calculated by the model used herein are in goodagreement with previously calculated data by Bergermayer et al. [26]and Jin et al. [4], as shown in Table 1. This comparison and previousstudies using the same methodology on vanadium oxide-terminatedhematite surfaces [4,5] lend confidence to the computational proce-dures used in this work.
A cross-section of relaxed structures with varying coverages of Wand Fe with/without coadsorbed oxygen is given in Figures below.The partial densities of states (PDOS) given in Fig. 1A and B showthe very different energy landscapes of the clean oxygen- vs. iron-terminated hematite (0001) surfaces. These are the ground-state sur-faces expressed under different oxidizing conditions as proposed byWang et al. [27]. Understandably, in the former case, the O sp valenceband (VB) of width ~7 eV dominates, showing strong ionic-covalentmixtures from subsurface FeB and FeC sites which induce a small netmagnetism. This phenomenon is in agreement with theoretical resultsfor the (0001) hematite surface obtained from different methodologiesin Ref. [27]. In the latter case, strongmagnetic features of the FeA termi-nal layer are evident in occupied states within 3 eV of the Fermi energyEF and in the low-lying excited state region.
3.1. Half-monolayer W
3.1.1. O-terminated substrate: 0, 1/3 and 1 ML coadsorbed oxygenStructures with varying degrees of oxygen coadsorption were in-
vestigated for 0.5 ML W adsorbed to a clean O-terminated hematitesurface (terminal layers O3–Fe–… are referred to as (I) in the following).Here, a single W atom was placed in either the A or B cation surface site(WA, WB) of a 1×1 supercell, and the opposite surface site was keptempty. These surfaces were then modeled with 0, 1/3, and 1 ML ofoverlayer-adsorbed O′ to study the adsorption and oxidation statesof surface-bound tungsten. In addition to the c-axis dislocations dis-cussed throughout, and in experimental emphasis, nontrivial x- andy-dislocations are also predicted, whichmay amount tomore than 1 Å inhighly nonsymmetric and defected sites. Nevertheless, it remains gener-ally possible to clearly identify A- and B-site cation origins. Structuraldata derived from selected ground-state periodic cells, including inter-layer and interatomic distances, are provided in Tables 2 and 3. Thepredicted cohesive energy and W net charge, as determined from bothRS volume integration and Bader schemes, are provided in Table 4 forthese structures and additional unstable isostoichiometric structures
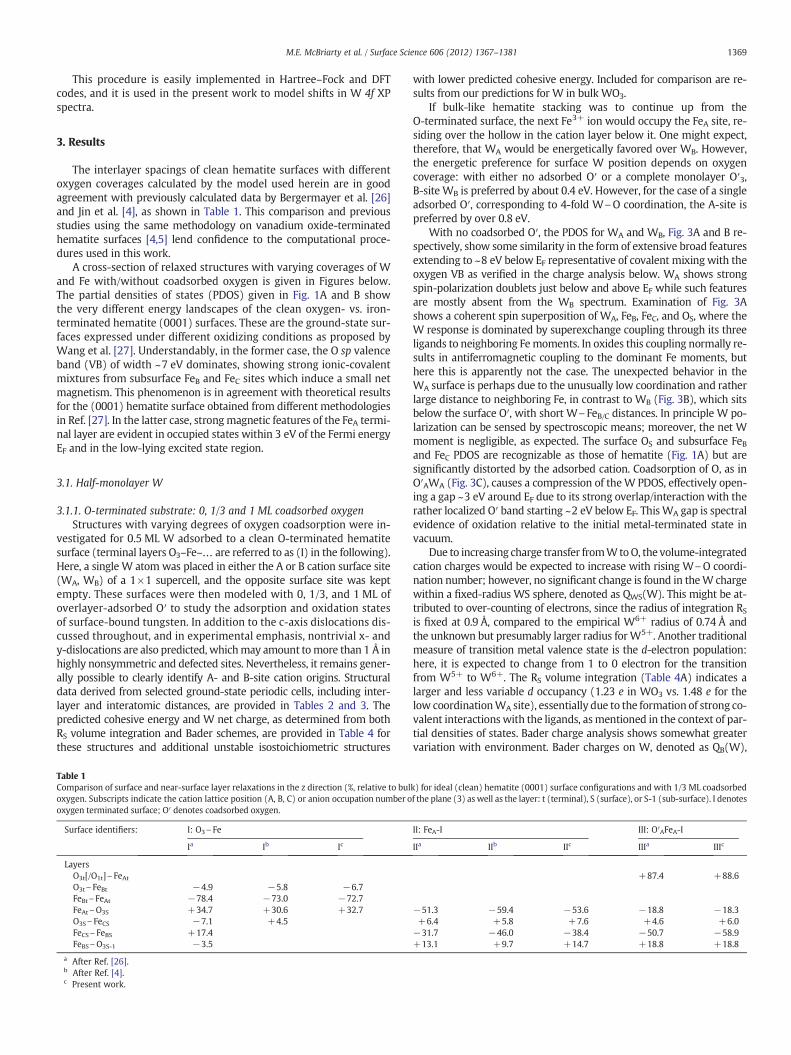
Table 1Comparison of surface and near-surface layer relaxations in the z direction (%, relative to buloxygen. Subscripts indicate the cation lattice position (A, B, C) or anion occupation number ooxygen terminated surface; O′ denotes coadsorbed oxygen.
Surface identifiers: I: O3\Fe
Ia Ib Ic
LayersO3t[/O1t]\FeAtO3t\FeBt −4.9 −5.8 −6.7FeBt\FeAt −78.4 −73.0 −72.7FeAt\O3S +34.7 +30.6 +32.7O3S\FeCS −7.1 +4.5FeCS\FeBS +17.4FeBS\O3S-1 −3.5
a After Ref. [26].b After Ref. [4].c Present work.
with lower predicted cohesive energy. Included for comparison are re-sults from our predictions for W in bulk WO3.
If bulk-like hematite stacking was to continue up from theO-terminated surface, the next Fe3+ ion would occupy the FeA site, re-siding over the hollow in the cation layer below it. One might expect,therefore, that WA would be energetically favored over WB. However,the energetic preference for surface W position depends on oxygencoverage: with either no adsorbed O′ or a complete monolayer O′3,B-site WB is preferred by about 0.4 eV. However, for the case of a singleadsorbed O′, corresponding to 4-fold W\O coordination, the A-site ispreferred by over 0.8 eV.
With no coadsorbed O′, the PDOS for WA and WB, Fig. 3A and B re-spectively, show some similarity in the form of extensive broad featuresextending to ~8 eV below EF representative of covalent mixing with theoxygen VB as verified in the charge analysis below. WA shows strongspin-polarization doublets just below and above EF while such featuresare mostly absent from the WB spectrum. Examination of Fig. 3Ashows a coherent spin superposition of WA, FeB, FeC, and OS, where theW response is dominated by superexchange coupling through its threeligands to neighboring Femoments. In oxides this coupling normally re-sults in antiferromagnetic coupling to the dominant Fe moments, buthere this is apparently not the case. The unexpected behavior in theWA surface is perhaps due to the unusually low coordination and ratherlarge distance to neighboring Fe, in contrast to WB (Fig. 3B), which sitsbelow the surface O′, with short W\FeB/C distances. In principle W po-larization can be sensed by spectroscopic means; moreover, the net Wmoment is negligible, as expected. The surface OS and subsurface FeBand FeC PDOS are recognizable as those of hematite (Fig. 1A) but aresignificantly distorted by the adsorbed cation. Coadsorption of O, as inO′AWA (Fig. 3C), causes a compression of theW PDOS, effectively open-ing a gap ~3 eV around EF due to its strong overlap/interaction with therather localized O′ band starting ~2 eV below EF. ThisWA gap is spectralevidence of oxidation relative to the initial metal-terminated state invacuum.
Due to increasing charge transfer fromWtoO, the volume-integratedcation charges would be expected to increase with rising W\O coordi-nation number; however, no significant change is found in theW chargewithin a fixed-radius WS sphere, denoted as QWS(W). This might be at-tributed to over-counting of electrons, since the radius of integration RS
is fixed at 0.9 Å, compared to the empirical W6+ radius of 0.74 Å andthe unknown but presumably larger radius forW5+. Another traditionalmeasure of transition metal valence state is the d-electron population:here, it is expected to change from 1 to 0 electron for the transitionfrom W5+ to W6+. The RS volume integration (Table 4A) indicates alarger and less variable d occupancy (1.23 e in WO3 vs. 1.48 e for thelow coordinationWA site), essentially due to the formation of strong co-valent interactions with the ligands, asmentioned in the context of par-tial densities of states. Bader charge analysis shows somewhat greatervariation with environment. Bader charges on W, denoted as QB(W),
k) for ideal (clean) hematite (0001) surface configurations and with 1/3 ML coadsorbedf the plane (3) as well as the layer: t (terminal), S (surface), or S-1 (sub-surface). I denotes
II: FeA-I III: O′AFeA-I
IIa IIb IIc IIIa IIIc
+87.4 +88.6
−51.3 −59.4 −53.6 −18.8 −18.3+6.4 +5.8 +7.6 +4.6 +6.0
−31.7 −46.0 −38.4 −50.7 −58.9+13.1 +9.7 +14.7 +18.8 +18.8
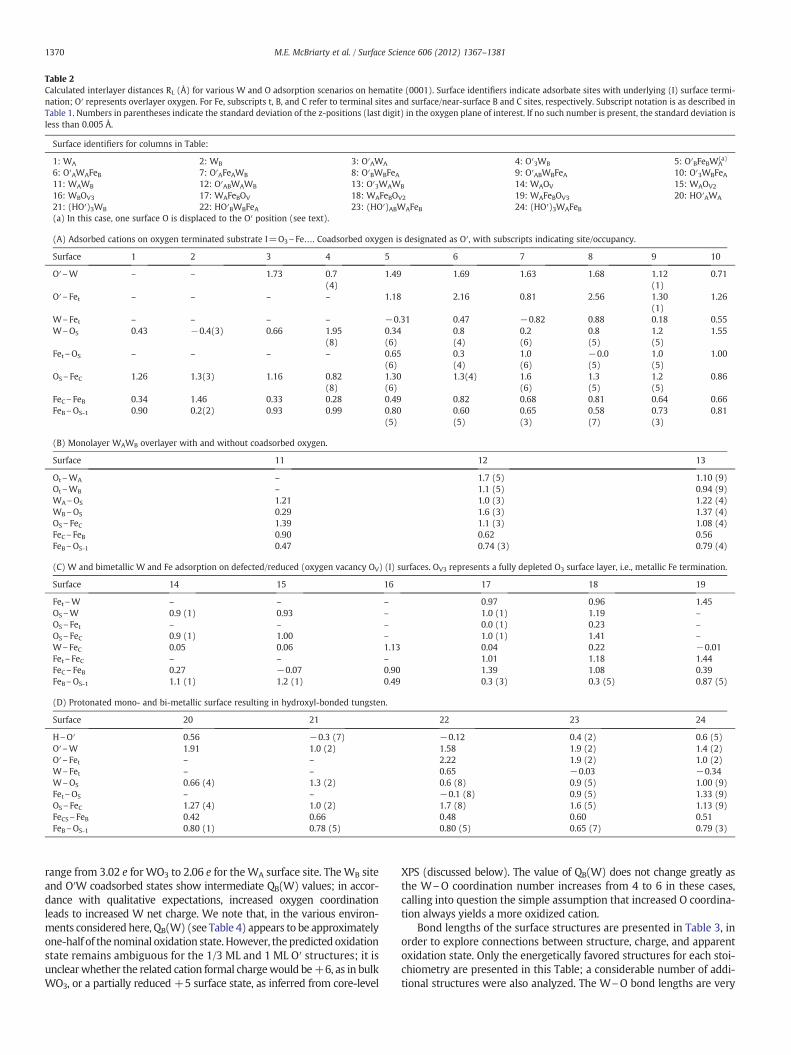
Table 2Calculated interlayer distances RL (Å) for various W and O adsorption scenarios on hematite (0001). Surface identifiers indicate adsorbate sites with underlying (I) surface termi-nation; O′ represents overlayer oxygen. For Fe, subscripts t, B, and C refer to terminal sites and surface/near-surface B and C sites, respectively. Subscript notation is as described inTable 1. Numbers in parentheses indicate the standard deviation of the z-positions (last digit) in the oxygen plane of interest. If no such number is present, the standard deviation isless than 0.005 Å.
Surface identifiers for columns in Table:
1: WA 2: WB 3: O′AWA 4: O′3WB 5: O′BFeBWA(a)
6: O′AWAFeB 7: O′AFeAWB 8: O′BWBFeA 9: O′ABWBFeA 10: O′3WBFeA11: WAWB 12: O′ABWAWB 13: O′3WAWB 14: WAOV 15: WAOV2
16: WBOV3 17: WAFeBOV 18: WAFeBOV2 19: WAFeBOV3 20: HO′AWA
21: (HO′)3WB 22: HO′BWBFeA 23: (HO′)ABWAFeB 24: (HO′)3WAFeB(a) In this case, one surface O is displaced to the O′ position (see text).
(A) Adsorbed cations on oxygen terminated substrate I=O3\Fe…. Coadsorbed oxygen is designated as O′, with subscripts indicating site/occupancy.
Surface 1 2 3 4 5 6 7 8 9 10
O′\W – – 1.73 0.7(4)
1.49 1.69 1.63 1.68 1.12(1)
0.71
O′\Fet – – – – 1.18 2.16 0.81 2.56 1.30(1)
1.26
W\Fet – – – – −0.31 0.47 −0.82 0.88 0.18 0.55W\OS 0.43 −0.4(3) 0.66 1.95
(8)0.34(6)
0.8(4)
0.2(6)
0.8(5)
1.2(5)
1.55
Fet\OS – – – – 0.65(6)
0.3(4)
1.0(6)
−0.0(5)
1.0(5)
1.00
OS\FeC 1.26 1.3(3) 1.16 0.82(8)
1.30(6)
1.3(4) 1.6(6)
1.3(5)
1.2(5)
0.86
FeC\FeB 0.34 1.46 0.33 0.28 0.49 0.82 0.68 0.81 0.64 0.66FeB\OS-1 0.90 0.2(2) 0.93 0.99 0.80
(5)0.60(5)
0.65(3)
0.58(7)
0.73(3)
0.81
(B) Monolayer WAWB overlayer with and without coadsorbed oxygen.
Surface 11 12 13
Ot\WA – 1.7 (5) 1.10 (9)Ot\WB – 1.1 (5) 0.94 (9)WA\OS 1.21 1.0 (3) 1.22 (4)WB\OS 0.29 1.6 (3) 1.37 (4)OS\FeC 1.39 1.1 (3) 1.08 (4)FeC\FeB 0.90 0.62 0.56FeB\OS-1 0.47 0.74 (3) 0.79 (4)
(C) W and bimetallic W and Fe adsorption on defected/reduced (oxygen vacancy OV) (I) surfaces. OV3 represents a fully depleted O3 surface layer, i.e., metallic Fe termination.
Surface 14 15 16 17 18 19
Fet\W – – – 0.97 0.96 1.45OS\W 0.9 (1) 0.93 – 1.0 (1) 1.19 –
OS\Fet – – – 0.0 (1) 0.23 –
OS\FeC 0.9 (1) 1.00 – 1.0 (1) 1.41 –
W\FeC 0.05 0.06 1.13 0.04 0.22 −0.01Fet\FeC – – – 1.01 1.18 1.44FeC\FeB 0.27 −0.07 0.90 1.39 1.08 0.39FeB\OS-1 1.1 (1) 1.2 (1) 0.49 0.3 (3) 0.3 (5) 0.87 (5)
(D) Protonated mono- and bi-metallic surface resulting in hydroxyl-bonded tungsten.
Surface 20 21 22 23 24
H\O′ 0.56 −0.3 (7) −0.12 0.4 (2) 0.6 (5)O′\W 1.91 1.0 (2) 1.58 1.9 (2) 1.4 (2)O′\Fet – – 2.22 1.9 (2) 1.0 (2)W\Fet – – 0.65 −0.03 −0.34W\OS 0.66 (4) 1.3 (2) 0.6 (8) 0.9 (5) 1.00 (9)Fet\OS – – −0.1 (8) 0.9 (5) 1.33 (9)OS\FeC 1.27 (4) 1.0 (2) 1.7 (8) 1.6 (5) 1.13 (9)FeCS\FeB 0.42 0.66 0.48 0.60 0.51FeB\OS-1 0.80 (1) 0.78 (5) 0.80 (5) 0.65 (7) 0.79 (3)
1370 M.E. McBriarty et al. / Surface Science 606 (2012) 1367–1381
range from 3.02 e for WO3 to 2.06 e for theWA surface site. TheWB siteand O′W coadsorbed states show intermediate QB(W) values; in accor-dance with qualitative expectations, increased oxygen coordinationleads to increased W net charge. We note that, in the various environ-ments considered here, QB(W) (see Table 4) appears to be approximatelyone-half of the nominal oxidation state. However, thepredicted oxidationstate remains ambiguous for the 1/3 ML and 1 ML O′ structures; it isunclearwhether the related cation formal chargewould be+6, as in bulkWO3, or a partially reduced +5 surface state, as inferred from core-level
XPS (discussed below). The value of QB(W) does not change greatly asthe W\O coordination number increases from 4 to 6 in these cases,calling into question the simple assumption that increased O coordina-tion always yields a more oxidized cation.
Bond lengths of the surface structures are presented in Table 3, inorder to explore connections between structure, charge, and apparentoxidation state. Only the energetically favored structures for each stoi-chiometry are presented in this Table; a considerable number of addi-tional structures were also analyzed. The W\O bond lengths are very
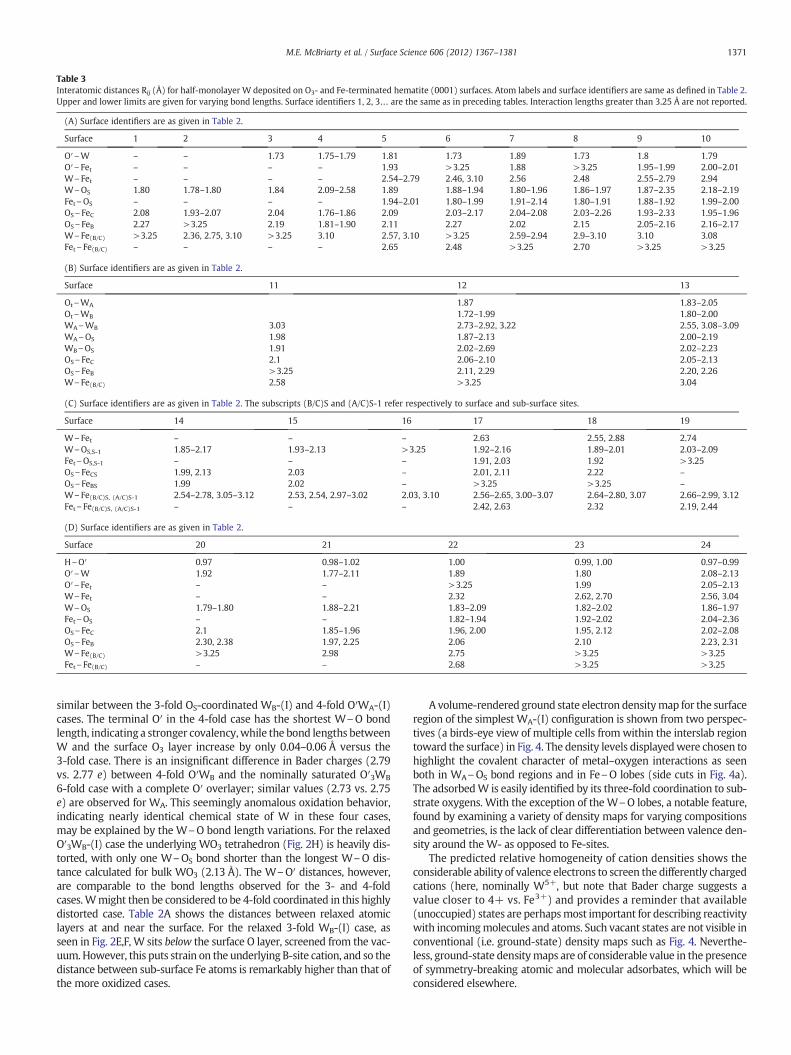
Table 3Interatomic distances Rij (Å) for half-monolayer W deposited on O3- and Fe-terminated hematite (0001) surfaces. Atom labels and surface identifiers are same as defined in Table 2.Upper and lower limits are given for varying bond lengths. Surface identifiers 1, 2, 3… are the same as in preceding tables. Interaction lengths greater than 3.25 Å are not reported.
(A) Surface identifiers are as given in Table 2.
Surface 1 2 3 4 5 6 7 8 9 10
O′\W – – 1.73 1.75–1.79 1.81 1.73 1.89 1.73 1.8 1.79O′\Fet – – – – 1.93 >3.25 1.88 >3.25 1.95–1.99 2.00–2.01W\Fet – – – – 2.54–2.79 2.46, 3.10 2.56 2.48 2.55–2.79 2.94W\OS 1.80 1.78–1.80 1.84 2.09–2.58 1.89 1.88–1.94 1.80–1.96 1.86–1.97 1.87–2.35 2.18–2.19Fet\OS – – – – 1.94–2.01 1.80–1.99 1.91–2.14 1.80–1.91 1.88–1.92 1.99–2.00OS\FeC 2.08 1.93–2.07 2.04 1.76–1.86 2.09 2.03–2.17 2.04–2.08 2.03–2.26 1.93–2.33 1.95–1.96OS\FeB 2.27 >3.25 2.19 1.81–1.90 2.11 2.27 2.02 2.15 2.05–2.16 2.16–2.17W\Fe(B/C) >3.25 2.36, 2.75, 3.10 >3.25 3.10 2.57, 3.10 >3.25 2.59–2.94 2.9–3.10 3.10 3.08Fet\Fe(B/C) – – – – 2.65 2.48 >3.25 2.70 >3.25 >3.25
(B) Surface identifiers are as given in Table 2.
Surface 11 12 13
Ot\WA 1.87 1.83–2.05Ot\WB 1.72–1.99 1.80–2.00WA\WB 3.03 2.73–2.92, 3.22 2.55, 3.08–3.09WA\OS 1.98 1.87–2.13 2.00–2.19WB\OS 1.91 2.02–2.69 2.02–2.23OS\FeC 2.1 2.06–2.10 2.05–2.13OS\FeB >3.25 2.11, 2.29 2.20, 2.26W\Fe(B/C) 2.58 >3.25 3.04
(C) Surface identifiers are as given in Table 2. The subscripts (B/C)S and (A/C)S-1 refer respectively to surface and sub-surface sites.
Surface 14 15 16 17 18 19
W\Fet – – – 2.63 2.55, 2.88 2.74W\OS,S-1 1.85–2.17 1.93–2.13 >3.25 1.92–2.16 1.89–2.01 2.03–2.09Fet\OS,S-1 – – – 1.91, 2.03 1.92 >3.25OS\FeCS 1.99, 2.13 2.03 – 2.01, 2.11 2.22 –
OS\FeBS 1.99 2.02 – >3.25 >3.25 –
W\Fe(B/C)S, (A/C)S-1 2.54–2.78, 3.05–3.12 2.53, 2.54, 2.97–3.02 2.03, 3.10 2.56–2.65, 3.00–3.07 2.64–2.80, 3.07 2.66–2.99, 3.12Fet\Fe(B/C)S, (A/C)S-1 – – – 2.42, 2.63 2.32 2.19, 2.44
(D) Surface identifiers are as given in Table 2.
Surface 20 21 22 23 24
H\O′ 0.97 0.98–1.02 1.00 0.99, 1.00 0.97–0.99O′\W 1.92 1.77–2.11 1.89 1.80 2.08–2.13O′\Fet – – >3.25 1.99 2.05–2.13W\Fet – – 2.32 2.62, 2.70 2.56, 3.04W\OS 1.79–1.80 1.88–2.21 1.83–2.09 1.82–2.02 1.86–1.97Fet\OS – – 1.82–1.94 1.92–2.02 2.04–2.36OS\FeC 2.1 1.85–1.96 1.96, 2.00 1.95, 2.12 2.02–2.08OS\FeB 2.30, 2.38 1.97, 2.25 2.06 2.10 2.23, 2.31W\Fe(B/C) >3.25 2.98 2.75 >3.25 >3.25Fet\Fe(B/C) – – 2.68 >3.25 >3.25
1371M.E. McBriarty et al. / Surface Science 606 (2012) 1367–1381
similar between the 3-fold OS-coordinated WB-(I) and 4-fold O′WA-(I)cases. The terminal O′ in the 4-fold case has the shortest W\O bondlength, indicating a stronger covalency,while the bond lengths betweenW and the surface O3 layer increase by only 0.04–0.06 Å versus the3-fold case. There is an insignificant difference in Bader charges (2.79vs. 2.77 e) between 4-fold O′WB and the nominally saturated O′3WB
6-fold case with a complete O′ overlayer; similar values (2.73 vs. 2.75e) are observed for WA. This seemingly anomalous oxidation behavior,indicating nearly identical chemical state of W in these four cases,may be explained by the W\O bond length variations. For the relaxedO′3WB-(I) case the underlying WO3 tetrahedron (Fig. 2H) is heavily dis-torted, with only one W\OS bond shorter than the longest W\O dis-tance calculated for bulk WO3 (2.13 Å). The W\O′ distances, however,are comparable to the bond lengths observed for the 3- and 4-foldcases.Wmight then be considered to be 4-fold coordinated in this highlydistorted case. Table 2A shows the distances between relaxed atomiclayers at and near the surface. For the relaxed 3-fold WB-(I) case, asseen in Fig. 2E,F, W sits below the surface O layer, screened from the vac-uum. However, this puts strain on the underlying B-site cation, and so thedistance between sub-surface Fe atoms is remarkably higher than that ofthe more oxidized cases.
A volume-rendered ground state electron densitymap for the surfaceregion of the simplest WA-(I) configuration is shown from two perspec-tives (a birds-eye view of multiple cells fromwithin the interslab regiontoward the surface) in Fig. 4. The density levels displayedwere chosen tohighlight the covalent character of metal–oxygen interactions as seenboth in WA\OS bond regions and in Fe\O lobes (side cuts in Fig. 4a).The adsorbedW is easily identified by its three-fold coordination to sub-strate oxygens. With the exception of the W\O lobes, a notable feature,found by examining a variety of density maps for varying compositionsand geometries, is the lack of clear differentiation between valence den-sity around the W- as opposed to Fe-sites.
The predicted relative homogeneity of cation densities shows theconsiderable ability of valence electrons to screen the differently chargedcations (here, nominally W5+, but note that Bader charge suggests avalue closer to 4+ vs. Fe3+) and provides a reminder that available(unoccupied) states are perhapsmost important for describing reactivitywith incomingmolecules and atoms. Such vacant states are not visible inconventional (i.e. ground-state) density maps such as Fig. 4. Neverthe-less, ground-state densitymaps are of considerable value in the presenceof symmetry-breaking atomic and molecular adsorbates, which will beconsidered elsewhere.
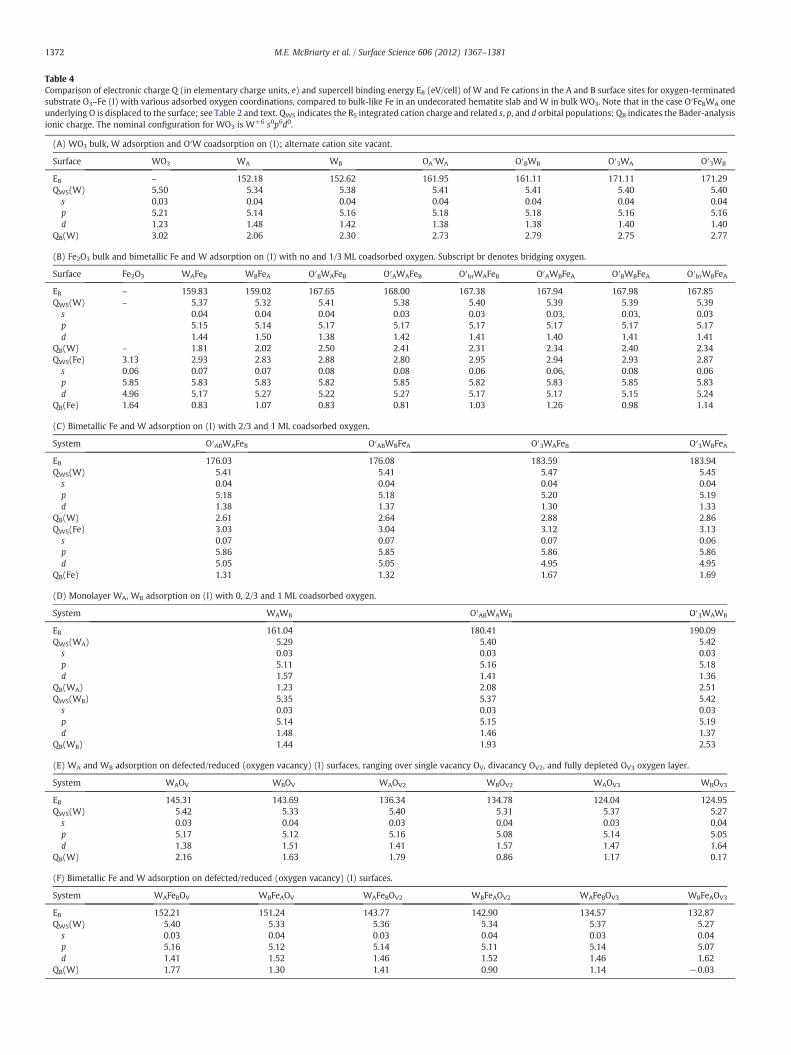
Table 4Comparison of electronic charge Q (in elementary charge units, e) and supercell binding energy EB (eV/cell) of W and Fe cations in the A and B surface sites for oxygen-terminatedsubstrate O3–Fe (I) with various adsorbed oxygen coordinations, compared to bulk-like Fe in an undecorated hematite slab and W in bulk WO3. Note that in the case O′FeBWA oneunderlying O is displaced to the surface; see Table 2 and text. QWS indicates the RS integrated cation charge and related s, p, and d orbital populations; QB indicates the Bader-analysisionic charge. The nominal configuration for WO3 is W+6 s0p6d0.
(A) WO3 bulk, W adsorption and O′W coadsorption on (I); alternate cation site vacant.
Surface WO3 WA WB OA′WA O′BWB O′3WA O′3WB
EB – 152.18 152.62 161.95 161.11 171.11 171.29QWS(W) 5.50 5.34 5.38 5.41 5.41 5.40 5.40
s 0.03 0.04 0.04 0.04 0.04 0.04 0.04p 5.21 5.14 5.16 5.18 5.18 5.16 5.16d 1.23 1.48 1.42 1.38 1.38 1.40 1.40
QB(W) 3.02 2.06 2.30 2.73 2.79 2.75 2.77
(B) Fe2O3 bulk and bimetallic Fe and W adsorption on (I) with no and 1/3 ML coadsorbed oxygen. Subscript br denotes bridging oxygen.
Surface Fe2O3 WAFeB WBFeA O′BWAFeB O′AWAFeB O′brWAFeB O′AWBFeA O′BWBFeA O′brWBFeA
EB – 159.83 159.02 167.65 168.00 167.38 167.94 167.98 167.85QWS(W) – 5.37 5.32 5.41 5.38 5.40 5.39 5.39 5.39
s 0.04 0.04 0.04 0.03 0.03 0.03, 0.03, 0.03p 5.15 5.14 5.17 5.17 5.17 5.17 5.17 5.17d 1.44 1.50 1.38 1.42 1.41 1.40 1.41 1.41
QB(W) – 1.81 2.02 2.50 2.41 2.31 2.34 2.40 2.34QWS(Fe) 3.13 2.93 2.83 2.88 2.80 2.95 2.94 2.93 2.87
s 0.06 0.07 0.07 0.08 0.08 0.06 0.06, 0.08 0.06p 5.85 5.83 5.83 5.82 5.85 5.82 5.83 5.85 5.83d 4.96 5.17 5.27 5.22 5.27 5.17 5.17 5.15 5.24
QB(Fe) 1.64 0.83 1.07 0.83 0.81 1.03 1.26 0.98 1.14
(C) Bimetallic Fe and W adsorption on (I) with 2/3 and 1 ML coadsorbed oxygen.
System O′ABWAFeB O′ABWBFeA O′3WAFeB O′3WBFeA
EB 176.03 176.08 183.59 183.94QWS(W) 5.41 5.41 5.47 5.45
s 0.04 0.04 0.04 0.04p 5.18 5.18 5.20 5.19d 1.38 1.37 1.30 1.33
QB(W) 2.61 2.64 2.88 2.86QWS(Fe) 3.03 3.04 3.12 3.13
s 0.07 0.07 0.07 0.06p 5.86 5.85 5.86 5.86d 5.05 5.05 4.95 4.95
QB(Fe) 1.31 1.32 1.67 1.69
(D) Monolayer WA, WB adsorption on (I) with 0, 2/3 and 1 ML coadsorbed oxygen.
System WAWB O′ABWAWB O′3WAWB
EB 161.04 180.41 190.09QWS(WA) 5.29 5.40 5.42
s 0.03 0.03 0.03p 5.11 5.16 5.18d 1.57 1.41 1.36
QB(WA) 1.23 2.08 2.51QWS(WB) 5.35 5.37 5.42
s 0.03 0.03 0.03p 5.14 5.15 5.19d 1.48 1.46 1.37
QB(WB) 1.44 1.93 2.53
(E) WA and WB adsorption on defected/reduced (oxygen vacancy) (I) surfaces, ranging over single vacancy OV, divacancy OV2, and fully depleted OV3 oxygen layer.
System WAOV WBOV WAOV2 WBOV2 WAOV3 WBOV3
EB 145.31 143.69 136.34 134.78 124.04 124.95QWS(W) 5.42 5.33 5.40 5.31 5.37 5.27
s 0.03 0.04 0.03 0.04 0.03 0.04p 5.17 5.12 5.16 5.08 5.14 5.05d 1.38 1.51 1.41 1.57 1.47 1.64
QB(W) 2.16 1.63 1.79 0.86 1.17 0.17
(F) Bimetallic Fe and W adsorption on defected/reduced (oxygen vacancy) (I) surfaces.
System WAFeBOV WBFeAOV WAFeBOV2 WBFeAOV2 WAFeBOV3 WBFeAOV3
EB 152.21 151.24 143.77 142.90 134.57 132.87QWS(W) 5.40 5.33 5.36 5.34 5.37 5.27
s 0.03 0.04 0.03 0.04 0.03 0.04p 5.16 5.12 5.14 5.11 5.14 5.07d 1.41 1.52 1.46 1.52 1.46 1.62
QB(W) 1.77 1.30 1.41 0.90 1.14 −0.03
1372 M.E. McBriarty et al. / Surface Science 606 (2012) 1367–1381
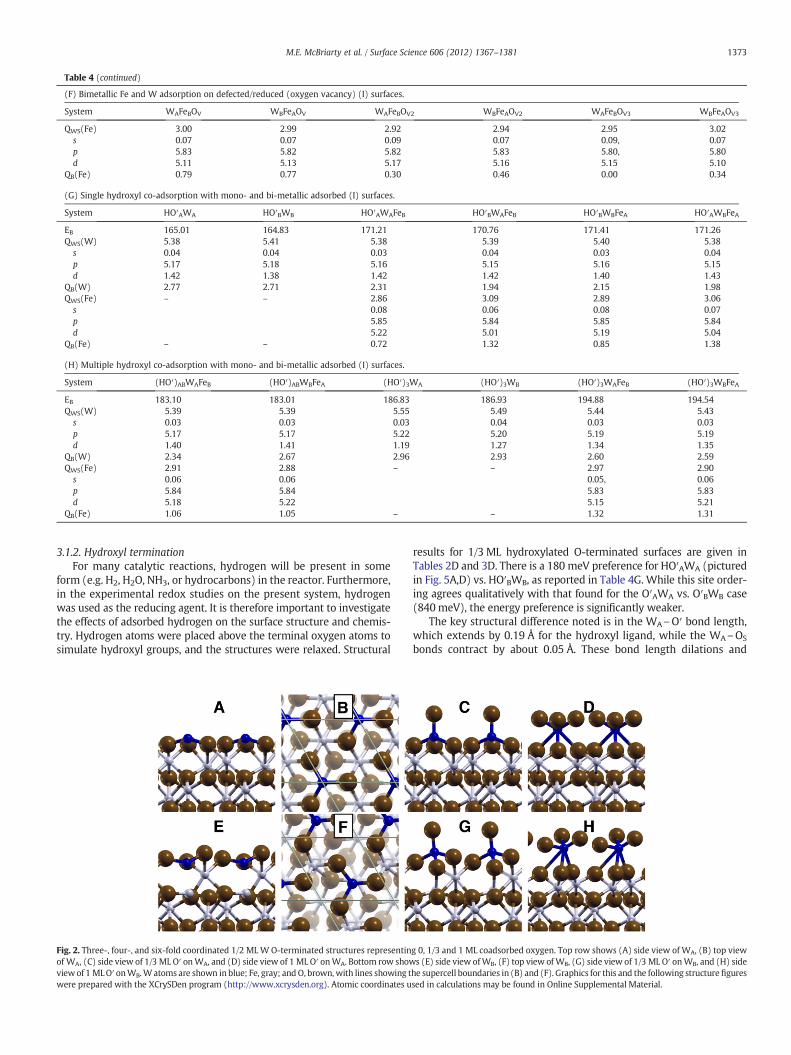
Table 4 (continued)
(F) Bimetallic Fe and W adsorption on defected/reduced (oxygen vacancy) (I) surfaces.
System WAFeBOV WBFeAOV WAFeBOV2 WBFeAOV2 WAFeBOV3 WBFeAOV3
QWS(Fe) 3.00 2.99 2.92 2.94 2.95 3.02s 0.07 0.07 0.09 0.07 0.09, 0.07p 5.83 5.82 5.82 5.83 5.80, 5.80d 5.11 5.13 5.17 5.16 5.15 5.10
QB(Fe) 0.79 0.77 0.30 0.46 0.00 0.34
(G) Single hydroxyl co-adsorption with mono- and bi-metallic adsorbed (I) surfaces.
System HO′AWA HO′BWB HO′AWAFeB HO′BWAFeB HO′BWBFeA HO′AWBFeA
EB 165.01 164.83 171.21 170.76 171.41 171.26QWS(W) 5.38 5.41 5.38 5.39 5.40 5.38
s 0.04 0.04 0.03 0.04 0.03 0.04p 5.17 5.18 5.16 5.15 5.16 5.15d 1.42 1.38 1.42 1.42 1.40 1.43
QB(W) 2.77 2.71 2.31 1.94 2.15 1.98QWS(Fe) – – 2.86 3.09 2.89 3.06
s 0.08 0.06 0.08 0.07p 5.85 5.84 5.85 5.84d 5.22 5.01 5.19 5.04
QB(Fe) – – 0.72 1.32 0.85 1.38
(H) Multiple hydroxyl co-adsorption with mono- and bi-metallic adsorbed (I) surfaces.
System (HO′)ABWAFeB (HO′)ABWBFeA (HO′)3WA (HO′)3WB (HO′)3WAFeB (HO′)3WBFeA
EB 183.10 183.01 186.83 186.93 194.88 194.54QWS(W) 5.39 5.39 5.55 5.49 5.44 5.43
s 0.03 0.03 0.03 0.04 0.03 0.03p 5.17 5.17 5.22 5.20 5.19 5.19d 1.40 1.41 1.19 1.27 1.34 1.35
QB(W) 2.34 2.67 2.96 2.93 2.60 2.59QWS(Fe) 2.91 2.88 – – 2.97 2.90
s 0.06 0.06 0.05, 0.06p 5.84 5.84 5.83 5.83d 5.18 5.22 5.15 5.21
QB(Fe) 1.06 1.05 – – 1.32 1.31
1373M.E. McBriarty et al. / Surface Science 606 (2012) 1367–1381
3.1.2. Hydroxyl terminationFor many catalytic reactions, hydrogen will be present in some
form (e.g. H2, H2O, NH3, or hydrocarbons) in the reactor. Furthermore,in the experimental redox studies on the present system, hydrogenwas used as the reducing agent. It is therefore important to investigatethe effects of adsorbed hydrogen on the surface structure and chemis-try. Hydrogen atoms were placed above the terminal oxygen atoms tosimulate hydroxyl groups, and the structures were relaxed. Structural
Fig. 2. Three-, four-, and six-fold coordinated 1/2 MLW O-terminated structures representinof WA, (C) side view of 1/3 ML O′ onWA, and (D) side view of 1 ML O′ onWA. Bottom row showviewof 1 MLO′ onWB.Watoms are shown in blue; Fe, gray; andO, brown,with lines showing twere prepared with the XCrySDen program (http://www.xcrysden.org). Atomic coordinates u
results for 1/3 ML hydroxylated O-terminated surfaces are given inTables 2D and 3D. There is a 180 meV preference for HO′AWA (picturedin Fig. 5A,D) vs. HO′BWB, as reported in Table 4G. While this site order-ing agrees qualitatively with that found for the O′AWA vs. O′BWB case(840 meV), the energy preference is significantly weaker.
The key structural difference noted is in the WA\O′ bond length,which extends by 0.19 Å for the hydroxyl ligand, while the WA\OS
bonds contract by about 0.05 Å. These bond length dilations and
g 0, 1/3 and 1 ML coadsorbed oxygen. Top row shows (A) side view of WA, (B) top views (E) side view ofWB, (F) top view of WB, (G) side view of 1/3 ML O′ onWB, and (H) side
he supercell boundaries in (B) and (F). Graphics for this and the following structurefiguressed in calculations may be found in Online Supplemental Material.
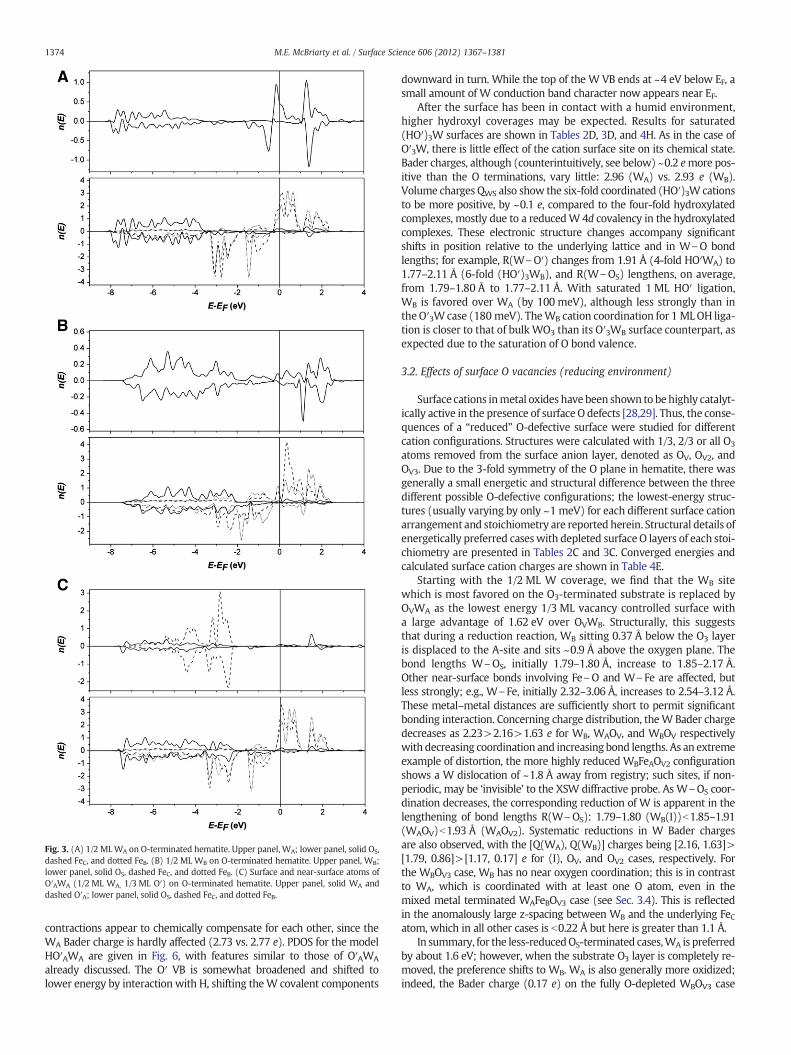
Fig. 3. (A) 1/2 MLWA on O-terminated hematite. Upper panel, WA; lower panel, solid OS,dashed FeC, and dotted FeB. (B) 1/2 ML WB on O-terminated hematite. Upper panel, WB;lower panel, solid OS, dashed FeC, and dotted FeB. (C) Surface and near-surface atoms ofO′AWA (1/2 ML WA, 1/3 ML O′) on O-terminated hematite. Upper panel, solid WA anddashed O′A; lower panel, solid OS, dashed FeC, and dotted FeB.
1374 M.E. McBriarty et al. / Surface Science 606 (2012) 1367–1381
contractions appear to chemically compensate for each other, since theWA Bader charge is hardly affected (2.73 vs. 2.77 e). PDOS for the modelHO′AWA are given in Fig. 6, with features similar to those of O′AWA
already discussed. The O′ VB is somewhat broadened and shifted tolower energy by interaction with H, shifting theW covalent components
downward in turn. While the top of the W VB ends at ~4 eV below EF, asmall amount of W conduction band character now appears near EF.
After the surface has been in contact with a humid environment,higher hydroxyl coverages may be expected. Results for saturated(HO′)3W surfaces are shown in Tables 2D, 3D, and 4H. As in the case ofO′3W, there is little effect of the cation surface site on its chemical state.Bader charges, although (counterintuitively, see below) ~0.2 emore pos-itive than the O terminations, vary little: 2.96 (WA) vs. 2.93 e (WB).Volume charges QWS also show the six-fold coordinated (HO′)3W cationsto be more positive, by ~0.1 e, compared to the four-fold hydroxylatedcomplexes, mostly due to a reducedW 4d covalency in the hydroxylatedcomplexes. These electronic structure changes accompany significantshifts in position relative to the underlying lattice and in W\O bondlengths; for example, R(W\O′) changes from 1.91 Å (4-fold HO′WA) to1.77–2.11 Å (6-fold (HO′)3WB), and R(W\OS) lengthens, on average,from 1.79–1.80 Å to 1.77–2.11 Å. With saturated 1 ML HO′ ligation,WB is favored over WA (by 100 meV), although less strongly than inthe O′3W case (180 meV). TheWB cation coordination for 1 ML OH liga-tion is closer to that of bulk WO3 than its O′3WB surface counterpart, asexpected due to the saturation of O bond valence.
3.2. Effects of surface O vacancies (reducing environment)
Surface cations inmetal oxides have been shown to behighly catalyt-ically active in the presence of surfaceO defects [28,29]. Thus, the conse-quences of a “reduced” O-defective surface were studied for differentcation configurations. Structures were calculated with 1/3, 2/3 or all O3
atoms removed from the surface anion layer, denoted as OV, OV2, andOV3. Due to the 3-fold symmetry of the O plane in hematite, there wasgenerally a small energetic and structural difference between the threedifferent possible O-defective configurations; the lowest-energy struc-tures (usually varying by only ~1 meV) for each different surface cationarrangement and stoichiometry are reported herein. Structural details ofenergetically preferred caseswith depleted surface O layers of each stoi-chiometry are presented in Tables 2C and 3C. Converged energies andcalculated surface cation charges are shown in Table 4E.
Starting with the 1/2 ML W coverage, we find that the WB sitewhich is most favored on the O3-terminated substrate is replaced byOVWA as the lowest energy 1/3 ML vacancy controlled surface witha large advantage of 1.62 eV over OVWB. Structurally, this suggeststhat during a reduction reaction, WB sitting 0.37 Å below the O3 layeris displaced to the A-site and sits ~0.9 Å above the oxygen plane. Thebond lengths W\OS, initially 1.79–1.80 Å, increase to 1.85–2.17 Å.Other near-surface bonds involving Fe\O and W\Fe are affected, butless strongly; e.g., W\Fe, initially 2.32–3.06 Å, increases to 2.54–3.12 Å.These metal–metal distances are sufficiently short to permit significantbonding interaction. Concerning charge distribution, theW Bader chargedecreases as 2.23>2.16>1.63 e for WB, WAOV, and WBOV respectivelywith decreasing coordination and increasing bond lengths. As an extremeexample of distortion, the more highly reduced WBFeAOV2 configurationshows a W dislocation of ~1.8 Å away from registry; such sites, if non-periodic, may be ‘invisible’ to the XSW diffractive probe. As W\OS coor-dination decreases, the corresponding reduction of W is apparent in thelengthening of bond lengths R(W\OS): 1.79–1.80 (WB(I))b1.85–1.91(WAOV)b1.93 Å (WAOV2). Systematic reductions in W Bader chargesare also observed, with the [Q(WA), Q(WB)] charges being [2.16, 1.63]>[1.79, 0.86]>[1.17, 0.17] e for (I), OV, and OV2 cases, respectively. Forthe WBOV3 case, WB has no near oxygen coordination; this is in contrastto WA, which is coordinated with at least one O atom, even in themixed metal terminated WAFeBOV3 case (see Sec. 3.4). This is reflectedin the anomalously large z-spacing between WB and the underlying FeCatom, which in all other cases is b0.22 Å but here is greater than 1.1 Å.
In summary, for the less-reducedOS-terminated cases,WA is preferredby about 1.6 eV; however, when the substrate O3 layer is completely re-moved, the preference shifts to WB. WA is also generally more oxidized;indeed, the Bader charge (0.17 e) on the fully O-depleted WBOV3 case
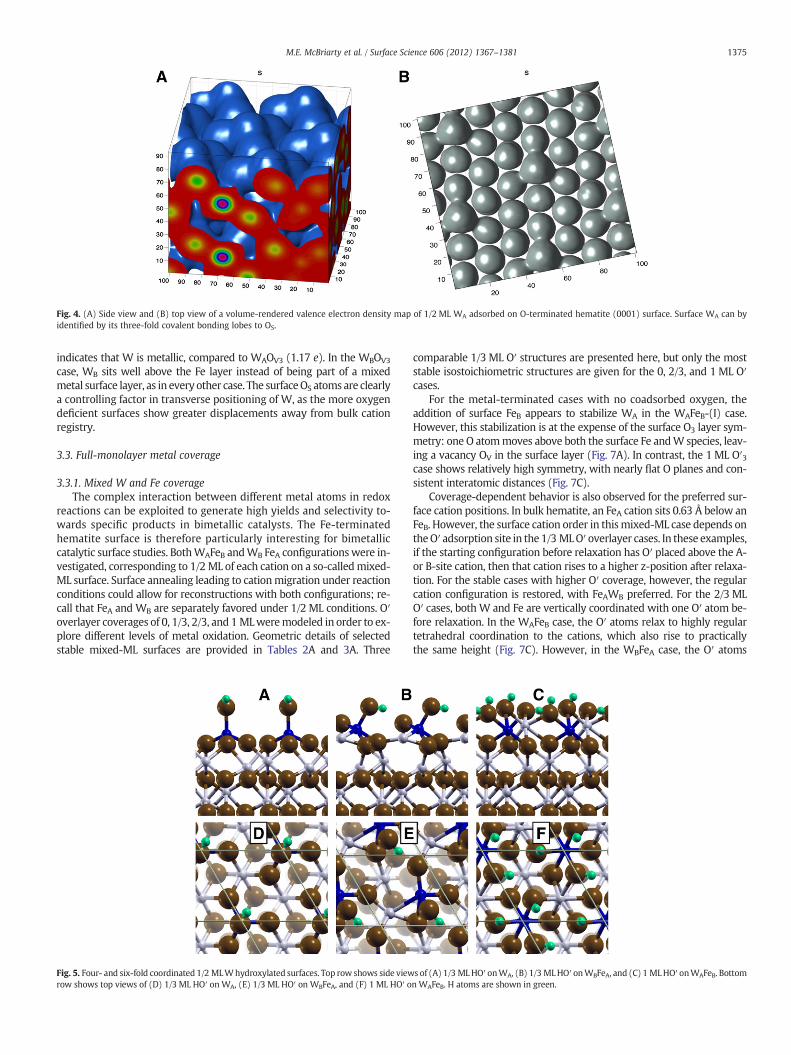
Fig. 4. (A) Side view and (B) top view of a volume-rendered valence electron density map of 1/2 ML WA adsorbed on O-terminated hematite (0001) surface. Surface WA can byidentified by its three-fold covalent bonding lobes to OS.
1375M.E. McBriarty et al. / Surface Science 606 (2012) 1367–1381
indicates that W is metallic, compared to WAOV3 (1.17 e). In the WBOV3
case, WB sits well above the Fe layer instead of being part of a mixedmetal surface layer, as in every other case. The surfaceOS atomsare clearlya controlling factor in transverse positioning of W, as the more oxygendeficient surfaces show greater displacements away from bulk cationregistry.
3.3. Full-monolayer metal coverage
3.3.1. Mixed W and Fe coverageThe complex interaction between different metal atoms in redox
reactions can be exploited to generate high yields and selectivity to-wards specific products in bimetallic catalysts. The Fe-terminatedhematite surface is therefore particularly interesting for bimetalliccatalytic surface studies. BothWAFeB andWB FeA configurationswere in-vestigated, corresponding to 1/2 ML of each cation on a so-calledmixed-ML surface. Surface annealing leading to cationmigration under reactionconditions could allow for reconstructions with both configurations; re-call that FeA and WB are separately favored under 1/2 ML conditions. O′overlayer coverages of 0, 1/3, 2/3, and 1 MLweremodeled in order to ex-plore different levels of metal oxidation. Geometric details of selectedstable mixed-ML surfaces are provided in Tables 2A and 3A. Three
Fig. 5. Four- and six-fold coordinated 1/2 MLWhydroxylated surfaces. Top row shows side viewrow shows top views of (D) 1/3 ML HO′ on WA, (E) 1/3 ML HO′ on WBFeA, and (F) 1 ML HO′ o
comparable 1/3 ML O′ structures are presented here, but only the moststable isostoichiometric structures are given for the 0, 2/3, and 1 ML O′cases.
For the metal-terminated cases with no coadsorbed oxygen, theaddition of surface FeB appears to stabilize WA in the WAFeB-(I) case.However, this stabilization is at the expense of the surface O3 layer sym-metry: one O atommoves above both the surface Fe andW species, leav-ing a vacancy OV in the surface layer (Fig. 7A). In contrast, the 1 ML O′3case shows relatively high symmetry, with nearly flat O planes and con-sistent interatomic distances (Fig. 7C).
Coverage-dependent behavior is also observed for the preferred sur-face cation positions. In bulk hematite, an FeA cation sits 0.63 Å below anFeB. However, the surface cation order in thismixed-ML case depends ontheO′ adsorption site in the 1/3 MLO′ overlayer cases. In these examples,if the starting configuration before relaxation has O′ placed above the A-or B-site cation, then that cation rises to a higher z-position after relaxa-tion. For the stable cases with higher O′ coverage, however, the regularcation configuration is restored, with FeAWB preferred. For the 2/3 MLO′ cases, both W and Fe are vertically coordinated with one O′ atom be-fore relaxation. In the WAFeB case, the O′ atoms relax to highly regulartetrahedral coordination to the cations, which also rise to practicallythe same height (Fig. 7C). However, in the WBFeA case, the O′ atoms
s of (A) 1/3 MLHO′ onWA, (B) 1/3 MLHO′ onWBFeA, and (C) 1 MLHO′ onWAFeB. BottomnWAFeB. H atoms are shown in green.

Fig. 6. Surface and near-surface atoms of HO′AWA (1/3 ML OH) on O-terminated hema-tite. Upper panel, solid WA, dashed O′A, and dotted H; lower panel, solid OS, dashed FeC,and dotted FeB.
1376 M.E. McBriarty et al. / Surface Science 606 (2012) 1367–1381
relax to bridging positions between the cations. This increases the ob-served coordination of WB from 4-fold to 5-fold (Fig. 7F), although thelongest W\O′ interaction, at 2.39 Å, is relatively weak. FeB remains4-fold coordinated in this case.
Energetic and charge-state information about these variable cover-age surface structures is compiled in Table 4B and C for O′ coveragesof 0–1 ML. Data for a bulk-like Fe cation from the unrelaxed portionsof the hematite slab are given for comparison in Table 4B. There is a sig-nificant energetic preference (810 meV) for theWAFeB configuration inthe case of no overlayer O′. However, there are much smaller energeticdifferences between the four different 1/3 ML O′ cases examined. TheO′BFeBWA case stands out as the least preferred by about 350 meV rela-tive to the remaining three structures, which have significantly differentgeometries but converge to within 60 meV of each other. The O′BFeBWA
structure (Fig. 8A) shows a strong distortion, with Fe coordinated to onlytwo O atoms. Given the relatively small energy differences, the otherthree 1/3 ML O′ surface configurations could feasibly coexist under typi-cal catalytic surface conditions. For the 2/3 ML case, a small but signifi-cant preference – 50 meV – is given to O′ABWBFeA vs. O′ABWAFeB. The
Fig. 7. Side views of three-, four-, and six-fold coordinated 1/2 ML W representing 0, 1/3,WAFeB, (B) 1/3 ML OA′ on WAFeB, and (C) 1 ML O′ on WAFeB. Structural distortions in (A)WBFeA, and (F) 1 ML O′ on WBFeA.
WBFeA cation configuration is preferred as well, by 350 meV, for a fullO′monolayer.
As in the case of 0.5 MLWonO-terminated surface (I) (Sec. A), thereis very little variation in the spherically-integrated W net chargeQWS(W) with surface configuration and W\O coordination; i.e.,
5:37 WAFeBð Þ b 5:41 O′AWAFeBð Þand O′ABWBFeAð Þ b 5:45e O′3WBFeAð Þ:
While the trend of increasing net charge with oxygen ligation is asexpected, the magnitude of changes is small. The surface Fe orbitaloccupancies vary significantly more than those of W; neverthelessthe net charge differences remain small. The corresponding Fe WScharge is 2.93>2.88b3.04b3.13 e, in the same site order as above, in-dicating a slight oxidizing tendency with increasing O′ coordinationabout either metal.
Bader charges (Table 4B, C) again prove to be more sensitive tochanges in the cation chemistry due to differences in the local struc-ture. Taking again the 3-, 4-, 5-, and 6-fold W\O coordination subsetof WAFeB, O′AWAFeB, O′ABWAFeB, and O′3WBFeA, the W net chargesQB(W) are 1.81b2.41b2.62b2.86 e, respectively. The correspondingFe net charges are 0.83>0.81b1.31b1.69 e, respectively. Interestingly,for 1/3 ML O′ coverage over WAFeB, both O′A and O′B terminations givenearly identical FeB charges (0.81 vs. 0.83 e), indicating dominance ofthe A-site in the local charge transfer process. Transverse dislocations inboth cation sites are indicative of the rather strong local lattice distor-tions, reaching a maximum of 1.1 Å with no adsorbed O and diminishingto nearly perfect registry with O′3 coverage. Further site-specific trendsappear for Fe, namely that surface FeB atoms often have a lower chargethan their isostoichiometric FeA counterparts. The charge onW, however,changes little with cation position, or even by the initial position of theterminal O atoms; it simply rises with increasing O coverage. The differ-ence between chemical states for WAFeB vs. WBFeA ordering with a fullO′3 overlayer is almost indiscernible, emphasizing the subtle causes ofsmall energy differences.
In general, W atoms on themixed-ML cases of no or 1/3 ML O′ cover-age are seen to be less oxidized comparedwith theirW-only counterpartson O-terminated hematite (see Sec. A above), likely due to competitionbetween the surface Fe and W species for covalency with available O.When O is plentiful, however, as in the case of 1 ML O′ coverage, theW cations on the mixed-ML surface are noticeably more oxidized thanwith no Fe present. The O′ layer is drawn significantly closer to the
and 1 ML coadsorbed oxygen with additional surface Fe. Top row shows (A) no O′ onare discussed in the text. Bottom row shows (D) no O′ on WBFeA, (E) 1/3 ML OB′ on

Fig. 8. Side views of four-fold coordinated 1/2 ML W representing 1/3 and 2/3 ML coadsorbed oxygen with additional surface Fe. Top row shows (A) 1/3 ML O′B on WAFeB, (B) 1/3 ML O′A on WAFeB, and (C) 2/3 ML O′ on WAFeB. Bottom row shows (D) 1/3 ML O′A on WBFeA, (E) 1/3 ML O′B on WBFeA, and (F) 2/3 ML O′ on WBFeA.
Fig. 9. (A) Surface and near-surface atoms of O′2WBFeA (2/3 ML O, 1 ML W) on FeA-terminated hematite. Upper panel, solidWB, dashed FeA, and dotted O′; lower panel, solidOS, dashed FeC, and dotted FeB. (B) Surface and near-surface atoms of O′3WB FeA (1 ML O′,1/2 MLW, 1/2 ML Fe) on O-terminated hematite. Upper panel, solid WB, dashed FeA, anddotted O′; lower panel, solid OS, dashed FeC, and dotted FeB.
1377M.E. McBriarty et al. / Surface Science 606 (2012) 1367–1381
underlying surface by the presence of two cations, resulting in moresubstantial W\O coordination.
The partial densities of states for O′ABWBFeA and O′3WBFeA, Fig. 9Aand B, serve to illustrate differences between bimetallic coverage andsingleW-terminations. In contrast with the O′AWA structure of Fig. 3C,showing rather localized O′ and W PDOS, the adsorbed O′ 2/3 MLPDOS is seen to be broadened into a band covering essentially the en-tire VB region, due to its delocalization over bothmetal centers and in-teraction with the underlying O3 substrate. The terminal FeA shows awell-defined spin-up band starting ~1 eV below EF with a strongspin-down structure just above EF, characteristic of strongly polarizedbulk Fe. TheWB structure is spread over the entire VB, characteristic of itscovalency with oxygen ligands, with defined excited state structuresranging over 1.5–2.5 eV above EF. The 1 ML O′3 spectra (Fig. 9B) showfurther delocalization, with displacements of both substrate and surfaceFe features leading to the opening of a distinct band gap around EF char-acteristic of the highly oxidized surface. The Femagnetic structure showssome interesting features, with considerable localization indicated bynarrow spin-down bands above EF. Thus, the occupied Fe spin-up statesare strongly interacting with the substrate and broadened, while non-occupied spin-down states are presumably dominant in interactionswith incoming atoms and molecules.
3.3.2. Complete W coverageRelaxed structures for a full Wmonolayer (WAWB) are provided in
Fig. 10, with structural information in Tables 2B and 3B. For the casewith no coadsorbed O′, WA sits further above the OS plane than WB
does in the z-direction. This leaves a large sub-surface hollow spaceas the underlying FeB atom is repelled downward by WB. The W\OS
bond lengths are relatively long, at 1.91–1.98 Å. The 2/3 ML O′ over-layer model O′ABWAWB, initialized with 4-fold W\O coordinationfor both cations, shows the expected cation z-position ordering (WA
belowWB) after relaxation. While WB appears to be 4-fold coordinatedwith O, aweak fifthW\O interaction is observed at a distance of 2.69 Å.Nevertheless, the bond-average of the closest 4-coordinate shellsaroundWA andWB, 1.96 and 1.99 Å respectively, suggests a slightly in-creased oxidation ofWA. The 1 ML O′ overlayer model O′3WAWB showsrelatively high symmetry, exhibiting little difference in distribution ofW\O distances around the 6-fold coordinated W atoms. Some distor-tion of the terminal O layer is observed.
For the 3-fold O-coordination state with no coadsorbed O′, the char-ges QWS(WA,B) (5.29, 5.35 e) andQB(WA,B) (1.23, 1.44 e) observed for theWcations (see Table 4D), are among the lowest predicted for undefected
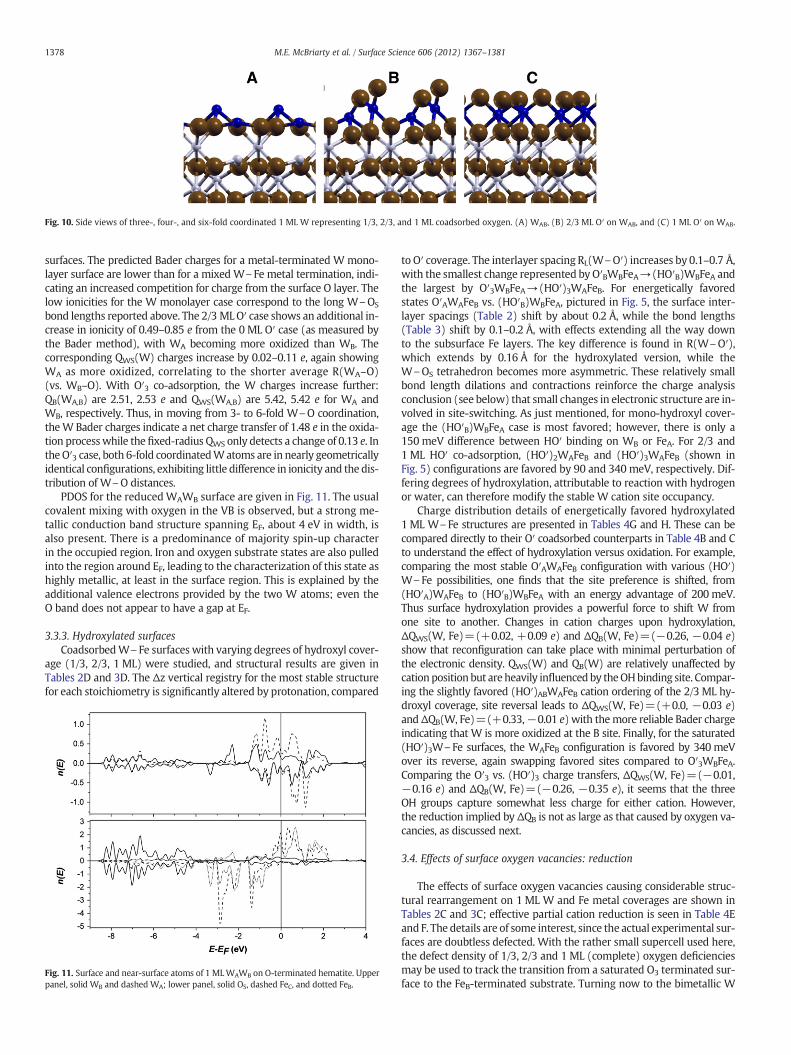
Fig. 10. Side views of three-, four-, and six-fold coordinated 1 ML W representing 1/3, 2/3, and 1 ML coadsorbed oxygen. (A) WAB, (B) 2/3 ML O′ on WAB, and (C) 1 ML O′ on WAB.
1378 M.E. McBriarty et al. / Surface Science 606 (2012) 1367–1381
surfaces. The predicted Bader charges for a metal-terminated W mono-layer surface are lower than for a mixed W\Fe metal termination, indi-cating an increased competition for charge from the surface O layer. Thelow ionicities for the W monolayer case correspond to the long W\OS
bond lengths reported above. The 2/3 MLO′ case shows an additional in-crease in ionicity of 0.49–0.85 e from the 0 ML O′ case (as measured bythe Bader method), with WA becoming more oxidized than WB. Thecorresponding QWS(W) charges increase by 0.02–0.11 e, again showingWA as more oxidized, correlating to the shorter average R(WA–O)(vs. WB–O). With O′3 co-adsorption, the W charges increase further:QB(WA,B) are 2.51, 2.53 e and QWS(WA,B) are 5.42, 5.42 e for WA andWB, respectively. Thus, in moving from 3- to 6-fold W\O coordination,theW Bader charges indicate a net charge transfer of 1.48 e in the oxida-tion processwhile the fixed-radius QWS only detects a change of 0.13 e. Inthe O′3 case, both 6-fold coordinatedWatoms are in nearly geometricallyidentical configurations, exhibiting little difference in ionicity and the dis-tribution of W\O distances.
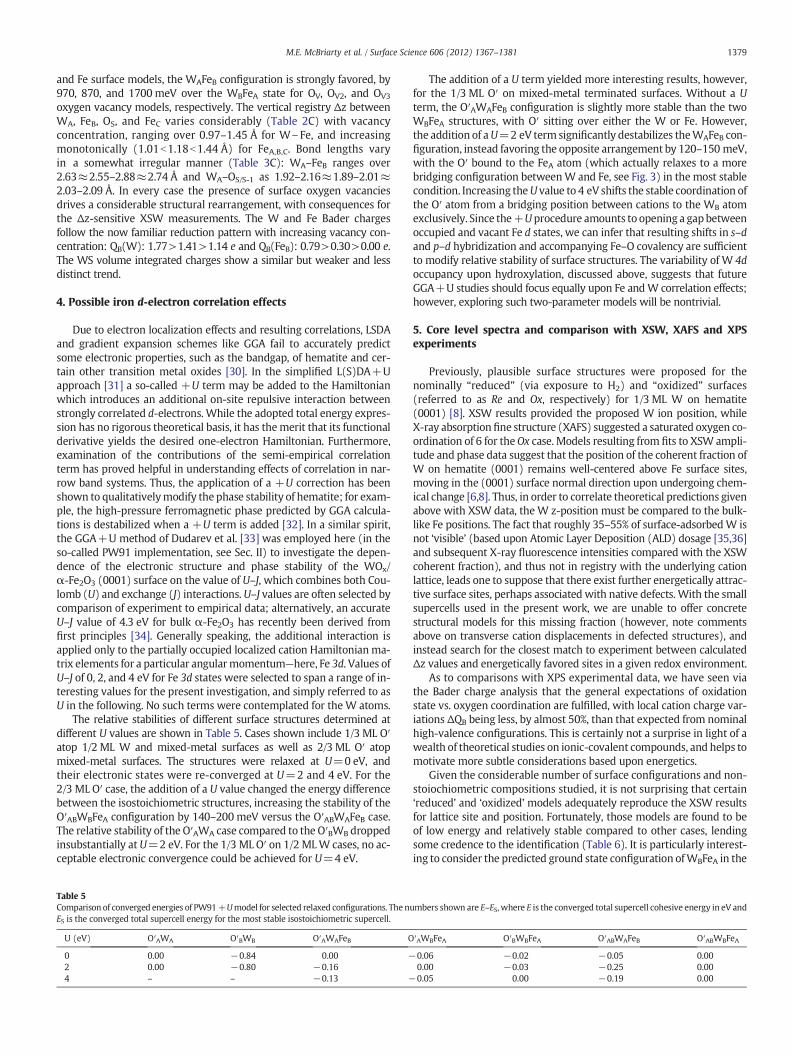
PDOS for the reducedWAWB surface are given in Fig. 11. The usualcovalent mixing with oxygen in the VB is observed, but a strong me-tallic conduction band structure spanning EF, about 4 eV in width, isalso present. There is a predominance of majority spin-up characterin the occupied region. Iron and oxygen substrate states are also pulledinto the region around EF, leading to the characterization of this state ashighly metallic, at least in the surface region. This is explained by theadditional valence electrons provided by the two W atoms; even theO band does not appear to have a gap at EF.
3.3.3. Hydroxylated surfacesCoadsorbedW\Fe surfaces with varying degrees of hydroxyl cover-
age (1/3, 2/3, 1 ML) were studied, and structural results are given inTables 2D and 3D. The Δz vertical registry for the most stable structurefor each stoichiometry is significantly altered by protonation, compared
Fig. 11. Surface and near-surface atoms of 1 MLWAWB on O-terminated hematite. Upperpanel, solid WB and dashed WA; lower panel, solid OS, dashed FeC, and dotted FeB.
to O′ coverage. The interlayer spacing RL(W\O′) increases by 0.1–0.7 Å,with the smallest change represented by O′BWBFeA→(HO′B)WBFeA andthe largest by O′3WBFeA→(HO′)3WAFeB. For energetically favoredstates O′AWAFeB vs. (HO′B)WBFeA, pictured in Fig. 5, the surface inter-layer spacings (Table 2) shift by about 0.2 Å, while the bond lengths(Table 3) shift by 0.1–0.2 Å, with effects extending all the way downto the subsurface Fe layers. The key difference is found in R(W\O′),which extends by 0.16 Å for the hydroxylated version, while theW\OS tetrahedron becomes more asymmetric. These relatively smallbond length dilations and contractions reinforce the charge analysisconclusion (see below) that small changes in electronic structure are in-volved in site-switching. As just mentioned, for mono-hydroxyl cover-age the (HO′B)WBFeA case is most favored; however, there is only a150 meV difference between HO′ binding on WB or FeA. For 2/3 and1 ML HO′ co-adsorption, (HO′)2WAFeB and (HO′)3WAFeB (shown inFig. 5) configurations are favored by 90 and 340 meV, respectively. Dif-fering degrees of hydroxylation, attributable to reaction with hydrogenor water, can therefore modify the stable W cation site occupancy.
Charge distribution details of energetically favored hydroxylated1 ML W\Fe structures are presented in Tables 4G and H. These can becompared directly to their O′ coadsorbed counterparts in Table 4B and Cto understand the effect of hydroxylation versus oxidation. For example,comparing the most stable O′AWAFeB configuration with various (HO′)W\Fe possibilities, one finds that the site preference is shifted, from(HO′A)WAFeB to (HO′B)WBFeA with an energy advantage of 200 meV.Thus surface hydroxylation provides a powerful force to shift W fromone site to another. Changes in cation charges upon hydroxylation,ΔQWS(W, Fe)=(+0.02, +0.09 e) and ΔQB(W, Fe)=(−0.26, −0.04 e)show that reconfiguration can take place with minimal perturbation ofthe electronic density. QWS(W) and QB(W) are relatively unaffected bycation position but areheavily influencedby theOHbinding site. Compar-ing the slightly favored (HO′)ABWAFeB cation ordering of the 2/3 ML hy-droxyl coverage, site reversal leads to ΔQWS(W, Fe)=(+0.0, −0.03 e)andΔQB(W, Fe)=(+0.33,−0.01 e) with themore reliable Bader chargeindicating that W is more oxidized at the B site. Finally, for the saturated(HO′)3W\Fe surfaces, the WAFeB configuration is favored by 340 meVover its reverse, again swapping favored sites compared to O′3WBFeA.Comparing the O′3 vs. (HO′)3 charge transfers, ΔQWS(W, Fe)=(−0.01,−0.16 e) and ΔQB(W, Fe)=(−0.26, −0.35 e), it seems that the threeOH groups capture somewhat less charge for either cation. However,the reduction implied by ΔQB is not as large as that caused by oxygen va-cancies, as discussed next.
3.4. Effects of surface oxygen vacancies: reduction
The effects of surface oxygen vacancies causing considerable struc-tural rearrangement on 1 ML W and Fe metal coverages are shown inTables 2C and 3C; effective partial cation reduction is seen in Table 4Eand F. The details are of some interest, since the actual experimental sur-faces are doubtless defected. With the rather small supercell used here,the defect density of 1/3, 2/3 and 1 ML (complete) oxygen deficienciesmay be used to track the transition from a saturated O3 terminated sur-face to the FeB-terminated substrate. Turning now to the bimetallic W
1379M.E. McBriarty et al. / Surface Science 606 (2012) 1367–1381
and Fe surface models, the WAFeB configuration is strongly favored, by970, 870, and 1700meV over the WBFeA state for OV, OV2, and OV3
oxygen vacancy models, respectively. The vertical registry Δz betweenWA, FeB, OS, and FeC varies considerably (Table 2C) with vacancyconcentration, ranging over 0.97–1.45 Å for W\Fe, and increasingmonotonically (1.01b1.18b1.44 Å) for FeA,B,C. Bond lengths varyin a somewhat irregular manner (Table 3C): WA–FeB ranges over2.63≈2.55–2.88≈2.74 Å and WA–OS/S-1 as 1.92–2.16≈1.89–2.01≈2.03–2.09 Å. In every case the presence of surface oxygen vacanciesdrives a considerable structural rearrangement, with consequences forthe Δz-sensitive XSW measurements. The W and Fe Bader chargesfollow the now familiar reduction pattern with increasing vacancy con-centration: QB(W): 1.77>1.41>1.14 e and QB(FeB): 0.79>0.30>0.00 e.The WS volume integrated charges show a similar but weaker and lessdistinct trend.
4. Possible iron d-electron correlation effects
Due to electron localization effects and resulting correlations, LSDAand gradient expansion schemes like GGA fail to accurately predictsome electronic properties, such as the bandgap, of hematite and cer-tain other transition metal oxides [30]. In the simplified L(S)DA+Uapproach [31] a so-called +U term may be added to the Hamiltonianwhich introduces an additional on-site repulsive interaction betweenstrongly correlated d-electrons. While the adopted total energy expres-sion has no rigorous theoretical basis, it has themerit that its functionalderivative yields the desired one-electron Hamiltonian. Furthermore,examination of the contributions of the semi-empirical correlationterm has proved helpful in understanding effects of correlation in nar-row band systems. Thus, the application of a +U correction has beenshown to qualitativelymodify the phase stability of hematite; for exam-ple, the high-pressure ferromagnetic phase predicted by GGA calcula-tions is destabilized when a +U term is added [32]. In a similar spirit,the GGA+U method of Dudarev et al. [33] was employed here (in theso-called PW91 implementation, see Sec. II) to investigate the depen-dence of the electronic structure and phase stability of the WOx/α-Fe2O3 (0001) surface on the value of U–J, which combines both Cou-lomb (U) and exchange (J) interactions. U–J values are often selected bycomparison of experiment to empirical data; alternatively, an accurateU–J value of 4.3 eV for bulk α-Fe2O3 has recently been derived fromfirst principles [34]. Generally speaking, the additional interaction isapplied only to the partially occupied localized cation Hamiltonianma-trix elements for a particular angularmomentum—here, Fe 3d. Values ofU–J of 0, 2, and 4 eV for Fe 3d states were selected to span a range of in-teresting values for the present investigation, and simply referred to asU in the following. No such terms were contemplated for the W atoms.
The relative stabilities of different surface structures determined atdifferent U values are shown in Table 5. Cases shown include 1/3 ML O′atop 1/2 ML W and mixed-metal surfaces as well as 2/3 ML O′ atopmixed-metal surfaces. The structures were relaxed at U=0 eV, andtheir electronic states were re-converged at U=2 and 4 eV. For the2/3 ML O′ case, the addition of a U value changed the energy differencebetween the isostoichiometric structures, increasing the stability of theO′ABWBFeA configuration by 140–200 meV versus the O′ABWAFeB case.The relative stability of the O′AWA case compared to the O′BWB droppedinsubstantially at U=2 eV. For the 1/3 ML O′ on 1/2 MLW cases, no ac-ceptable electronic convergence could be achieved for U=4 eV.
Table 5Comparison of converged energies of PW91+Umodel for selected relaxed configurations. The nuES is the converged total supercell energy for the most stable isostoichiometric supercell.
U (eV) O′AWA O′BWB O′AWAFeB O
0 0.00 −0.84 0.00 −2 0.00 −0.80 −0.164 – – −0.13 −
The addition of a U term yielded more interesting results, however,for the 1/3 ML O′ on mixed-metal terminated surfaces. Without a Uterm, the O′AWAFeB configuration is slightly more stable than the twoWBFeA structures, with O′ sitting over either the W or Fe. However,the addition of aU=2 eV term significantly destabilizes theWAFeB con-figuration, instead favoring the opposite arrangement by 120–150 meV,with the O′ bound to the FeA atom (which actually relaxes to a morebridging configuration betweenW and Fe, see Fig. 3) in the most stablecondition. Increasing theU value to 4 eV shifts the stable coordination ofthe O′ atom from a bridging position between cations to the WB atomexclusively. Since the+Uprocedure amounts to opening a gap betweenoccupied and vacant Fe d states, we can infer that resulting shifts in s–dand p–d hybridization and accompanying Fe–O covalency are sufficientto modify relative stability of surface structures. The variability of W 4doccupancy upon hydroxylation, discussed above, suggests that futureGGA+U studies should focus equally upon Fe andW correlation effects;however, exploring such two-parameter models will be nontrivial.
5. Core level spectra and comparison with XSW, XAFS and XPSexperiments
Previously, plausible surface structures were proposed for thenominally “reduced” (via exposure to H2) and “oxidized” surfaces(referred to as Re and Ox, respectively) for 1/3 ML W on hematite(0001) [8]. XSW results provided the proposed W ion position, whileX-ray absorptionfine structure (XAFS) suggested a saturated oxygen co-ordination of 6 for theOx case. Models resulting from fits to XSW ampli-tude and phase data suggest that the position of the coherent fraction ofW on hematite (0001) remains well-centered above Fe surface sites,moving in the (0001) surface normal direction upon undergoing chem-ical change [6,8]. Thus, in order to correlate theoretical predictions givenabove with XSW data, the W z-position must be compared to the bulk-like Fe positions. The fact that roughly 35–55% of surface-adsorbedW isnot ‘visible’ (based upon Atomic Layer Deposition (ALD) dosage [35,36]and subsequent X-ray fluorescence intensities compared with the XSWcoherent fraction), and thus not in registry with the underlying cationlattice, leads one to suppose that there exist further energetically attrac-tive surface sites, perhaps associated with native defects. With the smallsupercells used in the present work, we are unable to offer concretestructural models for this missing fraction (however, note commentsabove on transverse cation displacements in defected structures), andinstead search for the closest match to experiment between calculatedΔz values and energetically favored sites in a given redox environment.
As to comparisons with XPS experimental data, we have seen viathe Bader charge analysis that the general expectations of oxidationstate vs. oxygen coordination are fulfilled, with local cation charge var-iations ΔQB being less, by almost 50%, than that expected from nominalhigh-valence configurations. This is certainly not a surprise in light of awealth of theoretical studies on ionic-covalent compounds, and helps tomotivate more subtle considerations based upon energetics.
Given the considerable number of surface configurations and non-stoiochiometric compositions studied, it is not surprising that certain‘reduced’ and ‘oxidized’ models adequately reproduce the XSW resultsfor lattice site and position. Fortunately, those models are found to beof low energy and relatively stable compared to other cases, lendingsome credence to the identification (Table 6). It is particularly interest-ing to consider the predicted ground state configuration ofWBFeA in the
mbers shown are E–ES, where E is the converged total supercell cohesive energy in eV and
′AWBFeA O′BWBFeA O′ABWAFeB O′ABWBFeA
0.06 −0.02 −0.05 0.000.00 −0.03 −0.25 0.000.05 0.00 −0.19 0.00
1380 M.E. McBriarty et al. / Surface Science 606 (2012) 1367–1381
oxidized state as well as the likely protonation at a fraction of reducedW sites. Additionally, the poor match of 1 ML WAWB calculations toXSW results suggests that the deposited 1/3 ML WOx films did notgrow as atomically thin, W-dense rafts or islands. The better matchwith the 1/2 ML cases implies that theWOx wasmore evenly dispersedover the sample surface. However, the small unit cell size precludes anystrong conclusions regarding such long-range effects.
Tungsten 4f5/2, 7/2 XPS core-level measurements on surfaces andnon-stoichiometric films and particles typically give values of W6+
(35.6, 37.7 eV) and W5+ (34.5, 36.6 eV) [37,38], revealing a spin–orbitsplitting of 2.1 eV and a oxidation-state shift of 1.1 eV. A number of mo-lecular cluster calculations were carried out in the Transition Statescheme described previously, in an effort to identify theoretical core-level shifts with changes in W chemical environment. Since the core-hole effects are essentially Coulombic in nature, with energy differencesdue mostly to electronic screening from the environment, we may ex-amine the difference of two environments using non-relativisticmodels.Later, one may use the fully relativistic Dirac-Slater scheme to resolvethe spin–orbit splitting of the core states and for further detailed studiesof suchmultielectron phenomena as shake-up, shake-down, and Augertransitions. Calculated core-level energies taken relative to the localFermi energy showavariation of 1.19 eVover the variousWcoordinationenvironments, in quantitative agreement with experiment. However, weare not able to cleanly identify only two distinct valence states; indeed,we find a range of values between the extreme limits. This may not betoo surprising, as the models contain 3-, 4-, 5-, and 6-fold coordinatedW, some of which may not be stable on the experimental surfaces. Itwould be interesting to carry out more systematic studies with largerembedded clusters and inclusion of spin–orbit effects to obtain a morequantitative picture.
6. Conclusions
Using DFT, various reduced and oxidized configurations of tungstenon the hematite (0001) surface have been explored, using both groundstate band structure and localized-orbital W core-hole models. Adsorp-tion ofWon surfaceswith compositions ranging from oxygen saturatedto Fe terminated was considered, as were coadsorption with iron, oxy-gen, or hydroxyl groups. By comparing calculated relaxed structural andelectronic data to experiment, one obtains a good match with site-specific XSW data for nominally oxidized and reduced configurations.Low energy configurations give a best fit to experiment, lending confi-dence to the theoretical approach. Experimental W 4f XPS data whichshow reversible oxidation and reduction of W on the surface are quan-titatively reproduced by Transition State cluster calculations. However,it was not possible to identify distinct “W5+” and “W6+” oxidationstates in cluster models containing 3-, 4-, 5-, and 6-fold coordinatedtungsten; rather, a continuous variation of net charge and core-level en-ergies was observed. As found in many other theoretical studies, cationcharges are calculated to be notably less than nominal oxidation-statevalues (Fe3+, W5+, W6+), whether defined by spherically-integratedRWS charges or by the zero-flux surface Bader approach. The character-istic trends of increasing cation charge with oxygen coordination andthe associated metal–oxygen bond length variations are reported. Thepossible effects of Fe 3d correlation corrections on surface structureswere considered, using the GGA+U approach. It was found that some
Table 6Comparison ofWA- and B-site z displacements above the bulk-like O3 plane derived fromXSW experiment with selected energetically favored DFT-calculated configurations.
Experimenta
“reduced”O′AWA HO′AWA O′ABWBFeA Experimenta
“oxidized”O′3WBFeA
zA 0.88 0.79 0.89 – – –
zB 1.46 – – 1.51 1.54–1.58 1.58
a Ref. [8].
re-ordering of site energies could occur; however, the lack of knowl-edge of optimized surface-related values of the parameter U (appliedonly to Fe and not W) renders doubtful any strong predictions.
The small crystal unit cells and small molecular clusters used in thiswork preclude any study of larger scale phenomena such as surface re-construction, metal agglomeration, coexistence of differentW oxidationstates, and raft/cluster formation. The use of such small surface cellsmayalso result in a “periodic image” effect caused by the lateral interactionbetween an atom and itself in a neighboring identical cell. The presentwork therefore serves as an adequate launch point for more extensivemodeling, including larger surface unit cells and interactions withadsorbing molecules.
Acknowledgments
This research was supported in part by the Chemical Sciences,Geosciences and Biosciences Division, Office of Basic Energy Sciences,Office of Science, US Department of Energy, Grant No. DE-FG02-03ER15457, at the Institute for Catalysis in Energy Processes at North-western University. Additional support was received from the Initiativefor Sustainability and Energy at Northwestern University. This materialis partially based uponwork supported by the National Science Founda-tion Graduate Research Fellowship under Grant No. DGE-0824162. Use ofthe APS at Argonne National Laboratory was supported by the DOE-BESunder Contract No. W-31-109-ENG-38. DND-CAT is supported in partby the State of Illinois.
Appendix A. Supplementary data
Supplementary data to this article can be found online at http://dx.doi.org/10.1016/j.susc.2012.04.023.
References
[1] V.E. Henrich, P.A. Cox, The Surface Science of Metal Oxides, Cambridge UniversityPress, 1994.
[2] B. Weckhuysen, D. Keller, Catal. Today 78 (2003) 25.[3] W. Weiss, W. Ranke, Prog. Surf. Sci. 70 (2002) 1.[4] J. Jin, X. Ma, C.-Y. Kim, D.E. Ellis, M.J. Bedzyk, Surf. Sci. 601 (2007) 3082.[5] J. Jin, X. Ma, C.-Y. Kim, D.E. Ellis, M.J. Bedzyk, Surf. Sci. 601 (2007) 4571.[6] C.-Y. Kim, A.A. Escuadro, P.C. Stair, M.J. Bedzyk, J. Phys. Chem. C 111 (2007) 1874.[7] S.L. Soled, G.B. McVicker, L.L. Murrell, L.G. Sherman, N.C. Dispenziere Jr., S.L. Hsu,
D. Waldman, J. Catal. 111 (1988) 286.[8] Z. Feng, C.-Y. Kim, J.W. Elam, Q. Ma, Z. Zhang, M.J. Bedzyk, J. Am. Chem. Soc. 131
(2009) 18200.[9] L. Lietti, J.L. Alemany, P. Forzatti, G. Busca, G. Ramis, E. Giamello, F. Bregani, Catal. Today
29 (1996) 143.[10] L. Ferretto, A. Glisenti, J. Mol. Catal. A 187 (2002) 119.[11] P.E. Boahene, K.K. Soni, A.K. Dalai, J. Adjaye, Appl. Catal. A 402 (2011) 31.[12] G. Kresse, J. Furthmüller, Phys. Rev. B 54 (1996) 11169.[13] G. Kresse, J. Furthmüller, Comput. Mater. Sci. 6 (1996) 15.[14] G. Kresse, J. Hafner, Phys. Rev. B 47 (1993) 558.[15] G. Kresse, J. Hafner, Phys. Rev. B 49 (1994) 14251.[16] P.E. Bloechl, Phys. Rev. B 50 (1994) 17953.[17] J.P. Perdew, J.A. Chevary, S.H. Vosko, K.A. Jackson, M.R. Pederson, D.J. Singh, C.
Fiolhais, Phys. Rev. B 46 (1992) 6671.[18] I.de.P.R. Moreira, F. Illas, R.L. Martin, Phys. Rev. B 65 (2002) 155102.[19] N.C. Wilson, S.P. Russo, Phys. Rev. B79 (2009) 094113.[20] H.J. Monkhorst, J.D. Pack, Phys. Rev. B 13 (1976) 5188.[21] P. Pulay, Chem. Phys. Lett. 73 (1980) 393.[22] G. Henkelman, A. Arnaldsson, H. Jónsson, Comput. Mater. Sci. 36 (2006) 354.[23] Local perturbations are notwell treated in periodic cells due to interaction betweenad-
jacent cells. In principle this can be overcome by using sufficiently large supercells. Inthe present case, long range Coulomb–hole interactions would require prohibitivelylarge cells.
[24] D.E. Ellis, D. Guenzburger, Adv. QuantumChem. 34 (1999) 51 (and references therein).[25] A.R. Williams, R.A. deGroot, C.B. Sommers, J. Chem. Phys. 63 (1975) 628.[26] W. Bergermayer, H. Schweiger, E. Wimmer, Phys. Rev. B 69 (2004) 195409.[27] X.-G. Wang, W. Weiss, Sh.K. Shaikhutdinov, M. Ritter, M. Petersen, F. Wagner,
R. Schlögl, M. Scheffler, Phys. Rev. Lett. 81 (1998) 1038.[28] S. Polarz, J. Strunk, V. Ischenko, M. van den Berg, O. Hinrichsen,M. Muhler, M. Driess,
Angew. Chem. Int. Ed. 45 (2006) 2965.[29] M. Aizawa, Y. Morikawa, Y. Namai, H. Morikawa, Y. Iwasawa, J. Phys. Chem. B 109
(2005) 18831.[30] A. Svane, O. Gunnarsson, Phys. Rev. Lett. 65 (1990) 1148.[31] V.I. Anisimov, J. Zaanen, O.K. Andersen, Phys. Rev. B 44 (1991) 943.

1381M.E. McBriarty et al. / Surface Science 606 (2012) 1367–1381
[32] G. Rollmann, A. Rohrbach, P. Entel, J. Hafner, Phys. Rev. B 69 (2004) 165107.[33] S.L. Dudarev, G.A. Botton, S.Y. Savrasov, C.J. Humphreys, A.P. Sutton, Phys. Rev. B 57
(1998) 1505.[34] N.J. Mosey, P. Liao, E.A. Carter, J. Chem. Phys. 129 (2008) 014103.[35] J.W. Elam, C.E. Nelson, R.K. Grubbs, S.M. George, Thin Solid Films 386 (2001) 41.
[36] Z.A. Sechrist, F.H. Fabreguette, O. Heintz, T.M. Phung, D.C. Johnson, S.M. George,Chem. Mater. 17 (2005) 3475.
[37] M. Sun, N. Xu, Y.W. Cao, J.N. Yao, J. Mater. Res. 15 (2000) 927.[38] K. Senthil, K. Yong, Nanotechnology 18 (2007) 395604.


![Investigation of perovskite oxide SrFe0. 8Cu0. 1Nb0. 1O3-δ ... · tive fuel cells, especially in solid oxide fuel cells [25e28]. Perovskite oxides have been widely used as both cathode](https://static.fdocument.org/doc/165x107/5ed225ea5e0ec842bd789c96/investigation-of-perovskite-oxide-srfe0-8cu0-1nb0-1o3-tive-fuel-cells.jpg)