
Contributions to the Theory of Unequal Probability - DiVA Portal
i
Surface chemistry of Al and Si (hydr)oxides, with emphasis on nano-sized gibbsite (α-Al(OH)3)
by
Jörgen Rosenqvist
Department of Chemistry, Inorganic Chemistry Umeå University Umeå, Sweden

ii
ISBN 91-7305-245-0 Printed by Solfjädern Offset AB Umeå, Sweden, 2002
iii
Surface chemistry of Al and Si (hydr)oxides, with emphasis on nano-sized gibbsite (α-Al(OH)3)
by
Jörgen Rosenqvist
Akademisk avhandling som med tillstånd av rektorsämbetet vid Umeå Universitet för erhållande av
Teknologie Doktorsexamen framlägges till offentlig granskning vid kemiska
institutionen, sal KB3B1, fredagen den 31 maj 2002, kl. 13.00.
Fakultetsopponent: Dr. Gerhard Furrer, Institute of Terrestrial Ecology,
ETH Zürich, Schweiz.
iv
Title: Surface chemistry of Al and Si (hydr)oxides, with emphasis on nano-sized gibbsite (α-Al(OH)3).
Author: Jörgen Rosenqvist
Address: Department of Chemistry, Inorganic Chemistry, Umeå University, SE-901 87 Umeå, Sweden
Abstract: This thesis contains an introduction to the surface chemistry of minerals in aqueous environment, and a summary of five manuscripts concerning adsorption reactions at the surfaces of nano-sized gibbsite (α-Al(OH)3), amorphous silica and kaolinite.
Nano-sized gibbsite was synthesized and thoroughly characterized using X-ray diffraction, high-resolution transmission electron microscopy, atomic force microscopy and Fourier transform infrared spectroscopy. The adsorption of protons and the development of charge at the surfaces were studied using high precision potentiometry and zeta potential measurements. The results showed that singly coordinated surface sites at the particle edges protonate/deprotonate, while ion pairs with the medium ions are formed at doubly coordinated surface sites at the basal planes. This ion pair formation is a slow reaction, requiring long equilibrium times.
The adsorption of o-phthalate, maleate, fumarate, malonate and oxalate onto gibbsite surfaces was studied using Fourier transform infrared spectroscopy, zeta potential measurements, adsorption measurements and theoretical frequency calculations. All ligands were found to form outer-sphere complexes at the basal planes. Significant amounts of inner-sphere complexes at the particle edges were found for malonate and oxalate only. The observed adsorption was described using surface complexation models.
The proton reactions at the surface of amorphous silica were described using a two-site model. XPS indicated that Na+ is accumulated in the vicinity of the surface. Proton reactions at kaolinite surfaces were explained using a nonelectrostatic model, assuming that only the aluminol and silanol sites at the particle edges are reactive. Extensive modeling provided support for this assumption.
Keywords: Gibbsite, silica, kaolinite, surface complexation, protonation, adsorption, carboxylates, modeling, AFM, IR, XPS.
ISBN 91-7305-245-0
66 pages and 5 papers
v
Surface chemistry of Al and Si (hydr)oxides, with emphasis on nano-sized gibbsite (α-Al(OH)3)
Jörgen Rosenqvist
Department of Chemistry, Inorganic Chemistry Umeå University, SE-901 87 Umeå, Sweden
This thesis is a summary and discussion of the following papers, which are referred to by their Roman numerals I-V in the text.
I. Protonation and charging of nanosized gibbsite (α-Al(OH)3) particles in aqueous suspension. Jörgen Rosenqvist, Per Persson and Staffan Sjöberg. Langmuir 2002, 18, 4598-4604.
II. Proton reactions at kaolinite surfaces – comparison with silica and gibbsite. Jörgen Rosenqvist, Jan Nordin and Staffan Sjöberg. To be submitted to Soil Science Society of America Journal.
III. Bonding of dicarboxylates to gibbsite surfaces: Effects of ligand structure and particle morphology. Jörgen Rosenqvist, Kristina Axe, Staffan Sjöberg and Per Persson. Submitted to Colloids and Surfaces A:
IV. Surface complexation modeling of dicarboxylate adsorption in nano-sized gibbsite systems. A mechanistic description. Jörgen Rosenqvist, Kristina Axe, Per Persson and Staffan Sjöberg. Manuscript
V. Comparison of the adsorption of o-phthalate on boehmite (γ-AlOOH), aged γ-Al2O3, and goethite (α-FeOOH). Per Persson, Jan Nordin, Jörgen Rosenqvist, Lars Lövgren, Lars-Olof Öhman and Staffan Sjöberg. Journal of Colloid and Interface Science 1998, 206, 252-266.
vi
1. INTRODUCTION.................................................................................1 2. (HYDR)OXIDES IN THIS WORK ...........................................................4
2.1. Gibbsite ...................................................................................4 2.2. Amorphous silica .....................................................................6 2.3. Kaolinite ..................................................................................7 2.4. Aged γ-Al2O3............................................................................9
3. SURFACE CHEMISTRY OF (HYDR)OXIDES..........................................10 3.1. General..................................................................................10 3.2. Surface sites...........................................................................10 3.3. Complexation and adsorption ................................................11 3.4. Surface acid/base models .......................................................12 3.5. The electrostatic double layer ................................................14
4. EXPERIMENTAL ..............................................................................17 4.1. (Hydr)oxide materials ............................................................17
4.1.1. Gibbsite..........................................................................17 4.1.2. Amorphous silica ...........................................................17 4.1.3. Kaolinite ........................................................................17 4.1.4. Aged γ-Al2O3 .................................................................18
4.2. Atomic Force Microscopy ......................................................18 4.3. X-ray Photoelectron Spectroscopy .........................................19 4.4. Potentiometric titrations ........................................................20 4.5. Zeta potential measurements..................................................21 4.6. Adsorption experiments..........................................................23 4.7. Infrared spectroscopy ............................................................23
5. PROTON REACTIONS AT THE SURFACES............................................25 5.1. Gibbsite .................................................................................25
5.1.1. Determination of particle size.........................................25 5.1.2. Titration results ..............................................................25 5.1.3. Zeta potentials................................................................28 5.1.4. Effects of the ionic medium............................................29 5.1.5. XPS analysis ..................................................................29 5.1.6. Modeling........................................................................29 5.1.7. Influence of reaction time...............................................32
5.2. Amorphous silica ...................................................................33 5.2.1. Titration results ..............................................................33 5.2.2. XPS analysis ..................................................................34 5.2.3. Modeling........................................................................35
5.3. Kaolinite ................................................................................37 5.3.1. AFM results ...................................................................37
vii
5.3.2. XPS results ....................................................................38 5.3.3. Titration results ..............................................................38 5.3.4. Modeling - subsystem models ........................................40 5.3.5. Modeling – nonelectrostatic model.................................42
6. ADSORPTION OF CARBOXYLATES ON GIBBSITE.................................45 6.1. o-phthalate.............................................................................45
6.1.1. Adsorption results ..........................................................45 6.1.2. ATR IR results ...............................................................45 6.1.3. Zeta potentials................................................................47 6.1.4. Modeling........................................................................48
6.2. Maleate and fumarate ............................................................49 6.2.1. Adsorption results ..........................................................49 6.2.2. ATR IR results ...............................................................49 6.2.3. Modeling........................................................................51
6.3. Malonate and oxalate ............................................................52 6.3.1. Adsorption results ..........................................................52 6.3.2. ATR IR results ...............................................................52 6.3.3. Modeling........................................................................54
6.4. Comparison of adsorption models...............................................56 7. SUMMARY AND IDEAS FOR FUTURE WORK .......................................59 8. ACKNOWLEDGEMENTS ...................................................................62 9. REFERENCES ..................................................................................63
1
1. Introduction Mineral/water interface geochemistry is arguably the most important subdiscipline within the general field of surface science because it affects many of the fundamental aspects of the way we live and the world around us. It plays critical roles in, for example, the quality of the world’s fresh water, the development of soils and the distribution of plant nutrients within them, the integrity of underground waste repositories, the genesis of certain types of ore and hydrocarbon deposits, and in a more global sense, the geochemical cycling of the elements.1 Adsorption, i.e. the accumulation of matter at the solid/water interface, is the basis of most surface-chemical processes. It influences the distribution of substances between the aqueous phase and particulate matter, which in turn affects the transport of substances in the natural environment. The affinity of soluble substances for surfaces regulates their residence time in the water system, their residual concentration and their ultimate fate. For instance, adsorption processes have been shown to be important for the mobility of radioactive contaminants,2 heavy metals,3 and nutrients. Adsorption also influences the reactivity of surfaces,4 thereby affecting the rates of processes such as precipitation (heterogeneous nucleation and surface precipitation), dissolution of minerals5,6 (weathering of rocks, formation of soils and sediments, corrosion of metals) and catalysis of redox processes. The interest in adsorption processes extends to many fields of science, including geochemistry, hydrogeology, chemical oceanography, aquatic toxicology, water and wastewater treatment and chemical, metallurgical, and mining engineering. Si and Al are, after oxygen, the second and third most abundant elements in the Earth’s crust, which contains about 8 % Al and more than 27 % Si. Si and Al do not occur in their elemental form, but combine with oxygen to form oxide or hydroxide minerals. Si and Al also occur together in minerals such as feldspars, micas and clays. The surface chemistry of Al and Si (hydr)oxides is therefore of great interest. The work described in this thesis is focused upon the surface
2
chemistry of three (hydr)oxide materials: Gibbsite (α-Al(OH)3), amorphous silica (SiO2 (am)), and kaolinite (Al2Si2O5(OH)4), with emphasis on gibbsite. Gibbsite (α-Al(OH)3) is one of the three hydrates of alumina which are the main constituents of bauxite and laterite deposits (the other two are diaspore and boehmite), and gibbsite is often the predominant mineral in these ores. Bauxite deposits are the products of extremely advanced weathering of aluminosilicate minerals. Gibbsite also occurs as a low temperature hydrothermal mineral in veins or cavities in aluminous igneous rocks. It is also known to occur frequently in soils.7 Synthetic gibbsite is produced in large amounts, as it is an intermediate product in the Bayer process, where bauxite is transformed into alumina and further refined into aluminum metal. The surface chemistry of gibbsite is therefore important in many different contexts. Furthermore, gibbsite is interesting as it is well known to develop a morphology with well defined surfaces which are structurally clearly different. Silicon dioxide is the main component of the crust of the Earth. Combined with oxides of sodium, magnesium, potassium, calcium, aluminum, and iron, it forms the silicate minerals in rocks and soils. Silicon dioxide occurs in a wide variety of forms, from highly crystalline forms to glassy and amorphous forms. The most abundant silica mineral in nature is crystalline quartz, but amorphous fractions also occur. It is generally believed that the surface of weathered silicate minerals is covered with a gel like layer of amorphous silica. Furthermore, hydrated amorphous silica also occurs as opal. Kaolinite is one of the most widespread clay minerals in soils. It is a product of acid weathering of rock and is most abundant in soils of warm moist climates.8 It can sometimes also be formed by hydrothermal alteration of feldspars or other silicates. The rock or aggregate which contains kaolinite is often called china clay or “kaolin” (a corruption of the Chinese word meaning “high ridge”, which is the name of a hill where the substance occurs). Besides the geochemical importance, kaolinite is also an industrially important mineral. The principal use is in the manufacture of ceramic ware, but it is also used as a filler in paper, paints, etc.
3
A thorough, mechanistic understanding of adsorption/desorption reactions is needed to understand their role in various geochemical processes.9 Understanding and describing proton reactions at the surface is a necessary first step towards a description of mineral surfaces’ affinity for other solute species. Therefore, the proton reactions at the surfaces of all the three above mentioned (hydr)oxides were investigated. The knowledge of the proton reactions was then used as a basis for further adsorption studies. The adsorption of carboxylates is frequently studied, because of their industrial and geochemical importance. In this work, the adsorption of several low molecular weight carboxylates onto the surface(s) of gibbsite was investigated, and the effect of ligand structure on the bonding mechanisms is discussed. The reactions at the mineral surfaces have been characterized using potentiometric titrations, adsorption measurements, zeta potential measurements, X-ray photoelectron spectroscopy, infrared spectroscopy and theoretical frequency calculations. The results in all systems have been explained using surface complexation models,10 which can be described as applications of solution chemistry concepts to solid/water interface chemistry.
4
2. (Hydr)oxides in this work
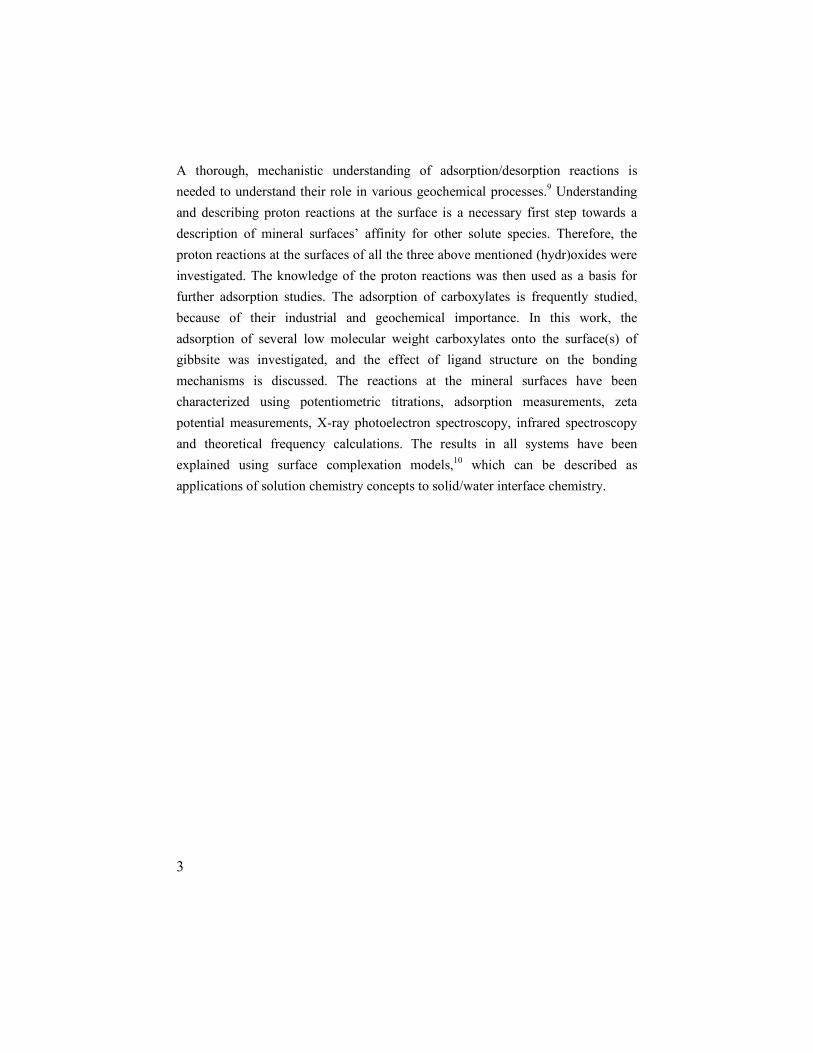
2.1. Gibbsite Gibbsite, α-Al(OH)3, has a pseudohexagonal structure with a monoclinic space group, P21/n. The structure consists of double layers (AB) of close packed OH groups with Al atoms occupying two thirds of the octahedral interstices within the layers. Each Al atom is octahedrally bonded to three O atoms of layer A and three O atoms of layer B. The AB layers are stacked in the sequence –AB-BA-AB-BA-. The layers are extended in the a and b directions, but limited in the c direction, and are held together by hydrogen bonds, leading to a preferential cleaving along the 001 crystal plane.
Figure 1. Structural representations of gibbsite. The {010} face is shown on the left and the {001} face on the right (both in the plane of the paper). Gibbsite crystals can occur in a large variety of sizes and shapes, depending on the growth conditions. The most commonly occurring morphology of natural crystals and of many industrially produced gibbsite crystals is pseudohexagonal platelike. The basal planes of these platelike particles are formed by {001} faces, whereas
5
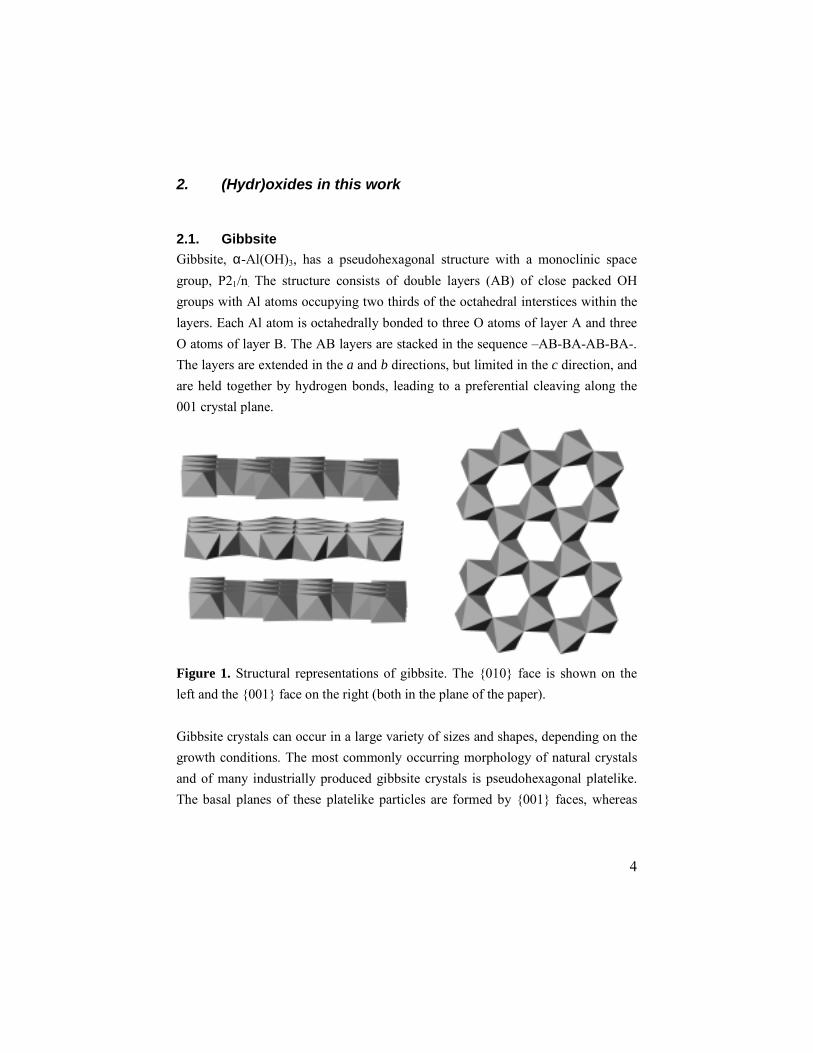
the edges commonly are ascribed to the {100}, {110} and/or {010} faces. It has also been suggested that the edges consist of {101} faces.11,12,13 The gibbsite used in this work was found to consist of thin pseudohexagonal platelets. An atomic force microscopy (AFM) image of a gibbsite particle is shown in Fig. 2. The identity of the edge faces is not clear, but AFM images clearly showed that the edges are perpendicular to the {001} basal faces, thereby ruling out the {101} faces. The remaining possibilities are {100}, {010} and {110}. The same type of surface sites can be found at all of these faces, but the density of sites varies between the different faces. Lacking further information about the identity of the edge faces, the site density for the edges was calculated as the average value for the three above mentioned faces. As the differences in site density between the different faces are small, the ambiguity in the indexing has a low impact on the results.
Figure 2. An atomic force microscopy image of a gibbsite particle. At the basal planes of gibbsite, all OH groups are connected to two Al atoms. These groups are designated ≡Al2OH. The density of these groups on the basal
6
planes is 13.8 sites per nm2. On the edges one finds both singly coordinated OH groups (designated ≡AlOH) and doubly coordinated OH groups in equal amounts. The singly coordinated OH groups always occur in pairs, on an edge of an AlO6 octahedron. The mean value for the density of each group on the edges is 8.8 nm-2. The densities were calculated using data from Saalfeld and Wedde.14
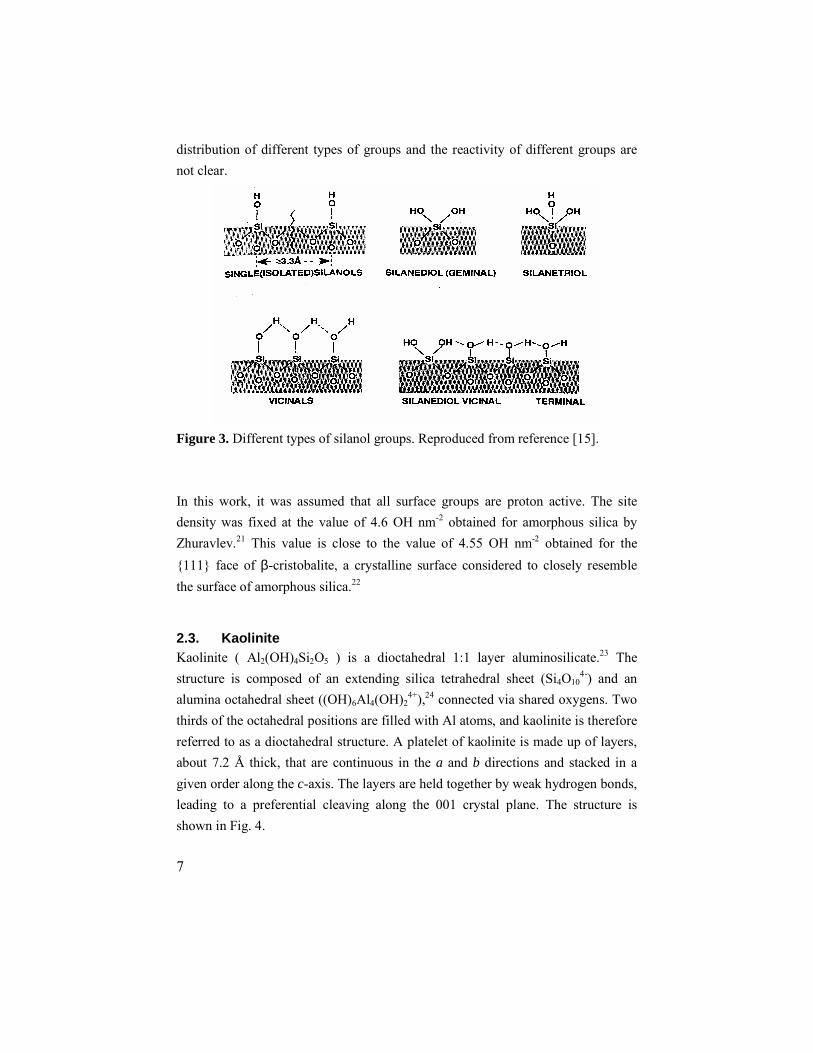
2.2. Amorphous silica The English word silica has a very broad connotation: it includes silicon dioxide in all its crystalline, amorphous, soluble, or chemically combined forms in which the silicon atom is surrounded by four or six oxygen atoms. In most silicas and silicates the silicon atom is surrounded by four oxygen atoms, forming the tetrahedral unit [SiO4]4-. Silicate materials are built up by the sharing of oxygen atoms, creating chains, sheets or three-dimensional structures. In amorphous silica the bulk structure is determined by a random packing of [SiO4]4- units, which results in a nonperiodic structure. However, there may also be limited domains with a degree of ordering.15 The term colloidal silica refers to concentrated stable dispersions of discrete, dense particles of amorphous silica of uniform particle size, within the size-range 5 - 1500 nm. The silica used in this work has a particle diameter of about 24 nm. At the surface of silica, one finds silanol (≡SiOH ) groups. Many different types of silanol groups have been postulated: single silanols, silanediols (= geminal silanols), silanetriols, hydrogen bonded vicinal silanols etc, c.f. Fig. 3. However, not all of them have been verified experimentally.15 Silanetriols are believed to be unstable and to condense further into single silanols.16 Geminal silanols on the other hand have been detected in hydrated samples, c.f. the NMR work by Chuang et al.17,18 NMR data also suggest that some silanol groups are hydrogen bonded to neighboring (vicinal) silanols, while other silanols are only hydrogen bonded to water molecules. The different schemes of hydrogen bonding are believed to have a considerable impact on the reactivity of these groups.19,20 However, the total number of surface functional groups, the
7
distribution of different types of groups and the reactivity of different groups are not clear.
Figure 3. Different types of silanol groups. Reproduced from reference [15].
In this work, it was assumed that all surface groups are proton active. The site density was fixed at the value of 4.6 OH nm-2 obtained for amorphous silica by Zhuravlev.21 This value is close to the value of 4.55 OH nm-2 obtained for the {111} face of β-cristobalite, a crystalline surface considered to closely resemble the surface of amorphous silica.22
2.3. Kaolinite Kaolinite ( Al2(OH)4Si2O5 ) is a dioctahedral 1:1 layer aluminosilicate.23 The structure is composed of an extending silica tetrahedral sheet (Si4O10
4-) and an alumina octahedral sheet ((OH)6Al4(OH)2
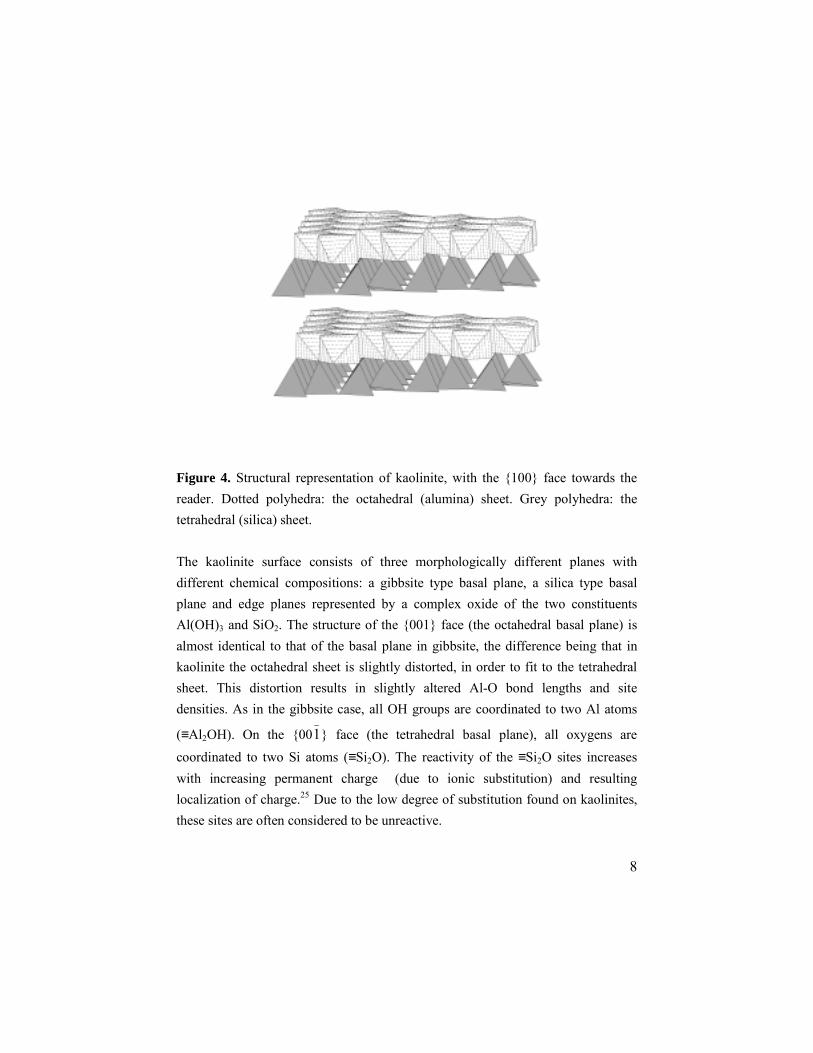
4+),24 connected via shared oxygens. Two thirds of the octahedral positions are filled with Al atoms, and kaolinite is therefore referred to as a dioctahedral structure. A platelet of kaolinite is made up of layers, about 7.2 Å thick, that are continuous in the a and b directions and stacked in a given order along the c-axis. The layers are held together by weak hydrogen bonds, leading to a preferential cleaving along the 001 crystal plane. The structure is shown in Fig. 4.
8
Figure 4. Structural representation of kaolinite, with the {100} face towards the reader. Dotted polyhedra: the octahedral (alumina) sheet. Grey polyhedra: the tetrahedral (silica) sheet.
The kaolinite surface consists of three morphologically different planes with different chemical compositions: a gibbsite type basal plane, a silica type basal plane and edge planes represented by a complex oxide of the two constituents Al(OH)3 and SiO2. The structure of the {001} face (the octahedral basal plane) is almost identical to that of the basal plane in gibbsite, the difference being that in kaolinite the octahedral sheet is slightly distorted, in order to fit to the tetrahedral sheet. This distortion results in slightly altered Al-O bond lengths and site densities. As in the gibbsite case, all OH groups are coordinated to two Al atoms
(≡Al2OH). On the {001} face (the tetrahedral basal plane), all oxygens are coordinated to two Si atoms (≡Si2O). The reactivity of the ≡Si2O sites increases with increasing permanent charge (due to ionic substitution) and resulting localization of charge.25 Due to the low degree of substitution found on kaolinites, these sites are often considered to be unreactive.
9
The three potential complexation sites remaining are located along the edge of the sheets: the aluminols (≡AlOH), the silanols (≡SiOH) and the ≡Si-O-Al2≡ sites. For the ≡Si-O-Al2≡ sites, the charge on the oxygen is fully neutralized and the group is therefore probably not reactive. Consequently, only the aluminol and silanol sites were included in the modeling. There is some uncertainty about the values for the site densities of the edge sites, since it is not clear which crystallographic plane best represents the edge surface of kaolinite. In this work, the densities were calculated as mean values of the {100} and the {110} faces, using the structure data of Young and Hewat.26 It should, however, be noted that the crystallinity of kaolinites is limited and the surfaces contain significant quantities of imperfections. The site density calculated from crystallographic data should therefore only be considered as approximate. In addition to values calculated from crystallographic data, experimentally determined values were also used.
2.4. Aged γγγγ-Al2O3 γ-Al2O3 is used in a wide variety of industrial applications, for example in electrolytic capacitors. The anodic part of a capacitor winding is an etched, anodically oxidized aluminum foil with γ-Al2O3 on its surface. The electric properties of the capacitor can be greatly affected by allowing suitable adsorbates to bind to the surface.27 The adsorption properties of γ-Al2O3 are therefore of great interest. The γ-Al2O3 used in this work was a powder of commercial grade. In contact with water, the surface is transformed into the bayerite (β-Al(OH)3) phase, as shown by Laiti et al.28 Therefore, the γ-Al2O3 suspensions were allowed to age for at least one month before use, and the designation “aged γ-Al2O3” was adopted. The surface must be considered as heterogeneous and of low crystallinity. Under these circumstances, the type and density of surface sites cannot be determined from crystallographic data on the bulk structure. Therefore, a simpler single-site model was chosen, and the total density of this site was treated as an optimizable parameter.28,29
10
3. Surface chemistry of (hydr)oxides
3.1. General Metal (hydr)oxides can be considered as inorganic polymers and the surfaces of these solids can be looked upon as extending structures, bearing surface functional groups. The functional groups contain the same donor atoms as those found in functional groups of solute ligands. Such functional groups provide a diversity of interactions through the formation of coordinative bonds.10 The similarity between complexation in solution and complexation at the (hydr)oxide/water interface means that surface complexation can be treated with models resembling those developed for complexation in solution. Models for reactions at the interface are called Surface Complexation Models (SCMs). Dzombak and Morel30 listed some criteria characteristic of surface complexation models:
i) Sorption takes place at specific surface coordination sites; ii) Sorption reactions can be described by mass law equations; iii) Surface charge results from the sorption (surface complex
formation) reaction itself; iv) The effect of surface charge on sorption (extent of complex formation)
can be taken into account by applying a correction factor derived from the electric double layer theory to the mass law constants for surface reactions.
3.2. Surface sites The atoms at the surface of a dry (hydr)oxide particle differ from the atoms in the internal structure by being coordinatively unsaturated. The formation of this unsaturation can be pictured by cleaving a single crystal, which among other things involves breaking a number of bonds. When (hydr)oxide surfaces come into contact with water, the coordinative unsaturation leads to a dissociative chemisorption of water, schematically represented by:10
11
Mn+ O2- Mn+ OH-
+ H2O ⇄⇄⇄⇄ [1]
Mn+ Mn+ OH- Therefore, in aqueous suspension the dominating surface functional group, often referred to as surface site, on (hydr)oxide surfaces is the hydroxyl (OH) group. In addition, molecular water adsorbs to the hydroxide groups, resulting in a multilayer, three or more molecules thick, that has properties different to those of bulk liquid water. A number of different surface hydroxyl groups can be identified. The main feature that distinguishes these hydroxyl groups from one another is the number of metal atoms to which the hydroxyl groups are coordinated. OH groups coordinated to only one metal atom are called singly coordinated or terminal hydroxyls, whereas OH groups coordinated to more than one metal are called bridging hydroxyls. Bridging hydroxyls might be coordinated to two, three, or four metal atoms and are therefore called doubly, triply and quadrupely coordinated, respectively.
3.3. Complexation and adsorption A complex is a unit in which an ion, atom, or molecule binds to other ions, atoms, or molecules. The binding species is termed a central group and a bound species is termed a ligand.31 Adsorption is described in terms of a set of complex formation reactions between dissolved solutes and surface functional groups. Ligands can be associated with the surface in different ways. In the formation of inner-sphere complexes a chemical (largely covalent) bond between the central atom and the ligand is formed. In outer-sphere complexes on the other hand, one or more water molecules remain between the ligand and the central atom and no direct bond is formed. Outer-sphere complexes are held together mainly by electrostatic forces.
12
Inner-sphere complexes can be classified by the ligand’s mode of binding to the surface. If the ligand is attached to only one surface functional group, the complex is termed monodentate, whereas a ligand connected to two surface functional groups forms a bidentate complex. Higher orders are also sometimes observed. Bidentate complexes can in turn be further classified by considering the number of central atoms (in the solid material) included in the complex. If a bidentate complex involves two central atoms, the complex is generally referred to as a bridging complex, whereas a bidentate complex involving only one central atom is referred to as a mononuclear chelate.
3.4. Surface acid/base models The original view of the surface sites on metal (hydr)oxide surfaces was that the sites would have a neutral “ground state” (≡MOH), which could be protonated or deprotonated, according to the following reactions:
≡MOH + H+ ⇄⇄⇄⇄ ≡MOH2+ [2]
≡MOH ⇄⇄⇄⇄ ≡MO- + H+ [3]
To describe these two consecutive protonation/deprotonation steps, one needs two pKa values and this conceptual model is therefore known as the “two pKa model”. Several authors participated in the development of this model, early works were presented for example by Parks and deBruyn.32,33 When the two pKa model was combined with the Constant Capacitance Model by Schindler and Gamsjäger,34 a simple and robust description of the solid/water interface was obtained. The two pKa model has been used extensively in a variety of fields within the surface complexation research area. In the last two decades new, alternative views have been proposed. Bolt and van Riemsdijk35 argued for the use of only one pKa value in some systems. Looking at the most common (i.e. Al and Fe containing) hydroxides in nature, one finds that the M3+ ions most often are octahedrally coordinated to six oxygen atoms. This means that each oxygen atom will neutralize one sixth of the charge on the metal,
13
i.e. 0.5 charge units. If the oxygen atoms are coordinated to only one metal ion, the half unit charge from the metal means that the OH group can not be neutral, it will have either +0.5 (≡MOH2
0.5+) or –0.5 (≡MOH0.5-) charge. Any other protonation steps are unlikely to occur within the normal pH range, and therefore the protonation of the surface can be described using only one pKa. Therefore this concept became known as the one pKa model. On some surfaces, one can find OH groups coordinating three Al or Fe atoms. These surface sites will also have only two probable modes, ≡M3O0.5- and ≡M3OH0.5+, and the behavior of these can also be described using one pKa value. For OH groups coordinating two Al or Fe atoms, one finds that the description becomes identical to the two pKa concept. For silicate surface sites the situation is a little different, as the Si atom is +4 charged and usually found in tetrahedral coordination. This means that each oxygen atom neutralizes one unit of charge on the Si, leading to the formation of a neutral surface species ≡SiOH. Experimental evidence indicates that this species exists at low pH, and deprotonates into ≡SiO- at high pH. Protonation of ≡SiOH has not been observed within the normal pH-range of experiments. Proton reactions at silica surface sites can thus be described using only one pKa value, even though the formal description of the reaction is consistent with the two pKa concept. van Riemsdijk and coworkers have now developed this concept into the MUSIC36,37 and the extended MUSIC38 models. These models rely on crystallographic information. In the latest version, the extended MUSIC model, the degree of charge neutralization on the surface oxygens is calculated from the length of the bonds between the oxygen and the surrounding metal atoms. The neutralization degree can then be used to calculate the corresponding pKa values for different OH groups.
14
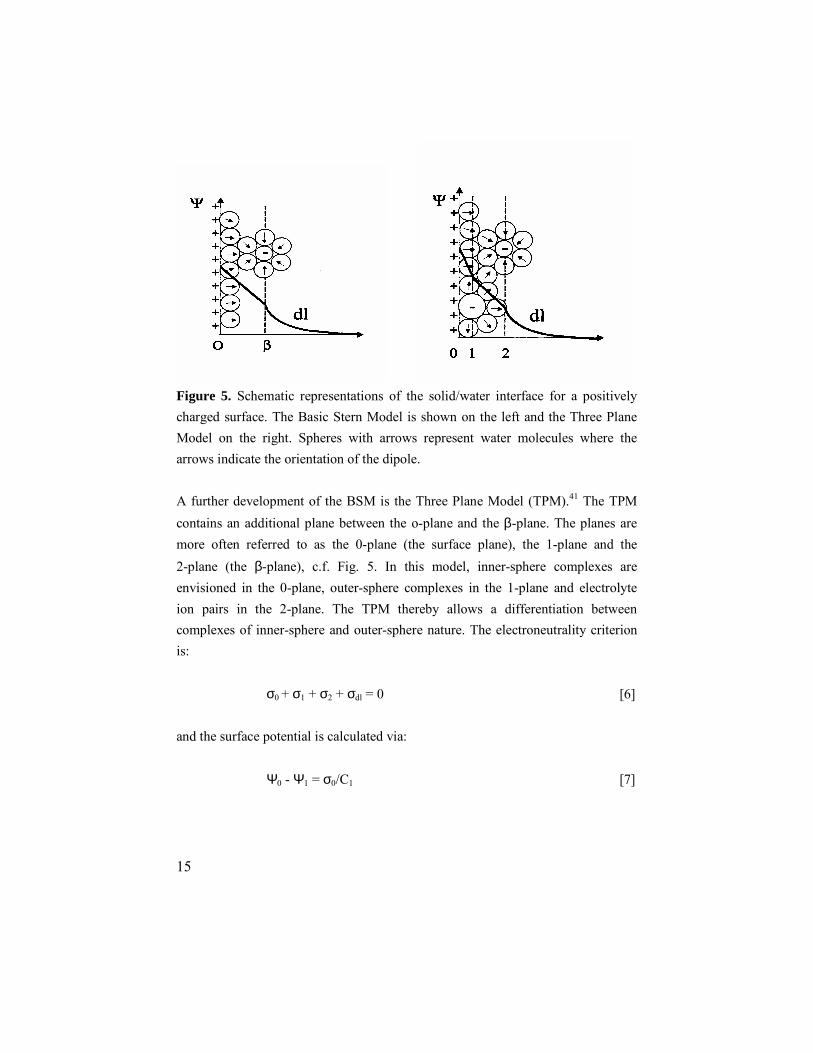
3.5. The electrostatic double layer The adsorption of protons or other ions onto metal (hydr)oxide surfaces leads to a development of charge on the surface. The electroneutrality of the solid/water interface is regained through the adsorption of oppositely charged ions from the ionic medium, thereby creating an electrostatic double layer (EDL). This EDL can be described using a variety of models. The most basic model is the Helmholtz-Perrin model,39 which treats the EDL as a molecular capacitor with two parallel plates, one plate of charged surface groups and one plate of oppositely charged counter ions. The space between the two plates is known as the compact layer, since it would be completely filled with hydrated counter ions. However, it has been experimentally proven that the net charge on the parallel plates is not always zero. To ensure electroneutrality over the interface, a swarm of counter ions will appear on the solution side of the interface, forming a diffuse layer. Combining the charge free layer between the two planes (plates) and a diffuse layer, one obtains the Basic Stern Model (BSM), c.f. Fig. 5. Further details about the BSM can be found in reference [40]. In this model, the surface plane is called the o-plane, and the border between the compact layer and the diffuse layer (dl) is called the β-plane. Ions coordinated to the surface are considered to be placed in the o-plane, whereas electrolyte ion pairs are placed in the β-plane. The criterion for electroneutrality is:
σo + σβ + σdl = 0 [4] where σ is the charge of the plane denoted in the subscript and has the unit C/m2. The resulting surface potential can be calculated from:
Ψo - Ψβ = σo/C [5] where Ψo is the potential in the o-plane, Ψβ the corresponding potential in the β-plane, and C is the capacitance in the Stern layer (compact layer) (F/m2).
15
Figure 5. Schematic representations of the solid/water interface for a positively charged surface. The Basic Stern Model is shown on the left and the Three Plane Model on the right. Spheres with arrows represent water molecules where the arrows indicate the orientation of the dipole. A further development of the BSM is the Three Plane Model (TPM).41 The TPM contains an additional plane between the o-plane and the β-plane. The planes are more often referred to as the 0-plane (the surface plane), the 1-plane and the 2-plane (the β-plane), c.f. Fig. 5. In this model, inner-sphere complexes are envisioned in the 0-plane, outer-sphere complexes in the 1-plane and electrolyte ion pairs in the 2-plane. The TPM thereby allows a differentiation between complexes of inner-sphere and outer-sphere nature. The electroneutrality criterion is:
σ0 + σ1 + σ2 + σdl = 0 [6] and the surface potential is calculated via:
Ψ0 - Ψ1 = σ0/C1 [7]
16
where Ψ0 is the potential in the 0-plane, Ψ1 the potential in the 1-plane, and C1 is the capacitance of the charge free layer between the two planes. For the area between the 1-plane and the 2-plane, the potential relationship is given by:
Ψ1 - Ψ2 = (σ0 + σ1)/C2 [8] where Ψ1 is the potential in the 1-plane, Ψ2 the potential in the 2-plane, and C2 is the capacitance of the charge free layer between the two planes. The two capacitors act in series, such that:
21tot C1
C1
C1 += [9]
In Paper V, the extended constant capacitance model (ECCM) is used to describe the adsorption processes. The ECCM contains two planes of adsorption, one for inner-sphere complexes and one for outer-sphere complexes. As the ECCM does not include any diffuse layer, the obtained formation constants will be ionic strength dependent. Further details about the ECCM can be found in reference [42].
17
4. Experimental
4.1. (Hydr)oxide materials
4.1.1. Gibbsite Gibbsite was prepared using a method similar to that described by Gastuche and Herbillon.43 A 1 M AlCl3 (Riedel-de Haën, extra pure) solution was titrated with 4 M NaOH (Merck p.a.) until pH reached a value of about 4.6, where a massive precipitation of amorphous aluminum hydroxide occurred. The suspension was heated for 2 hours at 40 °C, transferred into Spectra/Por® Cellulose Ester dialysis membranes and dialyzed in Milli-Q water at 50 °C for at least 4 weeks. The dialysis water was exchanged daily during the first two weeks and every second day after that. The resulting suspension had a solid content of 12 g/l and a pH of 4.6. One batch was aged for 9 months and then used for most of the experiments. Another batch was prepared in the same way, but used for experiments immediately after the dialysis, without ageing.
4.1.2. Amorphous silica The silica (SiO2) suspensions were prepared from a 50 wt-% suspension of pure
silica (Ludox TM-50, Aldrich Chemical Company). The suspensions were diluted to 10 g/l and acidified to pH = 2.5. Solid NaCl was added to give an ionic medium of 20 mM or 100 mM Na(Cl). The manufacturer reports a specific surface area of 125 m2/g. 4.1.3. Kaolinite A total of six kaolinites were studied, three samples from primary deposits in Cornwall, England and three samples from secondary deposits in Georgia, USA. The different samples were characterized with respect to their content of ancillary minerals (X-ray powder diffraction), content of inorganic elements (ICP-AES) and specific surface area (BET), c.f. Table 1 in Paper II. After the initial characterization, 20 g/l suspensions of kaolinite in 100 mM NaCl were prepared
18
from each sample. The suspensions were equilibrated with the ionic medium for 24 hours, whereafter the solid was allowed to settle and the solution was decanted. The different minerals were washed twice in 100 mM NaCl and finally stored as 20 g/l suspensions in 100 mM NaCl.
4.1.4. Aged γγγγ-Al2O3 The adsorption properties of aged γ-Al2O3 were studied in Paper V. Suspensions were prepared from a powder of γ-Al2O3 (AKP-G015, Sumitomo Chemical Company). The suspensions had a solid concentration of 20 g/l and a 100 mM Na(Cl) ionic medium. In water, γ-Al2O3 is not thermodynamically stable and a transformation of the surface into the bayerite (β-Al(OH)3) phase occurs.28 Therefore, the γ-Al2O3 suspensions were allowed to age for at least one month before use, and the designation “aged γ-Al2O3” was adopted. The specific surface area of this material was 140 m2/g. In Paper V, the results from the aged γ-Al2O3 system are compared with previously obtained results for boehmite (γ-AlOOH) and goethite (α-FeOOH). These materials are described in detail in Paper V and in references therein.
4.2. Atomic Force Microscopy Atomic force microscopy (AFM) is a scanning method of imaging surfaces which can provide topographical information down to the nanometer level. An atomically sharp tip (typically made from Si3N4 or Si) attached to a flexible cantilever is scanned across the surface of the sample in order to construct an image of the surface. Piezo-electric scanners are used to accomplish the fine control of the scanning motion. A diode laser beam is reflected off the cantilever onto a dual element photodiode. Any height variation on the sample surface causes the cantilever to flex and the position of the reflected laser beam on the photodiode to change. Feedback from the photodiode difference signal enables the tip to maintain either a constant force (to obtain height information) or constant height (to obtain force information) above the sample surface.
19
In this work the constant force mode was used to generate data on the physical size of the particles. A few kaolinite particles were imaged, in order to give a rough idea of the aspect ratio (ratio between height and diameter) of the particles. This data was used to calculate the distribution of specific surface area between edges and basal planes. However, the number of particles studied was considered too low to allow a determination of the total surface area. In the gibbsite system a more thorough investigation was performed, and the obtained data was used to determine the total specific surface area and its distribution on different planes. Samples for atomic force microscopy (AFM) were prepared by dropping a dilute (about 0.1 g/l) suspension onto a freshly cleaved, 10 mm diameter, disk of mica. After a few minutes of contact time, the surface was rinsed gently with deionised water and then allowed to dry in air. The samples were imaged with a Digital Instruments Nanoscope III instrument, operated in Tapping Mode™. The images obtained were plane fitted before analysis.
4.3. X-ray Photoelectron Spectroscopy X-ray photoelectron spectroscopy (XPS, also known as ESCA) is a well-established method to characterize solid materials. The technique can be applied to solids in any shape or form, i.e. powder samples, single crystals or fibers. The technique can provide a chemical map of the surface with a spatial resolution of ~10 µm. The technique relies on the photo excitation of electrons using X-rays, which are subsequently guided into an energy analyzer. The escape depth of electrons from solids limits the depth of information to ~2-5 nm, providing a technique which is highly surface sensitive. XPS provides information about the electronic structure around a certain element, thus giving information about oxidation state, coordination etc. In addition, depth profiling is possible. XPS was used to characterize the gibbsite, silica and kaolinite particles used in this work. In the kaolinite system, the possible substitution of Al into the tetrahedral layer was studied. For gibbsite and silica, XPS was used to study the quantities of Na+ and Cl- ions in the vicinity of the surface. Suspensions were equilibrated at the
20
desired conditions, centrifuged and decanted, and the resulting wet pastes were used for XPS studies. All XPS spectra were recorded with a KRATOS Axis Ultra electron spectrometer using a monochromated Al Kα source operated at 225 W. To compensate for the surface charging a low energy electron gun was used. A liquid nitrogen freezing procedure of the wet paste was developed, in order to preserve the (hydr)oxide/ water interface in vacuum to the extent possible. This procedure includes a precooling of the end of the sample transfer rod (20 min at –170°C) and a waiting time (30 sec) after sample loading before pumping of the introducing chamber. After pumping to 10-7 torr, the sample was transferred to the manipulator, cooled to –165°C, where it was kept until the base vacuum (3-5 x 10⁻⁹ torr) in the analysis chamber was reached. Wide spectra (pass energy 160 eV) and spectra of the separate photoelectron lines for the elements of interest (Al 2p, Si 2p, O 1s, Na 1s, Na 2s, Cl 2p and C 1s) were acquired (pass energy 10 or 20 eV). After the measurements the sample was kept in the analysis chamber and allowed to warm to room temperature overnight, and subsequently another XPS spectrum was aquired. The binding energy (BE) scale was referenced to the C 1s line of aliphatic carbons at 285.0 eV.
4.4. Potentiometric titrations Reactions involving protons can be studied using potentiometric titrations. In this technique, the free concentration of protons is measured and the total concentration can be calculated from the starting concentration and the added amounts of reactants. The amount of protons bound in complexes can then be determined as the difference between the total and free concentrations. Changes in the amount of bound protons are readily detected in potentiometric titrations. In this work, the adsorption and/or desorption of protons at the surface(s) of the (hydr)oxide materials was followed utilizing potentiometric titrations. The titrations were performed with a computer controlled system for precise emf measurements.44 The concentration of free protons (h) was determined by measuring the voltage of the cell:
21
- Ag, AgCl (s) ionic medium equilibrium suspension glass electrode + or alternatively: - Ag, AgCl (s) ionic medium equilibrium suspension Pt , H2(g) (1 atm) +
H2(g) electrodes were used for titrations at pH ≥ 9, where a glass electrode is not sufficiently accurate. The electrode setup was calibrated either by titrating a hydrochloric acid solution of known concentration before and after every titration (gibbsite, kaolinite, aged γ-Al2O3), or by an in situ calibration in the acidic range (silica). The obtained values of hydrogen ion concentration were recalculated into hydrogen ion activities, and all pH values reported in this thesis refer to hydrogen ion activity (pH = -log{H+}). Activity coefficients for the different ionic strengths were calculated with the Davies equation.45 It is important to avoid contamination by CO2 (g) from the air, since CO2 in contact with water forms carbonic acid, thus affecting the proton balance of the system. Therefore, an inert atmosphere was maintained by a flow of moisturized argon gas above the suspension. In order to maintain a constant temperature, the experiments were performed in a room thermostated at 25 ± 1 °C and the titration vessel was partly immersed into an oil bath thermostated at 25.0 ± 0.1 °C. Concentrations and formation constants for various species in solution or at the solid surfaces can be evaluated from the data obtained, using a suitable software package. In this work, modified versions of the program FITEQL46 were used for data treatment and evaluation. Further details about the application of potentiometric techniques to complexation studies are given in reference [47].
4.5. Zeta potential measurements The charge/potential at the surface of a particle can be detected using a technique called (micro)electrophoresis. When a suspension is affected by an applied electric field, all particles with a nonzero charge will respond to the electric field by moving. The direction and velocity of the movement is determined by the applied
22
field and by the charge of the particle. The movement of the particles can be detected in various ways. The instrument used in this work uses two coherent laser beams for detection. The moving particles will scatter the light and the frequency of the scattered light is slightly shifted. This frequency shift can be used to determine the electrophoretic mobility of the particles. At the solid/solution interface, the first few layers of water molecules are stagnant, meaning that they will move together with the particle. At some distance from the surface, a boundary will be created between water molecules that move together with the particle, and water molecules that remain stationary. This boundary is called the slip plane and the potential determined in electrophoresis is the potential at this slip plane, not the potential at the surface itself. The potential of the slip plane is known as the zeta potential. The mobility values obtained from electrophoresis measurements can be recalculated into zeta potentials (ζ), using the relationship:
µE = (2εζ / 3η) * f(κa) [10]
where µE is the electrophoretic mobility, ε is the dielectric constant of water, η is the viscosity of water and f(κa) is a complex function which depends on the particle shape. The main use of this experimental technique in the present work was in the determination of the isoelectric point (IEP) for gibbsite in 10, 20, 30 and 100 mM (Na)Cl medium. The IEP is the pH at which the particle has zero mobility, i.e. the net surface charge is zero. In addition, the zeta potential vs. pH curves of gibbsite in 20 and 100 mM ionic medium were determined and correlated to theoretical model curves. Zeta potential vs. pH curves also provided some insight into the adsorption of carboxylates onto gibbsite. In order to ensure a sufficiently high intensity of light passing through the sample, diluted suspensions had to be used. A solid concentration around 1 g/l was used in most experiments. The zeta potential of kaolinite particles could not be determined,

23
since the large particle size results in a sedimentation that is too fast, and the results are therefore not reliable.
4.6. Adsorption experiments The adsorption of o-phthalate, maleate, fumarate, malonate and oxalate onto gibbsite was studied in series of batch adsorption experiments. Appropriate amounts of gibbsite suspension, ligand solution and acid or base were mixed together in test tubes and allowed to equilibrate for at least 24 hours under end-over-end rotation. The pH was then measured and readjusted if necessary. Ar(g) was bubbled through the suspensions during handling, to avoid contamination by CO2(g). The solid and aqueous phases were separated by centrifugation. Due to the small particle size of gibbsite, a high g-force was necessary to obtain a phase separation, and the samples were therefore centrifuged at 18 000 rpm for 15 min. The solid phase was used for FTIR or XPS measurements and the amount of ligand remaining in solution was determined using various techniques. The adsorbed amount could then be calculated from the known total concentration of the ligand. The concentrations of o-phthalate were determined with UV-spectrophotometry at 275 nm, using a Shimadzu UV-2100 spectrophotometer. Maleate and fumarate were determined with UV at 210 nm. Since Cl- absorbs some radiation at this wavelength, all standards and samples were prepared with the same Cl- concentration. The malonate and oxalate solutions were spiked with 14C labeled isotopes. 14C was added to a total activity of approximately 300 Bq per ml of suspension. The concentration of oxalate/malonate remaining in solution was determined with the liquid scintillation technique. The supernatant from the centrifugation was mixed with Optiphase High Safe 3 scintillation liquid and analyzed with a 1209 Primo scintillation counter.
4.7. Infrared spectroscopy Infrared spectroscopy is a technique based on the transitions in vibrational and rotational states of a molecule. A molecule can only absorb radiation when the incoming infrared radiation is of the same frequency as one of the fundamental
24
modes of vibration of the molecule. The absorption leads to an increased vibrational motion of a part of the molecule, while the rest of the molecule is unaffected. The energy needed to increase the vibrational motion depends on the nature of the molecule. Chemical information can therefore be extracted from infrared spectra. In the present work, Fourier transform infrared spectroscopy (FTIR) was used to obtain in-situ information about the structure of various complexes at the (hydr)oxide/water interface. Quantitative information was also extracted from the spectra. The IR spectra were collected with a Perkin-Elmer Spectrum 2000 FTIR spectrometer, equipped with a deuterated triglycine sulfate (DTGS) detector. All sorption samples were analyzed as wet pastes with the attenuated total reflection (ATR) technique. The spectra were recorded with a horizontal ATR accessory and a diamond crystal as the reflection element (SensIR Technologies). The angle of incidence for this setup is approximately 45°, which is far from the critical angle. The samples for IR analyses were prepared in agreement with the adsorption experiments described above. After collecting the spectra of the empty cell and the supernatant, the wet paste was uniformly applied directly onto the diamond crystal and a quartz lid was placed over the sample and pressed tightly against a rubber gasket. This sealed the sample from the atmosphere during data collection. For each spectrum, one hundred scans were collected at a resolution of 4 cm-1. The raw spectrum of the wet paste is dominated by features of the cell itself and by the strong contributions from water. Therefore, in order to isolate the spectrum of the ligands at the water/gibbsite interface, a subtraction procedure is necessary, of which the most critical step is to correctly remove the 1638 cm-1 water peak originating from the bending motion of bulk water. For subtraction, the empty cell spectrum is first subtracted from the supernatant and wet paste spectra, after which the resulting supernatant spectrum is subtracted from the corresponding paste spectrum. In this step, the subtraction of the 1638 cm-1 water peak is accomplished by using an appropriate subtraction factor for the supernatant spectrum. In this study, the factor varied between 0.99 and 0.97. All IR measurements were conducted in a laboratory thermostated at (24.0±0.2) oC.
25
5. Proton reactions at the surfaces
5.1. Gibbsite 5.1.1. Determination of particle size The size of the gibbsite particles was evaluated using AFM, dynamic light scattering and X-ray powder diffraction techniques. An AFM image of a gibbsite particle is presented in Fig. 2. The aged gibbsite, that was used for most of the experiments, was found to have an average diameter (edge to edge distance) of 200 nm and an average height of 10 nm. Further details about the particle size determinations can be found in Paper I. The specific surface area was calculated from the observed particle dimensions. A total specific surface area of 91 m2/g was obtained, distributed as 83 m2/g basal plane area and 8.3 m2/g edge area. The specific surface area of the nonaged particles was estimated from AFM images to be 53 m2/g, with the particle edges accounting for 9 m2/g. 5.1.2. Titration results In a potentiometric titration, the actual protonation level of the surface cannot be measured, only changes in the protonation level. Therefore, one needs a well-defined starting point. If a good starting point exists, then the protonation level at all pH values can be calculated from the titration data. When a suspension is prepared from a commercial grade powder, it can usually (but not always) be assumed that the surface of this material is uncharged and therefore the starting value for the total concentration of protons is zero. However, this should be experimentally verified. In this case the gibbsite was obtained as a suspension, not as a powder. The pH of the suspension after the dialysis step was 4.6. Since the IEP of gibbsite is approximately 10, there must be protons attached to the surface at pH 4.6. This amount of protons had to be carefully determined, in order to provide a starting point for the calculations. Since chloride was the only anion introduced in the synthesis step, and the suspension must have overall charge neutrality, it was assumed that the amount of protons at the surface was equal to the amount of chloride remaining in the suspension after dialysis. The amount of chloride was
26
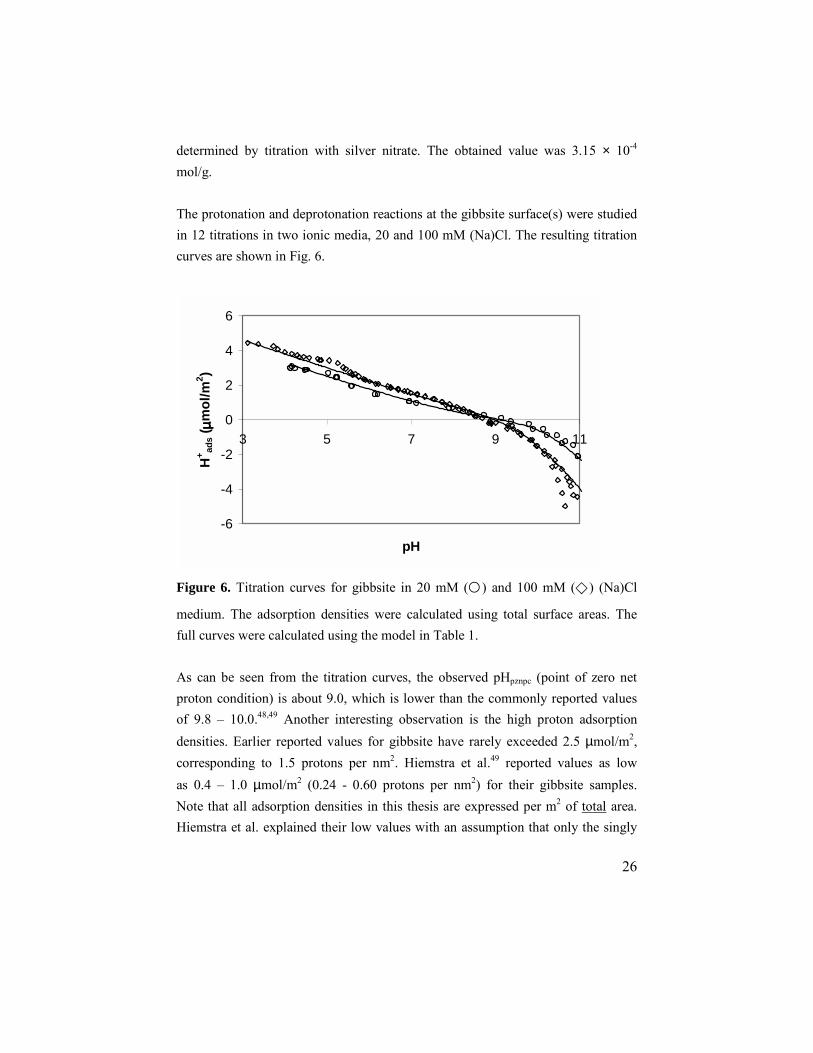
determined by titration with silver nitrate. The obtained value was 3.15 × 10⁻⁴ mol/g. The protonation and deprotonation reactions at the gibbsite surface(s) were studied in 12 titrations in two ionic media, 20 and 100 mM (Na)Cl. The resulting titration curves are shown in Fig. 6.
Figure 6. Titration curves for gibbsite in 20 mM (�) and 100 mM (�) (Na)Cl
medium. The adsorption densities were calculated using total surface areas. The full curves were calculated using the model in Table 1. As can be seen from the titration curves, the observed pHpznpc (point of zero net proton condition) is about 9.0, which is lower than the commonly reported values of 9.8 – 10.0.48,49 Another interesting observation is the high proton adsorption densities. Earlier reported values for gibbsite have rarely exceeded 2.5 µmol/m2, corresponding to 1.5 protons per nm2. Hiemstra et al.49 reported values as low as 0.4 – 1.0 µmol/m2 (0.24 - 0.60 protons per nm2) for their gibbsite samples. Note that all adsorption densities in this thesis are expressed per m2 of total area. Hiemstra et al. explained their low values with an assumption that only the singly
-6
-4
-2
0
2
4
6
3 5 7 9 11
pH
H+ ad
s (µµ µµm
ol/m
2 )
27
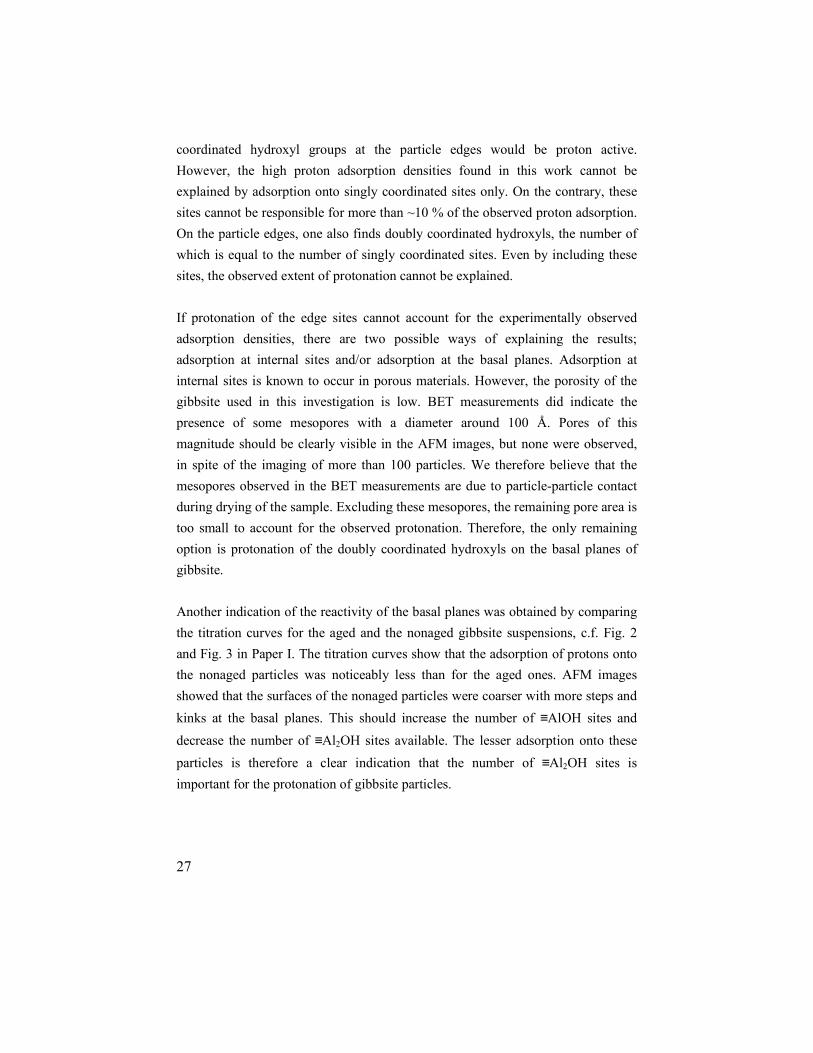
coordinated hydroxyl groups at the particle edges would be proton active. However, the high proton adsorption densities found in this work cannot be explained by adsorption onto singly coordinated sites only. On the contrary, these sites cannot be responsible for more than ~10 % of the observed proton adsorption. On the particle edges, one also finds doubly coordinated hydroxyls, the number of which is equal to the number of singly coordinated sites. Even by including these sites, the observed extent of protonation cannot be explained. If protonation of the edge sites cannot account for the experimentally observed adsorption densities, there are two possible ways of explaining the results; adsorption at internal sites and/or adsorption at the basal planes. Adsorption at internal sites is known to occur in porous materials. However, the porosity of the gibbsite used in this investigation is low. BET measurements did indicate the presence of some mesopores with a diameter around 100 Å. Pores of this magnitude should be clearly visible in the AFM images, but none were observed, in spite of the imaging of more than 100 particles. We therefore believe that the mesopores observed in the BET measurements are due to particle-particle contact during drying of the sample. Excluding these mesopores, the remaining pore area is too small to account for the observed protonation. Therefore, the only remaining option is protonation of the doubly coordinated hydroxyls on the basal planes of gibbsite. Another indication of the reactivity of the basal planes was obtained by comparing the titration curves for the aged and the nonaged gibbsite suspensions, c.f. Fig. 2 and Fig. 3 in Paper I. The titration curves show that the adsorption of protons onto the nonaged particles was noticeably less than for the aged ones. AFM images showed that the surfaces of the nonaged particles were coarser with more steps and kinks at the basal planes. This should increase the number of ≡AlOH sites and decrease the number of ≡Al2OH sites available. The lesser adsorption onto these particles is therefore a clear indication that the number of ≡Al2OH sites is important for the protonation of gibbsite particles.
28
The titration curves in Fig. 6 display an unusual feature, a “bump”, at around pH 5 for both ionic media. The bump appears in titrations in both acidic and alkaline directions, which indicates that it is not due to precipitation of soluble Al. FTIR spectra obtained for gibbsite at pH 5.2 showed features in the OH stretching region that are not observed at any pH outside this pH region. Spectra for gibbsite at pH 5.2 and pH 7.0 are shown in Fig. 4 in Paper I, together with a difference spectra. Additional OH bands can be seen at 3420 and 3470 cm-1 in the difference spectra. This indicates a transformation of the surface in the pH range of the bump, resulting in the appearance of new OH groups, possibly through formation of some amorphous polynuclear compound.
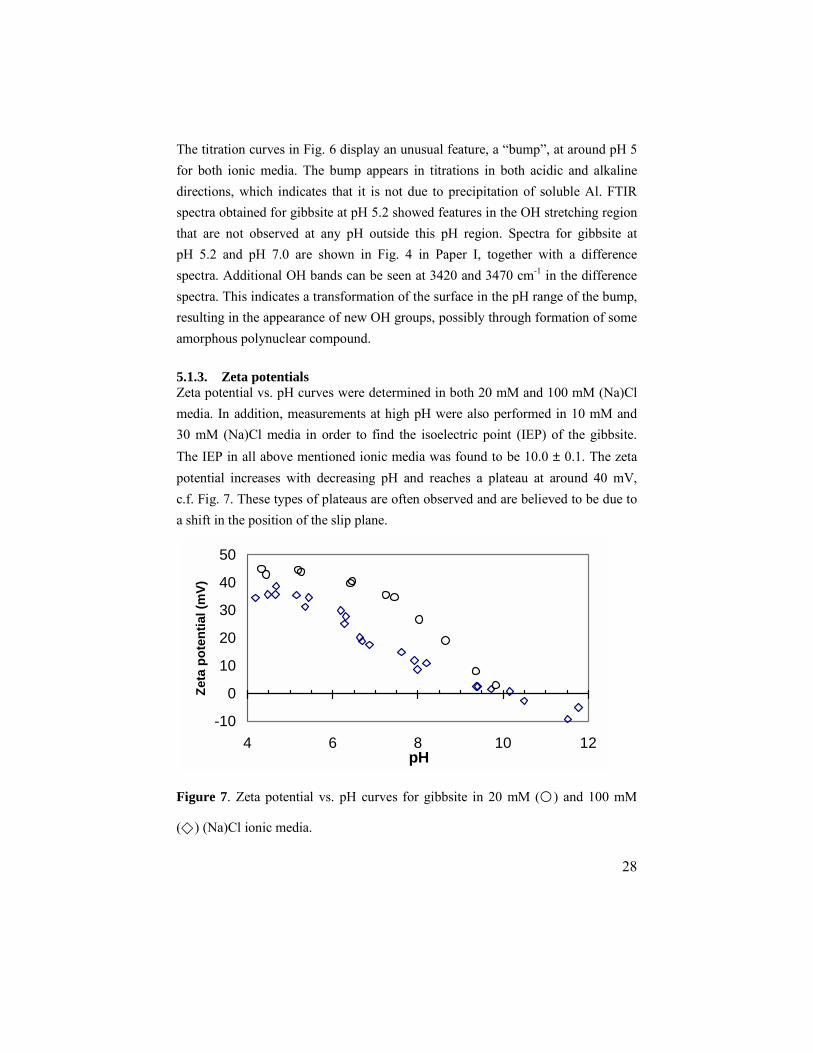
5.1.3. Zeta potentials Zeta potential vs. pH curves were determined in both 20 mM and 100 mM (Na)Cl media. In addition, measurements at high pH were also performed in 10 mM and 30 mM (Na)Cl media in order to find the isoelectric point (IEP) of the gibbsite. The IEP in all above mentioned ionic media was found to be 10.0 ± 0.1. The zeta potential increases with decreasing pH and reaches a plateau at around 40 mV, c.f. Fig. 7. These types of plateaus are often observed and are believed to be due to a shift in the position of the slip plane.
-10
0
10
20
30
40
50
4 6 8 10 12pH
Zeta
pot
entia
l (m
V)
Figure 7. Zeta potential vs. pH curves for gibbsite in 20 mM (�) and 100 mM
(�) (Na)Cl ionic media.
29
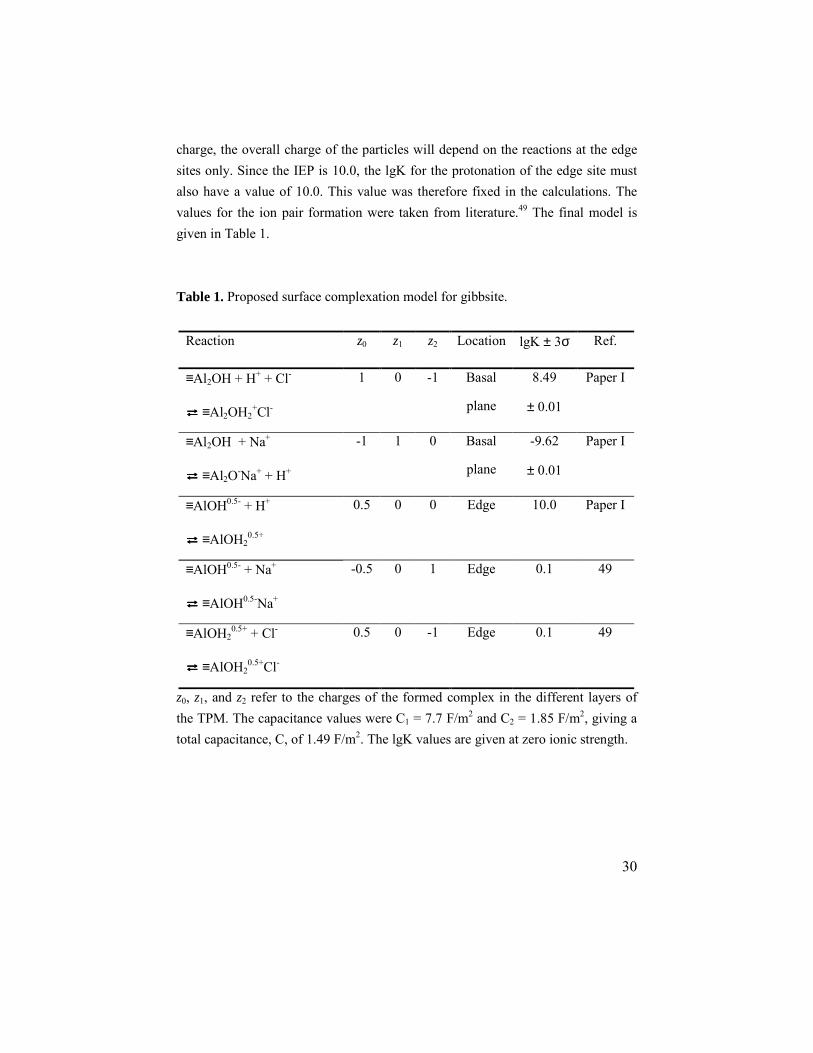
5.1.4. Effects of the ionic medium One very interesting feature can be observed by comparing Figs. 6 and 7. There is a clear difference in the values of pHpznpc and IEP, which indicates that there is a difference between protonation and charging of the gibbsite surface(s). This could be due to several factors, but adsorption of ions from the ionic medium is certainly a possibility. An IEP value higher than pHpznpc indicates that the medium cation interacts more strongly with the surface than the medium anion. The shape of the titration curves (Fig. 6) also indicates that there is an interaction between the surface and the medium ions. In particular the large difference in buffering capacity at high pH suggests that Na+ interacts quite strongly with the surface. 5.1.5. XPS analysis XPS analysis was utilized to study the quantities of Na+ and Cl- ions in the vicinity of the surface. However, the exact location of these ions, relative to the surface, could not be determined. The results showed that the amount of Na+ increases and the amount of Cl- decreases with increasing pH. At high pH, above pH 10.7, this trend becomes especially pronounced. The ratio between Na+ and Cl- reaches unity slightly below pH 9, almost coinciding with the pHpznpc obtained from the titration data. 5.1.6. Modeling Preliminary modeling indicated that the adsorbed medium ions should be placed at different distances from the surface. Therefore, the Three Plane Model41 (TPM) was used to describe the EDL. The best fit to experimental data from titrations and zeta potential measurements was obtained by a model where the ≡Al2OH sites on the basal planes form ion pairs with the medium ions, according to the reactions given in Table 1, and the ≡AlOH sites on the edges protonate/deprotonate according to the one pKa model. Since the particle edges form only a minor part of the surface, it was not possible to optimize the lgK values for the reactions at the edge sites. However, since the ion pairs formed at the basal planes have no net
30
charge, the overall charge of the particles will depend on the reactions at the edge sites only. Since the IEP is 10.0, the lgK for the protonation of the edge site must also have a value of 10.0. This value was therefore fixed in the calculations. The values for the ion pair formation were taken from literature.49 The final model is given in Table 1. Table 1. Proposed surface complexation model for gibbsite.
Reaction z0 z1 z2 Location lgK ± 3σ Ref.
≡Al2OH + H+ + Cl-
⇄⇄⇄⇄ ≡Al2OH2+Cl-
1 0 -1 Basal
plane
8.49
± 0.01
Paper I
≡Al2OH + Na+
⇄⇄⇄⇄ ≡Al2O-Na+ + H+
-1 1 0 Basal
plane
-9.62
± 0.01
Paper I
≡AlOH0.5- + H+
⇄⇄⇄⇄ ≡AlOH20.5+
0.5 0 0 Edge 10.0 Paper I
≡AlOH0.5- + Na+
⇄⇄⇄⇄ ≡AlOH0.5-Na+
-0.5 0 1 Edge 0.1 49
≡AlOH20.5+ + Cl-
⇄⇄⇄⇄ ≡AlOH20.5+Cl-
0.5 0 -1 Edge 0.1 49
z0, z1, and z2 refer to the charges of the formed complex in the different layers of the TPM. The capacitance values were C1 = 7.7 F/m2 and C2 = 1.85 F/m2, giving a total capacitance, C, of 1.49 F/m2. The lgK values are given at zero ionic strength.
31
In this model, the Na+ ions adsorbed at the basal plane were placed closer to the surface, in the 1-plane, whereas the other adsorbed medium ions were placed in the 2-plane. This does not imply that the Na+ ion is bound as an inner-sphere complex, only that it is situated closer to the surface. The charge neutralization on the ≡Al2OH edge sites might be slightly different from the ≡Al2OH sites on the basal planes, and the lgK values could therefore be different. Due to this uncertainty, the doubly coordinated edge sites were excluded from the final model, to keep the number of optimizable parameters low. Preliminary calculations showed that including or excluding these sites only has a minor influence on the fit of the model to experimental data. Comparing calculated surface potentials to measured zeta potentials is complicated due to the nonspherical shape of the particles and the presence of surfaces with different charges. However, some comparisons can be made using the “equivalent sphere” approach of Loewenberg and O’Brien.50 Since there is no buildup of net charge on the basal planes, and the surface area of the equivalent sphere is equal to the edge area of the gibbsite particle, the experimentally obtained zeta potentials should be close to the actual potentials at the particle edges. When comparing the experimental zeta potentials ( ζ ) to the calculated surface potentials, it was assumed that ζ = ψdl, i.e. that the slip plane is situated at the head end of the diffuse layer. For the 100 mM case a good fit was obtained, while for the 20 mM system the fit was not quite as good and the predicted values were consistently too high. The proposed model provides an explanation for the difference between protonation and charging of gibbsite. Since the ratio between ≡Al2OH sites at the basal planes and ≡AlOH sites at the edges is approximately 15:1, protonation will be dominated by reactions at ≡Al2OH sites. The value of pHpznpc is therefore mostly dependent on the formation constants for the ion pairs at ≡Al2OH sites. However, as discussed above, there is no buildup of net charge on the basal planes and the charge of the particle therefore depends on reactions at ≡AlOH sites only.
32
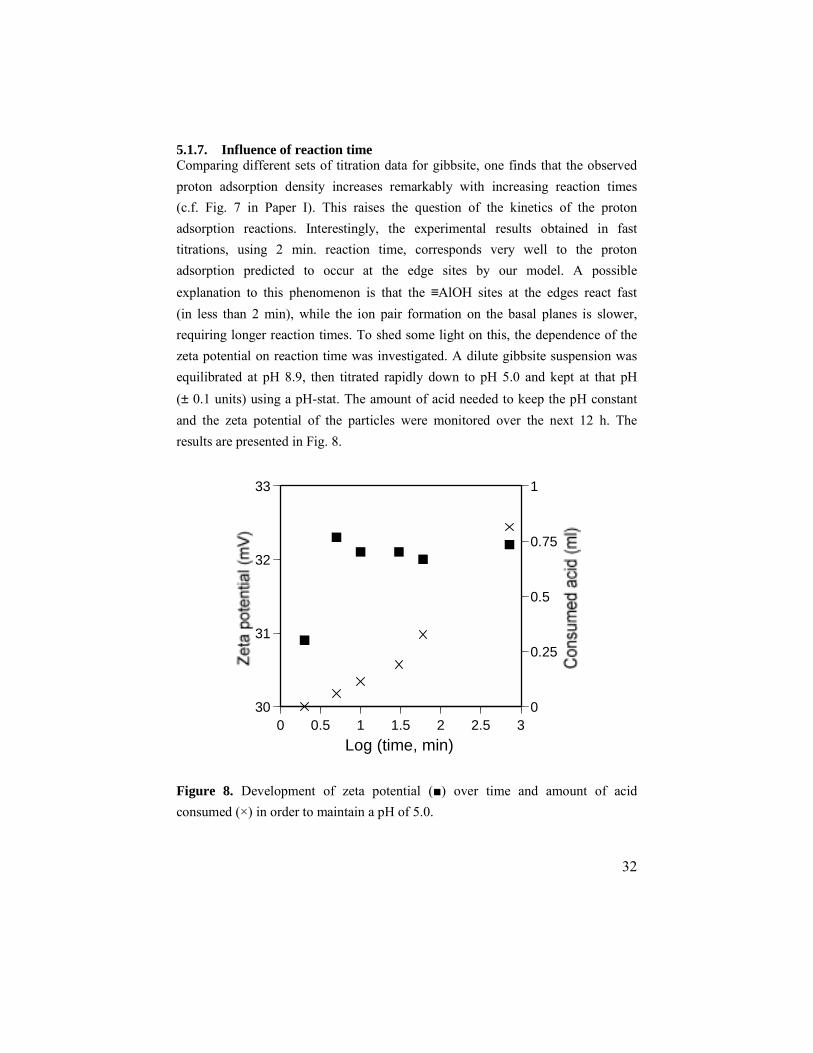
5.1.7. Influence of reaction time Comparing different sets of titration data for gibbsite, one finds that the observed proton adsorption density increases remarkably with increasing reaction times (c.f. Fig. 7 in Paper I). This raises the question of the kinetics of the proton adsorption reactions. Interestingly, the experimental results obtained in fast titrations, using 2 min. reaction time, corresponds very well to the proton adsorption predicted to occur at the edge sites by our model. A possible explanation to this phenomenon is that the ≡AlOH sites at the edges react fast (in less than 2 min), while the ion pair formation on the basal planes is slower, requiring longer reaction times. To shed some light on this, the dependence of the zeta potential on reaction time was investigated. A dilute gibbsite suspension was equilibrated at pH 8.9, then titrated rapidly down to pH 5.0 and kept at that pH (± 0.1 units) using a pH-stat. The amount of acid needed to keep the pH constant and the zeta potential of the particles were monitored over the next 12 h. The results are presented in Fig. 8.
30
31
32
33
0
0.25
0.5
0.75
1
0 0.5 1 1.5 2 2.5 3Log (time, min)
Figure 8. Development of zeta potential (■) over time and amount of acid consumed (×) in order to maintain a pH of 5.0.
33
The results clearly show that the zeta potential is more or less constant from 5 min onward, whereas the proton consumption continues for several hours. The fact that a substantial proportion of the proton adsorption occurs without any significant change in the zeta potential, clearly shows that the protons are involved in the formation of complexes with no net charge. This experimental evidence supports the modeling results (section 5.1.6). These results also support the hypothesis about differences in kinetics for the adsorption reactions. Proton adsorption reactions are generally considered to be fast, with reaction times in the order of seconds. Ion pair formation is also usually very fast. The slow kinetics of the reactions at the basal planes is therefore surprising. However, the reaction mechanism in this case is more complicated than normal ion pair formation, since it involves a protonation or deprotonation step, thereby requiring formation or breakage of a coordinative (ionic) bond.
5.2. Amorphous silica 5.2.1. Titration results
-1.5
-1
-0.5
0
3 4 5 6 7 8 9 10pH
H+ ad
s (µµ µµm
ol/m
2 )
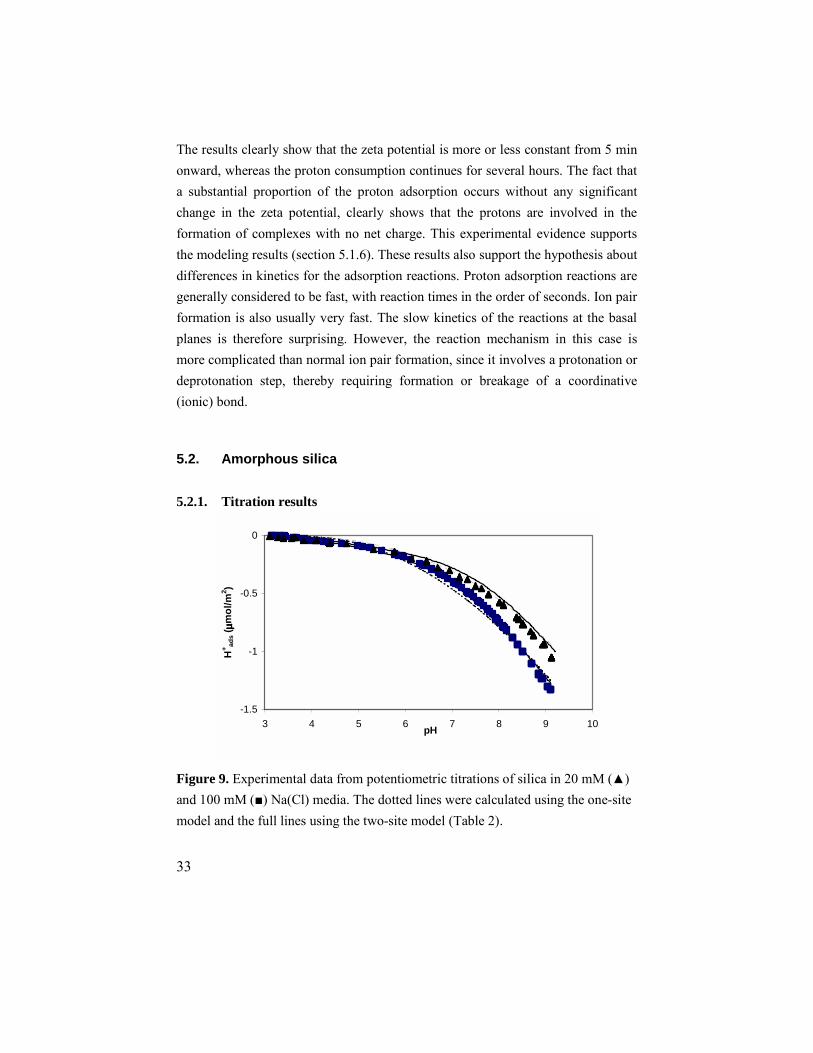
Figure 9. Experimental data from potentiometric titrations of silica in 20 mM (▲) and 100 mM (■) Na(Cl) media. The dotted lines were calculated using the one-site model and the full lines using the two-site model (Table 2).
34
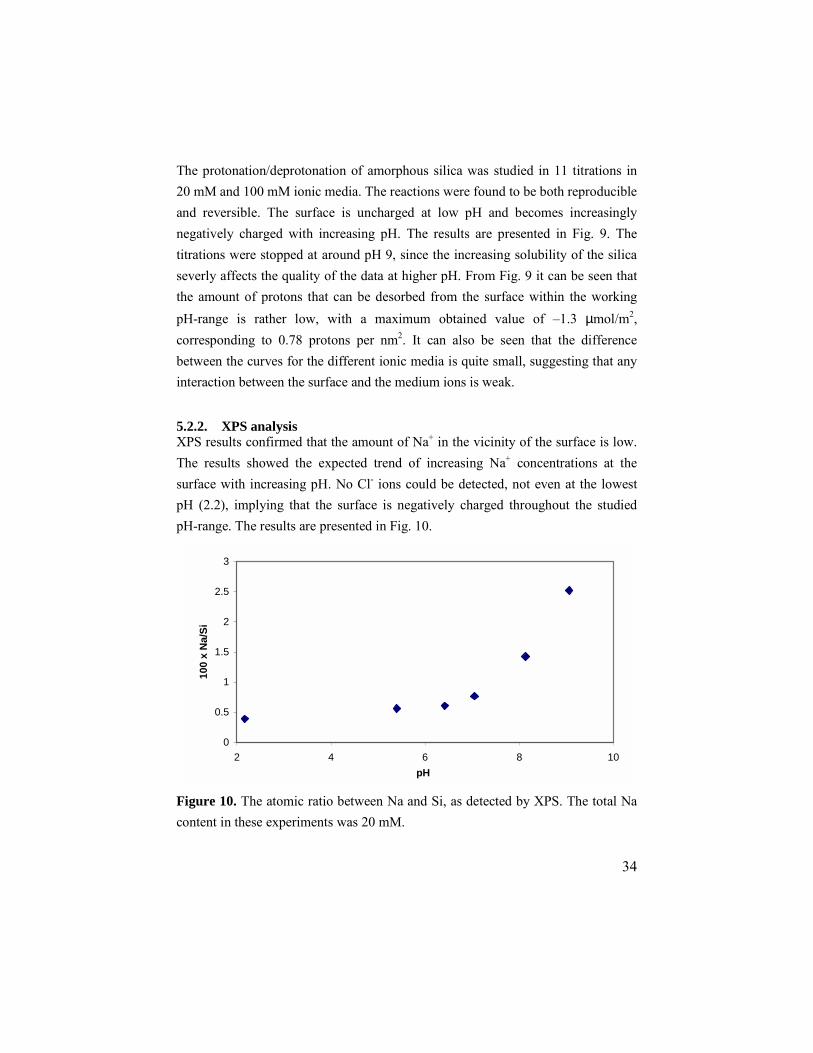
The protonation/deprotonation of amorphous silica was studied in 11 titrations in 20 mM and 100 mM ionic media. The reactions were found to be both reproducible and reversible. The surface is uncharged at low pH and becomes increasingly negatively charged with increasing pH. The results are presented in Fig. 9. The titrations were stopped at around pH 9, since the increasing solubility of the silica severly affects the quality of the data at higher pH. From Fig. 9 it can be seen that the amount of protons that can be desorbed from the surface within the working pH-range is rather low, with a maximum obtained value of –1.3 µmol/m2, corresponding to 0.78 protons per nm2. It can also be seen that the difference between the curves for the different ionic media is quite small, suggesting that any interaction between the surface and the medium ions is weak. 5.2.2. XPS analysis XPS results confirmed that the amount of Na+ in the vicinity of the surface is low. The results showed the expected trend of increasing Na+ concentrations at the surface with increasing pH. No Cl- ions could be detected, not even at the lowest pH (2.2), implying that the surface is negatively charged throughout the studied pH-range. The results are presented in Fig. 10.
0
0.5
1
1.5
2
2.5
3
2 4 6 8 10pH
100
x N
a/Si
Figure 10. The atomic ratio between Na and Si, as detected by XPS. The total Na content in these experiments was 20 mM.
35
The shape of the curve in Fig. 10 clearly resembles the (inverted) shape of the titration curves in Fig. 9. This implies that the deprotonation of the silica surface is accompanied by an accumulation of sodium ions in the interface. However, the XPS data does not reveal the exact location of the Na+ ions, which might be bound to the surface in a complex of some type, or simply located in the diffuse part of the double layer. 5.2.3. Modeling As discussed in section 2.2, the density of proton active surface site concentration was fixed at 4.6 OH nm-2. The concentration of the soluble species Si(OH)4 (aq) was also fixed, at a value of 10-2.7 M.51 This value was also verified from analysis of the silica suspensions. The concentrations of other soluble silica species were calculated using formation constants from reference [52]. The initial modeling approach was to describe the experimental data with a simple model containing only one surface site (≡SiOH). A ≡SiO-Na+ ion pair was included in the calculations. However, this approach was not successful, as the obtained model lines do not have the curvature needed to correctly fit the data. The model lines are shown as dotted lines in Fig. 9. The quality of the fit is not acceptable, especially in the 100 mM system. Therefore, a model containing a second surface site (denoted ≡XOH) was evaluated. The sum of site densities was still set to 4.6 OH nm-2, but the relative amounts of the two different sites were varied. Ion pair formation with Na+ was included on the ≡SiOH site only. This approach led to an improved fit to experimental data. The best model obtained is listed in Table 2 and presented as full lines in Fig. 9.
36
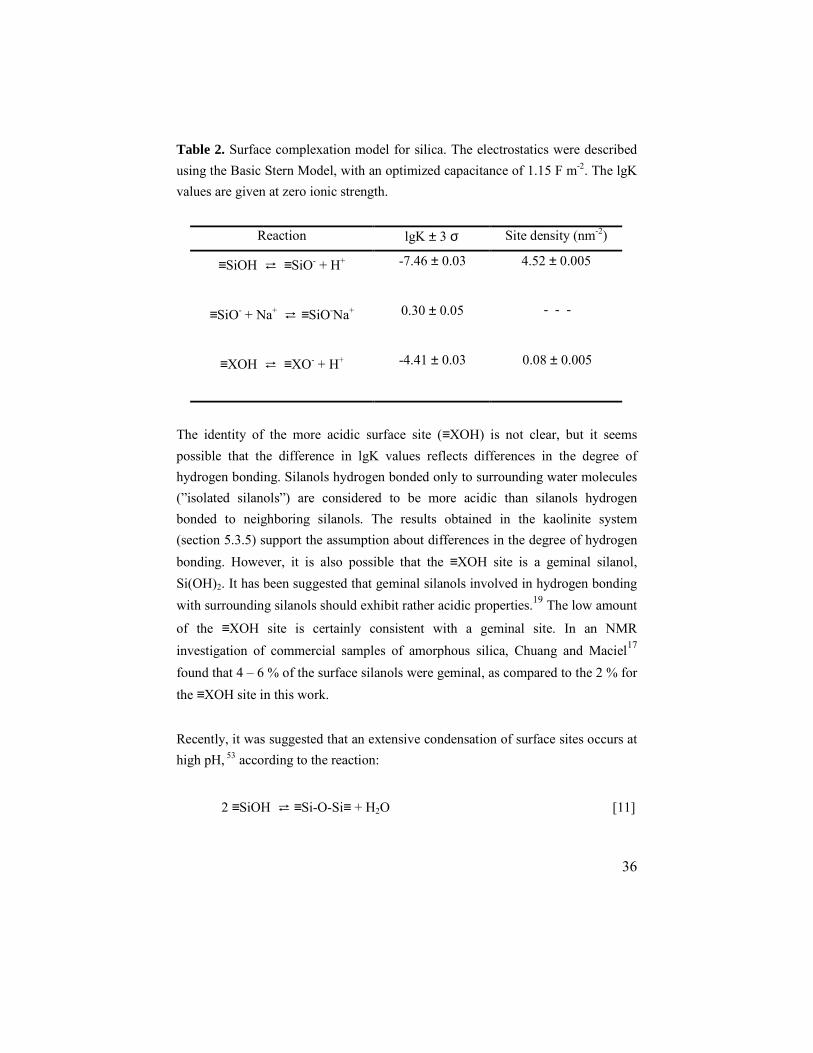
Table 2. Surface complexation model for silica. The electrostatics were described using the Basic Stern Model, with an optimized capacitance of 1.15 F m-2. The lgK values are given at zero ionic strength.
Reaction lgK ± 3 σ Site density (nm-2)
≡SiOH ⇄ ≡SiO- + H+ -7.46 ± 0.03 4.52 ± 0.005
≡SiO- + Na+ ⇄ ≡SiO-Na+ 0.30 ± 0.05 - - -
≡XOH ⇄ ≡XO- + H+ -4.41 ± 0.03 0.08 ± 0.005
The identity of the more acidic surface site (≡XOH) is not clear, but it seems possible that the difference in lgK values reflects differences in the degree of hydrogen bonding. Silanols hydrogen bonded only to surrounding water molecules (”isolated silanols”) are considered to be more acidic than silanols hydrogen bonded to neighboring silanols. The results obtained in the kaolinite system (section 5.3.5) support the assumption about differences in the degree of hydrogen bonding. However, it is also possible that the ≡XOH site is a geminal silanol, Si(OH)2. It has been suggested that geminal silanols involved in hydrogen bonding with surrounding silanols should exhibit rather acidic properties.19 The low amount
of the ≡XOH site is certainly consistent with a geminal site. In an NMR investigation of commercial samples of amorphous silica, Chuang and Maciel17 found that 4 – 6 % of the surface silanols were geminal, as compared to the 2 % for the ≡XOH site in this work. Recently, it was suggested that an extensive condensation of surface sites occurs at high pH, 53 according to the reaction:
2 ≡SiOH ⇄ ≡Si-O-Si≡ + H2O [11]
37
Modeling attempts showed that our results could be described reasonably well with a model where this type of condensation is included. The difference in the sum of error squares between different models is not very large. However, if the condensation would occur at the suggested magnitude, there should be an inflection point in the titration curves at high pH and the curves should flatten out on approaching saturation of the remaining surface sites. The titration curves presented in Fig. 9 show no such tendency. Consequently, no condensation of the surface was incorporated into the final model. It is also difficult to see why the condensation would increase with increasing pH. Considering the mechanisms involved in the formation of polysilicates and polysilicic acid, an opposite trend would be more likely.
5.3. Kaolinite Six different kaolinite samples were characterized with respect to the content of ancillary minerals (X-ray powder diffraction), content of inorganic elements (ICP-AES) and specific surface area (BET). The results are presented in Table 1 in Paper II. After the initial characterization, the Jordan “no-chemical clay” was chosen for further studies. 5.3.1. AFM results AFM images showed that the Jordan kaolinite consists of hexagonal particles with an average diameter (edge to edge distance) of about 1 µm and a thickness of 100 – 200 nm. From the observed particle dimensions, it was estimated that 20 – 25 % of the total surface area was on the edge planes. Due to the low number of particles imaged, a determination of the total surface area from the images was considered too uncertain. Instead, the measured BET value (10 m2/g) was used in the calculations. It was also observed that the surfaces of the kaolinite particles were quite rough, with a high number of steps, kinks and imperfections.
38
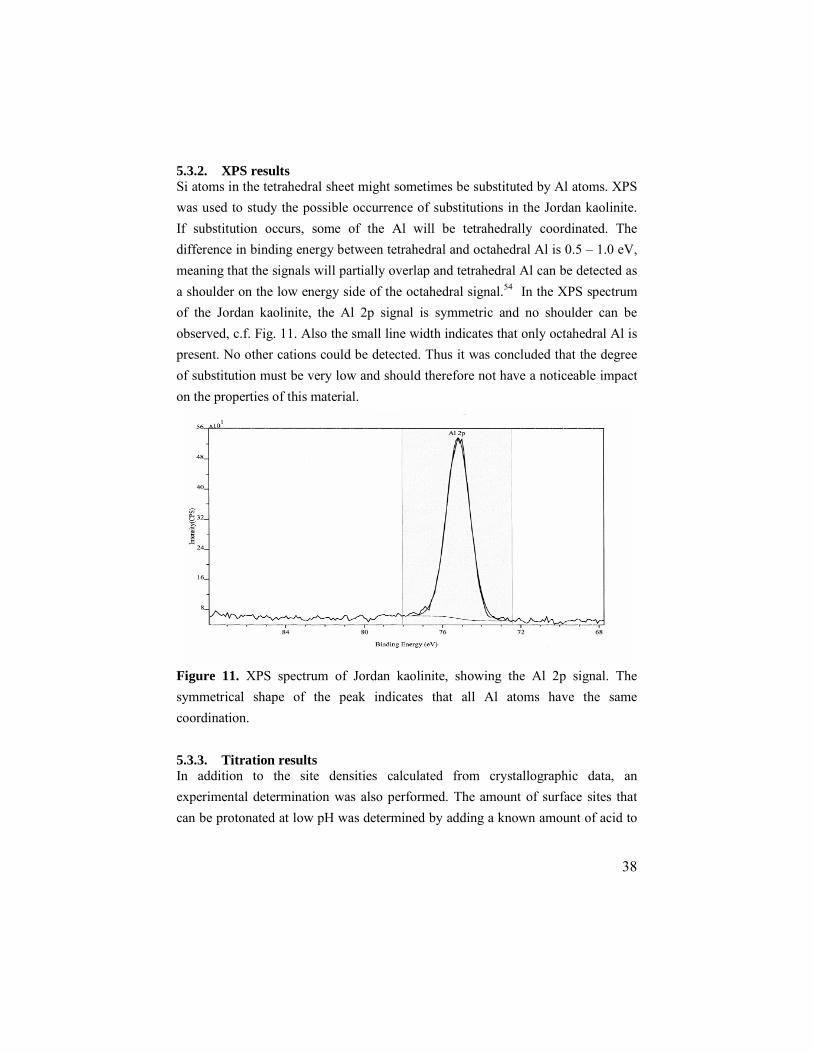
5.3.2. XPS results Si atoms in the tetrahedral sheet might sometimes be substituted by Al atoms. XPS was used to study the possible occurrence of substitutions in the Jordan kaolinite. If substitution occurs, some of the Al will be tetrahedrally coordinated. The difference in binding energy between tetrahedral and octahedral Al is 0.5 – 1.0 eV, meaning that the signals will partially overlap and tetrahedral Al can be detected as a shoulder on the low energy side of the octahedral signal.54 In the XPS spectrum of the Jordan kaolinite, the Al 2p signal is symmetric and no shoulder can be observed, c.f. Fig. 11. Also the small line width indicates that only octahedral Al is present. No other cations could be detected. Thus it was concluded that the degree of substitution must be very low and should therefore not have a noticeable impact on the properties of this material.
Figure 11. XPS spectrum of Jordan kaolinite, showing the Al 2p signal. The symmetrical shape of the peak indicates that all Al atoms have the same coordination. 5.3.3. Titration results In addition to the site densities calculated from crystallographic data, an experimental determination was also performed. The amount of surface sites that can be protonated at low pH was determined by adding a known amount of acid to
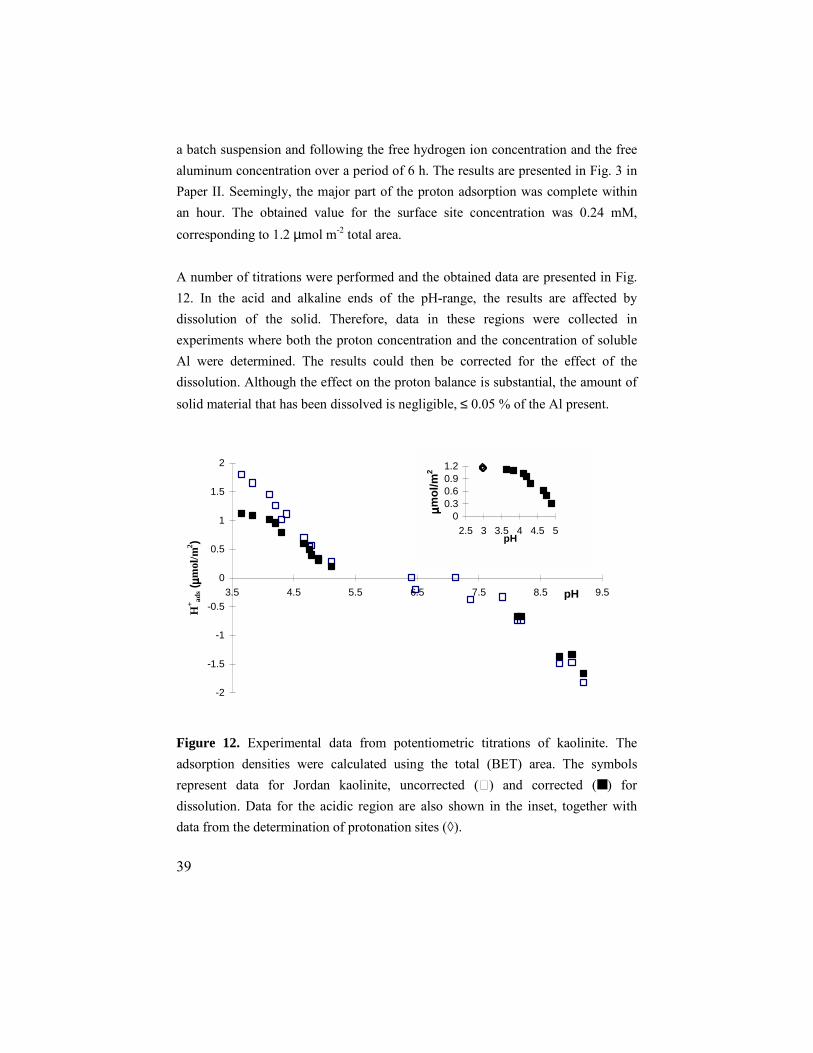
39
a batch suspension and following the free hydrogen ion concentration and the free aluminum concentration over a period of 6 h. The results are presented in Fig. 3 in Paper II. Seemingly, the major part of the proton adsorption was complete within an hour. The obtained value for the surface site concentration was 0.24 mM, corresponding to 1.2 µmol m-2 total area. A number of titrations were performed and the obtained data are presented in Fig. 12. In the acid and alkaline ends of the pH-range, the results are affected by dissolution of the solid. Therefore, data in these regions were collected in experiments where both the proton concentration and the concentration of soluble Al were determined. The results could then be corrected for the effect of the dissolution. Although the effect on the proton balance is substantial, the amount of solid material that has been dissolved is negligible, ≤ 0.05 % of the Al present.
-2
-1.5
-1
-0.5
0
0.5
1
1.5
2
3.5 4.5 5.5 6.5 7.5 8.5 9.5pH
H+ ad
s (µµ µµm
ol/m
2 )
00.30.60.91.2
2.5 3 3.5 4 4.5 5pH
µµ µµmol
/m2
Figure 12. Experimental data from potentiometric titrations of kaolinite. The adsorption densities were calculated using the total (BET) area. The symbols represent data for Jordan kaolinite, uncorrected (ٱ) and corrected (■ ) for dissolution. Data for the acidic region are also shown in the inset, together with data from the determination of protonation sites (◊).
40
It is clear that the protonation is almost complete at pH = 3.5 and that the concentration of protonation sites determined between pH 2.9 and 3.1 represents a fully saturated surface. A corresponding saturation of the surface below pH 3.5 has been observed for kaolinitic soil samples.55 The data in Fig. 12 indicates a pHpznpc around 6.5. All titration data above pH = 9.5 are excluded from the modeling since major dissolution of the solid was observed in this pH range. The protonation level of the kaolinite is not especially high (Fig. 12), if the total surface area is regarded. If it is assumed that the edges make up 20 % of the total surface area, all the adsorbed/desorbed protons could be fitted onto the edges. 5.3.4. Modeling - subsystem models Several different approaches were tested in the modeling. It has been suggested that the surface reactions on aluminosilicates, like kaolinite, could be described by models which have been built from the models of the two subsystems, silica and gibbsite. This approach was tested, using the reactions and formation constants described in Table 1 and 2, respectively. It was assumed that the tetrahedral basal plane is unreactive, an assumption supported by the lack of substitution found by XPS. Therefore only the octahedral (gibbsite type) basal plane and the edge planes were considered in the modeling. Since the specific capacitances found in the gibbsite and silica systems were different, the capacitance value for kaolinite was treated as an optimizable parameter. Actually, with fixed site densities and lgK values, the specific capacitance is the only optimizable parameter. The site densities were calculated from crystallographic data, assuming that the edges make up 20 % of the total surface area. The fact that the surface seems saturated with protons in the acidic range, at a value of about 1.2 µmol m-2, while values ≤ –1.8 µmol m-2 were found in the alkaline range, indicates that at least two different surface sites are involved in the protonation and deprotonation reactions.
41
It was attempted to explain the experimental data with a model containing only the ≡SiOH and ≡AlOH0.5- sites at the edges, as well as with a model where the ≡Al2OH sites on the basal planes were included. Further details about these models can be found in Paper II. The resulting model curves are presented as curves No. 1 and 2 in Fig. 13. It is evident that these models fail in several ways to describe the experimental data. The model lines are almost straight, far from the marked s-shape of the experimental data, and the pHpznpc is around 9, which is several units higher than the experimentally observed value. These two modeling attempts clearly showed that simply combining models for the subsystems does not result in any useful model for the kaolinite. Similar conclusions have been reached by others, e.g. Brady et al.56 The crystallographic data reveals a possible explanation for the failure of the subsystem models. As discussed in section 2.3, the gibbsite sheet in kaolinite is slightly distorted in order to fit to the silica sheet. This results in decreased metal to oxygen bond lengths, which will result in lowered pKa values. Therefore, the MUSIC model36,38 was used to calculate new pKa values for the reactions used in the gibbsite system. The pKa of the singly coordinated ≡AlOH0.5- groups on the edges shifts from 10.0 in the gibbsite system to approximately 6.7 in the kaolinite case. As the silanol group is not affected by the distortion, there is no change in the pKa for that group. Predicting how the decrease in bond lengths affects the formation of the ion pairs found on the basal planes of gibbsite is quite difficult. These ion pairs were therefore excluded from this part of the modeling work. Again, two different models were tested, one where only the edge sites were treated as reactive, and one where deprotonation of the ≡Al2OH sites on the basal planes was included. Further details about these models can be found in Paper II. The resulting model curves are presented as curves No. 3 and 4 in Fig. 13. The quality of the fit to data has improved, compared with model No. 1 and 2, but it is still not acceptable. The predicted pHpznpc values are quite close to the experimental value, but the shape of the model curves is still far from correct and the fit to data is poor.
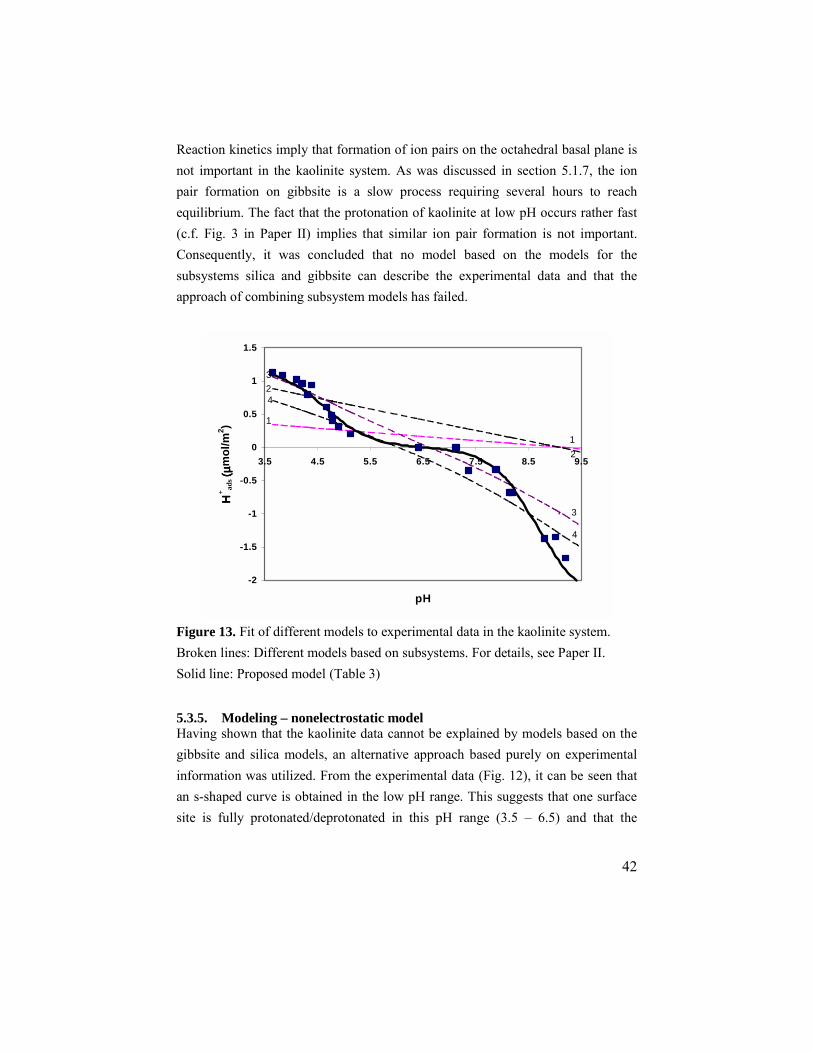
42
Reaction kinetics imply that formation of ion pairs on the octahedral basal plane is not important in the kaolinite system. As was discussed in section 5.1.7, the ion pair formation on gibbsite is a slow process requiring several hours to reach equilibrium. The fact that the protonation of kaolinite at low pH occurs rather fast (c.f. Fig. 3 in Paper II) implies that similar ion pair formation is not important. Consequently, it was concluded that no model based on the models for the subsystems silica and gibbsite can describe the experimental data and that the approach of combining subsystem models has failed.
Figure 13. Fit of different models to experimental data in the kaolinite system. Broken lines: Different models based on subsystems. For details, see Paper II. Solid line: Proposed model (Table 3) 5.3.5. Modeling – nonelectrostatic model Having shown that the kaolinite data cannot be explained by models based on the gibbsite and silica models, an alternative approach based purely on experimental information was utilized. From the experimental data (Fig. 12), it can be seen that an s-shaped curve is obtained in the low pH range. This suggests that one surface site is fully protonated/deprotonated in this pH range (3.5 – 6.5) and that the
-2
-1.5
-1
-0.5
0
0.5
1
1.5
3.5 4.5 5.5 6.5 7.5 8.5 9.5
pH
ΗΗ ΗΗ+ ad
s (µ(µ (µ(µ
mol
/m2 ) 1
1
2
2
3
3
4
4
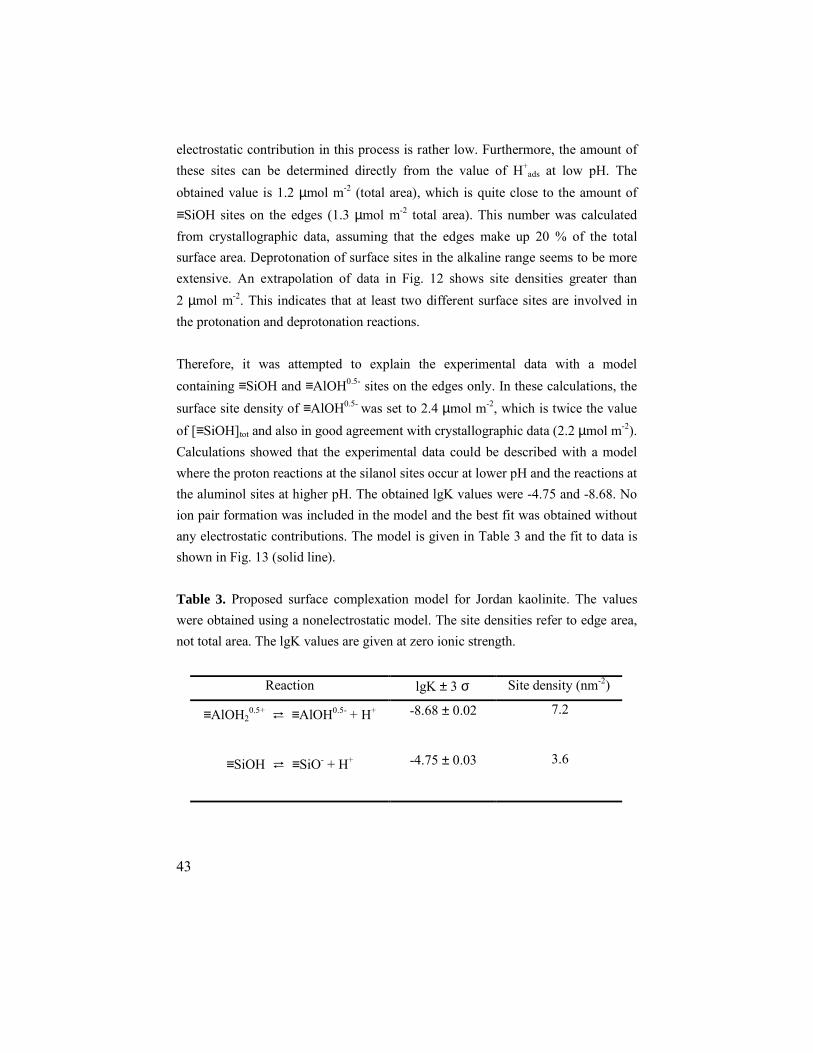
43
electrostatic contribution in this process is rather low. Furthermore, the amount of these sites can be determined directly from the value of H+
ads at low pH. The obtained value is 1.2 µmol m-2 (total area), which is quite close to the amount of ≡SiOH sites on the edges (1.3 µmol m-2 total area). This number was calculated from crystallographic data, assuming that the edges make up 20 % of the total surface area. Deprotonation of surface sites in the alkaline range seems to be more extensive. An extrapolation of data in Fig. 12 shows site densities greater than 2 µmol m-2. This indicates that at least two different surface sites are involved in the protonation and deprotonation reactions. Therefore, it was attempted to explain the experimental data with a model containing ≡SiOH and ≡AlOH0.5- sites on the edges only. In these calculations, the surface site density of ≡AlOH0.5- was set to 2.4 µmol m-2, which is twice the value of [≡SiOH]tot and also in good agreement with crystallographic data (2.2 µmol m-2). Calculations showed that the experimental data could be described with a model where the proton reactions at the silanol sites occur at lower pH and the reactions at the aluminol sites at higher pH. The obtained lgK values were -4.75 and -8.68. No ion pair formation was included in the model and the best fit was obtained without any electrostatic contributions. The model is given in Table 3 and the fit to data is shown in Fig. 13 (solid line). Table 3. Proposed surface complexation model for Jordan kaolinite. The values were obtained using a nonelectrostatic model. The site densities refer to edge area, not total area. The lgK values are given at zero ionic strength.
Reaction lgK ± 3 σ Site density (nm-2)
≡AlOH20.5+ ⇄ ≡AlOH0.5- + H+ -8.68 ± 0.02 7.2
≡SiOH ⇄ ≡SiO- + H+ -4.75 ± 0.03 3.6
44
It can be noted that the protonation constant of the silanol site (lgK = -4.75) is quite close to the value obtained for the acidic site (≡XOH) in the silica system (lgK = -4.41). The reason for the low pKa of these silanol sites is not known, but it seems reasonable to think that the degree of hydrogen bonding is different on kaolinite and silica surfaces. Since the tetrahedral sheets of kaolinite are separated by octahedral alumina sheets, all kaolinitic silanol groups have a lower number of neighboring silanols than silanols on a pure silica surface. This most likely affects the network of hydrogen bonds formed on the surface. Another interesting feature of the proposed model is that at pHpznpc both surface groups are charged; the dominating species are ≡SiO- and ≡AlOH2
0.5+, c.f. Fig. 7 in Paper II. Since the density of ≡AlOH0.5- sites is double that of ≡SiOH sites, the net proton concentration at pHpznpc is zero. The reason for the lack of electrostatic contribution is not known. However, it is well known that the electrostatic contribution is weak on many types of kaolinite. For example, Huertas et al.57 in their work on KGa-1 kaolinite compared a nonelectrostatic model and a constant capacitance model and found that both models explained their titration data equally well. Schroth and Sposito58 and Neubauer et al.59 studied adsorption onto KGa-2 kaolinite and explained their results with nonelectrostatic models. Independent support for the lack of surface charge on the kaolinite was also obtained from XPS data. In a frozen sample, the solid/water interface is believed to be partly preserved, but when the sample is allowed to warm the water evaporates and only the solid material remains. From the gibbsite spectra (not shown), it was observed that the Al 2p and the O 1s lines are shifted to slightly lower values when the sample is allowed to warm. This effect might be due to interactions between the escaping photoelectrons and the electrostatic double layer in the frozen samples. Similar effects have also been observed for silica and goethite (Andrei Shchukarev, pers. comm). However, for kaolinite no shift in the positions of the Al 2p, O 1s or Si 2p lines were observed. Consequently, this could be an indication that there is no electrostatic double layer at the kaolinite surface, or that the effect of the double layer is very weak.
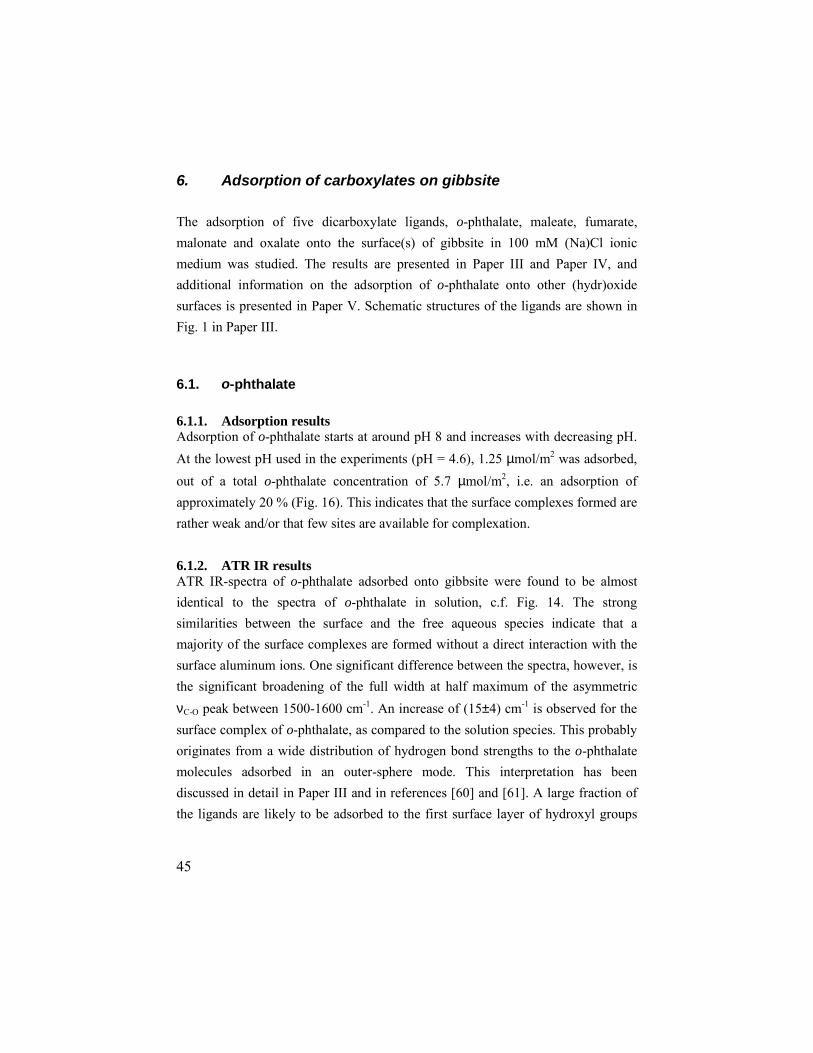
45
6. Adsorption of carboxylates on gibbsite The adsorption of five dicarboxylate ligands, o-phthalate, maleate, fumarate, malonate and oxalate onto the surface(s) of gibbsite in 100 mM (Na)Cl ionic medium was studied. The results are presented in Paper III and Paper IV, and additional information on the adsorption of o-phthalate onto other (hydr)oxide surfaces is presented in Paper V. Schematic structures of the ligands are shown in Fig. 1 in Paper III.
6.1. o-phthalate 6.1.1. Adsorption results Adsorption of o-phthalate starts at around pH 8 and increases with decreasing pH. At the lowest pH used in the experiments (pH = 4.6), 1.25 µmol/m2 was adsorbed, out of a total o-phthalate concentration of 5.7 µmol/m2, i.e. an adsorption of approximately 20 % (Fig. 16). This indicates that the surface complexes formed are rather weak and/or that few sites are available for complexation. 6.1.2. ATR IR results ATR IR-spectra of o-phthalate adsorbed onto gibbsite were found to be almost identical to the spectra of o-phthalate in solution, c.f. Fig. 14. The strong similarities between the surface and the free aqueous species indicate that a majority of the surface complexes are formed without a direct interaction with the surface aluminum ions. One significant difference between the spectra, however, is the significant broadening of the full width at half maximum of the asymmetric νC-O peak between 1500-1600 cm-1. An increase of (15±4) cm-1 is observed for the surface complex of o-phthalate, as compared to the solution species. This probably originates from a wide distribution of hydrogen bond strengths to the o-phthalate molecules adsorbed in an outer-sphere mode. This interpretation has been discussed in detail in Paper III and in references [60] and [61]. A large fraction of the ligands are likely to be adsorbed to the first surface layer of hydroxyl groups
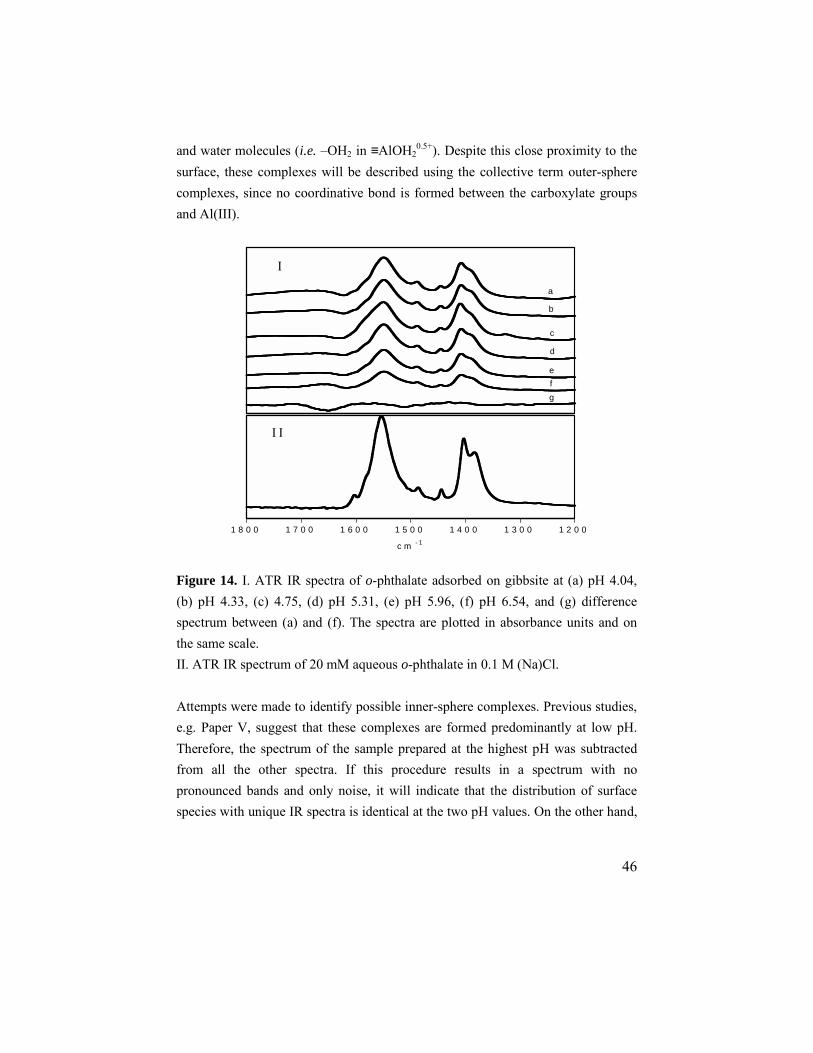
46
and water molecules (i.e. –OH2 in ≡AlOH20.5+). Despite this close proximity to the
surface, these complexes will be described using the collective term outer-sphere complexes, since no coordinative bond is formed between the carboxylate groups and Al(III).
Figure 14. I. ATR IR spectra of o-phthalate adsorbed on gibbsite at (a) pH 4.04, (b) pH 4.33, (c) 4.75, (d) pH 5.31, (e) pH 5.96, (f) pH 6.54, and (g) difference spectrum between (a) and (f). The spectra are plotted in absorbance units and on the same scale. II. ATR IR spectrum of 20 mM aqueous o-phthalate in 0.1 M (Na)Cl. Attempts were made to identify possible inner-sphere complexes. Previous studies, e.g. Paper V, suggest that these complexes are formed predominantly at low pH. Therefore, the spectrum of the sample prepared at the highest pH was subtracted from all the other spectra. If this procedure results in a spectrum with no pronounced bands and only noise, it will indicate that the distribution of surface species with unique IR spectra is identical at the two pH values. On the other hand,
1 8 0 0 1 7 0 0 1 6 0 0 1 5 0 0 1 4 0 0 1 3 0 0 1 2 0 0
c m - 1
I
a
b
c
d
efg
I I
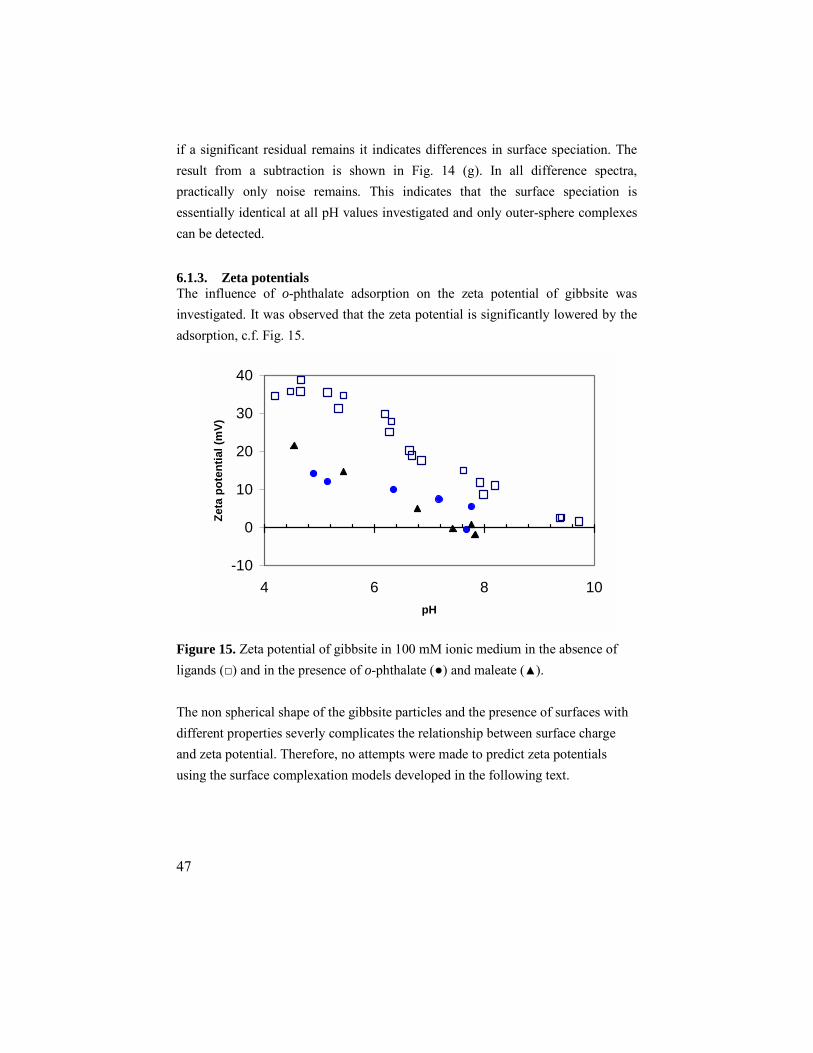
47
if a significant residual remains it indicates differences in surface speciation. The result from a subtraction is shown in Fig. 14 (g). In all difference spectra, practically only noise remains. This indicates that the surface speciation is essentially identical at all pH values investigated and only outer-sphere complexes can be detected. 6.1.3. Zeta potentials The influence of o-phthalate adsorption on the zeta potential of gibbsite was investigated. It was observed that the zeta potential is significantly lowered by the adsorption, c.f. Fig. 15.
-10
0
10
20
30
40
4 6 8 10pH
Zeta
pot
entia
l (m
V)
Figure 15. Zeta potential of gibbsite in 100 mM ionic medium in the absence of ligands (□) and in the presence of o-phthalate (●) and maleate (▲). The non spherical shape of the gibbsite particles and the presence of surfaces with different properties severly complicates the relationship between surface charge and zeta potential. Therefore, no attempts were made to predict zeta potentials using the surface complexation models developed in the following text.
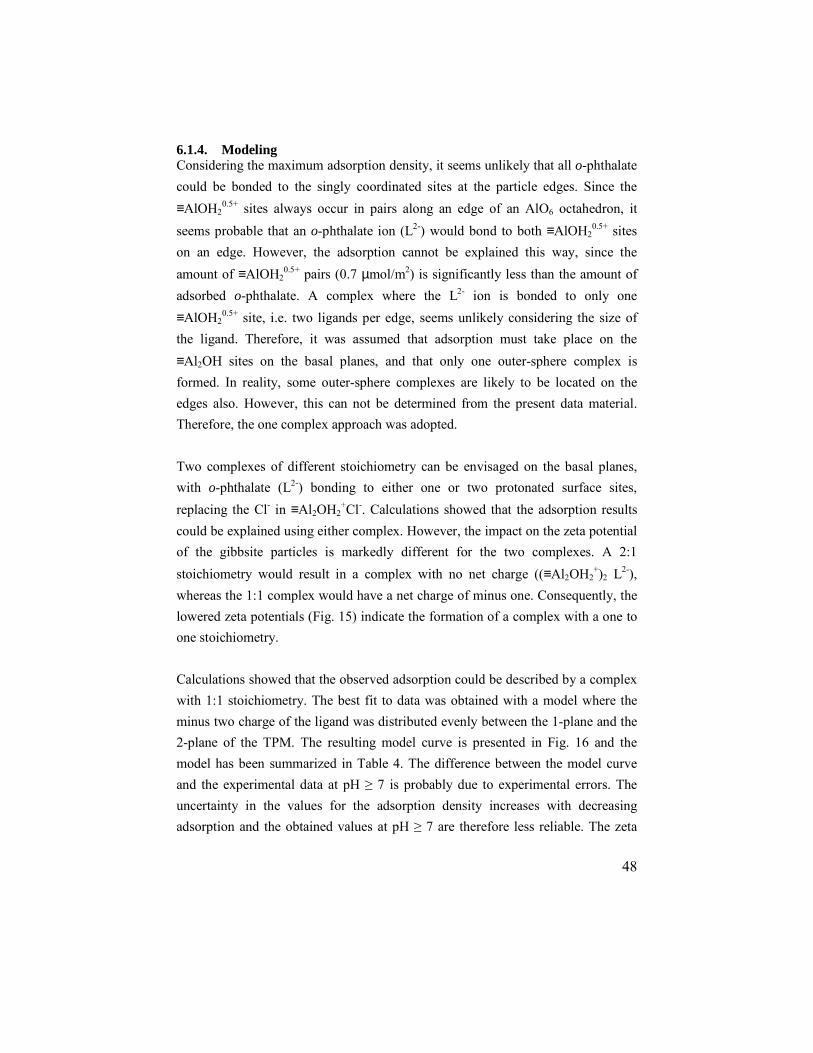
48
6.1.4. Modeling Considering the maximum adsorption density, it seems unlikely that all o-phthalate could be bonded to the singly coordinated sites at the particle edges. Since the ≡AlOH2
0.5+ sites always occur in pairs along an edge of an AlO6 octahedron, it seems probable that an o-phthalate ion (L2-) would bond to both ≡AlOH2
0.5+ sites on an edge. However, the adsorption cannot be explained this way, since the amount of ≡AlOH2
0.5+ pairs (0.7 µmol/m2) is significantly less than the amount of adsorbed o-phthalate. A complex where the L2- ion is bonded to only one ≡AlOH2
0.5+ site, i.e. two ligands per edge, seems unlikely considering the size of the ligand. Therefore, it was assumed that adsorption must take place on the ≡Al2OH sites on the basal planes, and that only one outer-sphere complex is formed. In reality, some outer-sphere complexes are likely to be located on the edges also. However, this can not be determined from the present data material. Therefore, the one complex approach was adopted. Two complexes of different stoichiometry can be envisaged on the basal planes, with o-phthalate (L2-) bonding to either one or two protonated surface sites, replacing the Cl- in ≡Al2OH2
+Cl-. Calculations showed that the adsorption results could be explained using either complex. However, the impact on the zeta potential of the gibbsite particles is markedly different for the two complexes. A 2:1 stoichiometry would result in a complex with no net charge ((≡Al2OH2
+)2 L2-), whereas the 1:1 complex would have a net charge of minus one. Consequently, the lowered zeta potentials (Fig. 15) indicate the formation of a complex with a one to one stoichiometry. Calculations showed that the observed adsorption could be described by a complex with 1:1 stoichiometry. The best fit to data was obtained with a model where the minus two charge of the ligand was distributed evenly between the 1-plane and the 2-plane of the TPM. The resulting model curve is presented in Fig. 16 and the model has been summarized in Table 4. The difference between the model curve and the experimental data at pH ≥ 7 is probably due to experimental errors. The uncertainty in the values for the adsorption density increases with decreasing adsorption and the obtained values at pH ≥ 7 are therefore less reliable. The zeta
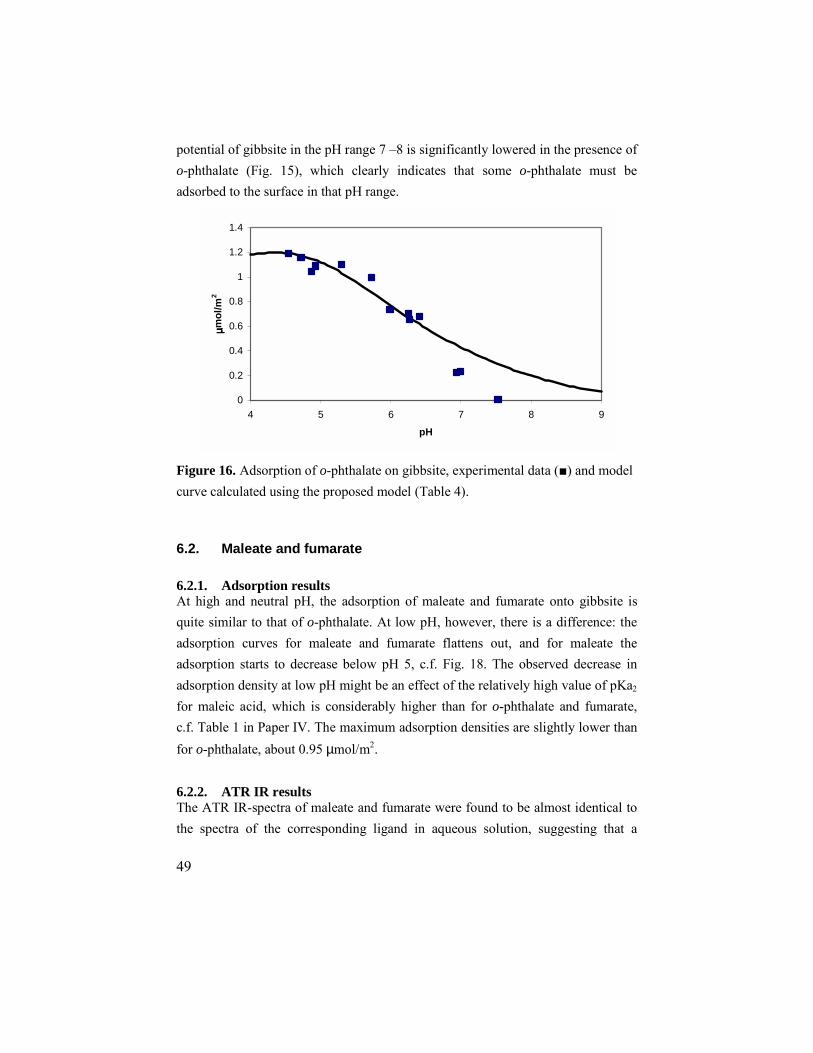
49
potential of gibbsite in the pH range 7 –8 is significantly lowered in the presence of o-phthalate (Fig. 15), which clearly indicates that some o-phthalate must be adsorbed to the surface in that pH range.
0
0.2
0.4
0.6
0.8
1
1.2
1.4
4 5 6 7 8 9
pH
µµ µµmol
/m2
Figure 16. Adsorption of o-phthalate on gibbsite, experimental data (■) and model curve calculated using the proposed model (Table 4).
6.2. Maleate and fumarate 6.2.1. Adsorption results At high and neutral pH, the adsorption of maleate and fumarate onto gibbsite is quite similar to that of o-phthalate. At low pH, however, there is a difference: the adsorption curves for maleate and fumarate flattens out, and for maleate the adsorption starts to decrease below pH 5, c.f. Fig. 18. The observed decrease in adsorption density at low pH might be an effect of the relatively high value of pKa2 for maleic acid, which is considerably higher than for o-phthalate and fumarate, c.f. Table 1 in Paper IV. The maximum adsorption densities are slightly lower than for o-phthalate, about 0.95 µmol/m2. 6.2.2. ATR IR results The ATR IR-spectra of maleate and fumarate were found to be almost identical to the spectra of the corresponding ligand in aqueous solution, suggesting that a
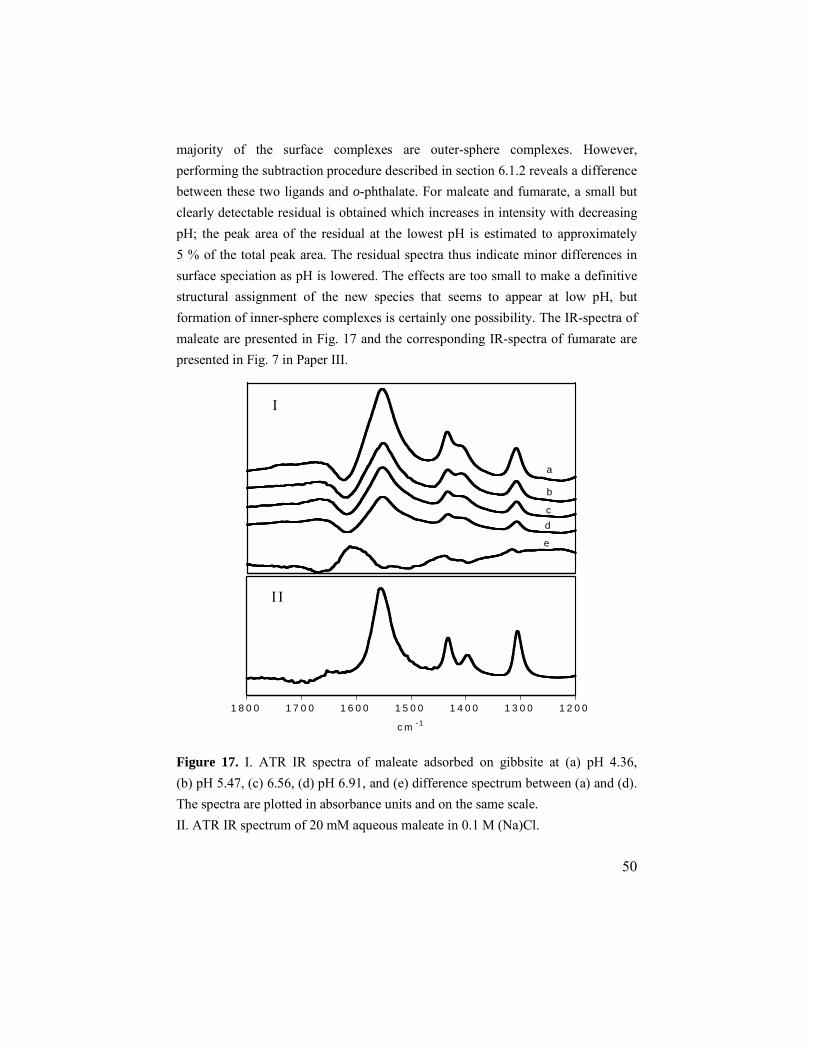
50
majority of the surface complexes are outer-sphere complexes. However, performing the subtraction procedure described in section 6.1.2 reveals a difference between these two ligands and o-phthalate. For maleate and fumarate, a small but clearly detectable residual is obtained which increases in intensity with decreasing pH; the peak area of the residual at the lowest pH is estimated to approximately 5 % of the total peak area. The residual spectra thus indicate minor differences in surface speciation as pH is lowered. The effects are too small to make a definitive structural assignment of the new species that seems to appear at low pH, but formation of inner-sphere complexes is certainly one possibility. The IR-spectra of maleate are presented in Fig. 17 and the corresponding IR-spectra of fumarate are presented in Fig. 7 in Paper III.
Figure 17. I. ATR IR spectra of maleate adsorbed on gibbsite at (a) pH 4.36, (b) pH 5.47, (c) 6.56, (d) pH 6.91, and (e) difference spectrum between (a) and (d). The spectra are plotted in absorbance units and on the same scale. II. ATR IR spectrum of 20 mM aqueous maleate in 0.1 M (Na)Cl.
1 8 0 0 1 7 0 0 1 6 0 0 1 5 0 0 1 4 0 0 1 3 0 0 1 2 0 0
c m - 1
I
a
b
cd
e
I I
51
6.2.3. Modeling Calculations showed that the adsorption of fumarate could be described with a complex having the same stoichiometry as the one found in the o-phthalate system, i.e. a 1:1 outer-sphere complex on the basal planes, with the same charge distribution. The values of the formation constants of the complexes are also quite close. No formation constant could be determined for the possible inner-sphere complex, most probably due to the low concentration of this species. The fit to data is presented in Fig. 18 and the model has been summarized in Table 4. The shape of the adsorption curve for maleate (Fig. 18) is slightly different from the curves for the two previous ligands, suggesting that the speciation might be different. Modeling indicated that a sufficiently good fit to data could not be obtained with a model containing only the outer-sphere complex. Therefore, an inner-sphere complex was included in the modeling. The coordination and relative position of the carboxylate groups in maleate allow the formation of surface complexes with mononuclear chelate structure. In this chelate, the carboxylate groups have reacted with two singly coordinated hydroxyls along an edge of an octahedron, thus forming a seven membered ring structure. Since the edge planes of gibbsite contain pairs of singly coordinated hydroxyls, these are assumed to be the sites for inner-sphere maleate complexes. Despite the presumably low concentration of this complex, it was possible to determine a formation constant. A relatively good fit to data was obtained with this combination of complexes. The fit to data is presented in Fig. 18 and the model has been summarized in Table 4.
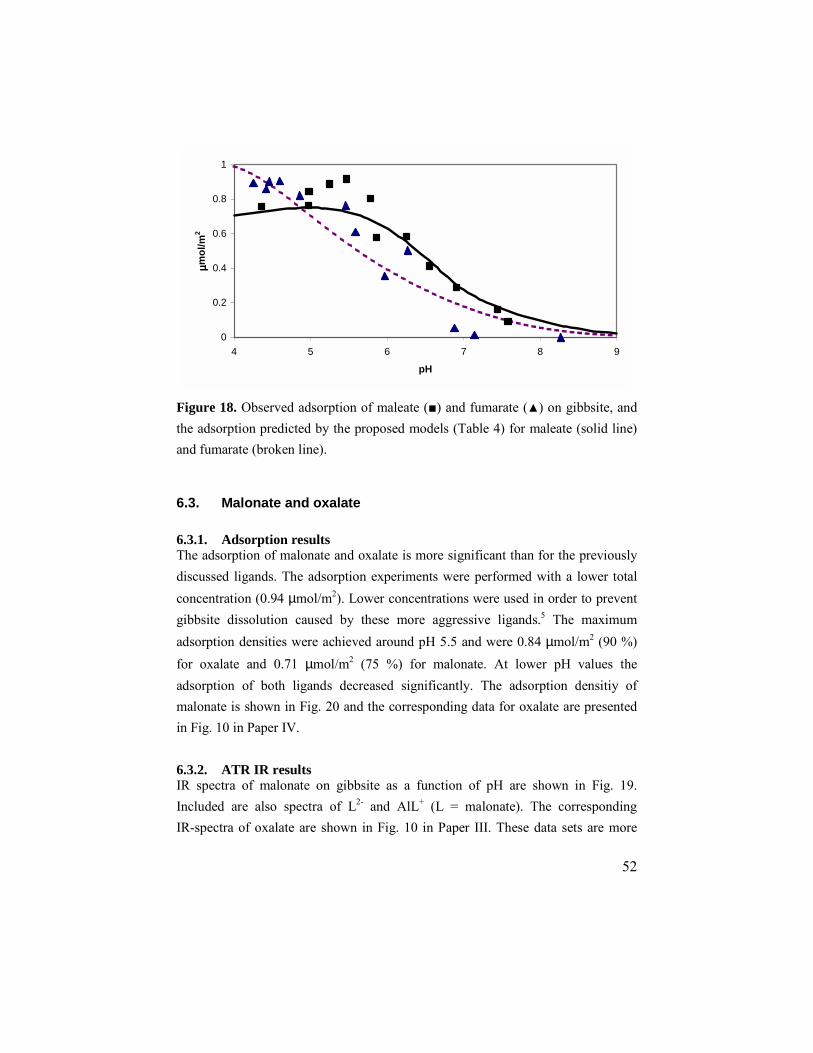
52
0
0.2
0.4
0.6
0.8
1
4 5 6 7 8 9
pH
µµ µµmol
/m2
Figure 18. Observed adsorption of maleate (■) and fumarate (▲) on gibbsite, and the adsorption predicted by the proposed models (Table 4) for maleate (solid line) and fumarate (broken line).
6.3. Malonate and oxalate 6.3.1. Adsorption results The adsorption of malonate and oxalate is more significant than for the previously discussed ligands. The adsorption experiments were performed with a lower total concentration (0.94 µmol/m2). Lower concentrations were used in order to prevent gibbsite dissolution caused by these more aggressive ligands.5 The maximum adsorption densities were achieved around pH 5.5 and were 0.84 µmol/m2 (90 %) for oxalate and 0.71 µmol/m2 (75 %) for malonate. At lower pH values the adsorption of both ligands decreased significantly. The adsorption densitiy of malonate is shown in Fig. 20 and the corresponding data for oxalate are presented in Fig. 10 in Paper IV. 6.3.2. ATR IR results IR spectra of malonate on gibbsite as a function of pH are shown in Fig. 19. Included are also spectra of L2- and AlL+ (L = malonate). The corresponding IR-spectra of oxalate are shown in Fig. 10 in Paper III. These data sets are more
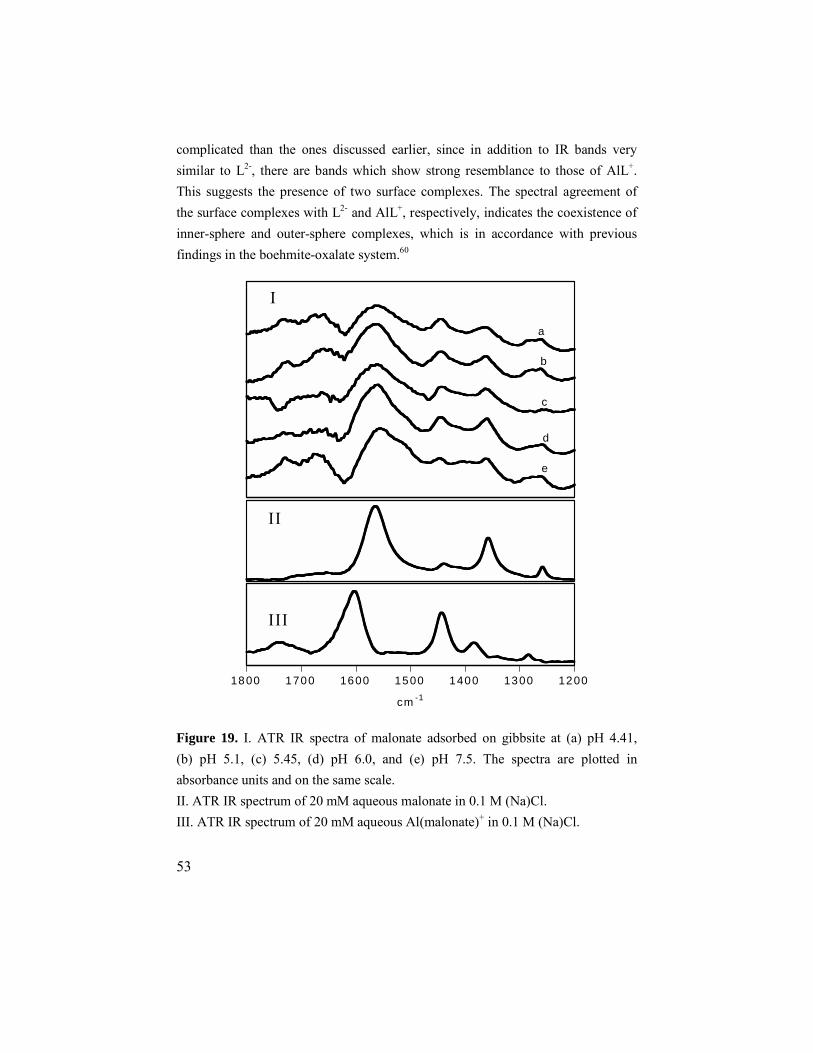
53
complicated than the ones discussed earlier, since in addition to IR bands very similar to L2-, there are bands which show strong resemblance to those of AlL+. This suggests the presence of two surface complexes. The spectral agreement of the surface complexes with L2- and AlL+, respectively, indicates the coexistence of inner-sphere and outer-sphere complexes, which is in accordance with previous findings in the boehmite-oxalate system.60
Figure 19. I. ATR IR spectra of malonate adsorbed on gibbsite at (a) pH 4.41, (b) pH 5.1, (c) 5.45, (d) pH 6.0, and (e) pH 7.5. The spectra are plotted in absorbance units and on the same scale. II. ATR IR spectrum of 20 mM aqueous malonate in 0.1 M (Na)Cl. III. ATR IR spectrum of 20 mM aqueous Al(malonate)+ in 0.1 M (Na)Cl.
1800 1700 1600 1500 1400 1300 1200
cm -1
I
II
III
a
b
c
d
e
54
The outer-sphere complexes of malonate and oxalate are believed to be similar to those found in the o-phthalate, maleate and fumarate systems, i.e. adsorbed to the first surface layer of hydroxyl groups and water molecules. The structures of the inner-sphere complexes of malonate and oxalate are most likely mononuclear chelates involving both carboxylate groups of each ligand. This conclusion is based on the good agreement with the IR spectra of the corresponding AlL+ complexes, which have been shown to have structures where the ligands have this chelating coordination geometry.62 Further support is provided by the good correlation between the experimental data and calculated theoretical frequencies for the [Al(O)(OH)L]2- molecules (Paper III). A previous study on oxalate has shown that most other coordination geometries yield significantly different frequencies.60 The amplitudes of the IR peaks representing the outer-sphere and inner-sphere complexes, respectively, could be used to estimate the relative contribution of the two complexes. Further details about the estimation can be found in Paper III. 6.3.3. Modeling The estimated amounts of inner-sphere and outer-sphere complexes for malonate are presented in Fig. 20, and the corresponding results for oxalate are presented in Fig. 10 in Paper IV. The shapes of both the total adsorption curve and the curve for the outer-sphere complex for malonate are different from the curves obtained for the previous ligands, suggesting that the outer-sphere complex might differ from those found for the other ligands. Calculations confirmed that the curvature of the adsorption data for the outer-sphere complex can not be reproduced using the same stoichiometry and charge distribution as for the previous ligands. However, a good fit to data was obtained by changing the charge distribution to a situation where the minus two charge of the malonate is placed in the 2-plane. The predicted model line is presented in Fig. 20. The shape of the curve for the oxalate outer-sphere complex is almost the same as for the malonate system, which suggests similarities in the speciation. Calculations confirmed that the formation of outer-sphere oxalate complexes could be explained using the same stoichiometry and charge distribution as in the malonate system,
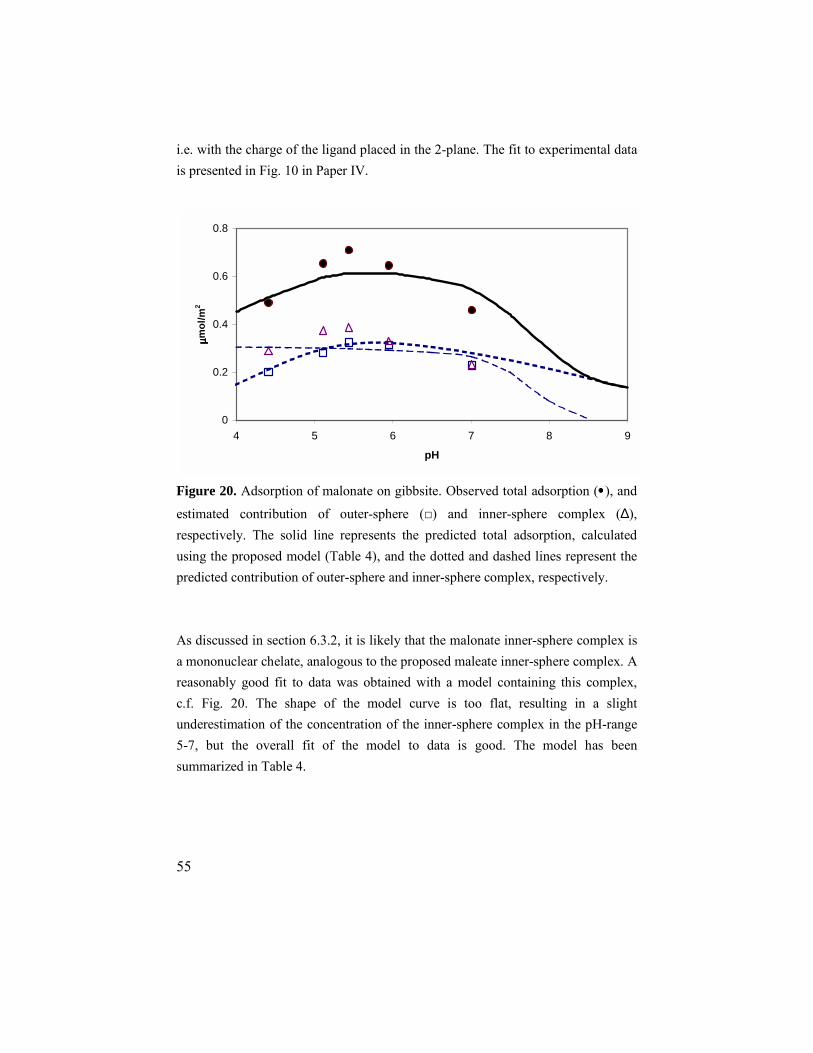
55
i.e. with the charge of the ligand placed in the 2-plane. The fit to experimental data is presented in Fig. 10 in Paper IV.
0
0.2
0.4
0.6
0.8
4 5 6 7 8 9
pH
µµ µµmol
/m2
Figure 20. Adsorption of malonate on gibbsite. Observed total adsorption (•••• ), and
estimated contribution of outer-sphere (□) and inner-sphere complex (∆), respectively. The solid line represents the predicted total adsorption, calculated using the proposed model (Table 4), and the dotted and dashed lines represent the predicted contribution of outer-sphere and inner-sphere complex, respectively. As discussed in section 6.3.2, it is likely that the malonate inner-sphere complex is a mononuclear chelate, analogous to the proposed maleate inner-sphere complex. A reasonably good fit to data was obtained with a model containing this complex, c.f. Fig. 20. The shape of the model curve is too flat, resulting in a slight underestimation of the concentration of the inner-sphere complex in the pH-range 5-7, but the overall fit of the model to data is good. The model has been summarized in Table 4.
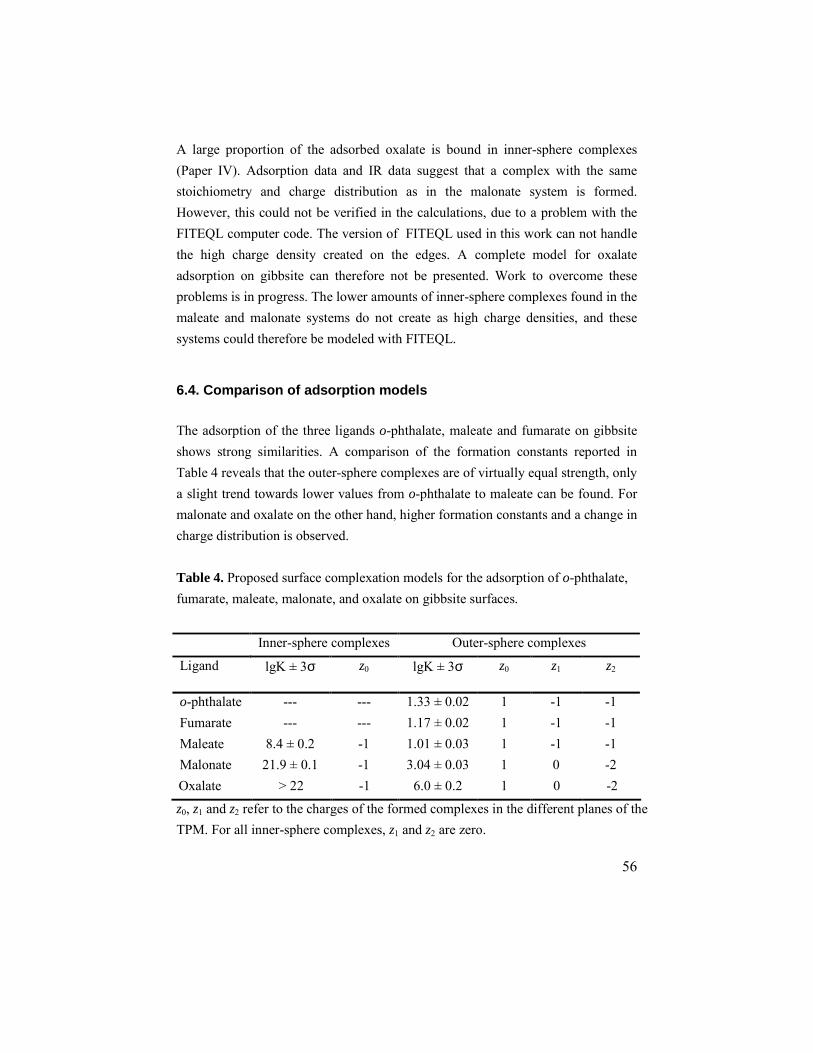
56
A large proportion of the adsorbed oxalate is bound in inner-sphere complexes (Paper IV). Adsorption data and IR data suggest that a complex with the same stoichiometry and charge distribution as in the malonate system is formed. However, this could not be verified in the calculations, due to a problem with the FITEQL computer code. The version of FITEQL used in this work can not handle the high charge density created on the edges. A complete model for oxalate adsorption on gibbsite can therefore not be presented. Work to overcome these problems is in progress. The lower amounts of inner-sphere complexes found in the maleate and malonate systems do not create as high charge densities, and these systems could therefore be modeled with FITEQL.
6.4. Comparison of adsorption models The adsorption of the three ligands o-phthalate, maleate and fumarate on gibbsite shows strong similarities. A comparison of the formation constants reported in Table 4 reveals that the outer-sphere complexes are of virtually equal strength, only a slight trend towards lower values from o-phthalate to maleate can be found. For malonate and oxalate on the other hand, higher formation constants and a change in charge distribution is observed. Table 4. Proposed surface complexation models for the adsorption of o-phthalate, fumarate, maleate, malonate, and oxalate on gibbsite surfaces.
Inner-sphere complexes Outer-sphere complexes
Ligand lgK ± 3σ z0 lgK ± 3σ z0 z1 z2
o-phthalate --- --- 1.33 ± 0.02 1 -1 -1 Fumarate --- --- 1.17 ± 0.02 1 -1 -1 Maleate 8.4 ± 0.2 -1 1.01 ± 0.03 1 -1 -1 Malonate 21.9 ± 0.1 -1 3.04 ± 0.03 1 0 -2 Oxalate > 22 -1 6.0 ± 0.2 1 0 -2
z0, z1 and z2 refer to the charges of the formed complexes in the different planes of the TPM. For all inner-sphere complexes, z1 and z2 are zero.
57
Formation of outer-sphere complexes on the basal planes occurs according to reaction 12:
≡Al2OH + L2- + H+ ⇄⇄⇄⇄ ≡Al2OH2+ L2- [12]
Formation of inner-sphere complexes on the edges occurs according to reaction 13:
≡Al(OH0.5-)2 + L2- + 2 H+ ⇄⇄⇄⇄ ≡AlL- + 2 H2O [13] The notation ≡Al(OH0.5-)2 indicates that the two singly coordinated OH groups are connected to a common Al atom. The reason for the difference in charge distribution for the outer-sphere complexes of o-phthalate, maleate and fumarate on one hand and malonate and oxalate on the other hand is not clear. It is possible that it is an effect of choosing not to include any outer-sphere complexes on the edge sites in the model. If such complexes in fact exist, it is likely that the formation would be significantly reduced by the lowering of the charge on the edges caused by formation of inner-sphere complexes. This change in speciation might be misinterpreted as a change in charge distribution. For the inner-sphere complexes, the obtained lgK values show a clear trend. The relatively low value found for maleate indicates that the formed complex is less stable than the malonate complex. As discussed in the previous section, no lgK value could be determined for the oxalate complex, but the experimental data indicate that the inner-sphere complex of oxalate is more stable than that of malonate. From the information that could be salvaged from the failed FITEQL calculations, it was also concluded that the formation constant for the oxalate complex must be significantly higher than for the corresponding malonate complex. As expected, a trend towards higher formation constants and more stable chelate complexes for smaller ligands is observed. This trend can be explained by the fact that maleate forms a seven membered ring structure, malonate a six membered ring structure and oxalate a five membered ring structure. In general, an
58
increase in stability with decreasing ring size is observed, with a maximum for five membered rings.63 It is interesting to compare the adsorption of o-phthalate onto the different alumina surfaces, boehmite (Paper V), aged γ-Al2O3 (Paper V) and gibbsite (Paper IV). In the boehmite and aged γ-Al2O3 systems, an outer-sphere complex was found to dominate at near-neutral pH and an inner-sphere chelate at low pH. For gibbsite on the other hand, the outer-sphere complex was found to exist also at low pH and no signs of an inner-sphere complex were detected. This difference is partly explained by the fact that the boehmite and aged γ-Al2O3 samples consisted of particles with low crystallinity and irregular surfaces, offering a high density of possible sites for both inner-sphere and outer-sphere complexation, whereas the rather extreme aspect ratio of the highly crystalline gibbsite results in a low number of (edge) sites for inner-sphere complexation and a high number of (basal plane) sites for outer-sphere complexation. The ratio between basal plane sites and edge sites for the gibbsite used in the present work is approximately 15:1. Another considerable difference is that at boehmite and aged γ-Al2O3 the inner-sphere and outer-sphere complexes compete for the same surface site, whereas in the gibbsite case no such competition occurs (according to the proposed surface complexation model). These differences explain the reasons for the observed domination of the outer-sphere o-phthalate complex on gibbsite. The reasons for the absence of detectable amounts of an inner-sphere complex on gibbsite are more difficult to pinpoint. Obviously the 15:1 ratio between basal plane sites and edge sites significantly shifts the balance between outer- and inner-sphere complexes, but some inner-sphere complexes are still expected to form. However, the experimental data indicates that this amount is below the detection limit of the FTIR technique.
59
7. Summary and ideas for future work This thesis presents and discusses the results from five papers concerning the surface chemistry of gibbsite, aged γ-Al2O3, amorphous silica and kaolinite, with emphasis on nano-sized gibbsite (α-Al(OH)3). The first two papers deal with questions regarding proton adsorption/desorption and surface charging phenomena, whereas the three latter papers deal with adsorption of low molecular weight carboxylates. For gibbsite it was discovered that there is a considerable discrepancy between the proton adsorption and the charging of the surface(s). This was explained with the formation of ion pairs (≡Al2OH2
+Cl- and ≡Al2O-Na+) at the basal planes, thus increasing the adsorption/desorption density of protons without affecting the charge of the particle. Furthermore, it was proposed that the formation of these ion pairs is a slow process, requiring several hours to reach equilibrium. This hypothesis was supported by the finding that the charge of the particle develops in a few minutes, whereas the proton adsorption continues for hours. The adsorption of dicarboxylates onto gibbsite surface(s) provided further support for the reactivity of the basal planes. The adsorption of all five ligands was explained with models where outer-sphere complexes on the basal planes are responsible for a considerable part of the total adsorption. For oxalate, malonate and maleate, inner-sphere complexes were also found. The proton reactions at the surface of amorphous silica were explained using a two site model. These two sites are believed to be silanol sites experiencing different degrees of hydrogen bonding. For kaolinite it was found that the results could be
60
explained by assuming reactions on the aluminol and silanol sites on the edges only. Furthermore, the results were explained without any contribution from the electrostatic double layer, indicating that there is no buildup of charge on the kaolinite surface. Attempts to explain the results by direct combination of the models for silica and gibbsite were not successful. The obtained proof of the reactivity of the gibbsite basal planes has to be considered as the most important finding in this work. As the basal planes contain only doubly coordinated OH groups, these planes have often been considered unreactive. Since the basal planes form the major part of the surface area of gibbsite, it is important to consider their reactivity as well. The results and conclusions in this thesis, especially for gibbsite, could not have been obtained without the multitude of experimental techniques employed. Atomic force microscopy proved invaluable in the characterization of the gibbsite, the combination of potentiometry and electrophoresis was necessary for solving the protonation and charging, and the ligand adsorption could be described thanks to the combined information from FTIR spectroscopy, theoretical calculations, adsorption measurements and electrophoresis. XPS also provided valuable information in various contexts. The combination of macroscopic level and molecular level information is necessary to obtain Surface Complexation Models that will correctly predict the adsorption under a wide range of conditions. It would be interesting to be able to compare the gibbsite results with corresponding results for bayerite (β-Al(OH)3). Bayerite has the same basic structure as gibbsite, but the layers are stacked differently. This results in particles which are much more extended in the c direction, with a rodlike shape. The distribution of surface area between edges and basal planes for bayerite is therefore almost the opposite of that found for gibbsite.
61
The XPS investigations performed in the present work have indicated that XPS has the potential of becoming a very powerful tool for studies of the solid/water interface. The possibility of detecting surface charge is very interesting and could provide new insight into the true nature of the solid/water interface. XPS has also showed promising results in the quantification of medium ions in the vicinity of the solid surface. As reliable and accurate methods for determining the extent and the mode of medium ion interaction are scarce, any advance in this field is welcome. However, before XPS can be put to full use, we still need to learn more about sample handling and data treatment. New techniques with imaging capabilities, such as XPS and FTIR microscopy, offer intriguing possibilities in studies of the surface chemistry of minerals. Many minerals have morphologies with surfaces which are structurally clearly different, and the present work has shown that the adsorption properties of these surfaces can be markedly different. Therefore, there is a need for techniques that can provide information on the spatial distribution of species. However, the spatial resolution still limits the use of these techniques in studies of nano-sized materials.
62
8. Acknowledgements I wish to express my gratitude to my supervisors Professor Staffan Sjöberg and Dr. Per Persson. Without Staffan’s careful examination of details and continuous demand for more experimental information, this thesis would not be what it is today. Staffan’s critical thinking and search for new angles proved invaluable in situations where I could not make any sense out of the experimental data. Per is acknowledged for introducing me to the field of spectroscopy and for encouraging me to think about processes at a molecular level also. Per’s dedication and positive attitude have been a true source of inspiration.
I am grateful to Dr. Lars Lövgren, who taught me a lot about treatment of potentiometry data and about modeling with FITEQL. Dr. Johannes Lützenkirchen is acknowledged for his continuous modifications of the FITEQL code. Johannes and Dr. Jean-François Boily are also acknowledged for their help with various aspects of modeling and for many discussions regarding surface chemistry in general. I wish to thank Agneta Nordin for teaching me how to perform titrations and for solving innumerable practical problems in the lab. I also wish to thank Professor Lars-Olof Öhman, who has patiently explained many details about complexation chemistry, and many other interesting fields. Dr. Torbjörn Tjärnhage (FOI) is acknowledged for performing the AFM work, and for helping with the image for the front page of this thesis. The linguistic revision by Julia Sheals is also gratefully acknowledged.
A special thanks goes to my room-mate through the years, Fabian Taube. We have shared a lot of experiences, helped each other solve problems and spent innumerable hours discussing and debating various issues of chemistry and life in general. I also want to thank Professor Lage Pettersson, Dr. Lars Rönngren and all the others who have made my stay in Umeå a pleasant one. Jag vill tacka mina föräldrar och Benny, Janeta och Johanna för ert stöd genom åren. Ni har också gjort Risholm till ett perfekt ställe att koppla av och “ladda batterierna” på. Jag vill också tacka Ulrik och Camilla, Jerker och Tiina samt alla mina andra vänner.
63
9. References 1 Hochella Jr, M. F., White, A. F. (1990) Mineral-water interface geochemistry: An overview. In: Mineral-water interface geochemistry (Eds. M. F. Hochella Jr. and A. F. White). Reviews in mineralogy, Vol. 23, Washington, DC, USA, pp. 1-16. 2 Jardine, P. M., Jacobs, G. K., O’Dell, J. D. (1993) Unsaturated transport processes in undisturbed heterogeneous porous media: II. Cocontaminants. Soil Sci. Soc. Am. J. 57, 4, 954-962. 3 Tessier, A., Carignan, R., Bubrueuil, B., Rapin, F. (1989) Partitioning of zinc between the water column and the oxide sediments in lakes. Geochim. Cosmochim. Acta 53, 7, 1511-1522. 4 Stumm, W., Morgan, J. J. (1996) Aquatic Chemistry. Wiley, New York, USA. 5 Furrer, G., Stumm, W. (1986) The coordination chemistry of weathering: I. Dissolution kinetics of alumina and beryllium oxide. Geochim. Cosmochim. Acta 50, 9, 1847-1860. 6 Stumm, W., Furrer, G. (1987) The dissolution of oxides and aluminum silicates; examples of surface-coordination-controlled kinetics. Aquat. Surf. Chem. 197-219. 7 Deer, W. A., Howie, R. A., Zussman, J. (1962) Rock-forming minerals, Vol. 5, Longman, London, U.K. 8 Dixon, J. B. (1977) Kaolinite and serpentine group minerals. In: Minerals in soil environments (Eds. J. B. Dixon and S. B. Weed), Soil Science Society of America, Madison, USA, pp. 357-403. 9 Davis, J. A., Kent, D. B. (1990) Surface complexation modeling in aqueous geochemistry. In: Mineral-water interface geochemistry (Eds. M. F. Hochella Jr. and A. F. White). Reviews in mineralogy, Vol. 23, Washington, DC, USA, pp. 177-260. 10 Stumm, W. (1992) Chemistry of the solid-water interface: Processes at the mineral-water and particle-water interface in natural systems. Wiley, New York, USA. 11 Sweegers, C., van Enckevort, W. J. P., Meekes, H., Bennema. P., Hiralal, I. D. K., Rijkeboer, A. (1999) The impact of twinning on the morphology of α-Al(OH)3 crystals. J. Crystal Growth 197, 244-253. 12 Sweegers, C., de Coninck, H. C., Meekes, H., van Enckevort, W. J. P., Hiralal, I. D. K., Rijkeboer, A. (2001) Morphology, evolution and other characteristics of gibbsite crystals grown from pure and impure aqueous sodium aluminate solutions. J. Crystal Growth 233, 567-582. 13 Sweegers, C., Boerrigter, S. X. M., Grimbergen, R. F. P., Meekes, H., Fleming, S., Hiralal, I. D. K., Rijkeboer, A. (2002) Morphology prediction of gibbsite crystals – An explanation for the lozenge-shaped growth morphology. J. Phys. Chem. 106, 1004-1012. 14 Saalfeld, H., Wedde, M. (1974) Refinement of the crystal structure of gibbsite, Al(OH)3. Z. Kristallogr. 139, 129-135. 15 Bergna, H. E. (1990) Colloid chemistry of silica: An overview. In: The colloid chemistry of silica. (Ed. H. E. Bergna), ACS, Washington, DC, USA, pp. 1-50. 16 Iler, R. K. (1979) The chemistry of silica. Wiley, New York, USA. 17 Chuang, I.-S., Maciel, G. E. (1996). Probing hydrogen bonding and the local environment of silanols on silica surfaces via nuclear spin cross polarization dynamics. J. Am. Chem. Soc. 118, 2, 401-406.
64
18 Chuang, I.-S., Kinney, D. R., Bronnimann, C. E., Zeigler, R. C., Maciel, G. E. (1992). Effects of 1H-1H spin exchange in the 29Si CP-MAS NMR spectra of the silica surface. J. Phys. Chem. 96, 10, 4027-4034. 19 Burneau, A., Humbert, B., Barrès, O., Gallas, J.P., Lavalley, J.C. (1994) Fourier transform infrared and Raman spectroscopic study of silica surfaces. In: The colloid chemistry of silica. (Ed. H. E. Bergna), ACS, Washington, DC, USA, pp. 199-222. 20 Morrow, B. A., McFarlan, A. J. (1994) Infrared study of chemical and H-D exchange probes for silica surfaces. In: The colloid chemistry of silica. (Ed. H. E. Bergna), ACS, Washington DC, USA, pp.183-198. 21 Zhuravlev, L.T. (1993) Surface characterization of amorphous silica – a review of work from the former USSR. Colloids Surf. A. 74, 71-90. 22 de Boer, J. H., Vleeskens, J. M. (1958) Chemisorption and physical adsorption of water on silica. IV. Nature of the surface. K. Ned. Akad. Wet. Proc. Ser. B 61, 2-11. 23 Bailey, S. W. (1980) Structures of layer silicates. In: Crystal structures of clay minerals and their X-ray identification. (Eds. G. W. Bridley and G. Brown) Monograph No. 5, Mineralogical Society, London, U.K., pp. 1-124. 24 Deer, W. A., Howie, R. A., Zussman, J. (1962) Rock-forming minerals, Vol. 4, Longman, London, U.K. 25 Sposito, G. (1984) The surface chemistry of soils, Oxford University Press, New York, USA. 26 Young, R. A., Hewat, A. W. (1988) Verification of the triclinic crystal structure of kaolinite. Clays and Clay Minerals 36, 225-232. 27 Dyer. C., Hendra, P. J., Forsling, W., Ranheimer, M. (1993) Surface hydration of aqueous γ-Al2O3 studied by Fourier transform Raman and infrared spectroscopy. Initial results. Spectrochim. Acta, Part A 49, 691-705. 28 Laiti, E., Öhman, L.-O., Nordin, J., Sjöberg, S. (1995) Acid/base properties and phenylphosphonic acid complexation at the aged γ-Al2O3/water interface. J. Coll. Int. Sci. 175, 1, 230-238. 29 Persson, P., Karlsson, M., Öhman, L.-O. (1999) Coordination of acetate to Al(III) in aqueous solution and at the water-aluminum hydroxide interface: A potentiometric and attenuated total reflectance FTIR study. Geochim. Cosmochim. Acta 62, 23-24, 3657-3668. 30 Dzombak, D. A., Morel, F. M. M. (1990) Surface complexation modeling; Hydrous ferric oxide. Wiley, New York, USA. 31 Sposito, G. (1994) Chemical Equilibria and kinetics in soils. Oxford University Press, New York, USA. 32 Parks, G. A., De Bruyn, P. L. (1962) The zero point of charge of oxides. J. Phys. Chem. 66, 967-973. 33 Parks, G. A. (1965) The isoelectric points of solid oxides, solid hydroxides, and aqueous hydroxo complex systems. Chem. Rev. 65, 177-198. 34 Schindler, P. W., Gamsjäger, H. (1972) Acid-base reactions of the TiO2 (Anatase) – water interface and the point of zero charge of TiO2 suspensions. Kolloid-Z. u. Z. Polymere 250, 759-765. 35 Bolt, G. H., van Riemsdijk, W. H. (1982) Ion adsorption on inorganic variable charge constituents. In: Soil Chemistry. B. Physico-Chemical models (Ed. G. H. Bolt), Elsevier, Amsterdam, The Netherlands, pp 459-504.
65
36 Hiemstra, T., van Riemsdijk, W. H., Bolt, G.H. (1989) Multisite proton adsorption modeling at the solid/solution interface of (hydr)oxides: A new approach. I. Model description and evaluation of intrinsic reaction constants. J. Coll. Int. Sci. 133, 1, 91-104. 37 Hiemstra, T., De Wit, J. C. M., van Riemsdijk, W. H. (1989) Multisite proton adsorption modeling at the solid/solution interface of (hydr)oxides: A new approach. II. Application to various important (hydr)oxides. J. Coll. Int. Sci. 133, 1, 105-117. 38 Venema, P., Hiemstra. T., Weidler, P. G., van Riemsdijk, W. H. (1998) Intrinsic proton affinity of reactive surface groups of metal (hydr)oxides: Application to iron (hydr)oxides. J. Coll. Int. Sci. 198, 2, 282-295. 39 Bockris, J. O’M., Reddy, A. K. (1970) Modern electrochemistry. An introduction to an interdisciplinary area. Plenum Press, New York, USA. 40 Westall, J., Hohl, H. (1980) A comparison of electrostatic models for the oxide/solution interface. Adv. Colloid Interface Sci. 12, 4, 265-294. 41 Hiemstra, T., van Riemsdijk, W. H. (1996) A surface structural approach to ion adsorption: The charge distribution (CD) model. J. Coll. Int. Sci. 179, 2, 488-508. 42 Nilsson, N., Persson, P., Lövgren, L., Sjöberg, S. (1996) Competitive surface complexation of o-phthalate and phosphate on goethite (α-FeOOH) particles. Geochim. Cosmochim. Acta 60, 22, 4385-4395. 43 Gastuche, M. C., Herbillon, A. (1962) Étude des gels d’alumine: cristallisation en milieu désionisé. Bull. Soc. Chim. Fr. 1, 1404-1412. 44 Ginstrup, O. (1973) Experimental and computational methods for studying multicomponent equilibria. II. An automated system for precision emf titrations. Chem. Instrum. 4, 141-155. 45 Davies, C. W. (1962) Ion association. Butterworths, London, U.K. 46 Westall J. C. (1982) FITEQL: A computer program for determination of chemical equilibrium constants from experimental data. Version 2.0, Report 82-02, Department of Chemistry, Oregon State University, Corvallis, OR., USA. 47 Sjöberg, S., Lövgren, L. (1993) The application of potentiometric techniques to study complexation reactions at the mineral/water interface. Aquatic Sciences 55/4, 324-335. 48 Kavanagh, B., Posner, A., Quirk, J. P. (1975) Effect of polymer adsorption on the properties of the electrical double layer. Discuss. Faraday Soc. 59, 242-249. 49 Hiemstra, T., Yong, H., van Riemsdijk, W. H. (1999) Interfacial charging phenomena of aluminum (hydr)oxides. Langmuir 15, 18, 5942-5955. 50 Loewenberg, M., O’Brien, R. (1992) The dynamic mobility of nonspherical particles. J. Coll. Int. Sci. 150, 1, 158-168. 51 Lagerström, G. (1959) Equilibrium studies of polyanions. III. Silicate ions in NaClO4 medium. Acta Chem. Scand. 13, 722-736. 52 Sjöberg, S. (1996) Silica in aqueous environments. J. Non-Cryst. Solids 196, 51-57. 53 Carroll, S. A., Maxwell, R. S., Bourcier, W., Martin, S., Hulsey, S. (2002) Evaluation of silica-water surface chemistry using NMR spectroscopy. Geochim. Cosmochim. Acta 66, 6, 913-926. 54 Barr, T. L., Seal, S., Wozniak, K., Klinowski, J. (1997) ESCA studies of the coordination state of aluminium in oxide environments. J. Chem. Soc., Faraday Trans. 93, 181-186. 55 Chorover, J., Sposito, G. (1995) Surface charge characteristics of kaolinitic tropical soils. Geochim. Cosmochim. Acta 59, 5, 875-884.
66
56 Brady, P.V., Cygan, R.T., Nagy, K.L. (1996) Molecular controls on kaolinite surface charge. J. Coll. Int. Sci. 183, 2, 356-364. 57 Huertas, F. J., Chou, L., Wollast, R. (1998) Mechanism of kaolinite dissolution at room temperature and pressure: Part 1. Surface speciation. Geochim. Cosmochim. Acta 62, 3, 417-431. 58 Schroth, B., Sposito, G. (1998) Effect of landfill leachate organic acids on trace metal adsorption by kaolinite. Environ. Sci. Technol. 32, 1404-1408. 59 Neubauer, U., Nowack, B., Furrer, G., Schulin, R. (2000) Heavy metal sorption on clay minerals affected by the siderophore desferrioxamine B. Environ. Sci. Technol. 34, 2749-2755. 60 Axe, K., Persson, P. (2001) Time-dependent surface speciation of oxalate at the water-boehmite (γ-AlOOH) interface: Implications for dissolution. Geochim. Cosmochim. Acta 65, 24, 4481-4492. 61 Boily, J.-F., Persson, P., Sjöberg, S. (2000) Benzenecarboxylate surface complexation at the goethite (α-FeOOH)/water interface: II. Linking IR spectroscopic observations to mechanistic surface complexation models for phthalate, trimellitate and pyromellitate. Geochim. Cosmochim. Acta 64, 20, 3453-3470. 62 Clausén, M. (2002) Coordination chemistry of aluminium(III) and gallium(III) carboxylate complexes. Ph.D. Thesis, Umeå University, Sweden. 63 Kettle, S. F. A. (1998) Physical inorganic chemistry. A coordination chemistry approach. Oxford University Press, New York, USA.