SIZE DEPENDENT SHIFTS IN THE DIET OF THE MANGROVE TREE ...
50
SIZE DEPENDENT SHIFTS IN THE DIET OF THE MANGROVE TREE CRAB, ARATUS PISONII, AS INDICATED BY δ 13 C & δ 15 N FROM A MANGROVE ECOSYTEM IN INDIAN RIVER LAGOON, FL By JONATHAN MICHAEL PAHLAS (Under the Direction of Samantha Joye) ABSTRACT The adult mangrove tree crab, Aratus pisonii, is responsible for significant portions of leaf herbivory in mangrove forests. Using the mixing model software, IsoSource, we compare δ 13 C & δ 15 N of three A. pisonii size classes to evaluate their food sources in a mangrove forest along the Indian River Lagoon, FL. We also developed a mass balance method for incorporation of nutrient concentration into the model. Our results suggest that the juvenile Aratus diet of MPB and freshly fallen leaves shifts to a diet dominated by senescent leaves and lichens as an adult. This pattern is driven by strong intraspecific restrictions that prevent small A. pisonii from entering the mangrove tree canopy. Thus, only the larger crabs have access to nitrogen-fixing, δ 15 N depleted lichens in the branches which gives them an unusually low δ 15 N value relative to smaller individuals. Similarly, large crab reliance on leaf material results in depleted δ 13 C values compared to the small crabs who utilize the δ 13 C rich microphytobenthos. INDEX WORDS: Mangrove; Isotope; Aratus pisonii; Indian River Lagoon; Food web; Diet; Lichen; Mangrove tree crab; Rhizophora mangle; Nutrient enrichment; Fertilization; Carbon; Nitrogen; IsoSource
Transcript of SIZE DEPENDENT SHIFTS IN THE DIET OF THE MANGROVE TREE ...
SIZE DEPENDENT SHIFTS IN THE DIET OF THE MANGROVE TREE CRAB, ARATUS PISONII, AS INDICATED BY
δ13C & δ15N FROM A MANGROVE ECOSYTEM IN INDIAN RIVER LAGOON, FL
By
JONATHAN MICHAEL PAHLAS
(Under the Direction of Samantha Joye)
ABSTRACT
The adult mangrove tree crab, Aratus pisonii, is responsible for significant portions of leaf
herbivory in mangrove forests. Using the mixing model software, IsoSource, we compare δ13C & δ15N of
three A. pisonii size classes to evaluate their food sources in a mangrove forest along the Indian River
Lagoon, FL. We also developed a mass balance method for incorporation of nutrient concentration into
the model. Our results suggest that the juvenile Aratus diet of MPB and freshly fallen leaves shifts to a
diet dominated by senescent leaves and lichens as an adult. This pattern is driven by strong intraspecific
restrictions that prevent small A. pisonii from entering the mangrove tree canopy. Thus, only the larger
crabs have access to nitrogen-fixing, δ15N depleted lichens in the branches which gives them an
unusually low δ15N value relative to smaller individuals. Similarly, large crab reliance on leaf material
results in depleted δ13C values compared to the small crabs who utilize the δ13C rich microphytobenthos.
INDEX WORDS: Mangrove; Isotope; Aratus pisonii; Indian River Lagoon; Food web; Diet; Lichen;
Mangrove tree crab; Rhizophora mangle; Nutrient enrichment; Fertilization; Carbon; Nitrogen;
IsoSource
SIZE DEPENDENT SHIFTS IN THE DIET OF THE MANGROVE TREE CRAB, ARATUS PISONII, AS INDICATED BY
δ13C & δ15N FROM A MANGROVE ECOSYTEM IN INDIAN RIVER LAGOON, FL
By
JONATHAN MICHAEL PAHLAS
B.S., The University of Georgia, 2011
A Thesis Submitted to the Graduate Faculty of The University of Georgia in Partial Fulfillment of the
Requirements for the Degree
MASTER OF SCIENCE
ATHENS, GEORGIA
2013

© 2013
Jonathan Michael Pahlas
All Rights Reserved
SIZE DEPENDENT SHIFTS IN THE DIET OF THE MANGROVE TREE CRAB, ARATUS PISONII, AS INDICATED BY
δ13C & δ15N FROM A MANGROVE ECOSYTEM IN INDIAN RIVER LAGOON, FL
By
JONATHAN MICHAEL PAHLAS
Major Professor: Samantha Joye
Committee: Ilka Feller
Merryl Alber
Electronic Version Approved:
Maureen Grasso
Dean of the Graduate School
The University of Georgia
May 2013
iv
TABLE OF CONTENTS
LIST OF TABLES .............................................................................................................................................. v
LIST OF FIGURES ........................................................................................................................................... vi
INTRODUCTION ............................................................................................................................................. 7
MATERIALS AND METHODS ........................................................................................................................ 13
Site Description ....................................................................................................................................... 13
Experimental Design ............................................................................................................................... 13
Sample Collection and Preparation ......................................................................................................... 14
Nutrient and Stable Isotope Analyses and Isotopic Mixing Models ........................................................ 15
Statistics .................................................................................................................................................. 17
RESULTS ...................................................................................................................................................... 18
Nutrient enrichment effects .................................................................................................................... 18
Isotope signatures of the fringe .............................................................................................................. 18
Ontogenetic shifts in A. pisonii ................................................................................................................ 20
DISCUSSION ................................................................................................................................................. 22
Nutrient enrichment effects .................................................................................................................... 22
Isotope signatures of the fringe .............................................................................................................. 24
Ontogenetic shifts in A. pisonii ................................................................................................................ 24
Evaluation of IsoSource mixing model results ......................................................................................... 27
CONCLUSION ............................................................................................................................................... 27
WORKS CITED .............................................................................................................................................. 28
v
LIST OF TABLES
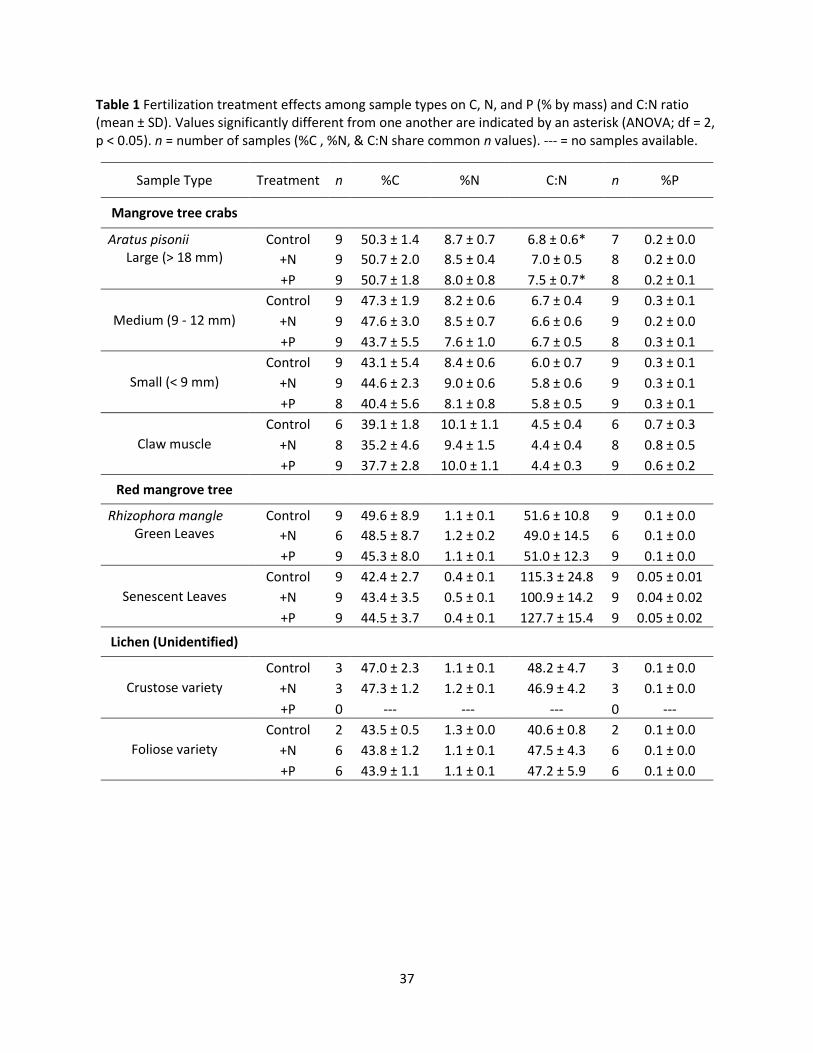
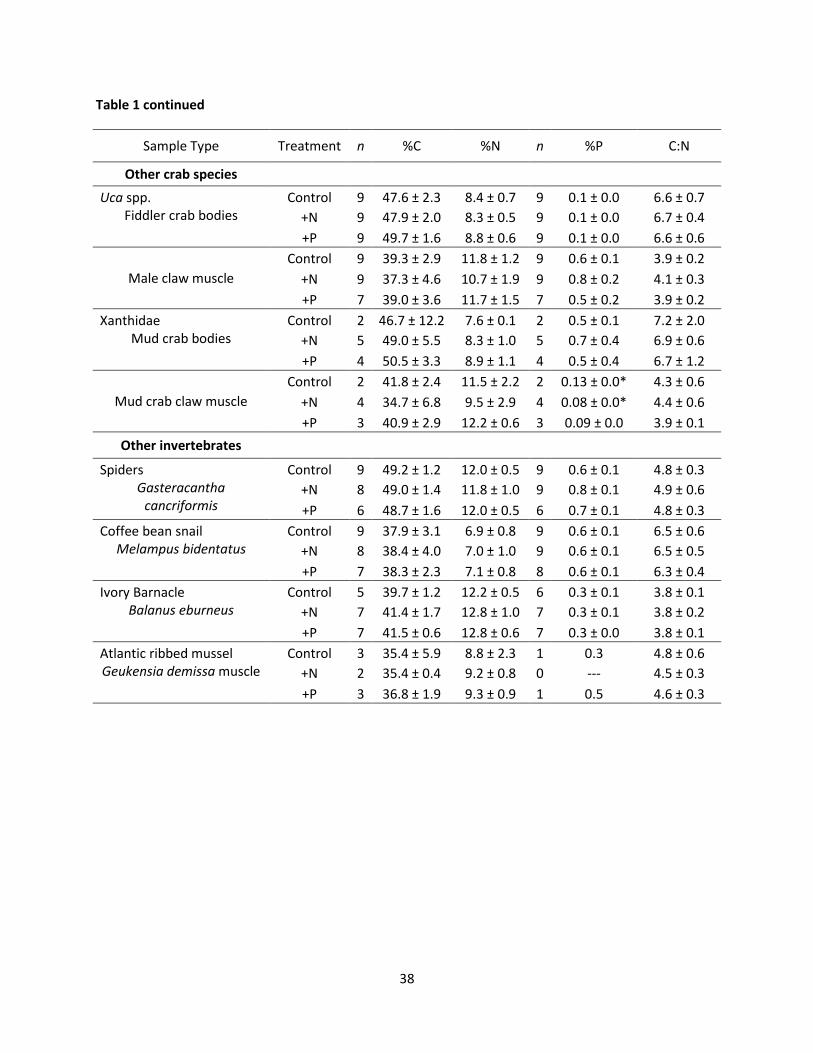
Table 1 Fertilization treatment effects among sample types on C, N, and P and C:N ratio ....................... 37
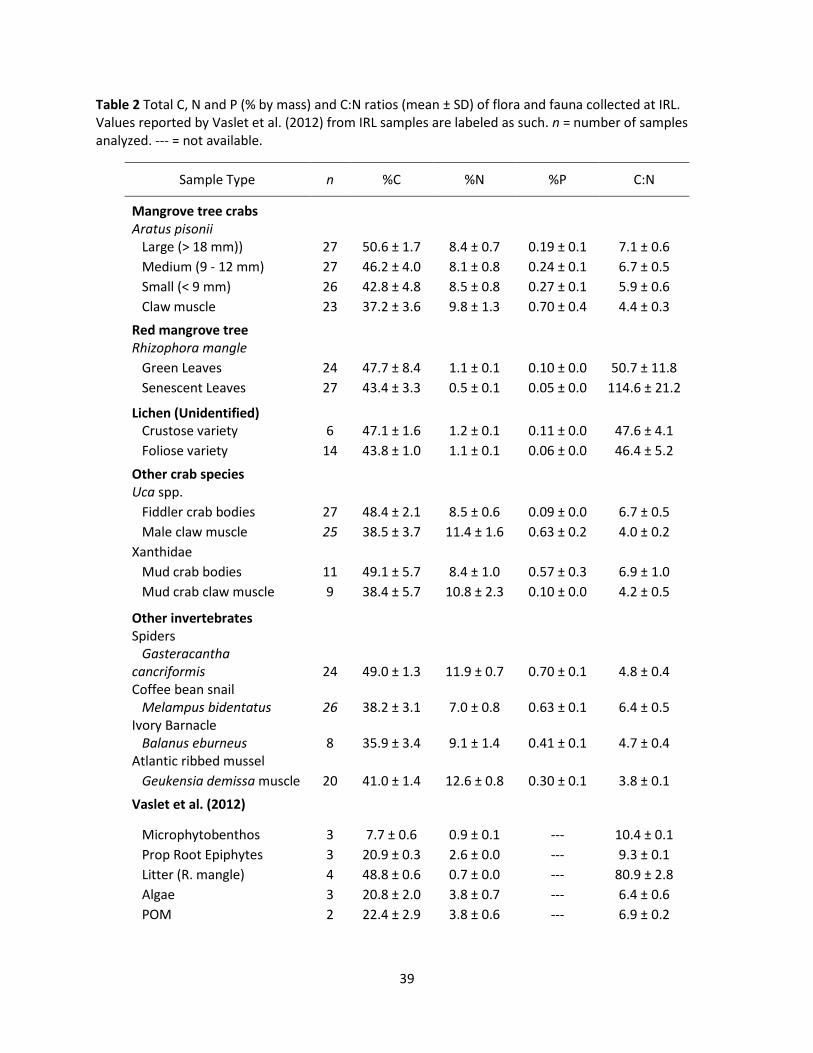
Table 2 Total C, N and P and C:N ratios of flora and fauna collected at IRL ............................................... 39
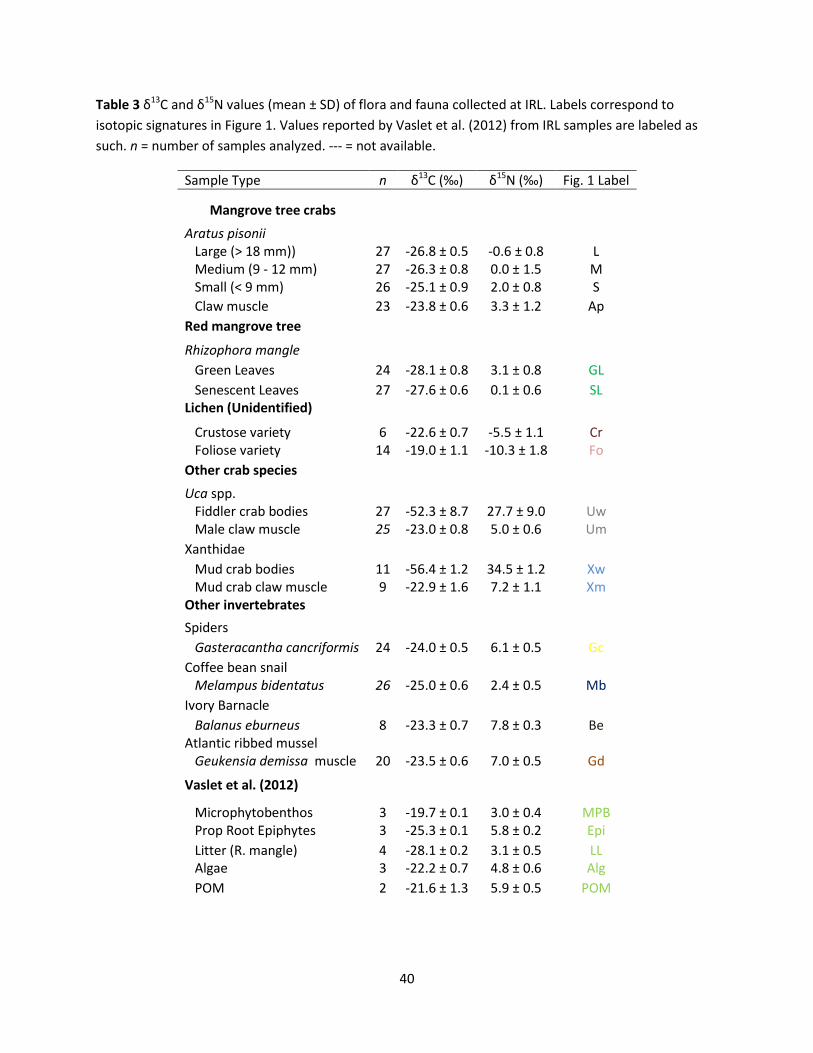
Table 3 δ13C and δ15N values of flora and fauna collected at IRL ............................................................... 40
Table 4 Reclassification summary of trophic groups from discriminant function analysis of A. pisonii size
classes ......................................................................................................................................................... 41
Table 5 δ13C, δ15N, δ*C and δ*N values used to determine dietary contribution ranges in IsoSource ..... 42
Table 6 Feasible source contributions to diets of small and large A. pisonii using the traditional method
and mass balance method to determine inputs for IsoSource. .................................................................. 43
vi
LIST OF FIGURES
Figure 1 Biplot of δ13C v. δ15N values for all samples collected from IRL ................................................... 44
Figure 2 The isotopic differences between large, medium, and small A. pisonii size classes .................... 45
Figure 3 Mixing polygon for δ13C and δ15N signatures of 6 food sources for small A. pisonii .................... 46
Figure 4 Mixing polygon for δ13C and δ15N signatures of 10 potential food sources for large A. pisonii ... 47
Figure 5 Mixing polygon for δ13C and δ15N signatures of 6 potential food sources for small A. pisonii using
the mass balance method ........................................................................................................................... 48
Figure 6 Mixing polygon for δ13C and δ15N signatures of 10 potential food sources for large A. pisonii
using the mass balance method ................................................................................................................. 49

7
INTRODUCTION
Mangrove forests are distributed within intertidal areas between 30° N and 30° S latitude (Giri
et al., 2011). Their prop roots and pneumatophores provide a home for both terrestrial and marine
plants, algae, invertebrates, and vertebrates (Nagelkerken et al., 2008). These productive habitats
support coastal fisheries by providing a nursing ground for juvenile target species and deliver many
valuable ecosystem services, including runoff retention and filtration, protection against shoreline
erosion, retention of nutrients benefitting adjacent agriculture, and local subsistence uses as a source of
fire-wood, building materials, and nutrition (Hogarth, 1999; Naylor et al., 2000). Mangrove litter and
root biomass fuel intense biogeochemical cycling which provides carbon (C) and nutrients for use both
within the mangrove forest system and by adjacent habitats (Kristensen et al., 1995). In his pioneering
work on mangrove ecosystems, Odum proposed that the consumption of decaying leaf litter drove the
forest food web, and the export of this material was a large contributor to adjacent system productivity
(Odum, 1971; Odum & Heald, 1972).
Productivity and forest structure have been tied traditionally to abiotic factors acting from the
bottom up (Odum, 1971; Cannicci et al., 2008). Nutrient availability in mangroves can range from
oligotrophic to eutrophic over relatively short distances as a function of tidal inundation, underlying
hydrology, and temperature and salinity regulated microbial decomposition and decay (Feller et al.,
2003a). In turn, mangrove trees display highly plastic phenotypic responses to nutrient availability.
Stunted stands of the red mangrove tree, Rhizophora mangle, grow to an average of only 1.5 m tall
under the influence of oligotrophic conditions (Lugo, 1997; Feller et al., 2003a), but R. mangle enriched
by rivers and bird rookeries can achieve heights as tall as 16 m (Golley, 1975; Pool et al., 1977). Relief of

8
nutrient limitation has been shown to produce significant physiological effects. Primary productivity,
growth rates, and nutritional content of leaf material increase after fertilization treatments (Feller,
1995; Lovelock & Feller, 2003; Feller et al., 2009a), and detritus derived from mangrove trees fertilized
with N and P exhibited altered litter quality and decomposition rates (Feller et al., 1999). Because
nutrient loading from terrestrial runoff can be a significant source of nitrogen (N) and phosphorus (P)
(Yuangen et al., 2012), characterization of enrichment effects on these ecosystems is integral to
understanding mangrove forest ecology.
Indian River Lagoon (hereafter IRL) spans 40 percent of Florida’s eastern coast and contains
more animal and plant species than any other estuary in North America providing an estimated 50% of
the east Florida annual fish catch ("Indian River Lagoon: An Introduction to a Natural Treasure," 2007).
In 1997, Feller et al. (2003b) began fertilization treatments in an abandoned mosquito impoundment
(MI 23), which lies at the southern end of IRL. While most nutrient-limited mangrove forests are limited
by P, the IRL is characterized by N-limitation (Feller et al., 2003a; Feller et al., 2003b). Nutrient
enrichment at the base of trees produced significant increases in leaf %N, growth, and productivity
(Feller et al., 2003b). Mangrove fertilization has also been observed to bring about changes in leaf
stoichiometry, photosynthetic productivity, resorption efficiencies, and new growth in other systems
(Feller, 1995; Feller et al., 2003a; Feller et al., 2009b). Though fertilization altered plant growth and
nutrient dynamics, folivory rates by mangrove associated fauna showed no response to these traits
(Feller et al., In Press).
The significant impacts herbivores can have on mangrove forest ecology makes characterization
of food web structure of particular interest (Cannicci et al., 2008). Herbivory by the arboreal mangrove
crab, Aratus pisonii, has been suggested to influence mangrove canopy structure as a function of
herbivore population dynamics (Feller et al., In Press). In a study in south Florida, A. pisonii herbivory
9
alone was documented on 30 – 40% of mangrove tree leaves resulting in up to 30% loss of production
therein (Erickson et al., 2003). By exerting these top down pressures on primary producers, herbivores
can influence net primary productivity and nutrient cycling. Crabs in a SW Atlantic marsh markedly
reduced growth rates and increased senescence in fertilized plots (Alberti et al., 2011). Alterations to
mangrove forest structure as well as decreases in tree productivity and reproductive success have been
linked to herbivory on leaves, wood, and propagules (Farnsworth & Ellison, 1991; Feller & Mathis, 1997;
Feller, 2002; Cannicci et al., 2008).
Aratus pisonii, a small Grapsid crab of the subfamily Sesarminae (Warner, 1967), is a widely
distributed mangrove invertebrate that has been hypothesized to play a pivotal role in mangrove food
webs (Feller et al., In Press). It inhabits shores from Florida to Brazil on the western Atlantic and from
Nicaragua to Peru along the Pacific (Rathbun, 1917). Aratus pisonii is found commonly in the seaward
margins of mangrove swamps climbing among the fringing trees. In a Jamaican forest, A. pisonii
densities were measured at 15-16 crabs per m2 (Warner, 1967, 1970), and they appear to be similarly
abundant at IRL (Feller et al., In Press). Individuals are generally greenish in color with black and yellow
mottling on their carapaces, and their chelae are red with stiff, black bristles. This species can reach a
maximum carapace width of about 24 mm, and females become reproductively mature at about 6 mo
or 12 mm (Warner, 1967). Frequency of ovulation increases until 15 – 17 mm after which point number
of eggs produced continues to increase with body size while frequency of ovulation diminishes.
Aratus pisonii production is responsible for a significant amount of energy, nutrient, and
biomass export from the mangrove canopy (Beever et al., 1979; Schwamborn et al., 1999). Warner
(1967) estimated an average export of over 6000 eggs per m2 per month, and shredding of leaf material
makes mangrove biomass more accessible for decomposition on the forest floor while also facilitating
transfer to pelagic systems if fecal pellets are excreted over water (Robertson & Daniel, 1989; Werry &
10
Lee, 2005). In addition to export of production and waste, A. pisonii directly transfer nutrition to
predators such as fish, birds, raccoons, and other crabs (Warner, 1967; McKeon & Feller, 2004). Thus, A.
pisonii act as an intermediary link between mangrove forest canopies and the rest of the system.
Adult A. pisonii utilize a unique niche living among the branches and prop roots of the mangrove
trees. Feeding in the canopy provides reduced risk of predation and a reliably abundant food source
(Wolcott & O'Connor, 1992), so it is surprising that few crabs worldwide have adapted this strategy
(Hartnoll, 1965). Though gut content analyses clearly show a preference for R. mangle, A. pisonii will eat
black or white mangrove leaves as well, Avicennia germinans and Laguncularia racemosa, respectively
(Beever et al., 1979; Erickson et al., 2003). Depending upon availability, A. pisonii have been observed to
exhibit a diverse array of supplemental feeding strategies. They will graze leaf detritus and algae in the
intertidal zone and opportunistically consume animal material, including insect larvae, nematodes,
crustaceans, fish scales, forams, and polychaetes (Warner, 1967; Díaz & Conde, 1988; Erickson et al.,
2003; McKeon & Feller, 2004; Feller & Chamberlain, 2007).
Due to intense intraspecific competition for space on the branches, only large A. pisonii have
access to the forest canopy resulting in distinct differences in feeding behaviors between size classes.
Any small crabs attempting to move into the upper reaches of the trees are quickly turned away by
larger individuals (Warner, 1970). These encounters usually are determined simply by ritualized
behaviors that allow smaller individuals to leave unscathed, but adult A. pisonii have been observed to
kill and consume smaller conspecifics. These vertical migration limitations restrict juvenile A. pisonii to
the lower prop roots and forest floor where they have access to detritus, algae, and microphytobenthos
(MPB) (Feller & Chamberlain, 2007; Giarrizzo et al., 2011). As they mature, they can more freely enter
the upper reaches of the trees where they begin to feed on leaves and other prey items (Warner, 1970;
Beever et al., 1979; McKeon & Feller, 2004). Though their role as an opportunistic omnivore is well

11
established, no study has characterized A. pisonii’s diet as they shift from juveniles to adults. With such
high densities observed where A. pisonii reside, these primary mangrove folivores are of particular
interest to food web studies (Erickson et al., 2003; Feller et al., In Press).
In recent decades, stable isotope analysis has emerged as one of the primary methods of
analyzing food web structure (Layman et al., 2011). Although sulphur, oxygen, and deuterium can be
useful food web tracers in some circumstances, C and N are the most common isotopic systems
employed in this context. For this study, stable isotope ratios are expressed in standard delta notation
(Fry, 2006) according to the formula δ = 1000[(Rsample – Rstandard) Rstandard-1], where R is the ratio of heavy
to light isotope (15N:14N or 13C:12C), Rsample is R measured for animal and plant tissues, and Rstandard is an
international standard (Pee Dee Belemnite for 13C and atmospheric N2 for 15N). Estimating the trophic
position of an organism is effectively achieved by determining its 15N value, which shows incremental
enrichment through trophic transfer (Minagawa & Wada, 1984; Peterson & Fry, 1987; Post, 2002).
Primary producers using different photosynthetic pathways have substantially different δ13C signatures
(Minagawa & Wada, 1984; Peterson & Fry, 1987; Post, 2002). This makes δ13C a useful tool for
identifying primary C sources since δ13C values exhibit little variation between trophic transfers (DeNiro
& Epstein, 1981; Peterson & Fry, 1987; Post, 2002). A δ13C and δ15N biplot can reveal ultimate organic
matter resources (for C and N) as well as trophic position (Layman et al., 2011). This isotopic signature
generally aligns closely with actual trophic position though it must be carefully interpreted to prevent
misrepresentations (Layman et al., 2011).
Stable isotope studies have been used to establish the fate of detritus within the mangrove
forests and the surrounding ecosystems (Schwamborn et al., 2002; Nguyen et al., 2012; Vaslet et al.,
2012), and laboratory rearing experiments have established important aspects of biosynthetic processes
that alter the 15N and 13C for particular organisms and tissues (Martínez del Rio et al., 2009).
12
Schwamborn et al. (2002) determined that Grapsid crab larvae released from mangrove forests did not
rely on mangrove derived carbon during development and that these young crabs exhibited assimilatory
shifts of up to 1.0 ± 0.2‰ for 13C and up to 1.4 ± 0.6‰ for 15N. Another study using δ13C and δ15N,
determined that young juvenile blue crabs living in the Delaware Bay area fed primarily on zooplankton,
while marsh-dwelling individuals, which were enriched in 13C relative to bay juveniles, suggesting they
utilized marsh-derived carbon for growth (Dittel et al., 1999). France (1998) used δ13C and δ15N values of
the fiddler crab, Uca vocator, in Puerto Rico to determine that MPB appear to make a proportionally
greater contribution to the diets of these crabs than does mangrove carbon. Other isotope studies have
shown that ingested material is not always assimilated efficiently by mangrove ecosystem consumers,
and other primary producers such as phytoplankton, MPB, and algae may be more important sources of
nutrition than previously suspected (Newell et al., 1995; Christensen et al., 2001; Bouillon et al., 2002).
Using C and N stable isotopes, this study attempts to elucidate the primary sources of nutrition
for A. pisonii across three post-larval life stages: small sized juveniles, intermediate sized individuals, and
large adults. We evaluate the hypothesis that A. pisonii will ascend to a higher trophic level as they grow
and broaden their dietary options. To do so, δ13C and δ15N values for the three size classes and potential
prey items were measured from IRL and combined using the mixing model, IsoSource, to provide
feasible source contributions from each prey item to A. pisonii’s diet. An alternative mass balance
method of using IsoSource to incorporate C and N concentrations of source tissue into the mixing model
is utilized as well. In addition, this study assesses whether soil nutrient enrichment has an effect on the
greater community of organisms dependent upon the R. mangle trees of the IRL mangrove forest. To do
so, we evaluate the hypothesis that organisms dependent upon mangrove leaves will exhibit altered
nutritional traits corresponding to altered food source quality.
13
MATERIALS AND METHODS
Site Description
Animal and leaf samples were collected from experimentally nutrient-enriched mangrove tree
stands situated along the Intercoastal Waterway in IRL. Located in Avalon State Park on North
Hutchinson Island, St. Lucie County, IRL is strongly stratified into three zones, which can be characterized
by tree height and species composition, regularity of flooding events, and diversity of fauna. As
described by Feller et al. (2003b), the fringe zone, which lies adjacent to the waterway, hosts stands of
R. mangle rising up to approximately 4 m above the sediment surface. Here, semidiurnal tides regularly
flush the sediment, and a variety of invertebrates are found living on the prop roots, in the sediment,
and among the branches. The transition and scrub zones exhibit relatively lower faunal abundance and
lie inland of the fringe zone by about 5 m and 15 m, respectively (Feller & Chamberlain, 2007).
Experimental Design
Fertilization treatments began January 1997 at IRL, as described in detail by Feller et al. (2003b).
The study location is divided into three areas including three treatments per site (Control, Nitrogen (+N),
& Phosphorus (+P)) with three replicate trees per treatment within each area for a total of 27 trees
within the fringe zone (Feller et al., 2003b). Fertilization treatments were randomly assigned to trees.
Small doses of fertilizer (150 g NH4 or P2O5 per cm diameter for +N or +P treatments, respectively) were
sealed in dialysis tubing, placed in 30 cm holes cored into the substrate at opposite ends of a tree’s
canopy, and buried. Control trees received cores, but no fertilizer was added. Fertilization occurred
twice per year and was administered into the sediment because surface application would have been
washed away during tidal events.
14
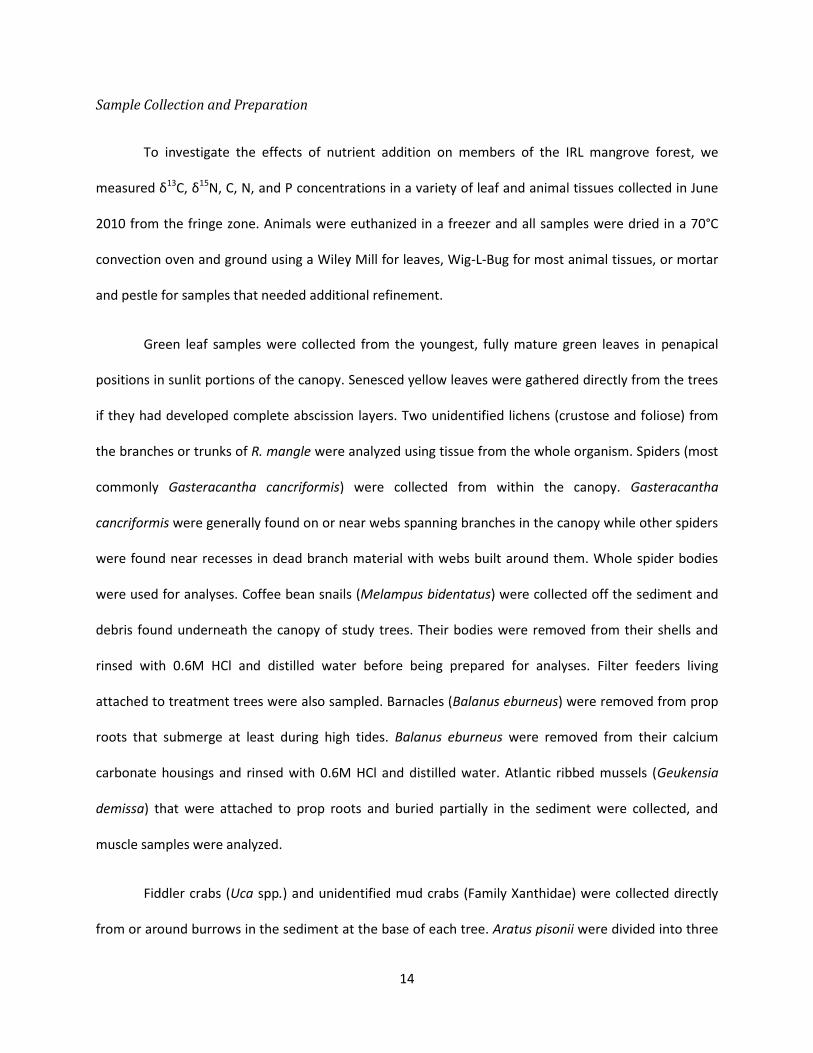
Sample Collection and Preparation
To investigate the effects of nutrient addition on members of the IRL mangrove forest, we
measured δ13C, δ15N, C, N, and P concentrations in a variety of leaf and animal tissues collected in June
2010 from the fringe zone. Animals were euthanized in a freezer and all samples were dried in a 70°C
convection oven and ground using a Wiley Mill for leaves, Wig-L-Bug for most animal tissues, or mortar
and pestle for samples that needed additional refinement.
Green leaf samples were collected from the youngest, fully mature green leaves in penapical
positions in sunlit portions of the canopy. Senesced yellow leaves were gathered directly from the trees
if they had developed complete abscission layers. Two unidentified lichens (crustose and foliose) from
the branches or trunks of R. mangle were analyzed using tissue from the whole organism. Spiders (most
commonly Gasteracantha cancriformis) were collected from within the canopy. Gasteracantha
cancriformis were generally found on or near webs spanning branches in the canopy while other spiders
were found near recesses in dead branch material with webs built around them. Whole spider bodies
were used for analyses. Coffee bean snails (Melampus bidentatus) were collected off the sediment and
debris found underneath the canopy of study trees. Their bodies were removed from their shells and
rinsed with 0.6M HCl and distilled water before being prepared for analyses. Filter feeders living
attached to treatment trees were also sampled. Barnacles (Balanus eburneus) were removed from prop
roots that submerge at least during high tides. Balanus eburneus were removed from their calcium
carbonate housings and rinsed with 0.6M HCl and distilled water. Atlantic ribbed mussels (Geukensia
demissa) that were attached to prop roots and buried partially in the sediment were collected, and
muscle samples were analyzed.
Fiddler crabs (Uca spp.) and unidentified mud crabs (Family Xanthidae) were collected directly
from or around burrows in the sediment at the base of each tree. Aratus pisonii were divided into three
15
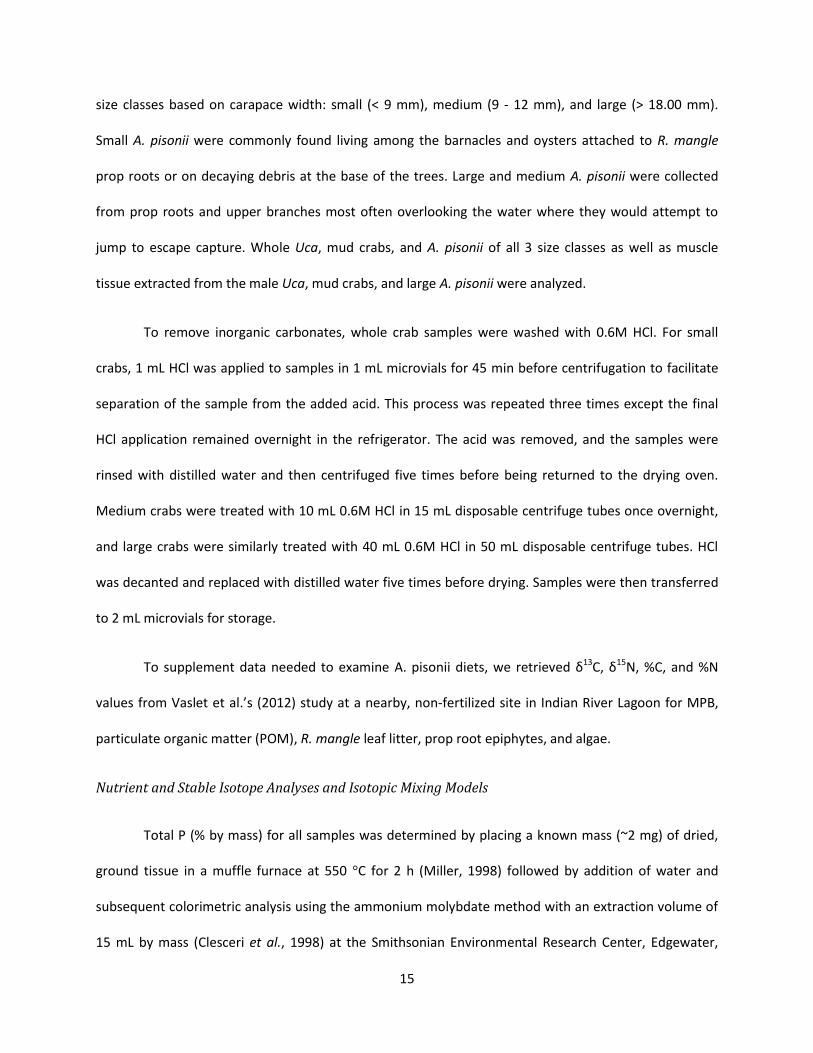
size classes based on carapace width: small (< 9 mm), medium (9 - 12 mm), and large (> 18.00 mm).
Small A. pisonii were commonly found living among the barnacles and oysters attached to R. mangle
prop roots or on decaying debris at the base of the trees. Large and medium A. pisonii were collected
from prop roots and upper branches most often overlooking the water where they would attempt to
jump to escape capture. Whole Uca, mud crabs, and A. pisonii of all 3 size classes as well as muscle
tissue extracted from the male Uca, mud crabs, and large A. pisonii were analyzed.
To remove inorganic carbonates, whole crab samples were washed with 0.6M HCl. For small
crabs, 1 mL HCl was applied to samples in 1 mL microvials for 45 min before centrifugation to facilitate
separation of the sample from the added acid. This process was repeated three times except the final
HCl application remained overnight in the refrigerator. The acid was removed, and the samples were
rinsed with distilled water and then centrifuged five times before being returned to the drying oven.
Medium crabs were treated with 10 mL 0.6M HCl in 15 mL disposable centrifuge tubes once overnight,
and large crabs were similarly treated with 40 mL 0.6M HCl in 50 mL disposable centrifuge tubes. HCl
was decanted and replaced with distilled water five times before drying. Samples were then transferred
to 2 mL microvials for storage.
To supplement data needed to examine A. pisonii diets, we retrieved δ13C, δ15N, %C, and %N
values from Vaslet et al.’s (2012) study at a nearby, non-fertilized site in Indian River Lagoon for MPB,
particulate organic matter (POM), R. mangle leaf litter, prop root epiphytes, and algae.
Nutrient and Stable Isotope Analyses and Isotopic Mixing Models
Total P (% by mass) for all samples was determined by placing a known mass (~2 mg) of dried,
ground tissue in a muffle furnace at 550 °C for 2 h (Miller, 1998) followed by addition of water and
subsequent colorimetric analysis using the ammonium molybdate method with an extraction volume of
15 mL by mass (Clesceri et al., 1998) at the Smithsonian Environmental Research Center, Edgewater,
16
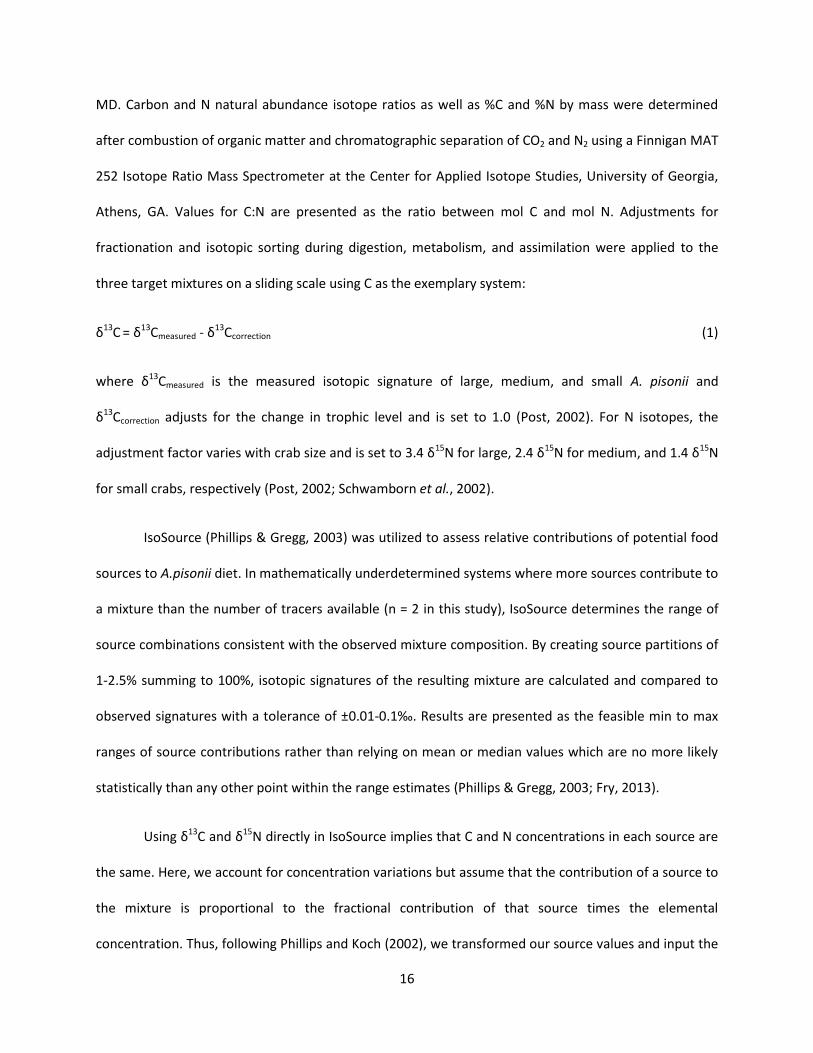
MD. Carbon and N natural abundance isotope ratios as well as %C and %N by mass were determined
after combustion of organic matter and chromatographic separation of CO2 and N2 using a Finnigan MAT
252 Isotope Ratio Mass Spectrometer at the Center for Applied Isotope Studies, University of Georgia,
Athens, GA. Values for C:N are presented as the ratio between mol C and mol N. Adjustments for
fractionation and isotopic sorting during digestion, metabolism, and assimilation were applied to the
three target mixtures on a sliding scale using C as the exemplary system:
δ13C = δ13Cmeasured - δ13Ccorrection (1)
where δ13Cmeasured is the measured isotopic signature of large, medium, and small A. pisonii and
δ13Ccorrection adjusts for the change in trophic level and is set to 1.0 (Post, 2002). For N isotopes, the
adjustment factor varies with crab size and is set to 3.4 δ15N for large, 2.4 δ15N for medium, and 1.4 δ15N
for small crabs, respectively (Post, 2002; Schwamborn et al., 2002).
IsoSource (Phillips & Gregg, 2003) was utilized to assess relative contributions of potential food
sources to A.pisonii diet. In mathematically underdetermined systems where more sources contribute to
a mixture than the number of tracers available (n = 2 in this study), IsoSource determines the range of
source combinations consistent with the observed mixture composition. By creating source partitions of
1-2.5% summing to 100%, isotopic signatures of the resulting mixture are calculated and compared to
observed signatures with a tolerance of ±0.01-0.1‰. Results are presented as the feasible min to max
ranges of source contributions rather than relying on mean or median values which are no more likely
statistically than any other point within the range estimates (Phillips & Gregg, 2003; Fry, 2013).
Using δ13C and δ15N directly in IsoSource implies that C and N concentrations in each source are
the same. Here, we account for concentration variations but assume that the contribution of a source to
the mixture is proportional to the fractional contribution of that source times the elemental
concentration. Thus, following Phillips and Koch (2002), we transformed our source values and input the
17
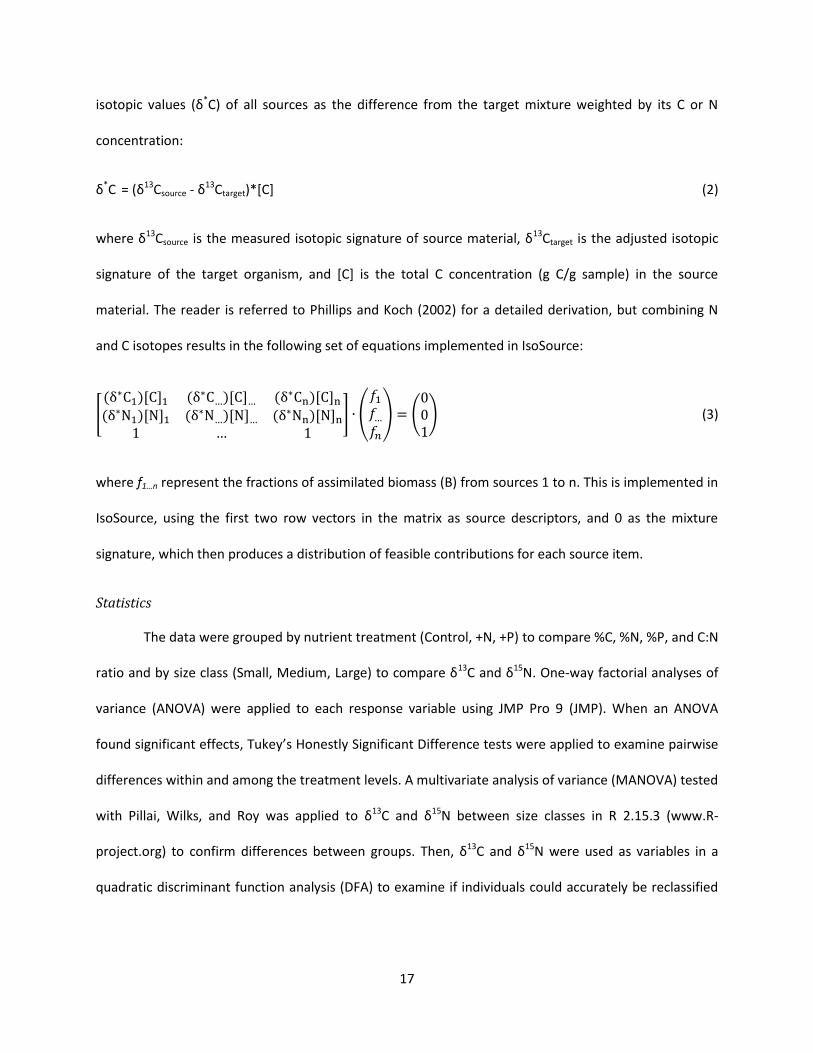
isotopic values (δ*C) of all sources as the difference from the target mixture weighted by its C or N
concentration:
δ*C = (δ13Csource - δ13Ctarget)*[C] (2)
where δ13Csource is the measured isotopic signature of source material, δ13Ctarget is the adjusted isotopic
signature of the target organism, and [C] is the total C concentration (g C/g sample) in the source
material. The reader is referred to Phillips and Koch (2002) for a detailed derivation, but combining N
and C isotopes results in the following set of equations implemented in IsoSource:
[
] (
) ( ) (3)
where f1…n represent the fractions of assimilated biomass (B) from sources 1 to n. This is implemented in
IsoSource, using the first two row vectors in the matrix as source descriptors, and 0 as the mixture
signature, which then produces a distribution of feasible contributions for each source item.
Statistics
The data were grouped by nutrient treatment (Control, +N, +P) to compare %C, %N, %P, and C:N
ratio and by size class (Small, Medium, Large) to compare δ13C and δ15N. One-way factorial analyses of
variance (ANOVA) were applied to each response variable using JMP Pro 9 (JMP). When an ANOVA
found significant effects, Tukey’s Honestly Significant Difference tests were applied to examine pairwise
differences within and among the treatment levels. A multivariate analysis of variance (MANOVA) tested
with Pillai, Wilks, and Roy was applied to δ13C and δ15N between size classes in R 2.15.3 (www.R-
project.org) to confirm differences between groups. Then, δ13C and δ15N were used as variables in a
quadratic discriminant function analysis (DFA) to examine if individuals could accurately be reclassified
18
into their predetermined size group. The DFA conducted an a posteriori test to determine the size class
in which each crab sample had the highest probability of membership. For all p values, α was set to 0.05.
RESULTS
Nutrient enrichment effects
Nutrient enrichment had little effect on %C, %N, %P, or C:N ratio of any organism sampled with
respect to fertilization treatment (Table 1). Large A. pisonii displayed an increased C:N ratio as a result of
P fertilization somewhat diminishing N concentrations relative to crabs sampled from Control trees
(ANOVA, p = 0.0456). Xanthid crab claw muscle showed diminished %P with N fertilization relative to
individuals sampled from control trees (ANOVA, p = 0.0398). No other organisms displayed
stoichiometric influences as a function of nutrient enrichment.
Carbon concentrations among organism types ranged from 20 – 50 % and were observed to be
as low as 8% for MPB (Table 2). Nitrogen concentrations varied most between primary producers and
consumers with %N ranges from 0.5 – 4% and 7 – 12%, respectively. Phosphorus concentrations ranged
from 0.05 – 0.70% with leaf material usually less P rich than animal tissues. Values for C:N varied the
most between grouped plant, lichen, and invertebrate samples with the latter having some variation
between species as well. Green leaf material and lichens displayed C:N ratios around 50 while values for
senesced leaves averaged 115. Other primary producers including algae and MPB showed C:N ratios
between 6 and 10 while all animal tissues ranged between 4 and 7.
Isotope signatures of the fringe
The 16 types of IRL flora and fauna sampled in this study included three crab species, two filter
feeders, one detritivorous snail, one arboreal arachnid, green and senescent R. mangle leaves, and two
varieties of R.mangle-associated lichens (Table 3). Based on known feeding strategies and spatial
19
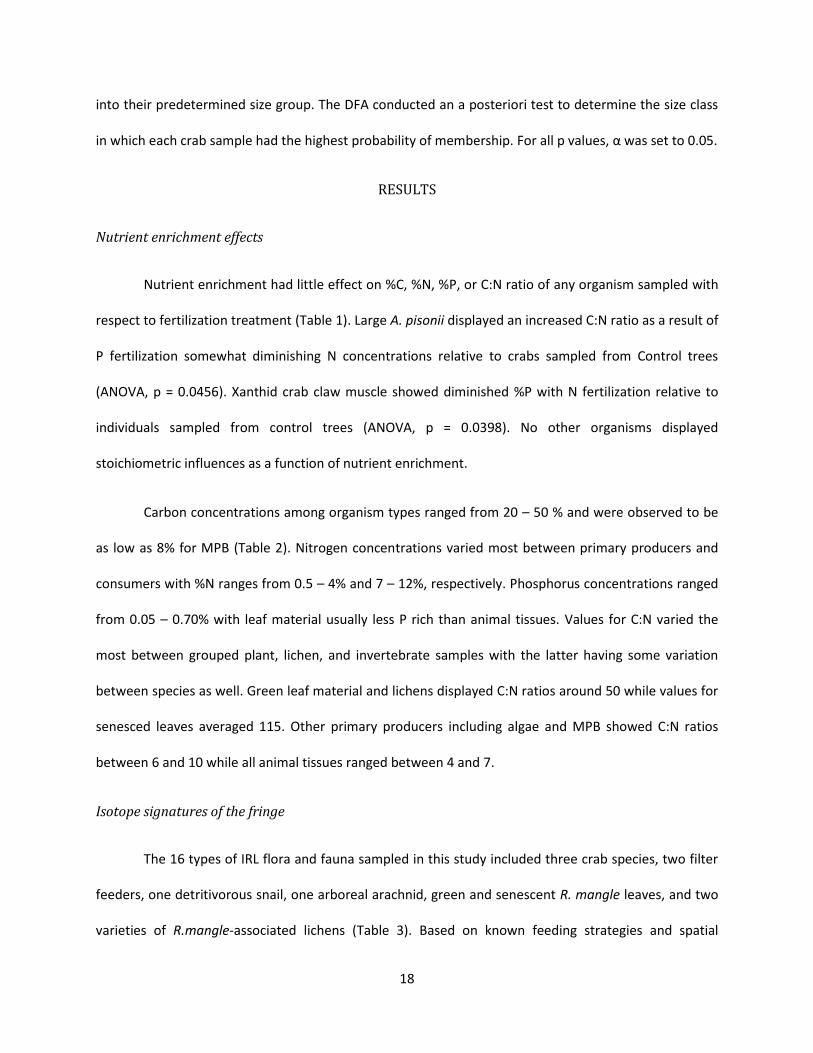
distribution within the fringe of the mangrove forest, consumers were expected to show approximately
average trophic enrichment of 1.0‰ δ13C and 3.4‰ δ15N values relative to leaf material (Figure 1; labels
indicated in Table 3). While both green and senescent leaves (labeled GL and SL, respectively) were
characterized by depleted δ13C values relative to all animals sampled, most organisms were much more
than 1.0‰ δ13C enriched. The only exceptions were whole Uca spp. and Xanthid crabs whose isotopic
signatures signify exceptional fractionation during synthesis (Uw and Xw, respectively). This lack of
stepwise trophic enrichment is likely due to multiple dietary sources of C and N other than R. mangle
leaves.
The only sample organisms with δ13C values indicative of an R. mangle diet were large and
medium A. pisonii (L and M, respectively). However, δ15N for large A. pisonii were depleted relative to
both green and senescent leaves, and medium A. pisonii had δ15N values nearly identical to senescent
leaves. These depleted δ15N values indicate the use of some other N source than mangrove leaves.
Crustose and foliose lichens (Cr and Fo, respectively) appear to be the only viable solution to this δ15N
depletion as they are the only members of the food web showing δ15N values lower than the large and
medium A. pisonii. The enrichment of large A. pisonii muscle tissue relative to whole organism samples
reflects differential fractionation during biosynthesis of various tissues.
Showing more intermediate δ13C and δ15N values, M. bidentatus (Mb) and small A. pisonii (S)
signify a dependence on R. mangle leaves for some of their nutrients and at least some supplemental
food sources that are more enriched in δ13C and/or δ15N such as MPB, POM, algae, or prop root
epiphytes (MPB, POM, Alg, and Epi, respectively). The other members of the food web appear to rely
heavily on some external sources of nutrition. Filter feeders (G. demissa, Gd, and B. eburneus, Be), Uca.
spp (Um), mud crabs (Xm), and spiders (Gc) exhibit enriched δ15N values generally compared to other A.
pisonii which may indicate similar trophic level status, but their intermediary δ13C values relative to
20
potential food sources (GL, SL, MPB, POM, Alg, Epi, and in some cases other animals) signifies multiple
carbon sources. Overall, these data indicate a community dominated by omnivorous benthic feeders
with the exception of large and medium sized A. pisonii who spend a significant portion of their time
foraging within the branches of the R. mangle trees and are probably feeding on leaves, lichens, and
some incidental animal prey items.
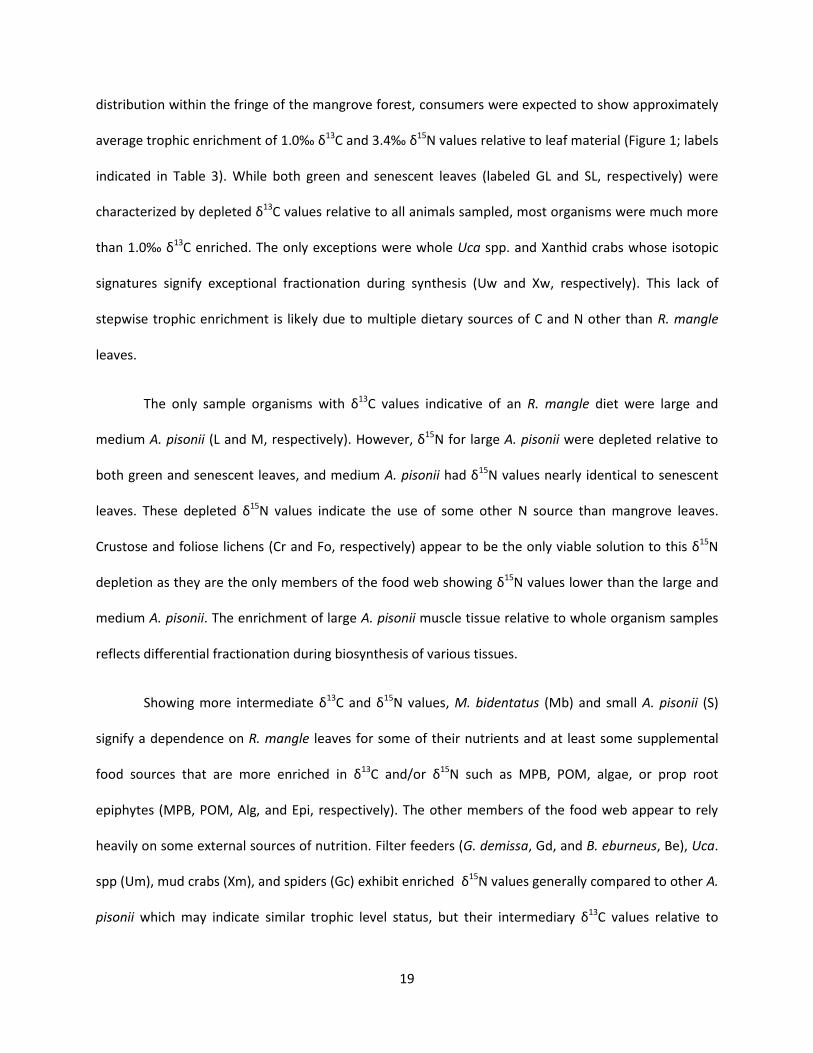
Ontogenetic shifts in A. pisonii
Isotopic signatures differ among small, medium, and large A. pisonii size classes (Figure 2;
MANOVA, p < 0.0005). For both δ13C and δ15N, small crabs exhibited higher mean values than medium
and large size classes, which did not differ significantly from one another (ANOVA, p = 0.0004 and p <
0.0001, respectively). To elucidate the differences between size classes, we attempted to reclassify
isotope data into their predefined size categories using a discriminant function analysis (Table 4). Large
and small crabs were appropriately reassigned to their correct size classes 89% and 85% of the time,
respectively. Most reclassification errors were due to medium crabs being incorrectly assigned to the
other two groups: 41% to large and 22% to small. Small crabs exhibited a wide range of δ13C values, but
their general isotopic space (indicated by a dashed oval) was confirmed to be independent of the larger
individuals (indicated by a solid oval; Figure 4). To further evaluate differences between size class diets,
medium A. pisonii were omitted due to the statistical similarities they shared with the other two groups.
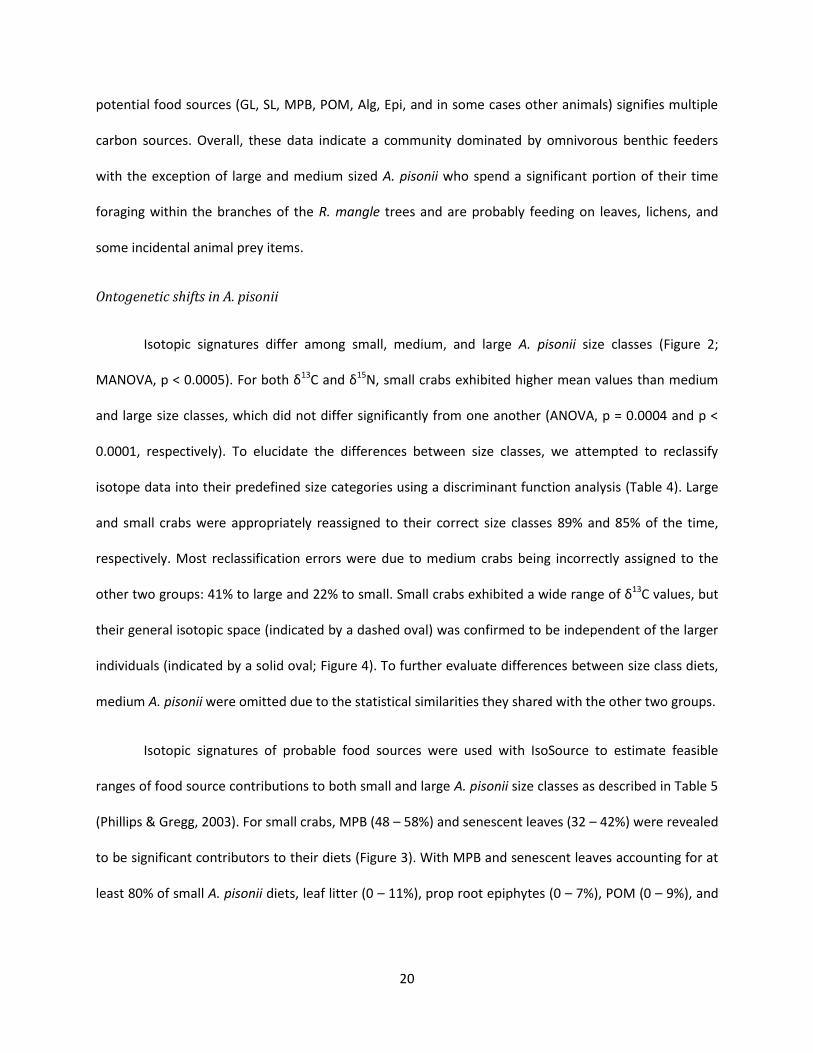
Isotopic signatures of probable food sources were used with IsoSource to estimate feasible
ranges of food source contributions to both small and large A. pisonii size classes as described in Table 5
(Phillips & Gregg, 2003). For small crabs, MPB (48 – 58%) and senescent leaves (32 – 42%) were revealed
to be significant contributors to their diets (Figure 3). With MPB and senescent leaves accounting for at
least 80% of small A. pisonii diets, leaf litter (0 – 11%), prop root epiphytes (0 – 7%), POM (0 – 9%), and

21
algae (0-13%) can only represent a maximum of 20% of small crab diets. The small A. pisonii diet displays
some distinct differences from that of the larger conspecifics.
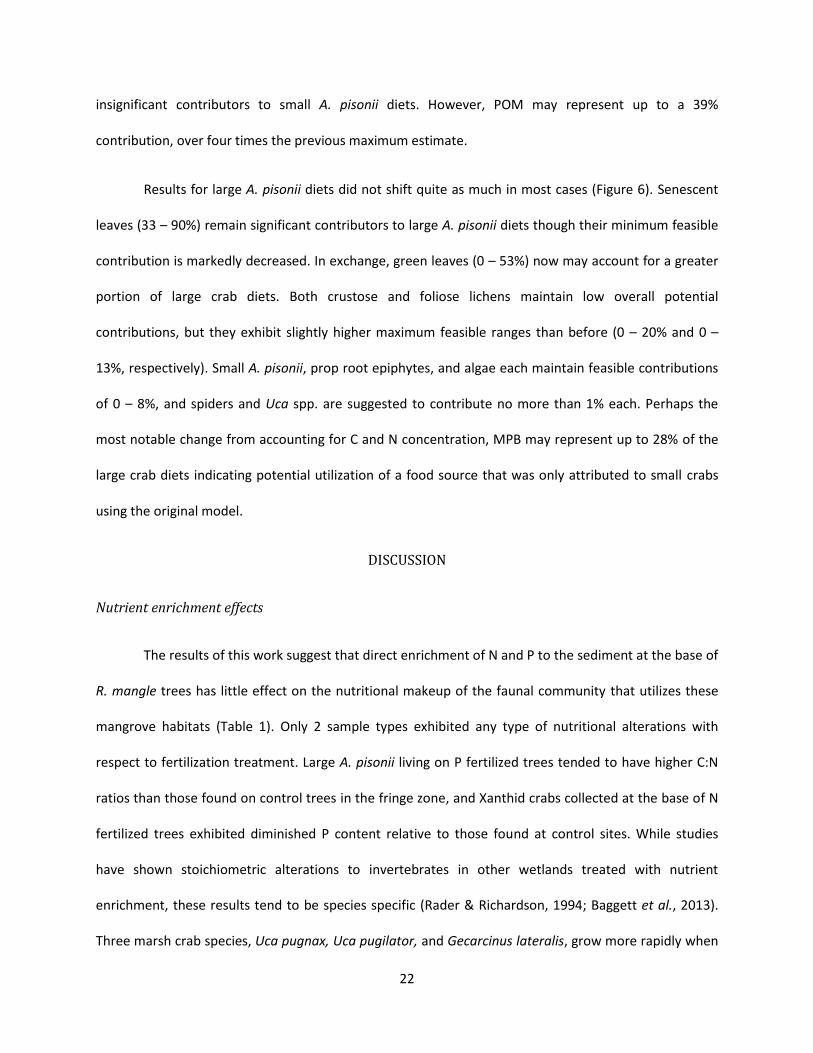
For large A. pisonii, senescent leaves account for 68 – 90% of their diets which is more than
twice the minimum contribution of senescent leaves to small crab diets while MPB (0 – 3%) are no
longer likely contributors to the diets of large crabs (Figure 4). It is evident that senescent leaves are
preferred to green leaves whose feasible contribution range only extends from 0 – 18%. Unlikely or
minor contributors to large crab diets include small A. pisonii, prop root epiphytes, spiders, Uca spp.,
and algae which each range from 0 to no more than 8% feasible contributions. Though leaf material
dominates the diet of large A. pisonii, neither leaves nor other potential sources described heretofore
can account for their δ15N depletion. Indicated by a dotted line, large A. pisonii fall outside of the mixing
polygon unless lichens are included. Thus, crustose and/or foliose lichens are required to satisfy the
requirements of mass balance and are likely contributors to the diets of large A. pisonii (0 – 18% and 0 –
10%, respectively).
Because the C and N concentrations of potential food sources may differ substantially, we
adapted our data to still work with IsoSource while accounting for C and N concentrations. While food
sources generally retained feasible contribution ranges similar to the original IsoSource model results,
this mass balance method produced ranges less precise in most cases but altogether different in some
(Table 6).
For small A. pisonii, MPB (0 – 73%) still potentially represent a significant contribution to their
diets (Figure 5), but this range is much more broad than the well constrained estimate described
previously. Similarly, senescent leaves (16 – 61%) exhibit a wider range of feasible contributions. Leaf
litter may contribute up to 17%, but algae (0 – 6%) and prop root epiphytes (0 – 4%) still remain
22
insignificant contributors to small A. pisonii diets. However, POM may represent up to a 39%
contribution, over four times the previous maximum estimate.
Results for large A. pisonii diets did not shift quite as much in most cases (Figure 6). Senescent
leaves (33 – 90%) remain significant contributors to large A. pisonii diets though their minimum feasible
contribution is markedly decreased. In exchange, green leaves (0 – 53%) now may account for a greater
portion of large crab diets. Both crustose and foliose lichens maintain low overall potential
contributions, but they exhibit slightly higher maximum feasible ranges than before (0 – 20% and 0 –
13%, respectively). Small A. pisonii, prop root epiphytes, and algae each maintain feasible contributions
of 0 – 8%, and spiders and Uca spp. are suggested to contribute no more than 1% each. Perhaps the
most notable change from accounting for C and N concentration, MPB may represent up to 28% of the
large crab diets indicating potential utilization of a food source that was only attributed to small crabs
using the original model.
DISCUSSION
Nutrient enrichment effects
The results of this work suggest that direct enrichment of N and P to the sediment at the base of
R. mangle trees has little effect on the nutritional makeup of the faunal community that utilizes these
mangrove habitats (Table 1). Only 2 sample types exhibited any type of nutritional alterations with
respect to fertilization treatment. Large A. pisonii living on P fertilized trees tended to have higher C:N
ratios than those found on control trees in the fringe zone, and Xanthid crabs collected at the base of N
fertilized trees exhibited diminished P content relative to those found at control sites. While studies
have shown stoichiometric alterations to invertebrates in other wetlands treated with nutrient
enrichment, these results tend to be species specific (Rader & Richardson, 1994; Baggett et al., 2013).
Three marsh crab species, Uca pugnax, Uca pugilator, and Gecarcinus lateralis, grow more rapidly when

23
offered food with higher N (Wolcott & Wolcott, 1984; Wolcott & O'Connor, 1992), and Spivak et al.
(2009) observed that fertilization effects on sea grass nutritional stoichiometry and production can be
effectively translated into grazer secondary production. In each of these studies, fertilization effects
transferred through primary producers into secondary production.
Because nutrient enrichment did not indicate altered leaf stoichiometry in our study, there
appears to be minimal fertilization effects through the food web. Neither green nor senescent R. mangle
leaves exhibited responses in %C, %N, %P, or C:N ratio with respect to fertilization treatment. This lack
of response conflicts with previous studies from the N-limited fringe zone at IRL which reported
significant increases in leaf %N, new growth, and productivity (Feller et al., 2003b). Mangrove
fertilization has repeatedly been observed to bring about changes in leaf stoichiometry, photosynthetic
productivity, resorption efficiencies, and growth (Feller, 1995; Feller et al., 2003a; Feller et al., 2009b).
Due to the history of documented nutrient enrichment effects at IRL, it is possible that there were
confounding factors influencing nutrient availability to the trees around the time of sample collection. In
September 2004, Hurricanes Frances and Jeanne delivered tremendous amounts of nutrients to study
site in IRL abating N-limiting conditions for several years (I.C. Feller, personal communication, May 6,
2013). Home ranges wider than the reach of fertilization effects may have also played a role in
preventing nutrient enrichment effects to cascade throughout the system. Warner (1970) measured A.
pisonii home ranges of about 6 m2 which exceeds the spatial limits of individual tree fertilization effects.
Additionally, motile individuals such as crabs and snails are likely to feed on sources derived from
outside the fertilization’s area of influence (Jordan & Valiela, 1982). Rearing experiments would be ideal
for quantifying the bottom-up effects of N and P enrichment on herbivorous and omnivorous members
of the mangrove food web allowing for restriction of source contributions.
24
Isotope signatures of the fringe
Based on their δ13C and δ15N values, it is apparent that members of the mangrove fringe
community at IRL derive their C and N from a mixture of sources (Figure 1). Large and medium sized A.
pisonii appear to rely heavily on mangrove C; however, they may obtain N from additional sources,
including from lichens for the larger individuals because both types of lichen sampled displayed
depleted δ15N values. Small A. pisonii and M. bidentatus display isotopic signatures indicative of leaf
material and MPB composing a significant portion of their diets. Balanus eburneus and G. demissa are
filter feeders. They derive nutrition from POM and finely processed leaf material, but their enriched δ15N
values indicate reliance upon some externally derived sources. In a more extreme case, Uca spp. and
Xanthids crab bodies showed extremely depleted δ13C and enriched δ15N values when analyzed whole.
These values appear to be erroneous possibly due extreme fractionation during chitin formation.
Yokoyama et al. (2005) report that high values of fractionation may occur in some bivalves and
crustaceans, which makes the consideration of muscle tissue more appropriate for these organisms. The
spider G. concriformis may be an opportunistically predated food source for Large A. pisonii but is
unlikely to be feeding on any of the organisms sampled herein due to spatial separation even though
they display similar isotopic signatures. More likely, these spiders are another example of an organism
deriving it’s nutrition from external sources.
Ontogenetic shifts in A. pisonii
Our isotopic data confirmed the presence of niche shifts between A. pisonii size classes
reflecting changes in diet as a probable result of spatial discrimination and morphological changes
between juvenile and adult life history stages (Figure 2). Small A. pisonii were more enriched in both
δ15N and δ13C values relative to large crabs. Medium individuals displayed a wide range of isotopic
signatures that overlapped with both large and small crabs about as often as they appeared unique,

25
consistent with a transitional phase between two distinct diets (Table 4). Isotopic depletion with size is a
rather unusual finding as most organisms tend to exhibit increased δ15N and δ13C values as they grow,
indicating a move toward a higher trophic level (Minagawa & Wada, 1984; Dunton et al., 2012).
However, we have documented a shift in the primary consumption habits of A. pisonii between small
and large conspecifics which can explain this observed isotopic depletion as an artifact of their transition
into the canopy as they grow into adults.
As they mature, A. pisonii become more arboreal and can freely climb into the canopy where
they feed on leaves and other prey items opportunistically (Warner, 1970; Beever et al., 1979; McKeon
& Feller, 2004). Our data require that the large crabs are feeding on a δ15N depleted source apart from
those traditionally described in their diets owing to the fact that their own isotopic signature falls below
any of those documented food sources (Table 5). The only organisms present with δ15N values more
depleted than the large A. pisonii are lichens. Unusually negative δ15N values in lichens may be the result
of foliar uptake of atmospheric NH3 for subsequent fixation as a response to nutrient limitation (Tozer et
al., 2005; Fogel et al., 2008). In an N-limited forest such as this one, feeding on N-fixing lichen symbionts
seems to be a logical strategy. Due to their extreme depletion relative to the crabs, lichens need only
contribute a small portion of their diets to result in a noticeable decrease in δ15N. Mangrove tree crabs
in Africa, Sesarma leptosoma, have been documented feeding on lichens growing in the canopy of
Rhizophora mucronata (Dahdouh-Guebas et al., 1999), and the land crab, Gecarcinus planatus, is known
to feed on lichens as well (Ortega-Rubio et al., 1997).
Because juvenile A. pisonii are found on prop roots and sediment, they do not have access to
the δ15N depleted lichens. Their isotopic values are more consistent with feeding on leaf detritus and
MPB (Figure 3), a diet previously suggested in the literature (Feller & Chamberlain, 2007; Giarrizzo et al.,
2011). In addition to MPB, senescent leaves, particulate organic matter, and leaf litter appear to have
26
potential as significant contributors to small crab diets (Figure 5). Though large individuals may still
utilize MPB as a C source (Figure 6), isotopic values clearly exhibit a tendency away from MPB with size
(Figure 4). Again, the repercussions of strict vertical zonation between size classes are reflected as an
unusual isotopic characteristic with increasing size. Reliance on the δ13C rich MPB, relative to mangrove
leaves, results in small A. pisonii exhibiting higher δ13C values than their larger counterparts.
Erickson et al. (2003) determined that mangrove leaves constitute 84% of A. pisonii diets, and
Feller et al. (In Press) further constrained these observations citing preferential folivory of older leaves in
the canopy. Our data agree, indicating that large crabs display a strong tendency toward senescent
rather than green leaves (Figures 4 & 6), and small A. pisonii tend to prefer freshly fallen leaves over the
more aged leaf litter (Figures 3 & 5). Senescent leaves have a markedly higher C:N ratio than leaf litter or
green leaves (Table 2); however, they contain far fewer phenolic compounds and condensed tannins
than green leaves making older leaves more palatable for large crabs (Lin et al., 2007). While nitrogen
content and caloric value increase with decomposition, so do protein-bound and fiber-bound condensed
tannins (Lin et al., 2007). These differences in freshly fallen leaves and decomposing leaf litter may
explain small crab preferences for freshly senesced leaves.
Opportunistic feeding on smaller conspecifics, other crabs, and insects is well documented in
large A. pisonii (Warner, 1967; Beever et al., 1979; McKeon & Feller, 2004; Feller et al., In Press). Their
robust bodies and freedom to roam between canopy and understory (Warner, 1967, 1969) gives large
individuals ample opportunity to forage upon a wide variety of prey items. However, the very small
contribution potential of spiders, Uca spp, and smaller conspecifics indicates that predatory encounters
are uncommon and probably not actively pursued. If such encounters are more frequent than the low
feasible range of contribution of these other invertebrates suggests, it is probable that these killing
27
encounters are motivated by an assertion of dominance rather than for nutritive purposes (Warner,
1970).
Evaluation of IsoSource mixing model results
Adaptation of isotopic data to incorporate C and N concentrations according to equations 2 and
3 produced similar results to those obtained using the intended δ13C and δ15N values (Table 6). In most
cases, feasible ranges of contribution from source material were less precise using the concentration
weighted approach, but some sources that were considered insignificant by the traditional model were
brought to light as potentially constituting large portions of the target species’ diet. Utilizing both
approaches provides a useful proxy for accuracy as well as additional data to help constrain potentially
ambiguous diets. Ideally, both approaches would be combined with field observations to validate
inclusion of each source material. By including sources which have not been expressly identified as prey
species (arboreal spiders for example), IsoSource assigns importance to these species when they may
not actually contribute at all (Fry, 2013). Additionally, better understanding prey item diets would allow
more confident identification of ultimate organic matter sources, and laboratory rearing experiments to
determine isotopic fractionation values would provide a more accurate depiction of isotopic
relationships with respect to trophic enrichment.
CONCLUSION
Our data clearly identify a shift in A. pisonii feeding habits as they mature, which we suggest
indicates a modification in the juvenile diet of MPB and freshly fallen leaves to an adult diet dominated
by senescent and to a lesser extent, green, leaves, as well as lichens. Because of strong spatial
restrictions preventing small A. pisonii from entering the canopy of mangrove trees, larger individuals
have access to N-fixing, δ15N depleted lichens which gives the large crabs an unusually low δ15N value
relative to smaller individuals. Similarly, heavy reliance on leaf material by large crabs results in depleted

28
δ13C values compared to the small crabs who utilize the δ13C rich MPB. Though bottom-up nutrient
influences were not identified as playing a significant role in this food web, it is probable that controlled
studies would result in direct links to growth rate and nutrient assimilation in some of the primary
herbivores sampled herein. In order to better elucidate the part that each food source plays, herbivory
of lichens needs to be documented from in situ studies, and thorough observations of foraging
strategies for all size classes should be conducted. The elimination of insignificant and addition of
primary food sources based on observational data would greatly strengthen the reliability of the
IsoSource models which are most useful when considered using both the traditional and mass balance
methods.
WORKS CITED
Alberti, J., Cebrian, J., Casariego, A. M., Canepuccia, A., Escapa, M., & Iribarne, O. (2011). Effects of
nutrient enrichment and crab herbivory on a SW Atlantic salt marsh productivity. [Article].
Journal of Experimental Marine Biology and Ecology, 405, 99-104. doi:
10.1016/j.jembe.2011.05.023
Baggett, L., Heck, K., Frankovich, T., Armitage, A., & Fourqurean, J. (2013). Stoichiometry, growth, and
fecundity responses to nutrient enrichment by invertebrate grazers in sub-tropical turtle grass (
Thalassia testudinum) meadows. [Article]. Marine Biology, 160(1), 169-180. doi:
10.1007/s00227-012-2075-6
Beever, J. W., Simberloff, D., & King, L. L. (1979). Herbivory and Predation by the Mangrove Tree Crab
Aratus pisonii. Oecologia, 43(3), 317-328. doi: 10.2307/4215967
Bouillon, S., Koedam, N., Raman, A., & Dehairs, F. (2002). Primary producers sustaining macro-
invertebrate communities in intertidal mangrove forests. Oecologia, 130(3), 441-448.

29
Cannicci, S., Burrows, D., Fratini, S., Smith Iii, T. J., Offenberg, J., & Dahdouh-Guebas, F. (2008). Faunal
impact on vegetation structure and ecosystem function in mangrove forests: A review. Aquatic
Botany, 89(2), 186-200. doi: http://dx.doi.org/10.1016/j.aquabot.2008.01.009
Christensen, J. T., Sauriau, P. G., Richard, P., & Jensen, P. D. (2001). Diet in mangrove snails: Preliminary
data on gut contents and stable isotope analysis. [Article]. Journal of Shellfish Research, 20(1),
423-426.
Clesceri, L. S., Eaton, A. D., Greenberg, A. E., Association, A. P. H., Association, A. W. W., & Federation,
W. E. (1998). Standard Methods for the Examination of Water and Wastewater: American Public
Health Association.
Dahdouh-Guebas, F., Giuggioli, M., Oluoch, A., Vannini, M., & Cannicci, S. (1999). Feeding Habits of Non-
Ocypodid Crabs from Two Mangrove Forests in Kenya. Bulletin of Marine Science, 64(2), 291-
297.
DeNiro, M. J., & Epstein, S. (1981). Influence of diet on the distribution of nitrogen isotopes in animals.
Geochimica et Cosmochimica Acta, 45(3), 341-351.
Díaz, H., & Conde, J. E. (1988). On the food sources for the mangrove tree crab Aratus pisonii (Brachyura:
Grapsidae). Biotropica, 20(4), 348-350. doi: 10.2307/2388331
Dittel, A. I., Epifanio, C. E., & Fogel, M. L. (1999). A Food Web Analysis of the Juvenile Blue Crab,
Callinectes sapidus, Using Stable Isotopes in Whole Animals and Individual Amino Acids.
[research-article]. Oecologia(3), 416. doi: 10.2307/4222403
Dunton, K., Schonberg, S., & Cooper, L. (2012). Food Web Structure of the Alaskan Nearshore Shelf and
Estuarine Lagoons of the Beaufort Sea. [Article]. Estuaries & Coasts, 35(2), 416-435. doi:
10.1007/s12237-012-9475-1

30
Erickson, A. A., Saltis, M., Bell, S. S., & Dawes, C. J. (2003). Herbivore feeding preferences as measured by
leaf damage and stomatal ingestion: a mangrove crab example. Journal of Experimental Marine
Biology and Ecology, 289(1), 123-138. doi: http://dx.doi.org/10.1016/S0022-0981(03)00039-X
Farnsworth, E. J., & Ellison, A. M. (1991). Patterns of Herbivory in Belizean Mangrove Swamps.
Biotropica, 23(4), 555-567. doi: 10.2307/2388393
Feller, I. C. (1995). Effects of nutrient enrichment on growth and herbivory of dwarf red mangrove
(Rhizophora mangle). Ecological Monographs, 65(4), 477-505.
Feller, I. C. (2002). The role of herbivory by wood‐boring insects in mangrove ecosystems in Belize.
Oikos, 97(2), 167-176.
Feller, I. C., & Chamberlain, A. (2007). Herbivore Responses to Nutrient Enrichment and Landscape
Heterogeneity in a Mangrove Ecosystem. Oecologia, 153(3), 607-616. doi: 10.2307/40213010
Feller, I. C., Chamberlain, A. H., Piou, C., Chapman, S., & Lovelock, C. E. (In Press). Latitudinal patterns of
herbivory in mangrove forests: Consequences of nutrient over-enrichment. Ecosystems.
Feller, I. C., Lovelock, C. E., & Piou, C. (2009a, 2010). Growth and nutrient conservation in Rhizophora
mangle in resonse to fertilization along latitudinal and tidal gradients. Paper presented at the
Smithsonian Marine Science Symposium, Washington, DC.
Feller, I. C., Lovelock, C. E., & Piou, C. (2009b). Growth and nutrient conservation in Rhizophora mangle
in response to fertilization along latitudinal and tidal gradients. Smithsonian Contributions to the
Marine Sciences(38).
Feller, I. C., & Mathis, W. N. (1997). Primary Herbivory by Wood‐Boring Insects along an Architectural
Gradient of Rhizophora mangle. Biotropica, 29(4), 440-451.
Feller, I. C., McKee, K. L., Whigham, D. F., & O'Neill, J. P. (2003a). Nitrogen vs. phosphorus limitation
across an ecotonal gradient in a mangrove forest. [Article]. Biogeochemistry, 62(2), 145-175.

31
Feller, I. C., Whigham, D. F., McKee, K. L., & Lovelock, C. E. (2003b). Nitrogen limitation of growth and
nutrient dynamics in a disturbed mangrove forest, Indian River Lagoon, Florida. Oecologia,
134(3), 405-414. doi: 10.2307/4223520
Feller, I. C., Whigham, D. F., O'Neill, J. P., & McKee, K. L. (1999). Effects of nutrient enrichment on within-
stand cycling in a mangrove forest. Ecology, 80(7), 2193-2205.
Fogel, M. L., Wooller, M. J., Cheeseman, J., Smallwood, B. J., Roberts, Q., Romero, I., & Meyers, M. J.
(2008). Unusually negative nitrogen isotopic compositions (δ15N) of mangroves and lichens in
an oligotrophic, microbially-influenced ecosystem. Biogeosciences, 5(6), 1693.
France, R. (1998). Estimating the Assimilation of Mangrove Detritus by Fiddler Crabs in Laguna Joyuda,
Puerto Rico, Using Dual Stable Isotopes. [research-article]. Journal of Tropical Ecology(4), 413.
doi: 10.2307/2559875
Fry, B. (2006). Stable Isotope Ecology: Springer-Verlag New York.
Fry, B. (2013). Alternative approaches for solving underdetermined isotope mixing problems. Marine
Ecology Progress Series, 472, 1-13. doi: 10.3354/meps10168
Giarrizzo, T., Schwamborn, R., & Saint-Paul, U. (2011). Utilization of carbon sources in a northern
Brazilian mangrove ecosystem. Estuarine, Coastal and Shelf Science, 95(4), 447-457. doi:
10.1016/j.ecss.2011.10.018
Giri, C., Ochieng, E., Tieszen, L., Zhu, Z., Singh, A., Loveland, T., . . . Duke, N. (2011). Status and
distribution of mangrove forests of the world using earth observation satellite data. Global
Ecology and Biogeography, 20(1), 154-159.
Golley, F. B. (1975). Mineral cycling in a tropical moist forest ecosystem / Frank B. Golley ... [et al.]. ; with
contributions from James Duke: Athens : University of Georgia Press, c1975.
Hartnoll, R. G. (1965). Notes on the marine grapsid crabs of Jamaica. Proceedings of the Linnean Society
of London, 176(2), 113-147. doi: 10.1111/j.1095-8312.1965.tb00940.x
32
Hogarth, P. (1999). The Biology of Mangroves, 228 pp. New York.
. Indian River Lagoon: An Introduction to a Natural Treasure. (2007). In I. R. L. N. E. Program (Ed.), St.
Johns River Water Management District. Palm Bay, FL.
JMP. (2013) (Version Pro 9). Cary,NC: SAS Institute Inc.
Jordan, T. E., & Valiela, I. (1982). A Nitrogen Budget of the Ribbed Mussel, Geukensia demissa, and Its
Significance in Nitrogen Flow in a New England Salt Marsh. Limnology and Oceanography, 27(1),
75-90. doi: 10.2307/2836087
Kristensen, E., Holmer, M., Banta, G. T., Jensen, M. H., & Hansen, K. (1995). Carbon, nitrogen and sulfur
cycling in sediments of the Ao Nam Bor mangrove forest, Phuket, Thailand: A review. Phuket
Marine Biological Center Research Bulletin, 60.
Layman, C. A., Araujo, M. S., Boucek, R., Hammerschlag-Peyer, C. M., Harrison, E., Jud, Z. R., . . . Bearhop,
S. (2011). Applying stable isotopes to examine food-web structure: an overview of analytical
tools. Biological Reviews Of The Cambridge Philosophical Society, 87(3), 545-562. doi:
10.1111/j.1469-185X.2011.00208.x
Lin, Y., Liu, J., Xiang, P., Lin, P., Ding, Z., & Silveira Lobo Sternberg, L. (2007). Tannins and nitrogen
dynamics in mangrove leaves at different age and decay stages (Jiulong River Estuary, China).
[Article]. Hydrobiologia, 583(1), 285-295. doi: 10.1007/s10750-006-0568-3
Lovelock, C. E., & Feller, I. C. (2003). Photosynthetic performance and resource utilization of two
mangrove species coexisting in a hypersaline scrub forest. Oecologia, 134(4), 455-462. doi:
10.1007/s00442-002-1118-y
Lugo, A. E. (1997). Old‐Growth Mangrove Forests in the United States. Conservation Biology, 11(1), 11-
20.
33
Martínez del Rio, C., Wolf, N., Carleton, S. A., & Gannes, L. Z. (2009). Isotopic ecology ten years after a
call for more laboratory experiments. Biological Reviews, 84(1), 91-111. doi: 10.1111/j.1469-
185X.2008.00064.x
McKeon, C. S., & Feller, I. C. (2004). Supratidal fauna of Twin Cays, Belize. Atoll Research Bulletin, 526, 1-
22.
Miller, R. O. (1998). High-temperature oxidation: Dry ashing. In Y. P. Kalra (Ed.), Handbook of Reference
Methods for Plant Analysis (pp. 53-56). Boca Raton, Florida: CRC Press.
Minagawa, M., & Wada, E. (1984). Stepwise enrichment of 15N along food chains: Further evidence and
the relation between δ15N and animal age. Geochimica et Cosmochimica Acta, 48(5), 1135-
1140. doi: http://dx.doi.org/10.1016/0016-7037(84)90204-7
Nagelkerken, I., Blaber, S. J. M., Bouillon, S., Green, P., Haywood, M., Kirton, L. G., . . . Somerfield, P. J.
(2008). The habitat function of mangroves for terrestrial and marine fauna: A review. Aquatic
Botany, 89(2), 155-185. doi: http://dx.doi.org/10.1016/j.aquabot.2007.12.007
Naylor, R. L., Goldburg, R. J., Primavera, J. H., Kautsky, N., Beveridge, M. C., Clay, J., . . . Troell, M. (2000).
Effect of aquaculture on world fish supplies. Nature, 405(6790), 1017-1024.
Newell, R. I. E., Marshall, N., Sasekumar, A., & Chong, V. C. (1995). Relative importance of benthic
microalgae, phytoplankton, and mangroves as sources of nutrition for penaeid prawns and
other coastal invertebrates from Malaysia. Marine Biology, 123(3), 595-606.
Nguyen, T. T., Hideki, H., Atsushi, S., Tran Dang, Q., Mai Trong, N., & Koji, O. (2012). Food sources of
macro-invertebrates in an important mangrove ecosystem of Vietnam determined by dual
stable isotope signatures. [Article]. Journal of Sea Research, 72, 14-21. doi:
10.1016/j.seares.2012.05.006
Odum, W. E. (1971). Pathways of energy flow in a South Florida estuary. Miami, Fla.: University of Miami
Sea Grant Program.
34
Odum, W. E., & Heald, E. J. (1972). Trophic Analyses of an Estuarine Mangrove Community. Bulletin of
Marine Science, 22(3), 671-738.
Ortega-Rubio, A., Jímenez, M. L., Llinas, J., & Arnaud, G. (1997). Some Ecological Aspects of the Land
Crab, Gecarcinus planatus Stimpson, at Socorro Island, Colima, Mexico. Journal of the Arizona-
Nevada Academy of Science, 17-22.
Peterson, B. J., & Fry, B. (1987). Stable isotopes in ecosystem studies. Annual review of ecology and
systematics, 18, 293-320.
Phillips, D. L., & Gregg, J. W. (2003). Source partitioning using stable isotopes: coping with too many
sources. [Article]. Oecologia, 136(2), 261-269. doi: 10.1007/s00442-003-1218-3
Phillips, D. L., & Koch, P. L. (2002). Incorporating concentration dependence in stable isotope mixing
models. [Article]. Oecologia, 130(1), 114-125. doi: 10.1007/s004420100786
Pool, D. J., Snedaker, S. C., & Lugo, A. E. (1977). Structure of Mangrove Forests in Florida, Puerto Rico,
México, and Costa Rica. [research-article]. Biotropica(3), 195. doi: 10.2307/2387881
Post, D. M. (2002). Using Stable Isotopes to Estimate Trophic Position: Models, Methods, and
Assumptions. Ecology, 83(3), 703-718. doi: 10.2307/3071875
Rader, R. B., & Richardson, C. J. (1994). Response of macroinvertebrates and small fish to nutrient
enrichment in the northern Everglades. Wetlands, 14(2), 134-146.
Rathbun, M. J. (1917). The Grapsoid Crabs of America: Kessinger Publishing.
Robertson, A., & Daniel, P. (1989). The influence of crabs on litter processing in high intertidal mangrove
forests in tropical Australia. Oecologia, 78(2), 191-198.
Schwamborn, R., Ekau, W., Silva, A. P., Silva, T. A., & Saint-Paul, U. (1999). The contribution of estuarine
decapod larvae to marine zooplankton communities in North-East Brazil. ARCHIVE OF FISHERY
AND MARINE RESEARCH, 47, 167-182.
35
Schwamborn, R., Ekau, W., Voss, M., & Saint-Paul, U. (2002). How important are mangroves as a carbon
source for decapod crustacean larvae in a tropical estuary? Marine Ecology Progress Series, 229,
195-205. doi: 10.3354/meps229195
Spivak, A. C., Canuel, E. A., Duffy, J. E., & Richardson, J. P. (2009). Nutrient enrichment and food web
composition affect ecosystem metabolism in an experimental seagrass habitat. PloS one, 4(10),
e7473.
Team, R. C. (2013). R: A language and environment for statistical computing (Version 2.15.3). Vienna,
Austria: R Foundation for Statistical Computing. Retrieved from http://www.R-project.org
Tozer, W. C., Hackell, D., Miers, D. B., & Silvester, W. B. (2005). Extreme isotopic depletion of nitrogen in
New Zealand lithophytes and epiphytes; the result of diffusive uptake of atmospheric ammonia?
Oecologia, 144(4), 628-635.
Vaslet, A., Phillips, D. L., France, C., Feller, I. C., & Baldwin, C. C. (2012). The relative importance of
mangroves and seagrass beds as feeding areas for resident and transient fishes among different
mangrove habitats in Florida and Belize: evidence from dietary and stable-isotope analyses.
Journal of Experimental Marine Biology and Ecology, 434/435, 81-93.
Warner, G. F. (1967). The life history of the mangrove tree crab, Aratus pisoni. Journal of Zoology,
153(3), 321-335. doi: 10.1111/j.1469-7998.1967.tb04066.x
Warner, G. F. (1969). The Occurrence and Distribution of Crabs in a Jamaican Mangrove Swamp. Journal
of Animal Ecology, 38(2), 379-389. doi: 10.2307/2777
Warner, G. F. (1970). Behaviour of Two Species of Grapsid Crab during Intraspecific Encounters.
[research-article]. Behaviour(1/2), 9. doi: 10.2307/4533317
Werry, J., & Lee, S. Y. (2005). Grapsid crabs mediate link between mangrove litter production and
estuarine planktonic food chains. Marine Ecology Progress Series, 293, 165-176. doi:
10.3354/meps293165
36
Wolcott, D. L., & O'Connor, N. J. (1992). Herbivory in Crabs: Adaptations and Ecological Considerations.
American Zoologist, 32(3), 370-381. doi: 10.2307/3883615
Wolcott, D. L., & Wolcott, T. G. (1984). Food Quality and Cannibalism in the Red Land Crab, Gecarcinus
lateralis. [research-article]. Physiological Zoology(3), 318. doi: 10.2307/30163720
Yokoyama, H., Tamaki, A., Harada, K., Shimoda, K., Koyama, K., & Ishihi, Y. (2005). Variability of diet-
tissue isotopic fractionation in estuarine macrobenthos. Marine Ecology Progress Series, 296,
115-128.
Yuangen, Y., Zhenli, H., Yanbo, W., Jinghua, F., Zhanbei, L., & Peter, J. S. (2012). Dissolved organic matter
in relation to nutrients (N and P) and heavy metals in surface runoff water as affected by
temporal variation and land uses – A case study from Indian River Area, south Florida, USA.
[Article]. Agricultural Water Management. doi: 10.1016/j.agwat.2012.12.001
37
Table 1 Fertilization treatment effects among sample types on C, N, and P (% by mass) and C:N ratio (mean ± SD). Values significantly different from one another are indicated by an asterisk (ANOVA; df = 2, p < 0.05). n = number of samples (%C , %N, & C:N share common n values). --- = no samples available.
Sample Type Treatment n %C %N C:N n %P
Mangrove tree crabs
Aratus pisonii Control 9 50.3 ± 1.4 8.7 ± 0.7 6.8 ± 0.6* 7 0.2 ± 0.0 Large (> 18 mm) +N 9 50.7 ± 2.0 8.5 ± 0.4 7.0 ± 0.5 8 0.2 ± 0.0
+P 9 50.7 ± 1.8 8.0 ± 0.8 7.5 ± 0.7* 8 0.2 ± 0.1
Medium (9 - 12 mm)
Control 9 47.3 ± 1.9 8.2 ± 0.6 6.7 ± 0.4 9 0.3 ± 0.1
+N 9 47.6 ± 3.0 8.5 ± 0.7 6.6 ± 0.6 9 0.2 ± 0.0
+P 9 43.7 ± 5.5 7.6 ± 1.0 6.7 ± 0.5 8 0.3 ± 0.1
Small (< 9 mm)
Control 9 43.1 ± 5.4 8.4 ± 0.6 6.0 ± 0.7 9 0.3 ± 0.1
+N 9 44.6 ± 2.3 9.0 ± 0.6 5.8 ± 0.6 9 0.3 ± 0.1
+P 8 40.4 ± 5.6 8.1 ± 0.8 5.8 ± 0.5 9 0.3 ± 0.1
Claw muscle
Control 6 39.1 ± 1.8 10.1 ± 1.1 4.5 ± 0.4 6 0.7 ± 0.3
+N 8 35.2 ± 4.6 9.4 ± 1.5 4.4 ± 0.4 8 0.8 ± 0.5
+P 9 37.7 ± 2.8 10.0 ± 1.1 4.4 ± 0.3 9 0.6 ± 0.2
Red mangrove tree
Rhizophora mangle Control 9 49.6 ± 8.9 1.1 ± 0.1 51.6 ± 10.8 9 0.1 ± 0.0 Green Leaves +N 6 48.5 ± 8.7 1.2 ± 0.2 49.0 ± 14.5 6 0.1 ± 0.0
+P 9 45.3 ± 8.0 1.1 ± 0.1 51.0 ± 12.3 9 0.1 ± 0.0
Senescent Leaves
Control 9 42.4 ± 2.7 0.4 ± 0.1 115.3 ± 24.8 9 0.05 ± 0.01
+N 9 43.4 ± 3.5 0.5 ± 0.1 100.9 ± 14.2 9 0.04 ± 0.02
+P 9 44.5 ± 3.7 0.4 ± 0.1 127.7 ± 15.4 9 0.05 ± 0.02
Lichen (Unidentified)
Crustose variety
Control 3 47.0 ± 2.3 1.1 ± 0.1 48.2 ± 4.7 3 0.1 ± 0.0
+N 3 47.3 ± 1.2 1.2 ± 0.1 46.9 ± 4.2 3 0.1 ± 0.0
+P 0 --- --- --- 0 ---
Foliose variety
Control 2 43.5 ± 0.5 1.3 ± 0.0 40.6 ± 0.8 2 0.1 ± 0.0
+N 6 43.8 ± 1.2 1.1 ± 0.1 47.5 ± 4.3 6 0.1 ± 0.0
+P 6 43.9 ± 1.1 1.1 ± 0.1 47.2 ± 5.9 6 0.1 ± 0.0
38
Table 1 continued
Sample Type Treatment n %C %N n %P C:N
Other crab species
Uca spp. Control 9 47.6 ± 2.3 8.4 ± 0.7 9 0.1 ± 0.0 6.6 ± 0.7 Fiddler crab bodies +N 9 47.9 ± 2.0 8.3 ± 0.5 9 0.1 ± 0.0 6.7 ± 0.4
+P 9 49.7 ± 1.6 8.8 ± 0.6 9 0.1 ± 0.0 6.6 ± 0.6
Male claw muscle
Control 9 39.3 ± 2.9 11.8 ± 1.2 9 0.6 ± 0.1 3.9 ± 0.2
+N 9 37.3 ± 4.6 10.7 ± 1.9 9 0.8 ± 0.2 4.1 ± 0.3
+P 7 39.0 ± 3.6 11.7 ± 1.5 7 0.5 ± 0.2 3.9 ± 0.2
Xanthidae Control 2 46.7 ± 12.2 7.6 ± 0.1 2 0.5 ± 0.1 7.2 ± 2.0 Mud crab bodies +N 5 49.0 ± 5.5 8.3 ± 1.0 5 0.7 ± 0.4 6.9 ± 0.6
+P 4 50.5 ± 3.3 8.9 ± 1.1 4 0.5 ± 0.4 6.7 ± 1.2
Mud crab claw muscle
Control 2 41.8 ± 2.4 11.5 ± 2.2 2 0.13 ± 0.0* 4.3 ± 0.6
+N 4 34.7 ± 6.8 9.5 ± 2.9 4 0.08 ± 0.0* 4.4 ± 0.6
+P 3 40.9 ± 2.9 12.2 ± 0.6 3 0.09 ± 0.0 3.9 ± 0.1
Other invertebrates
Spiders Control 9 49.2 ± 1.2 12.0 ± 0.5 9 0.6 ± 0.1 4.8 ± 0.3 Gasteracantha
cancriformis +N 8 49.0 ± 1.4 11.8 ± 1.0 9 0.8 ± 0.1 4.9 ± 0.6
+P 6 48.7 ± 1.6 12.0 ± 0.5 6 0.7 ± 0.1 4.8 ± 0.3
Coffee bean snail Control 9 37.9 ± 3.1 6.9 ± 0.8 9 0.6 ± 0.1 6.5 ± 0.6 Melampus bidentatus +N 8 38.4 ± 4.0 7.0 ± 1.0 9 0.6 ± 0.1 6.5 ± 0.5
+P 7 38.3 ± 2.3 7.1 ± 0.8 8 0.6 ± 0.1 6.3 ± 0.4
Ivory Barnacle Control 5 39.7 ± 1.2 12.2 ± 0.5 6 0.3 ± 0.1 3.8 ± 0.1 Balanus eburneus +N 7 41.4 ± 1.7 12.8 ± 1.0 7 0.3 ± 0.1 3.8 ± 0.2
+P 7 41.5 ± 0.6 12.8 ± 0.6 7 0.3 ± 0.0 3.8 ± 0.1
Atlantic ribbed mussel Control 3 35.4 ± 5.9 8.8 ± 2.3 1 0.3 4.8 ± 0.6 Geukensia demissa muscle +N 2 35.4 ± 0.4 9.2 ± 0.8 0 --- 4.5 ± 0.3
+P 3 36.8 ± 1.9 9.3 ± 0.9 1 0.5 4.6 ± 0.3
39
Table 2 Total C, N and P (% by mass) and C:N ratios (mean ± SD) of flora and fauna collected at IRL. Values reported by Vaslet et al. (2012) from IRL samples are labeled as such. n = number of samples analyzed. --- = not available.
Sample Type n %C %N %P C:N
Mangrove tree crabs Aratus pisonii Large (> 18 mm)) 27 50.6 ± 1.7 8.4 ± 0.7 0.19 ± 0.1 7.1 ± 0.6
Medium (9 - 12 mm) 27 46.2 ± 4.0 8.1 ± 0.8 0.24 ± 0.1 6.7 ± 0.5
Small (< 9 mm) 26 42.8 ± 4.8 8.5 ± 0.8 0.27 ± 0.1 5.9 ± 0.6
Claw muscle 23 37.2 ± 3.6 9.8 ± 1.3 0.70 ± 0.4 4.4 ± 0.3
Red mangrove tree Rhizophora mangle
Green Leaves 24 47.7 ± 8.4 1.1 ± 0.1 0.10 ± 0.0 50.7 ± 11.8
Senescent Leaves 27 43.4 ± 3.3 0.5 ± 0.1 0.05 ± 0.0 114.6 ± 21.2
Lichen (Unidentified) Crustose variety 6 47.1 ± 1.6 1.2 ± 0.1 0.11 ± 0.0 47.6 ± 4.1
Foliose variety 14 43.8 ± 1.0 1.1 ± 0.1 0.06 ± 0.0 46.4 ± 5.2
Other crab species Uca spp.
Fiddler crab bodies 27 48.4 ± 2.1 8.5 ± 0.6 0.09 ± 0.0 6.7 ± 0.5
Male claw muscle 25 38.5 ± 3.7 11.4 ± 1.6 0.63 ± 0.2 4.0 ± 0.2
Xanthidae
Mud crab bodies 11 49.1 ± 5.7 8.4 ± 1.0 0.57 ± 0.3 6.9 ± 1.0
Mud crab claw muscle 9 38.4 ± 5.7 10.8 ± 2.3 0.10 ± 0.0 4.2 ± 0.5
Other invertebrates Spiders Gasteracantha cancriformis 24 49.0 ± 1.3 11.9 ± 0.7 0.70 ± 0.1 4.8 ± 0.4 Coffee bean snail Melampus bidentatus 26 38.2 ± 3.1 7.0 ± 0.8 0.63 ± 0.1 6.4 ± 0.5 Ivory Barnacle Balanus eburneus 8 35.9 ± 3.4 9.1 ± 1.4 0.41 ± 0.1 4.7 ± 0.4 Atlantic ribbed mussel
Geukensia demissa muscle 20 41.0 ± 1.4 12.6 ± 0.8 0.30 ± 0.1 3.8 ± 0.1
Vaslet et al. (2012)
Microphytobenthos 3 7.7 ± 0.6 0.9 ± 0.1 --- 10.4 ± 0.1
Prop Root Epiphytes 3 20.9 ± 0.3 2.6 ± 0.0 --- 9.3 ± 0.1
Litter (R. mangle) 4 48.8 ± 0.6 0.7 ± 0.0 --- 80.9 ± 2.8
Algae 3 20.8 ± 2.0 3.8 ± 0.7 --- 6.4 ± 0.6
POM 2 22.4 ± 2.9 3.8 ± 0.6 --- 6.9 ± 0.2
40
Table 3 δ13C and δ15N values (mean ± SD) of flora and fauna collected at IRL. Labels correspond to
isotopic signatures in Figure 1. Values reported by Vaslet et al. (2012) from IRL samples are labeled as
such. n = number of samples analyzed. --- = not available.
Sample Type n δ13C (‰) δ15N (‰) Fig. 1 Label
Mangrove tree crabs
Aratus pisonii Large (> 18 mm)) 27 -26.8 ± 0.5 -0.6 ± 0.8 L Medium (9 - 12 mm) 27 -26.3 ± 0.8 0.0 ± 1.5 M Small (< 9 mm) 26 -25.1 ± 0.9 2.0 ± 0.8 S
Claw muscle 23 -23.8 ± 0.6 3.3 ± 1.2 Ap
Red mangrove tree
Rhizophora mangle
Green Leaves 24 -28.1 ± 0.8 3.1 ± 0.8 GL
Senescent Leaves 27 -27.6 ± 0.6 0.1 ± 0.6 SL Lichen (Unidentified)
Crustose variety 6 -22.6 ± 0.7 -5.5 ± 1.1 Cr Foliose variety 14 -19.0 ± 1.1 -10.3 ± 1.8 Fo
Other crab species
Uca spp. Fiddler crab bodies 27 -52.3 ± 8.7 27.7 ± 9.0 Uw Male claw muscle 25 -23.0 ± 0.8 5.0 ± 0.6 Um
Xanthidae
Mud crab bodies 11 -56.4 ± 1.2 34.5 ± 1.2 Xw Mud crab claw muscle 9 -22.9 ± 1.6 7.2 ± 1.1 Xm Other invertebrates
Spiders
Gasteracantha cancriformis 24 -24.0 ± 0.5 6.1 ± 0.5 Gc
Coffee bean snail Melampus bidentatus 26 -25.0 ± 0.6 2.4 ± 0.5 Mb
Ivory Barnacle
Balanus eburneus 8 -23.3 ± 0.7 7.8 ± 0.3 Be Atlantic ribbed mussel Geukensia demissa muscle 20 -23.5 ± 0.6 7.0 ± 0.5 Gd
Vaslet et al. (2012)
Microphytobenthos 3 -19.7 ± 0.1 3.0 ± 0.4 MPB Prop Root Epiphytes 3 -25.3 ± 0.1 5.8 ± 0.2 Epi
Litter (R. mangle) 4 -28.1 ± 0.2 3.1 ± 0.5 LL Algae 3 -22.2 ± 0.7 4.8 ± 0.6 Alg
POM 2 -21.6 ± 1.3 5.9 ± 0.5 POM
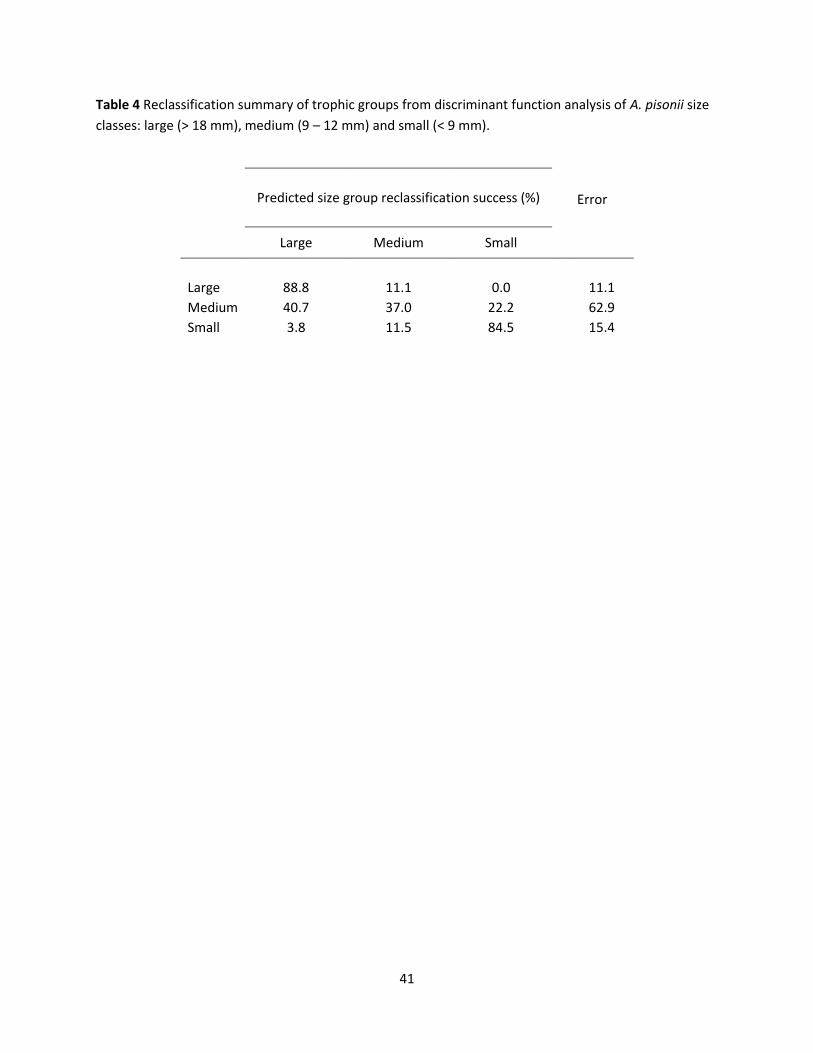
41
Table 4 Reclassification summary of trophic groups from discriminant function analysis of A. pisonii size
classes: large (> 18 mm), medium (9 – 12 mm) and small (< 9 mm).
Predicted size group reclassification success (%)
Error
Large Medium Small
Large 88.8 11.1 0.0 11.1
Medium 40.7 37.0 22.2 62.9
Small 3.8 11.5 84.5 15.4
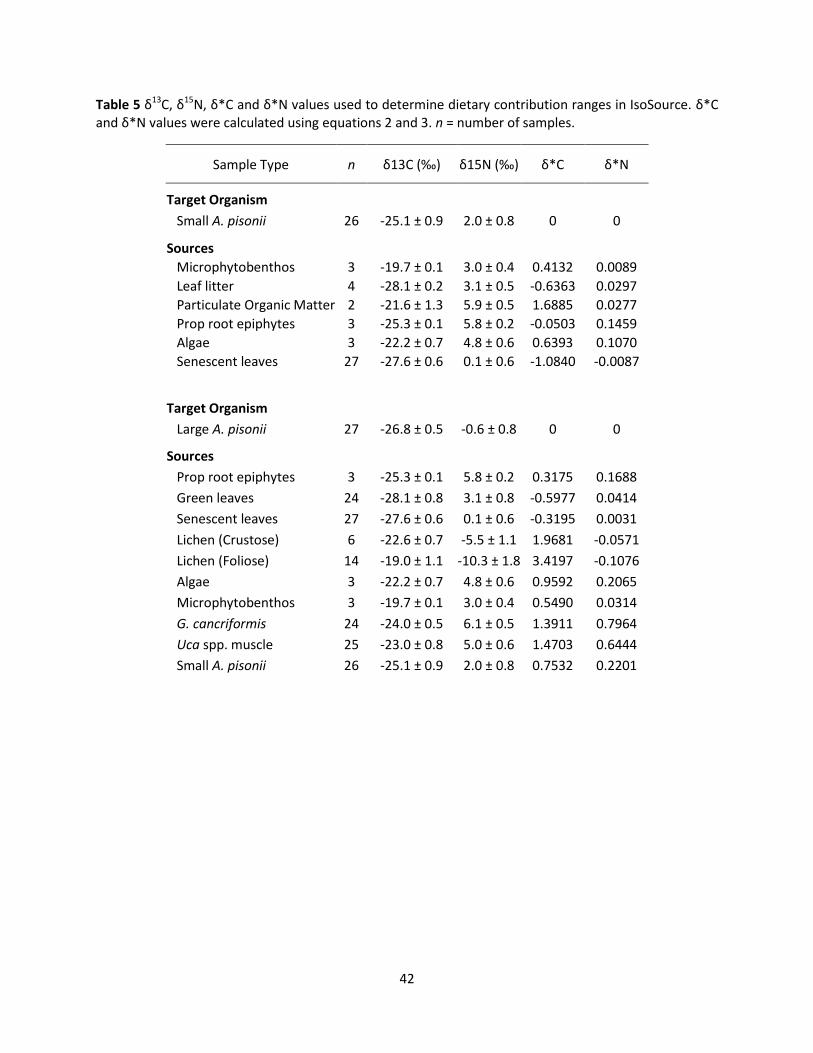
42
Table 5 δ13C, δ15N, δ*C and δ*N values used to determine dietary contribution ranges in IsoSource. δ*C and δ*N values were calculated using equations 2 and 3. n = number of samples.
Sample Type n δ13C (‰) δ15N (‰) δ*C δ*N
Target Organism
Small A. pisonii 26 -25.1 ± 0.9 2.0 ± 0.8 0 0
Sources
Microphytobenthos 3 -19.7 ± 0.1 3.0 ± 0.4 0.4132 0.0089
Leaf litter 4 -28.1 ± 0.2 3.1 ± 0.5 -0.6363 0.0297
Particulate Organic Matter 2 -21.6 ± 1.3 5.9 ± 0.5 1.6885 0.0277
Prop root epiphytes 3 -25.3 ± 0.1 5.8 ± 0.2 -0.0503 0.1459
Algae 3 -22.2 ± 0.7 4.8 ± 0.6 0.6393 0.1070
Senescent leaves 27 -27.6 ± 0.6 0.1 ± 0.6 -1.0840 -0.0087
Target Organism
Large A. pisonii 27 -26.8 ± 0.5 -0.6 ± 0.8 0 0
Sources
Prop root epiphytes 3 -25.3 ± 0.1 5.8 ± 0.2 0.3175 0.1688
Green leaves 24 -28.1 ± 0.8 3.1 ± 0.8 -0.5977 0.0414
Senescent leaves 27 -27.6 ± 0.6 0.1 ± 0.6 -0.3195 0.0031
Lichen (Crustose) 6 -22.6 ± 0.7 -5.5 ± 1.1 1.9681 -0.0571
Lichen (Foliose) 14 -19.0 ± 1.1 -10.3 ± 1.8 3.4197 -0.1076
Algae 3 -22.2 ± 0.7 4.8 ± 0.6 0.9592 0.2065
Microphytobenthos 3 -19.7 ± 0.1 3.0 ± 0.4 0.5490 0.0314
G. cancriformis 24 -24.0 ± 0.5 6.1 ± 0.5 1.3911 0.7964
Uca spp. muscle 25 -23.0 ± 0.8 5.0 ± 0.6 1.4703 0.6444
Small A. pisonii 26 -25.1 ± 0.9 2.0 ± 0.8 0.7532 0.2201

43
Table 6 Feasible source contributions to diets of small and large A. pisonii using the traditional method and mass balance method to determine inputs for IsoSource.
Sample Type n Traditional Method Mass Balance Method
Target Organism
Small A. pisonii 26 --- ---
Sources
Microphytobenthos 3 48 - 58% 0 - 73%
Leaf litter 4 0 - 11% 0 - 17%
Particulate Organic Matter 2 0 - 9% 0 - 39%
Prop root epiphytes 3 0 - 7% 0 - 4%
Algae 3 0 - 13% 0 - 6%
Senescent leaves 27 32-42% 16 - 61%
Target Organism
Large A. pisonii 27 --- ---
Sources
Prop root epiphytes 3 0 - 5% 0 - 8%
Green leaves 24 0 - 18% 0 - 53%
Senescent leaves 27 68 - 90% 33 - 90%
Lichen (Crustose) 6 0 - 18% 0 - 20%
Lichen (Foliose) 14 0 - 10% 0 - 13%
Algae 3 0 - 3% 0 - 5%
Microphytobenthos 3 0 - 3% 0 - 28%
G. cancriformis 24 0 - 3% 0 - 1%
Uca spp. muscle 25 0 - 3% 0 - 1%
Small A. pisonii 26 0 - 8% 0 - 5%
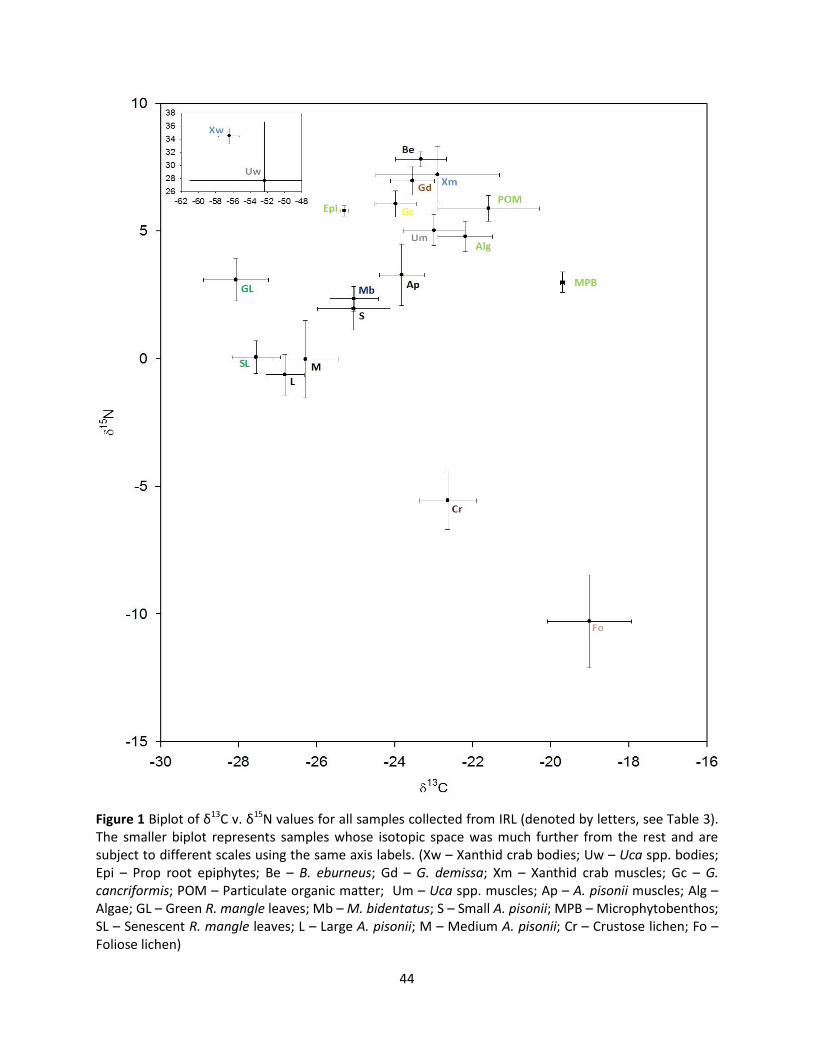
44
Figure 1 Biplot of δ13C v. δ15N values for all samples collected from IRL (denoted by letters, see Table 3). The smaller biplot represents samples whose isotopic space was much further from the rest and are subject to different scales using the same axis labels. (Xw – Xanthid crab bodies; Uw – Uca spp. bodies; Epi – Prop root epiphytes; Be – B. eburneus; Gd – G. demissa; Xm – Xanthid crab muscles; Gc – G. cancriformis; POM – Particulate organic matter; Um – Uca spp. muscles; Ap – A. pisonii muscles; Alg – Algae; GL – Green R. mangle leaves; Mb – M. bidentatus; S – Small A. pisonii; MPB – Microphytobenthos; SL – Senescent R. mangle leaves; L – Large A. pisonii; M – Medium A. pisonii; Cr – Crustose lichen; Fo – Foliose lichen)
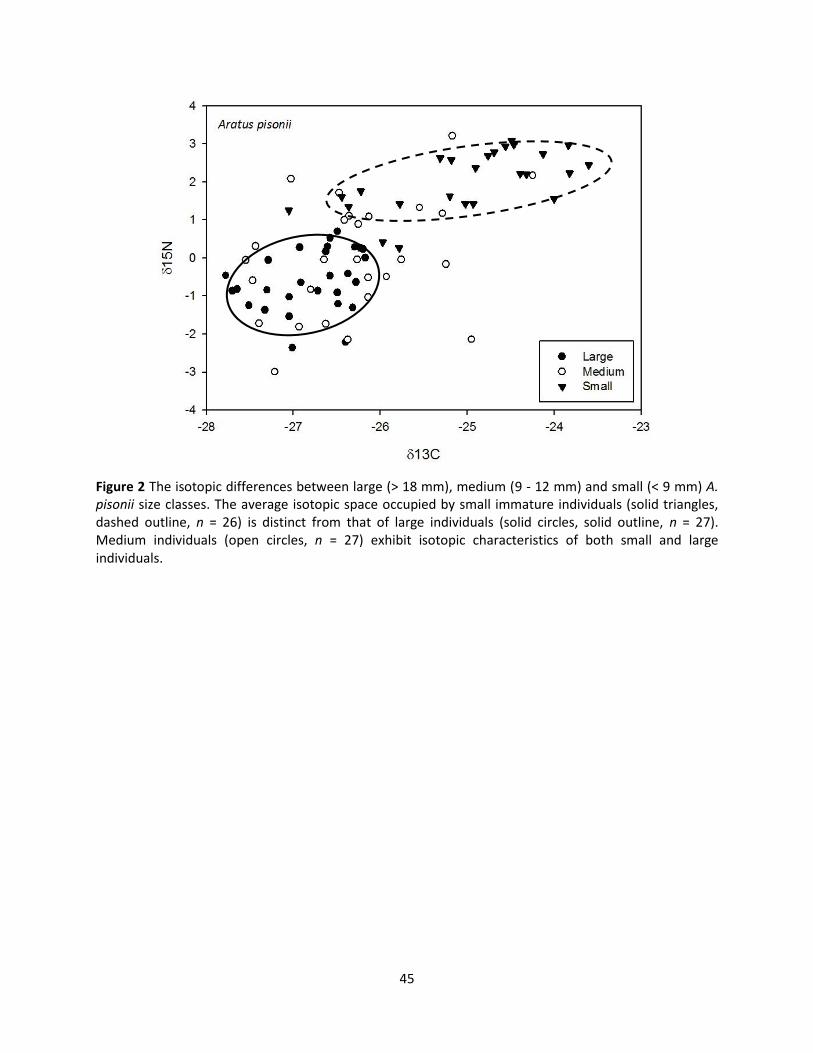
45
Figure 2 The isotopic differences between large (> 18 mm), medium (9 - 12 mm) and small (< 9 mm) A. pisonii size classes. The average isotopic space occupied by small immature individuals (solid triangles, dashed outline, n = 26) is distinct from that of large individuals (solid circles, solid outline, n = 27). Medium individuals (open circles, n = 27) exhibit isotopic characteristics of both small and large individuals.

46
Figure 3 Mixing polygon for δ13C and δ15N signatures of 6 food sources for small A. pisonii. Histograms show the distribution of feasible contributions from each source for the small A. pisonii diet generated in IsoSource using δ13C and δ15N values displayed in Table 5. Dashed lines indicate which histograms correspond to their appropriate data points when not positioned with obvious proximity. Values shown in boxes are 1-99 percentile ranges for these components.
Prop Root Epiphytes
0 – 7%
Leaf Litter
0 – 11%
Small A. pisonii
Microphytobenthos
48 – 58%
Senescent Leaves 32 – 42%
Algae
0 – 13%
Particulate Organic Matter
0 – 9%
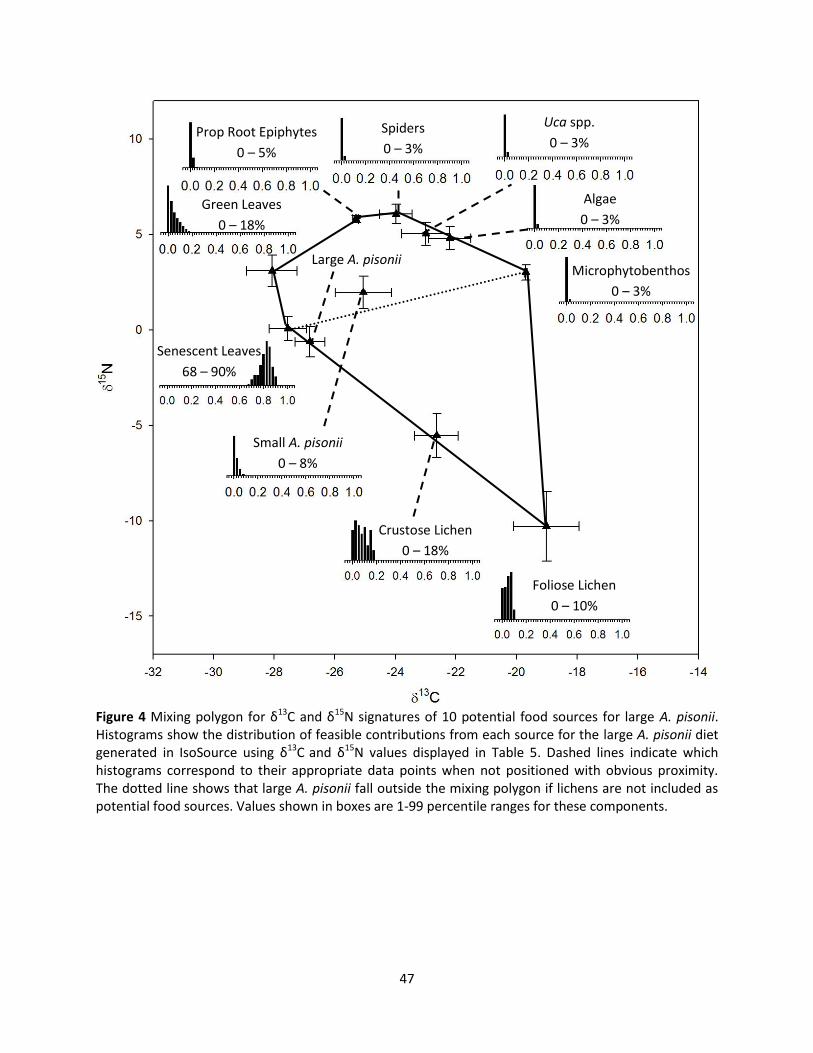
47
Figure 4 Mixing polygon for δ13C and δ15N signatures of 10 potential food sources for large A. pisonii. Histograms show the distribution of feasible contributions from each source for the large A. pisonii diet generated in IsoSource using δ13C and δ15N values displayed in Table 5. Dashed lines indicate which histograms correspond to their appropriate data points when not positioned with obvious proximity. The dotted line shows that large A. pisonii fall outside the mixing polygon if lichens are not included as potential food sources. Values shown in boxes are 1-99 percentile ranges for these components.
Large A. pisonii
Senescent Leaves
68 – 90%
Green Leaves
0 – 18%
Small A. pisonii
0 – 8%
Foliose Lichen
0 – 10%
Crustose Lichen
0 – 18%
Prop Root Epiphytes
0 – 5%
Spiders
0 – 3%
Uca spp.
0 – 3%
Algae
0 – 3%
Microphytobenthos
0 – 3%
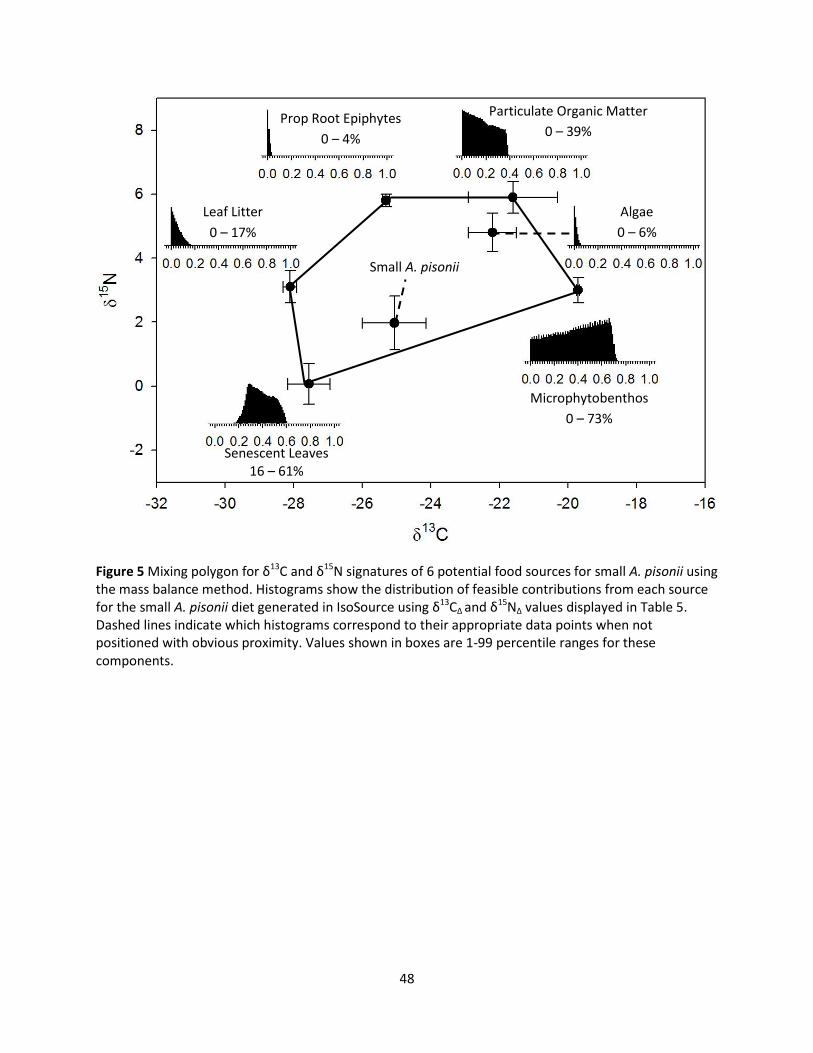
48
Figure 5 Mixing polygon for δ13C and δ15N signatures of 6 potential food sources for small A. pisonii using the mass balance method. Histograms show the distribution of feasible contributions from each source for the small A. pisonii diet generated in IsoSource using δ13CΔ and δ15NΔ values displayed in Table 5. Dashed lines indicate which histograms correspond to their appropriate data points when not positioned with obvious proximity. Values shown in boxes are 1-99 percentile ranges for these components.
Prop Root Epiphytes
0 – 4%
Leaf Litter
0 – 17%
Small A. pisonii
Microphytobenthos
0 – 73%
Senescent Leaves
16 – 61%
Algae
0 – 6%
Particulate Organic Matter
0 – 39%
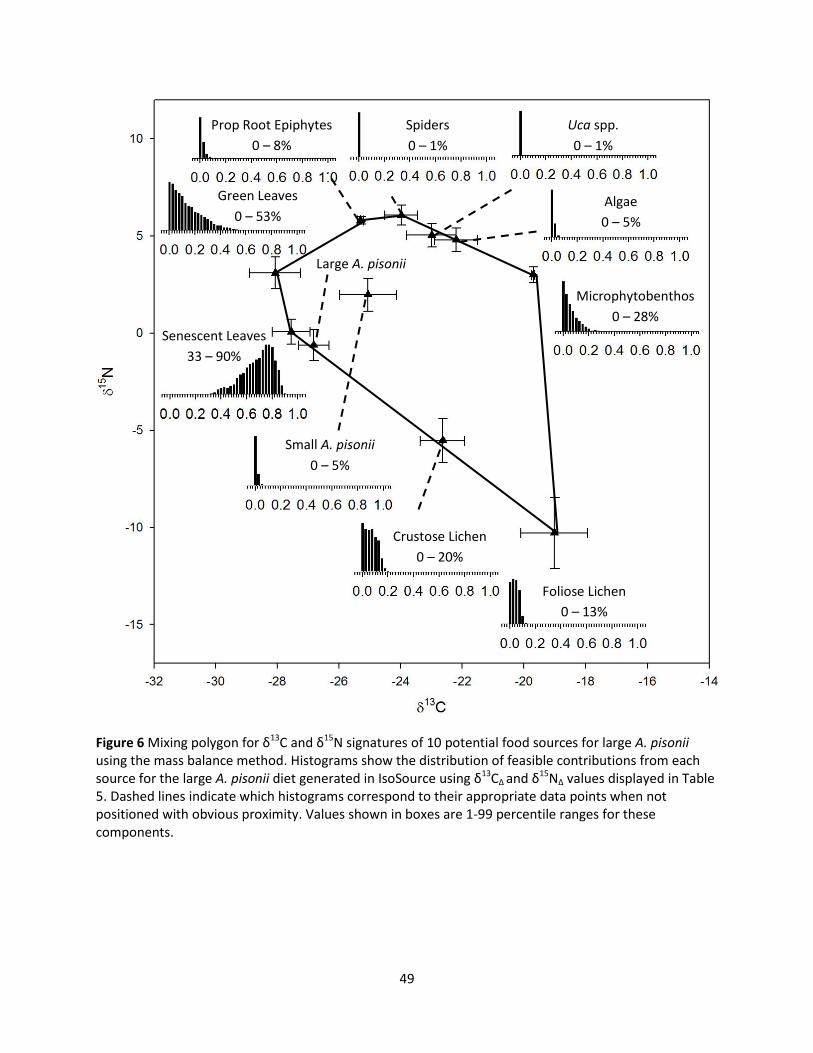
49
Figure 6 Mixing polygon for δ13C and δ15N signatures of 10 potential food sources for large A. pisonii using the mass balance method. Histograms show the distribution of feasible contributions from each source for the large A. pisonii diet generated in IsoSource using δ13CΔ and δ15NΔ values displayed in Table 5. Dashed lines indicate which histograms correspond to their appropriate data points when not positioned with obvious proximity. Values shown in boxes are 1-99 percentile ranges for these components.
Green Leaves
0 – 53%
Large A. pisonii
Senescent Leaves
33 – 90%
Small A. pisonii
0 – 5%
Foliose Lichen
0 – 13%
Crustose Lichen
0 – 20%
Prop Root Epiphytes
0 – 8%
Spiders
0 – 1%
Uca spp.
0 – 1%
Algae
0 – 5%
Microphytobenthos
0 – 28%