Geomechanical-induced 4D time shifts Nov 2018
18
Thomas Røste Geomechanical - induced 4D time shifts Nov 2018
Transcript of Geomechanical-induced 4D time shifts Nov 2018
Thomas Røste
Geomechanical-induced 4D time shifts Nov 2018
Outline
• Why monitor overburden?
• Time shifts and geomechanics
• Field examples
• Summary
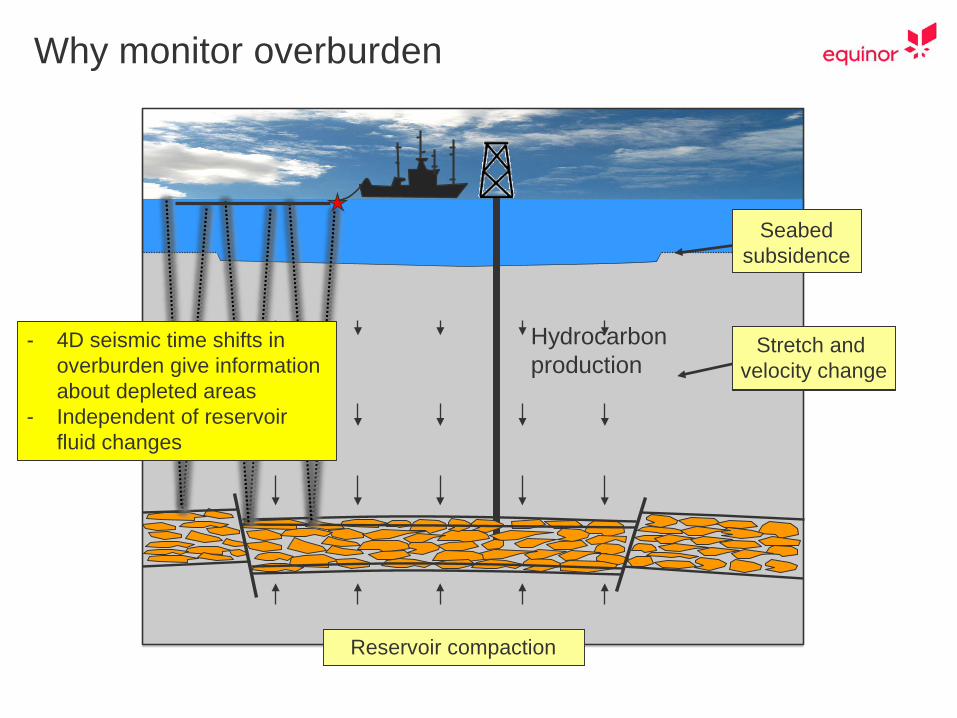
Hydrocarbonproduction
Pore-pressure decreaseReservoir compaction
Stress changesOverburden
displacementsStretch and
velocity change
Seabedsubsidence
Why monitor overburden
- 4D seismic time shifts in overburden give information about depleted areas
- Independent of reservoir fluid changes

Outline
• Why monitor overburden?
• Time shifts and geomechanics
• Field examples
• Summary
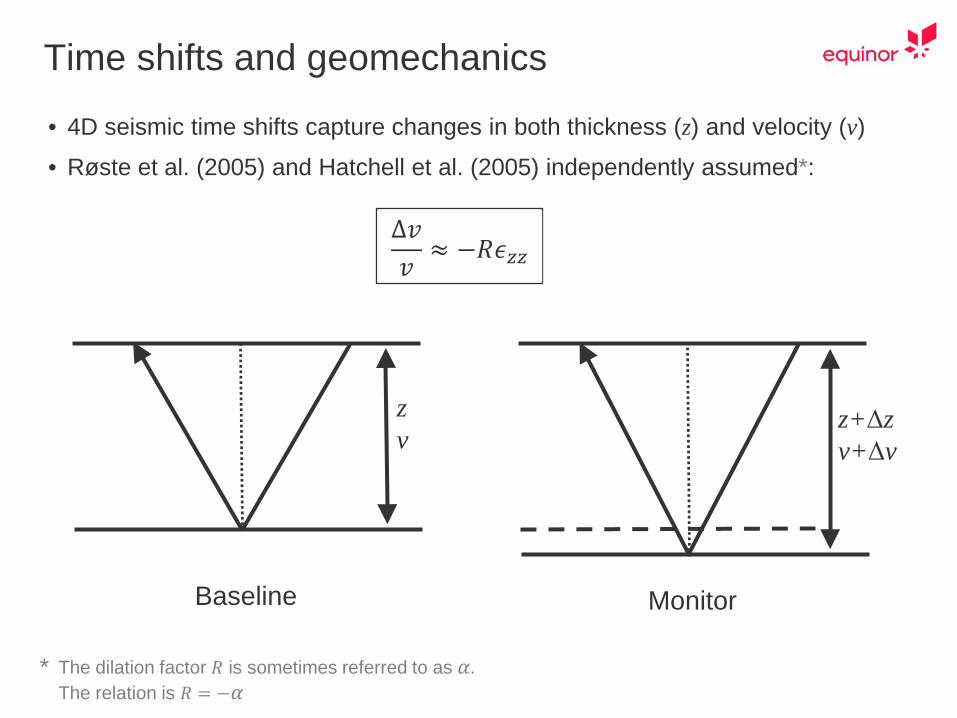
zv
Baseline
z+Δzv+Δv
Monitor
• 4D seismic time shifts capture changes in both thickness (z) and velocity (v)
• Røste et al. (2005) and Hatchell et al. (2005) independently assumed*:
Δ𝑣𝑣𝑣𝑣≈ −𝑅𝑅
Δ𝑧𝑧𝑧𝑧
Time shifts and geomechanics
The dilation factor 𝑅𝑅 is sometimes referred to as 𝛼𝛼.The relation is 𝑅𝑅 = −𝛼𝛼
*
Δ𝑣𝑣𝑣𝑣≈ −𝑅𝑅𝜖𝜖𝑧𝑧𝑧𝑧
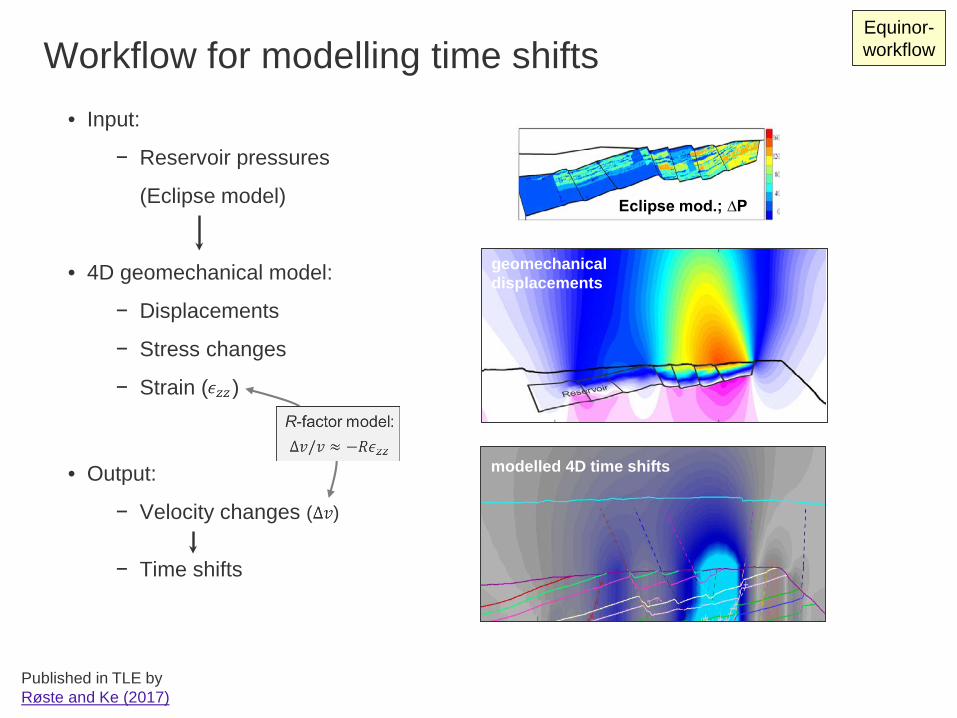
• Input:
− Reservoir pressures
(Eclipse model)
• 4D geomechanical model:
− Displacements
− Stress changes
− Strain ( )
• Output:
− Velocity changes ( )
− Time shifts
Workflow for modelling time shifts
modelled 4D time shifts
Eclipse mod.; ∆P
geomechanical displacements
Equinor-workflow
Δ𝑣𝑣/𝑣𝑣 ≈ −𝑅𝑅𝜖𝜖𝑧𝑧𝑧𝑧
Published in TLE byRøste and Ke (2017)
Outline
• Why monitor overburden?
• Time shifts and geomechanics
• Field examples
• Summary
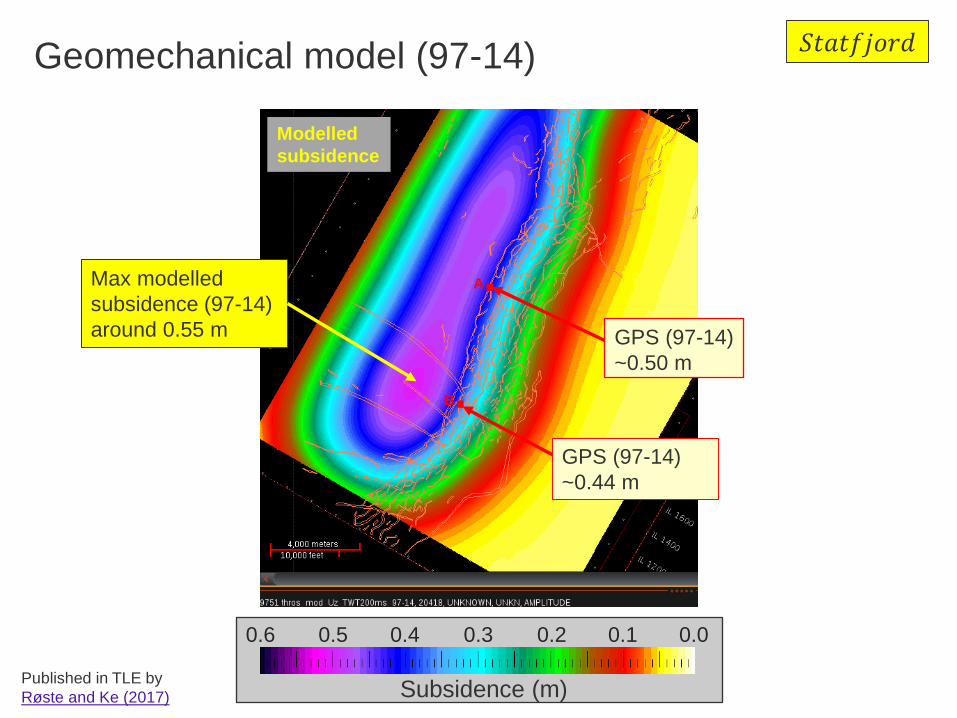
Max modelled subsidence (97-14) around 0.55 m
Subsidence (m)
0.5 0.4 0.3 0.2 0.1 0.00.6
Published in TLE byRøste and Ke (2017)
Modelled subsidence
Geomechanical model (97-14) 𝑆𝑆𝑆𝑆𝑆𝑆𝑆𝑆𝑆𝑆𝑆𝑆𝑆𝑆𝑆𝑆𝑆𝑆
A
B
GPS (97-14) ~0.50 m
GPS (97-14) ~0.44 m
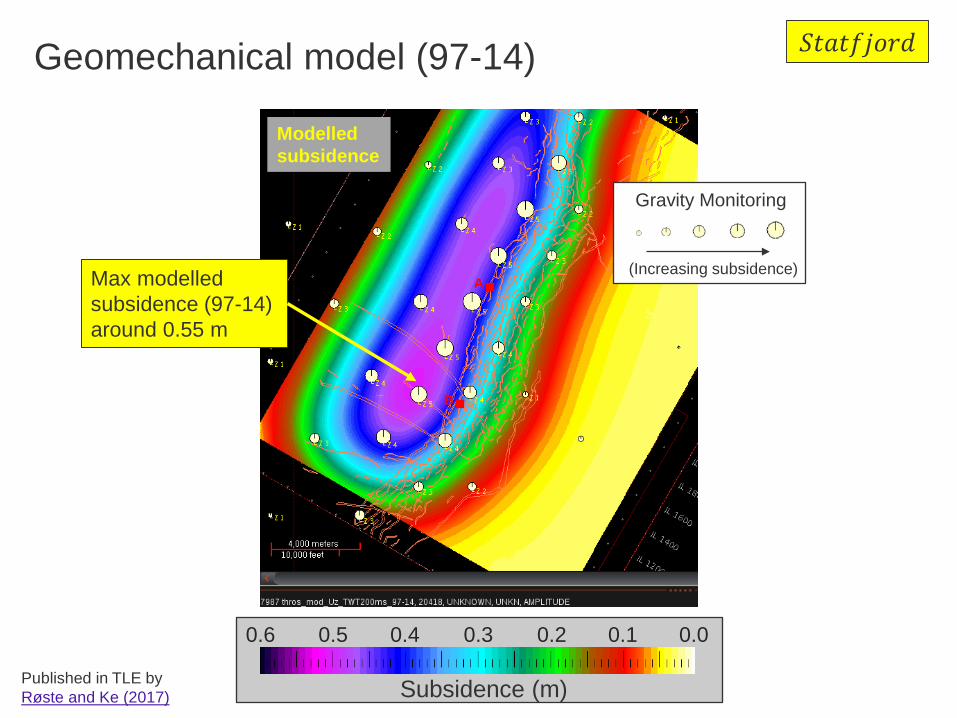
Geomechanical model (97-14)
Subsidence (m)
B
A
𝑆𝑆𝑆𝑆𝑆𝑆𝑆𝑆𝑆𝑆𝑆𝑆𝑆𝑆𝑆𝑆𝑆𝑆
0.5 0.4 0.3 0.2 0.1 0.00.6
Modelled subsidence
Published in TLE byRøste and Ke (2017)
Gravity Monitoring
(Increasing subsidence) Max modelled subsidence (97-14) around 0.55 m
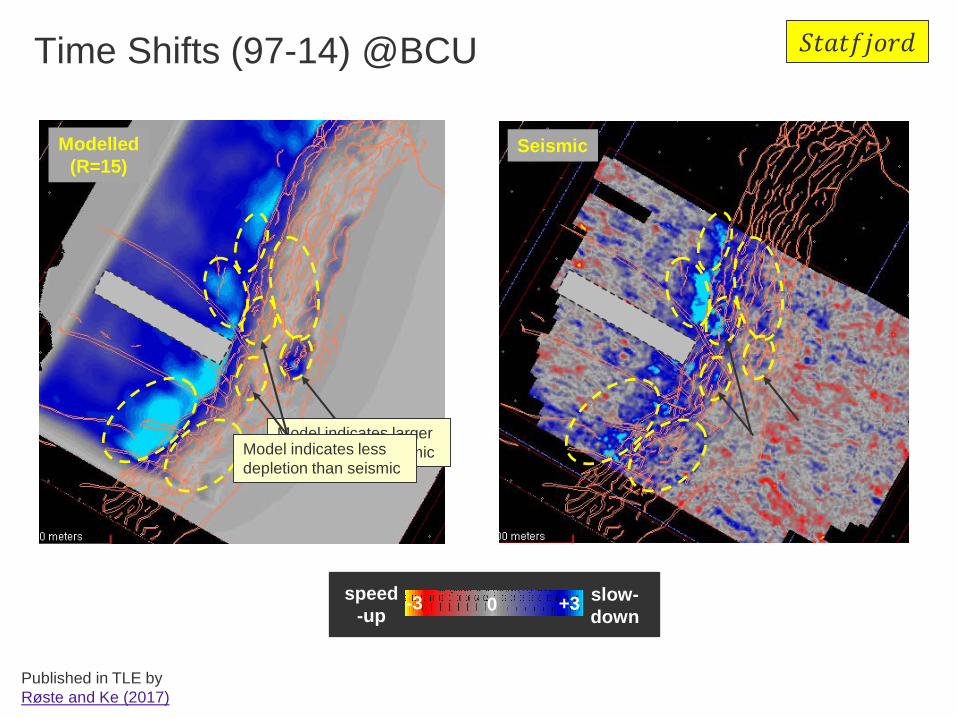
Modelled(R=15)
Seismic
Time Shifts (97-14) @BCU 𝑆𝑆𝑆𝑆𝑆𝑆𝑆𝑆𝑆𝑆𝑆𝑆𝑆𝑆𝑆𝑆𝑆𝑆
Model indicates larger depletion than seismicModel indicates less
depletion than seismic
+30-3 slow-down
speed-up
Published in TLE byRøste and Ke (2017)
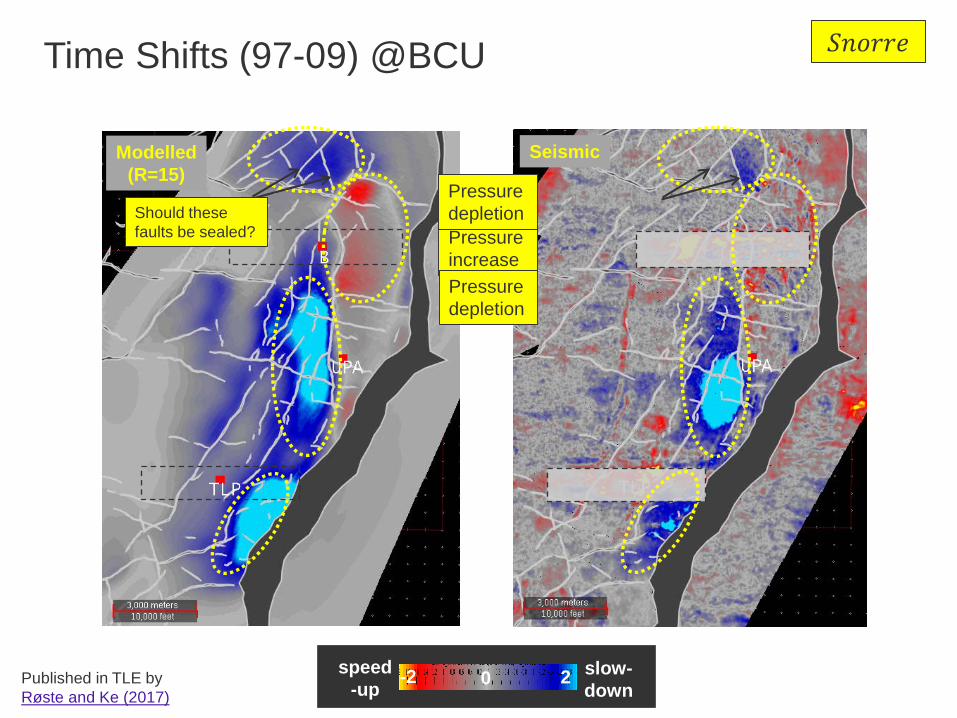
SeismicModelled(R=15)
Time Shifts (97-09) @BCU
Pressure increasePressure depletion
20-2 slow-down
speed-up
Should these faults be sealed?
𝑆𝑆𝑆𝑆𝑆𝑆𝑆𝑆𝑆𝑆𝑆𝑆
Pressure depletion
Published in TLE byRøste and Ke (2017)
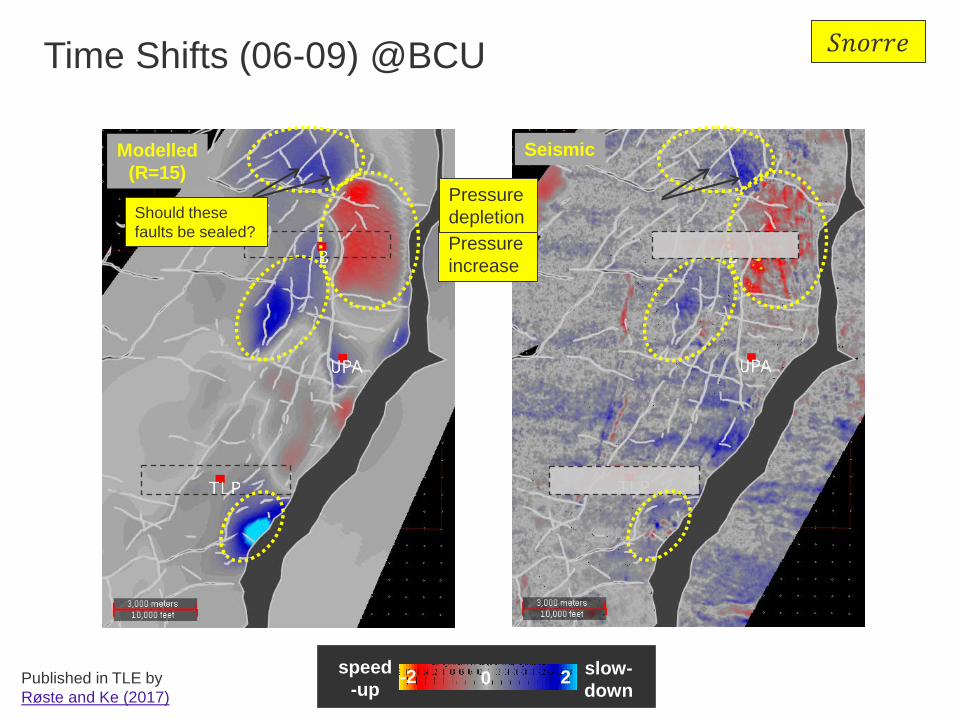
Modelled(R=15)
Seismic
Time Shifts (06-09) @BCU
Pressure increase
Pressure depletionShould these
faults be sealed?
20-2 slow-down
speed-up
𝑆𝑆𝑆𝑆𝑆𝑆𝑆𝑆𝑆𝑆𝑆𝑆
Published in TLE byRøste and Ke (2017)
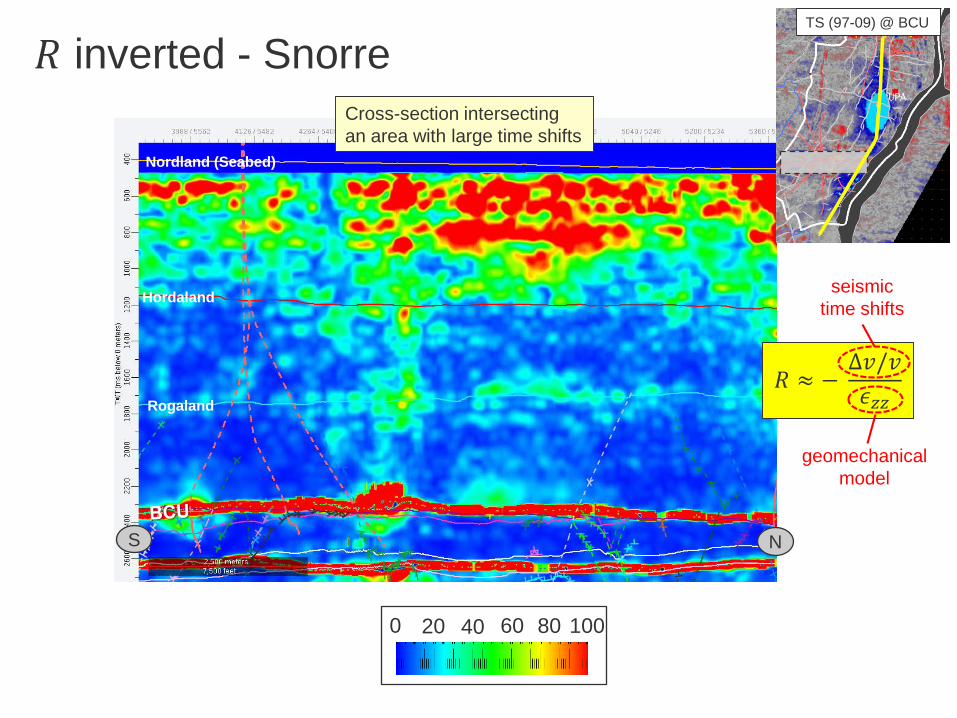
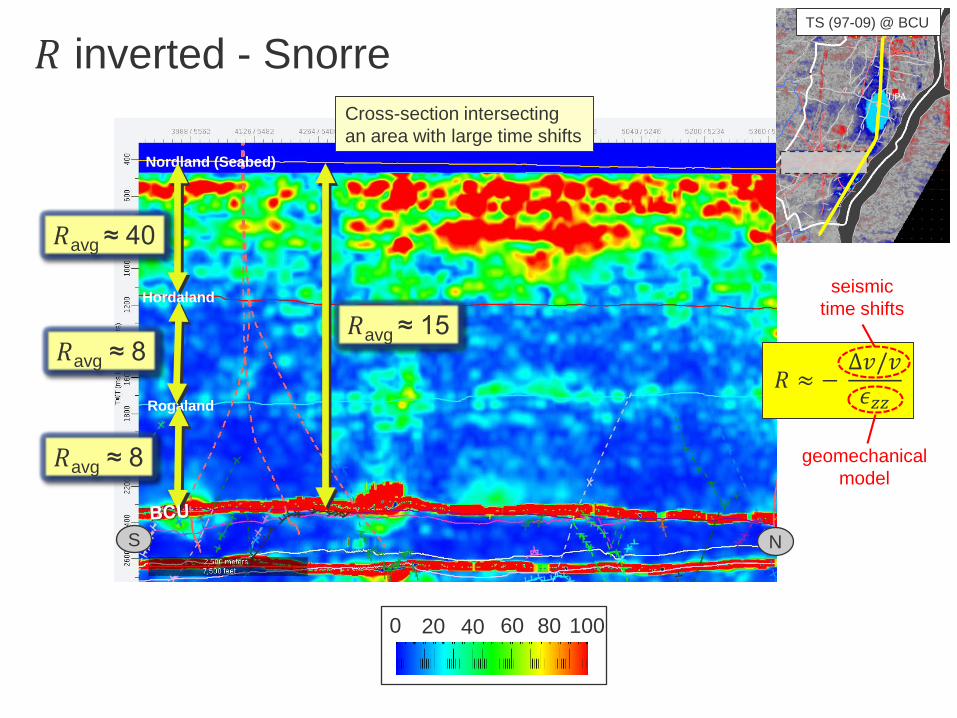
𝑅𝑅 inverted - Snorre Cross-section intersecting an area with large time shifts
Nordland (Seabed)
Hordaland
Rogaland
TS (97-09) @ BCU
0 20 40 60 80 100
𝑅𝑅 ≈ −Δ𝑣𝑣/𝑣𝑣𝜖𝜖𝑧𝑧𝑧𝑧
geomechanical model
seismic time shifts
S N
Nordland (Seabed)
Hordaland
Rogaland
𝑅𝑅avg ≈ 8
𝑅𝑅avg ≈ 8
𝑅𝑅avg ≈ 40
S N
𝑅𝑅 inverted - Snorre Cross-section intersecting an area with large time shifts
𝑅𝑅avg ≈ 15
0 20 40 60 80 100
𝑅𝑅 ≈ −Δ𝑣𝑣/𝑣𝑣𝜖𝜖𝑧𝑧𝑧𝑧
geomechanical model
seismic time shifts
TS (97-09) @ BCU

Outline
• Why monitor overburden?
• Time shifts and geomechanics
• Field examples
• Summary
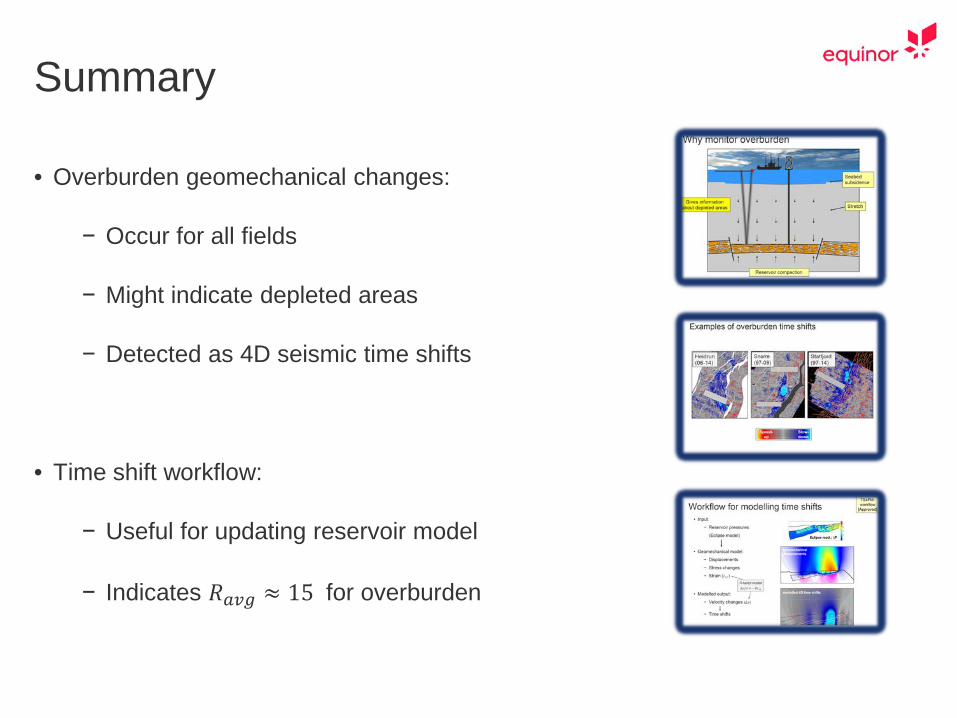
Summary
• Overburden geomechanical changes:
− Occur for all fields
− Might indicate depleted areas
− Detected as 4D seismic time shifts
• Time shift workflow:
− Useful for updating reservoir model
− Indicates 𝑅𝑅𝑎𝑎𝑎𝑎𝑎𝑎 ≈ 15 for overburden
Acknowledgments• Ganpan Ke for fruitful discussions and geomechanical modelling input
• Several people for discussions, especially:
Sascha Bussat, Lasse Renli, Martin Landrø, Kenneth Duffaut, Bård Bostrøm,
Ola-Petter Munkvold, Øyvind Kvam, Ole K. Søreide, Svend Østmo, Odd Solheim,
Colin MacBeth, Jon Lippard, Frank Aanvik, Torill Andersen, and Vibeke Haugen
• The Snorre, Statfjord, and Heidrun partnerships for permission to present this data
VIENNA

References
• Røste, T. and G. Ke, 2017, Overburden 4D time shifts — Indicating undrained areas and
fault transmissibility in the reservoir: The Leading Edge.
• Røste, T., O.P. Dybvik, and O.K. Søreide, 2015, Overburden 4D time shifts induced by
reservoir compaction at Snorre field: The Leading Edge.
• Røste, T., A. Stovas, and M. Landrø, 2005, Estimation of layer thickness and velocity
changes using 4D prestack seismic data: 67th EAGE, Extended Abstracts, C010.
• Hatchell, P.J., R.S. Kawar, and A.A. Savitski, 2005, Integrating 4D seismic, geomechanics
and reservoir simulation in the Valhall Oil Field: 67th EAGE, Extended Abstracts, C012.


![arXiv:2111.04391v1 [math.OC] 8 Nov 2021](https://static.fdocument.org/doc/165x107/61d35e3d10581779f3727cb5/arxiv211104391v1-mathoc-8-nov-2021.jpg)


![arXiv:2011.08773v1 [math.NT] 17 Nov 2020](https://static.fdocument.org/doc/165x107/616893ffd394e9041f70c819/arxiv201108773v1-mathnt-17-nov-2020.jpg)