Sensitive and Direct Detection of Circulating Tumor Cells by Multimarker … · 2012-07-02 ·...
9
Sensitive and Direct Detection of Circulating Tumor Cells by Multimarker μ-Nuclear Magnetic Resonance 1,2 Arezou A. Ghazani * , Cesar M. Castro * ,† , Rostic Gorbatov * , Hakho Lee * and Ralph Weissleder * ,†,‡ *Center for Systems Biology, Massachusetts General Hospital, Harvard Medical School, Boston, MA; † Massachusetts General Hospital Cancer Center, Boston, MA; ‡ Department of Systems Biology, Harvard Medical School, Boston, MA Abstract Identifying circulating tumor cells (CTCs) with greater sensitivity could facilitate early detection of cancer and rapid assessment of treatment response. Most current technologies use EpCAM expression as a CTC identifier. However, given that a significant fraction of cancer patients have low or even absent EpCAM levels, there is a need for better detection methods. Here, we hypothesize that a multimarker strategy combined with direct sensing of CTC in whole blood would increase the detection of CTC in patients. Accordingly, molecular profiling of biopsies from a patient cohort revealed a four-marker set (EpCAM, HER-2, EGFR, and MUC-1) capable of effectively differentiating cancer cells from normal host cells. Using a point-of-care micro–nuclear magnetic resonance (μNMR) system, we conse- quently show that this multimarker combination readily detects individual CTC directly in whole blood without the need for primary purification. We also confirm these results in a comparative trial of patients with ovarian cancer. This platform could potentially benefit a broad range of applications in clinical oncology. Neoplasia (2012) 14, 388–395 Introduction Tumor biopsies are routinely performed for diagnosis, prognosis, treatment selection, or, increasingly, for the assessment of treatment response. However, the cost, morbidity, and measurement intervals associated with biopsies are often limiting; thus, less invasive alterna- tives are being examined. For the last few years, circulating tumor cells (CTCs) have received significant attention as surrogate markers [1–3]. Indeed, emerging evidence suggests that both the absolute number of CTCs and the changes in their number can serve as prognostic or pre- dictive markers [4–9]. As a result, more than 300 clinical trials are cur- rently investigating CTCs in an attempt to correlate their presence and concentration with treatment outcome (www.clinicaltrials.gov). While the introduction of commercial kits has facilitated CTC assessment, their heavy reliance on EpCAM as a single marker has been limiting. It is generally accepted that EpCAM-based detection has low sensitivity in EpCAM-negative cancers, which may explain why up to 70% of patients with metastatic epithelial malignancies fail to exhibit detect- able CTCs using such methods. This is especially the case for ag- gressive tumor cells, which often downregulate EpCAM during epithelial-mesenchymal transition [4]. Such findings underscore the importance of identifying alternative CTC metrics. To date, a variety of experimental CTC detection methods have been described using different biological markers. However, because most of these methods rely on immunocytochemical or polymerase chain reaction–based analyses, they often require primary purification and subsequent skilled processing and interpretation [3]. There is thus an urgent need to translate cancer-related discoveries into practical clin- ical and research tools for cancer investigation and treatment. To achieve this, low-cost strategies that yield robust, quantitative, and fully objective data within a point-of-care setting are required [10]. Given that some trials are starting to stratify and tailor patient therapy based Address all correspondence to: Ralph Weissleder, MD, PhD, Center for Systems Biology, Massachusetts General Hospital, 185 Cambridge St, CPZN 5206, Boston, MA 02114. E-mail: [email protected] 1 This work was supported in part by the following National Institutes of Health grants: U54CA151884, R01EB010011, R01EB004626, P50CA86355, K12CA087723-09, and UO1EB012493. 2 This article refers to supplementary materials, which are designated by Tables W1 and W2 and Figures W1 and W2 and are available online at www.neoplasia.com. Received 18 April 2012; Revised 18 April 2012; Accepted 19 April 2012 Copyright © 2012 Neoplasia Press, Inc. All rights reserved 1522-8002/12/$25.00 DOI 10.1596/neo.12696 www.neoplasia.com Volume 14 Number 5 May 2012 pp. 388–395 388
Transcript of Sensitive and Direct Detection of Circulating Tumor Cells by Multimarker … · 2012-07-02 ·...
Volume 14 Number 5 May 2012 pp. 388–395 388
www.neoplasia.com
Sensitive and Direct Detectionof Circulating Tumor Cellsby Multimarker μ-NuclearMagnetic Resonance1,2
Arezou A. Ghazani*, Cesar M. Castro*,†,Rostic Gorbatov*, Hakho Lee*and Ralph Weissleder*,†,‡
*Center for Systems Biology, Massachusetts GeneralHospital, Harvard Medical School, Boston, MA;†Massachusetts General Hospital Cancer Center,Boston, MA; ‡Department of Systems Biology,Harvard Medical School, Boston, MA
AbstractIdentifying circulating tumor cells (CTCs) with greater sensitivity could facilitate early detection of cancer and rapidassessment of treatment response. Most current technologies use EpCAM expression as a CTC identifier. However,given that a significant fraction of cancer patients have low or even absent EpCAM levels, there is a need for betterdetection methods. Here, we hypothesize that a multimarker strategy combined with direct sensing of CTC in wholeblood would increase the detection of CTC in patients. Accordingly, molecular profiling of biopsies from a patientcohort revealed a four-marker set (EpCAM, HER-2, EGFR, and MUC-1) capable of effectively differentiating cancercells from normal host cells. Using a point-of-care micro–nuclear magnetic resonance (μNMR) system, we conse-quently show that this multimarker combination readily detects individual CTC directly in whole blood without theneed for primary purification. We also confirm these results in a comparative trial of patients with ovarian cancer. Thisplatform could potentially benefit a broad range of applications in clinical oncology.
Neoplasia (2012) 14, 388–395
Address all correspondence to: Ralph Weissleder, MD, PhD, Center for SystemsBiology, Massachusetts General Hospital, 185 Cambridge St, CPZN 5206, Boston,MA 02114. E-mail: [email protected] work was supported in part by the following National Institutes of Health grants:U54CA151884, R01EB010011, R01EB004626, P50CA86355, K12CA087723-09,and UO1EB012493.2This article refers to supplementary materials, which are designated by Tables W1and W2 and Figures W1 and W2 and are available online at www.neoplasia.com.Received 18 April 2012; Revised 18 April 2012; Accepted 19 April 2012
Copyright © 2012 Neoplasia Press, Inc. All rights reserved 1522-8002/12/$25.00DOI 10.1596/neo.12696
IntroductionTumor biopsies are routinely performed for diagnosis, prognosis,treatment selection, or, increasingly, for the assessment of treatmentresponse. However, the cost, morbidity, and measurement intervalsassociated with biopsies are often limiting; thus, less invasive alterna-tives are being examined. For the last few years, circulating tumor cells(CTCs) have received significant attention as surrogate markers [1–3].Indeed, emerging evidence suggests that both the absolute number ofCTCs and the changes in their number can serve as prognostic or pre-dictive markers [4–9]. As a result, more than 300 clinical trials are cur-rently investigating CTCs in an attempt to correlate their presence andconcentration with treatment outcome (www.clinicaltrials.gov). Whilethe introduction of commercial kits has facilitated CTC assessment,their heavy reliance on EpCAM as a single marker has been limiting.It is generally accepted that EpCAM-based detection has low sensitivityin EpCAM-negative cancers, which may explain why up to 70% ofpatients with metastatic epithelial malignancies fail to exhibit detect-able CTCs using such methods. This is especially the case for ag-gressive tumor cells, which often downregulate EpCAM duringepithelial-mesenchymal transition [4]. Such findings underscore theimportance of identifying alternative CTC metrics.
To date, a variety of experimental CTC detection methods havebeen described using different biological markers. However, becausemost of these methods rely on immunocytochemical or polymerasechain reaction–based analyses, they often require primary purificationand subsequent skilled processing and interpretation [3]. There is thusan urgent need to translate cancer-related discoveries into practical clin-ical and research tools for cancer investigation and treatment. Toachieve this, low-cost strategies that yield robust, quantitative, and fullyobjective data within a point-of-care setting are required [10]. Giventhat some trials are starting to stratify and tailor patient therapy based
Neoplasia Vol. 14, No. 5, 2012 Direct Detection of Circulating Tumor Cells Ghazani et al. 389
on CTC changes (clinicaltrials.gov ID: NCT00382018), this is becom-ing increasingly important.Here, our aim was to address three central questions in CTC
detection: 1) Can detection be performed directly in whole bloodso as to allow rapid point-of-care use? 2) Can current EpCAM-baseddetection paradigms be improved by using a combination of molec-ular markers? And 3) how much more sensitive would such a methodbe when applied to clinical samples? With these questions in mind,we hypothesized that direct detection of CTCs in whole blood (i.e.,eliminating the need for primary CTC isolation, during which cellsare often lost) using a multimarker combination would not onlyserve to increase detection sensitivity but also would allow detectionwithin a point-of-care setting.We investigated this hypothesis in the present study by making
use of a highly sensitive micro–nuclear magnetic resonance (μNMR)technology that is able to perform cellular profiling directly in wholeblood without the need for cell isolation. Detection was achievedthrough the combined and simultaneous sensing of four cancer markers:EpCAM, HER-2, EGFR, and MUC-1. This new approach, coined“quad-μNMR,” is fast and can be effectively used in a point-of-caresetting. It also obviates the need for skilled cytology analysis and datainterpretation, a step that is often limiting in busy clinical and labora-tory environments. Using human blood spiked with cancer cell linesdifferentially expressing EpCAM, we show considerably higher CTCdetection rates with quad-μNMR than with other currently used tech-niques. These findings were later corroborated in a comparative clinicalstudy of advanced-stage ovarian cancer. The assay’s superior perfor-mance is particularly evident from its ability to detect EpCAM-negative(EpCAMneg) cells. The described technology is now poised to enhanceCTC assessment in both preclinical and clinical settings.
Materials and Methods
Cell Culture and Sample PreparationTumor cell lines were cultured in flasks according to manufac-
turer’s recommendations and supplemented with 10% fetal bovineserum (FBS) before subsequent harvesting using trypsin. To determinecell numbers, a 10-μl aliquot of cells was placed on a hemocytometerplate, and counts were performed using a conventional inverted micro-scope. Cells for each experiment were counted in triplicate, and averagevalues were used as the final spiked value. For experiments using wholeblood, a known number of tumor cells were spiked into 7 ml of wholeblood. For sensitivity experiments, each tube was spiked with 200, 100,50, and 25 SKBR3 or SKOV3 tumor cells. Whole blood was obtainedfrom healthy volunteers and placed in tubes containing ethylenediami-netetraacetic acid (Becton Dickinson, Franklin Lakes, NJ) or into Cell-Save preservative tubes (Veridex LLC, Raritan, NJ). CTC experimentsusing CellSearch to detect spiked cancer cells were conducted at anindependent, outside laboratory blinded to the μNMR results.
Preparation of TCO-Modified AntibodiesMonoclonal antibodies against EpCAM, MUC-1, HER-2, and
EGFR were conjugated with (E)-cyclooct-4-enyl 2,5-dioxopyrrolidin-1-yl carbonate (TCO-NHS), as previously reported (Table W1) [11].Briefly, the reaction was carried out with 0.5 mg of antibody inthe presence of 1000 equivalents of TCO-NHS in phosphate-bufferedsaline (PBS) and 10% dimethylformamide for 3 hours at roomtemperature. Unreacted TCO-NHS was then washed using 2 ml of
Zeba desalting columns (Thermo Fisher, Rockford, IL), and antibodyconcentrations were determined by absorbance measurement.
Preparation of Tetrazine-Modified NanoparticlesCross-linked iron oxide (CLIO) nanoparticles were prepared, and
tetrazine (Tz)-CLIO conjugation was performed (as previously re-ported [11]) in PBS containing 5% dimethylformamide for 3 hoursat room temperature. Excess Tz-NHS was removed by gel filtrationusing Sephadex G-50 (GE Healthcare, Pittsburgh, PA).
Sample Processing and Labeling withTz-Modified Nanoparticles
Each whole blood sample (7 ml) was lysed, and the cell pellet wasresuspended in buffer (100 μl of PBS/1% FBS). TCO-modifiedmonoclonal antibodies (10 μg/ml) were added, and the pellet wasincubated at room temperature for 20 minutes. Samples were thenwashed twice, and antibody binding was revealed using magneticnanoparticles (100 nM Tz-CLIO) for 10 minutes at room tempera-ture. Excess Tz-CLIO was removed by washing (centrifugation) twicein 1 × PBS containing 1% FBS, before being resuspended in 20 μl ofPBS for μNMR measurements. The overall labeling and incubationprocedure took approximately 30 minutes.
Clinical SubjectsμNMR expression profiles from the biopsies of 58 patients with
confirmed epithelial malignancies were obtained as part of an institu-tional review board–approved study. These patients had been referredfor clinical biopsy of an intra-abdominal lesion after an abnormalcomputed tomography or ultrasound, at the Massachusetts GeneralHospital Abdominal Imaging and Intervention suites. Also includedwere six patients with benign diagnosis, as determined by repeat corebiopsies, imaging [12], and clinical information, as previously de-scribed [13]. The median age of the malignant cohort was 65 years(range, 25-91 years). The cancer subtypes consisted of breast (n = 4),gastrointestinal (n = 17), genitourinary (n = 4), gynecologic (n = 7),pancreatic (n = 10), lung (n = 9), and poorly differentiated adeno-carcinoma (n = 7).
Collection of peripheral blood for comparative quad-μNMR andCellSearch CTC detection was performed using a convenience sam-ple of 15 patients with ovarian cancer, who were receiving care at theGillette Center for Gynecologic Oncology, Massachusetts GeneralHospital. The study was approved by the Dana Farber/PartnersCancer Care Institutional Review Board, and informed consent wasobtained from all participants. Two clinicians (C.M.C. and R.W.),blinded to the μNMR and CellSearch results, reviewed each subject’sdocumented clinical, imaging, and pathology data. Peripheral bloodsamples were also obtained from five healthy volunteers.
Design of ExperimentsFor the present study, our experiments were primarily focused on
1) optimizing the detection conditions, 2) comparing single and multi-marker detection strategies, and 3) comparing the detection sensitivityof μNMR to the standard clinical assay, CellSearch.
1) Detection was optimized by examining a variety of differentsample processing and cell fixation procedures. Three aliquotsof SKBR3 cells (14,000, 7000, and 1400 cells) were each spikedinto 7 ml of whole blood in triplicate. HER-2 antibody (10 μg/ml)
390 Direct Detection of Circulating Tumor Cells Ghazani et al. Neoplasia Vol. 14, No. 5, 2012
labeling was then performed for each cell concentration experimentunder the following conditions: a) whole blood treated with a redblood cell (RBC) lysis procedure (Qiagen, Valencia, CA), b) wholeblood treated with a Ficoll density gradient (Miltenyi Biotec,Auburn, CA) to separate mononucleated cells, and c) whole bloodwith no additional processing. The effect of cell fixation was exam-ined by targeting the HER-2 biomarker in SKBR3 (as describedabove); this was done by fixing cells in whole blood either immedi-ately before or after spiking varying concentrations of SKBR3 cells(140/ml, 1100/ml, and 6300/ml) into 7 ml of whole blood.2) To compare single versus multimarker detection, five 7-ml ali-quots of whole blood were collected from one single healthy in-dividual for each of 12 experiments. Each blood tube was spikedwith equal and known numbers of cancer cells. The samples werethen processed and distributed into two tubes, one labeled “test”(containing antibody) and the other labeled control (no antibody).To each tube designated as “test,” a single aliquot of antibodyagainst EpCAM, MUC-1, HER-2, or EGFR was added (10 μg/ml),with the exception of the tube receiving the quad marker (this tubereceived antibodies for all four markers). All samples were then pro-cessed for nanoparticle labeling (100 nM) and analyzed by a singleoperator, according to sample preparation and sample analysis pro-tocols. For each biomarker, the “μNMR Value” was calculated asthe signal obtained from the “test” sample divided by the signalobtained from the corresponding “control” sample. “μNMR Value”ratios for both single markers and for the quad marker were obtainedfor 12 different cell lines (Figure 2).3) Detection sensitivity was examined by titration, using varyingnumbers of SKBR3 or SKOV3 cells spiked into a whole bloodsample obtained from a healthy donor. The performance of μNMRwas then compared to the standard clinical assay, CellSearch. Theexperiment was carried out using a split-sample procedure whereidentical samples were processed separately with either μNMR orCellSearch. The enumeration and identification of tumor cells iden-tified by CellSearch were performed independently at Brigham andWoman’s Hospital (Boston, MA). In the quad-μNMR experiment,cell recovery was calculated based on the number of nanoparticlesdetected on the tumor cell surface. In separate validation experi-ments, bulk cell loss was also assessed by flow cytometry; specifically,we counted the tumor cells and then used their size and fluorescenttags to gate and separate the cells from leukocytes (data not shown).
μNMR MeasurementsMeasurements were conducted using a portable μNMR system re-
cently developed for point-of-care operations [13,14]. The polarizingmagnetic field strength was 0.5 T. The transverse relaxation times weremeasured in 1- to 2-μl sample volumes. Carr-Purcell-Meiboom-Gill pulse sequences with the following parameters were used: echotime, 3 milliseconds; repetition time, 4 seconds; number of 180°pulses per scan, 900; number of scans, 7. All measurements wereperformed in triplicate, and data are displayed as mean ± standarderror of mean.
Data Analysis and StatisticsT 2 values were obtained in triplicate using the μNMR system. R2
values were calculated as the inverse of the mean T 2 values. The effectof media in the μNMR readout was accounted for by subtracting theR2 value of the media (1 × PBS/1% FBS) from either the values ob-
tained from the test (i.e., samples receiving antibody and CLIO forlabeling) or from the control (i.e., samples receiving only CLIO forbackground signal determination). The μNMR readout was sub-sequently calculated by dividing ΔR2
sample by ΔR2control to account
for any nonspecific binding of CLIO to cells. The μNMR valueserved as an expression level of the biomarkers.
Receiver operating characteristic (ROC) analysis was performedfor individual markers and for marker combinations. An Az (areaunder the ROC curve) of 0.5 was used to indicate no differences be-tween two groups, whereas an Az of 1.0 was used to indicate a perfectseparation between the groups. The optimal cutoff value for iden-tifying malignant status was then defined as the point on the ROCcurve with the minimum distance between the 0% false-negative andthe 100% true-positive.
A paired Student’s t test was used to evaluate the statistical sig-nificance between the percent cell recovery obtained by μNMRand that obtained by the CellSearch system. A 2 × 2 contingency anal-ysis, using the Fisher exact test, was used to evaluate μNMR for its abil-ity to detect CTCs in whole blood samples from both patients andhealthy controls.
Results
Defining the Detection Signature for Quad-μNMRThe heterogeneous nature of biomarker expression levels is a well-
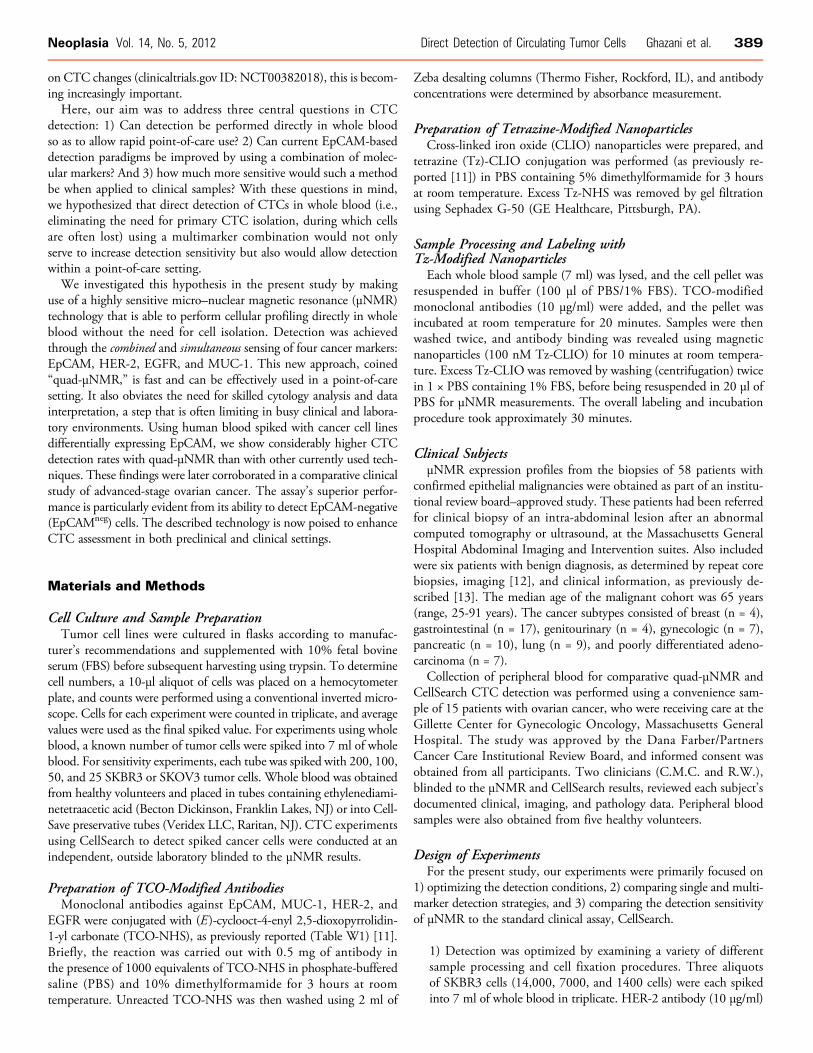
known phenomenon in cancer, and this served as the rationale for con-sidering multiple, rather than single, markers for CTC detection. Tobegin, we initially obtained samples from a cohort of patients (n = 58)who had undergone fine needle aspiration of their cancers. These sam-ples were then profiled for a number of markers including MUC-1,EGFR, B7-H3, HER-2, Ki-67, EpCAM, Vimentin, CK18, and p53.Statistical analysis (Spearman correlation and ROC curve) indicatedthat diagnostic information (malignant vs benign) could be achievedby using four key markers: EpCAM, MUC-1, HER-2, and EGFR(Figure 1). Although analysis of each protein individually revealed thata notable fraction of the samples were negative for single proteins(EpCAM, 34.4%; HER-2, 32.7%; MUC-1, 32.7%; and EGFR,31.0%; Figure 1A), combined marker analysis was able to correctlyidentify 99.2% of samples as malignant.
With this information, we developed a μNMR strategy for directlysensing CTCs in whole blood. This was achieved by first incubatingblood samples with a cocktail of four trans-cyclooctene (TCO)–labeled antibodies against each protein target, washing the cells,and then identifying antibody-positive cells using Tz-decorated mag-netic nanoparticles. This “cocktail” method of targeting cancer cellsnot only increases the chances of detecting single marker-negativepatients but also results in much higher magnetic nanoparticle bind-ing per cell; this leads to increased μNMR signals and better discrim-ination from background (Figure 1B). The method also eliminatesthe need for CTC capture or isolation; instead, CTCs are measureddirectly from a pellet of host cells. The nanoparticles also serve as anamplification strategy, influencing the relaxation times of billions ofsurrounding water molecules; these changes can be subsequentlymeasured by μNMR.
Optimization of μNMR for CTC DetectionOur initial aim was to optimize sample preparation to achieve di-
rect detection of cells in whole blood, while maximizing the μNMRsignal. We thus empirically discovered that cell detection in whole
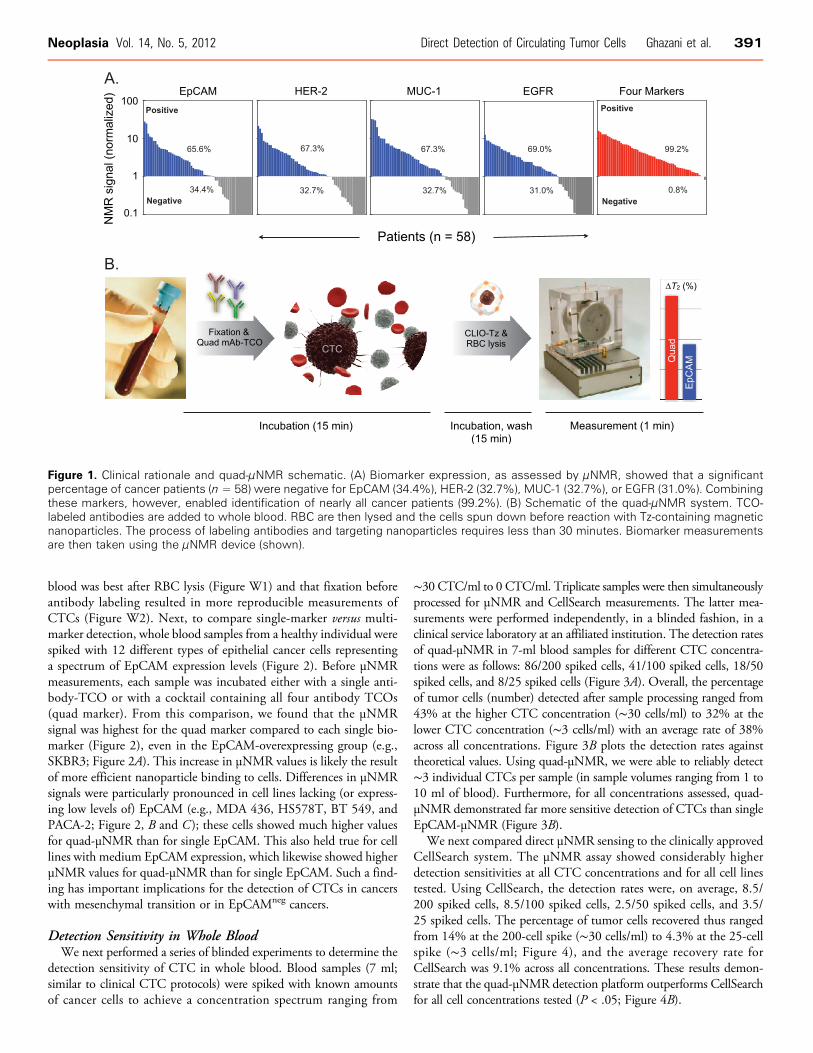
Figure 1. Clinical rationale and quad-μNMR schematic. (A) Biomarker expression, as assessed by μNMR, showed that a significantpercentage of cancer patients (n = 58) were negative for EpCAM (34.4%), HER-2 (32.7%), MUC-1 (32.7%), or EGFR (31.0%). Combiningthese markers, however, enabled identification of nearly all cancer patients (99.2%). (B) Schematic of the quad-μNMR system. TCO-labeled antibodies are added to whole blood. RBC are then lysed and the cells spun down before reaction with Tz-containing magneticnanoparticles. The process of labeling antibodies and targeting nanoparticles requires less than 30 minutes. Biomarker measurementsare then taken using the μNMR device (shown).
Neoplasia Vol. 14, No. 5, 2012 Direct Detection of Circulating Tumor Cells Ghazani et al. 391
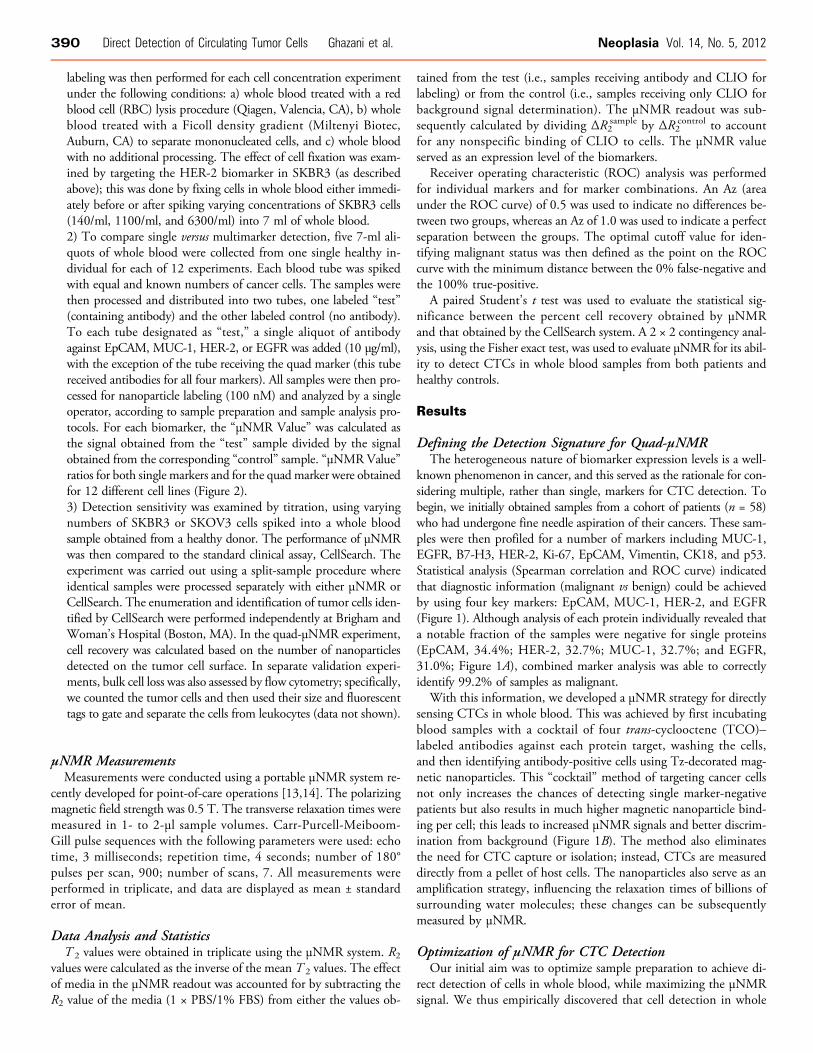
blood was best after RBC lysis (Figure W1) and that fixation beforeantibody labeling resulted in more reproducible measurements ofCTCs (Figure W2). Next, to compare single-marker versus multi-marker detection, whole blood samples from a healthy individual werespiked with 12 different types of epithelial cancer cells representinga spectrum of EpCAM expression levels (Figure 2). Before μNMRmeasurements, each sample was incubated either with a single anti-body-TCO or with a cocktail containing all four antibody TCOs(quad marker). From this comparison, we found that the μNMRsignal was highest for the quad marker compared to each single bio-marker (Figure 2), even in the EpCAM-overexpressing group (e.g.,SKBR3; Figure 2A). This increase in μNMR values is likely the resultof more efficient nanoparticle binding to cells. Differences in μNMRsignals were particularly pronounced in cell lines lacking (or express-ing low levels of) EpCAM (e.g., MDA 436, HS578T, BT 549, andPACA-2; Figure 2, B and C ); these cells showed much higher valuesfor quad-μNMR than for single EpCAM. This also held true for celllines with medium EpCAM expression, which likewise showed higherμNMR values for quad-μNMR than for single EpCAM. Such a find-ing has important implications for the detection of CTCs in cancerswith mesenchymal transition or in EpCAMneg cancers.
Detection Sensitivity in Whole BloodWe next performed a series of blinded experiments to determine the
detection sensitivity of CTC in whole blood. Blood samples (7 ml;similar to clinical CTC protocols) were spiked with known amountsof cancer cells to achieve a concentration spectrum ranging from
∼30 CTC/ml to 0 CTC/ml. Triplicate samples were then simultaneouslyprocessed for μNMR and CellSearch measurements. The latter mea-surements were performed independently, in a blinded fashion, in aclinical service laboratory at an affiliated institution. The detection ratesof quad-μNMR in 7-ml blood samples for different CTC concentra-tions were as follows: 86/200 spiked cells, 41/100 spiked cells, 18/50spiked cells, and 8/25 spiked cells (Figure 3A). Overall, the percentageof tumor cells (number) detected after sample processing ranged from43% at the higher CTC concentration (∼30 cells/ml) to 32% at thelower CTC concentration (∼3 cells/ml) with an average rate of 38%across all concentrations. Figure 3B plots the detection rates againsttheoretical values. Using quad-μNMR, we were able to reliably detect∼3 individual CTCs per sample (in sample volumes ranging from 1 to10 ml of blood). Furthermore, for all concentrations assessed, quad-μNMR demonstrated far more sensitive detection of CTCs than singleEpCAM-μNMR (Figure 3B).
We next compared direct μNMR sensing to the clinically approvedCellSearch system. The μNMR assay showed considerably higherdetection sensitivities at all CTC concentrations and for all cell linestested. Using CellSearch, the detection rates were, on average, 8.5/200 spiked cells, 8.5/100 spiked cells, 2.5/50 spiked cells, and 3.5/25 spiked cells. The percentage of tumor cells recovered thus rangedfrom 14% at the 200-cell spike (∼30 cells/ml) to 4.3% at the 25-cellspike (∼3 cells/ml; Figure 4), and the average recovery rate forCellSearch was 9.1% across all concentrations. These results demon-strate that the quad-μNMR detection platform outperforms CellSearchfor all cell concentrations tested (P < .05; Figure 4B).
Figure 2. Comparison of single and quad marker detection using μNMR. Quad-μNMR CTC targeting (red bars) in whole blood showedhigher NMR signals than single-marker CTC targeting (blue bars). For comparative purposes, the μNMR values are displayed as relativeratios. All measurements were obtained in triplicate (note narrow error bars). In all cell lines assessed, quad-μNMR consistently out-performed all single-μNMR detections. Most notably, quad-μNMR even outperformed EpCAM-μNMR in high- (A), intermediate- (B), andlow/negative- (C) EpCAM-expressing cell lines.
Figure 3. Detection sensitivity of quad-μNMR in whole blood compared with the clinical standard. Varying numbers of cancer cells (i.e.,200, 100, 50, and 25 cells) were spiked separately into 7-ml samples of blood from a healthy donor. Quad-μNMR measurements areshown as mean values. Quad-μNMR was able to detect 86/200 spiked cells, 41/100 spiked cells, 18/50 spiked cells, and 8/25 spikedcells. All μNMR measurements were done in triplicate for both test and control samples. (A) Quad-μNMR outperformed single markerEpCAM-μNMR for all cell concentrations assessed. (B) Observed values are plotted against theoretical values (gray line).
392 Direct Detection of Circulating Tumor Cells Ghazani et al. Neoplasia Vol. 14, No. 5, 2012
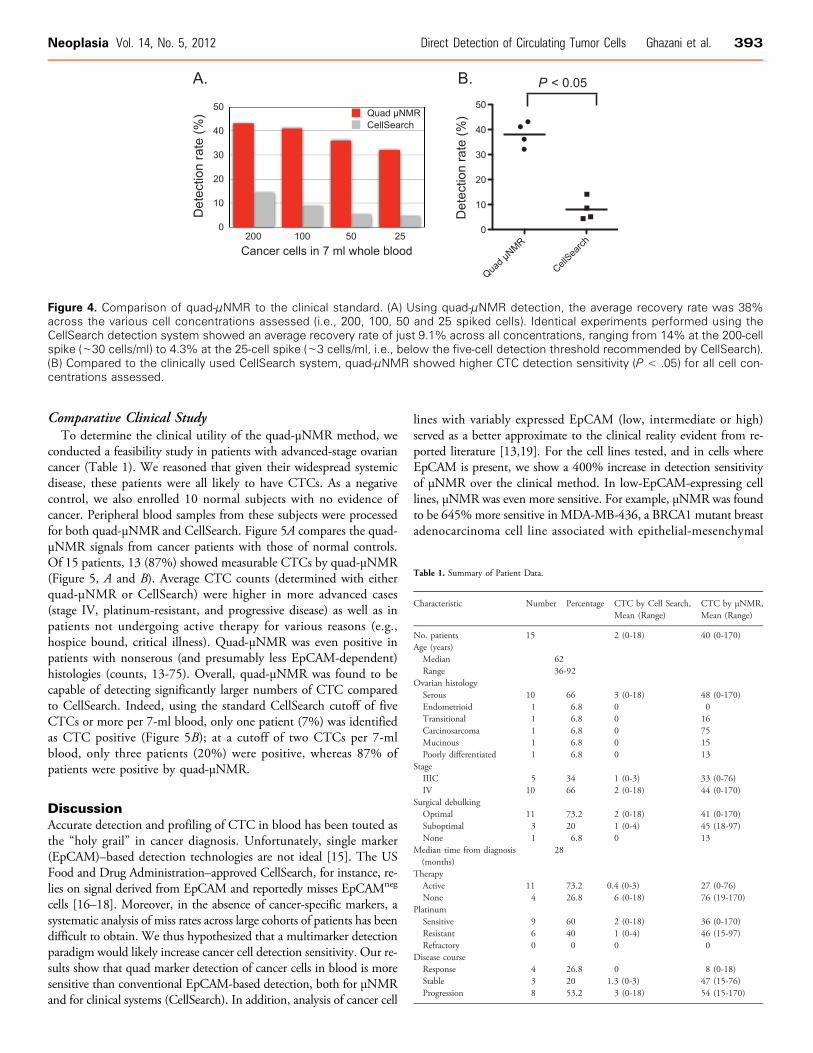
Figure 4. Comparison of quad-μNMR to the clinical standard. (A) Using quad-μNMR detection, the average recovery rate was 38%across the various cell concentrations assessed (i.e., 200, 100, 50 and 25 spiked cells). Identical experiments performed using theCellSearch detection system showed an average recovery rate of just 9.1% across all concentrations, ranging from 14% at the 200-cellspike (∼30 cells/ml) to 4.3% at the 25-cell spike (∼3 cells/ml, i.e., below the five-cell detection threshold recommended by CellSearch).(B) Compared to the clinically used CellSearch system, quad-μNMR showed higher CTC detection sensitivity (P < .05) for all cell con-centrations assessed.
Neoplasia Vol. 14, No. 5, 2012 Direct Detection of Circulating Tumor Cells Ghazani et al. 393
Comparative Clinical StudyTo determine the clinical utility of the quad-μNMR method, we
conducted a feasibility study in patients with advanced-stage ovariancancer (Table 1). We reasoned that given their widespread systemicdisease, these patients were all likely to have CTCs. As a negativecontrol, we also enrolled 10 normal subjects with no evidence ofcancer. Peripheral blood samples from these subjects were processedfor both quad-μNMR and CellSearch. Figure 5A compares the quad-μNMR signals from cancer patients with those of normal controls.Of 15 patients, 13 (87%) showed measurable CTCs by quad-μNMR(Figure 5, A and B). Average CTC counts (determined with eitherquad-μNMR or CellSearch) were higher in more advanced cases(stage IV, platinum-resistant, and progressive disease) as well as inpatients not undergoing active therapy for various reasons (e.g.,hospice bound, critical illness). Quad-μNMR was even positive inpatients with nonserous (and presumably less EpCAM-dependent)histologies (counts, 13-75). Overall, quad-μNMR was found to becapable of detecting significantly larger numbers of CTC comparedto CellSearch. Indeed, using the standard CellSearch cutoff of fiveCTCs or more per 7-ml blood, only one patient (7%) was identifiedas CTC positive (Figure 5B); at a cutoff of two CTCs per 7-mlblood, only three patients (20%) were positive, whereas 87% ofpatients were positive by quad-μNMR.
DiscussionAccurate detection and profiling of CTC in blood has been touted asthe “holy grail” in cancer diagnosis. Unfortunately, single marker(EpCAM)–based detection technologies are not ideal [15]. The USFood and Drug Administration–approved CellSearch, for instance, re-lies on signal derived from EpCAM and reportedly misses EpCAMneg
cells [16–18]. Moreover, in the absence of cancer-specific markers, asystematic analysis of miss rates across large cohorts of patients has beendifficult to obtain. We thus hypothesized that a multimarker detectionparadigm would likely increase cancer cell detection sensitivity. Our re-sults show that quad marker detection of cancer cells in blood is moresensitive than conventional EpCAM-based detection, both for μNMRand for clinical systems (CellSearch). In addition, analysis of cancer cell
lines with variably expressed EpCAM (low, intermediate or high)served as a better approximate to the clinical reality evident from re-ported literature [13,19]. For the cell lines tested, and in cells whereEpCAM is present, we show a 400% increase in detection sensitivityof μNMR over the clinical method. In low-EpCAM-expressing celllines, μNMR was even more sensitive. For example, μNMR was foundto be 645%more sensitive in MDA-MB-436, a BRCA1 mutant breastadenocarcinoma cell line associated with epithelial-mesenchymal
Table 1. Summary of Patient Data.
Characteristic
Number Percentage CTC by Cell Search,Mean (Range)CTC by μNMR,Mean (Range)
No. patients
15 2 (0-18) 40 (0-170) Age (years) Median 62 Range 36-92Ovarian histology
Serous 10 66 3 (0-18) 48 (0-170) Endometrioid 1 6.8 0 0 Transitional 1 6.8 0 16 Carcinosarcoma 1 6.8 0 75 Mucinous 1 6.8 0 15 Poorly differentiated 1 6.8 0 13Stage
IIIC 5 34 1 (0-3) 33 (0-76) IV 10 66 2 (0-18) 44 (0-170)Surgical debulking
Optimal 11 73.2 2 (0-18) 41 (0-170) Suboptimal 3 20 1 (0-4) 45 (18-97) None 1 6.8 0 13Median time from diagnosis(months)
28
Therapy
Active 11 73.2 0 .4 (0-3) 27 (0-76) None 4 26.8 6 (0-18) 76 (19-170)Platinum
Sensitive 9 60 2 (0-18) 36 (0-170) Resistant 6 40 1 (0-4) 46 (15-97) Refractory 0 0 0 0Disease course
Response 4 26.8 0 8 (0-18) Stable 3 20 1 .3 (0-3) 47 (15-76) Progression 8 53.2 3 (0-18) 54 (15-170)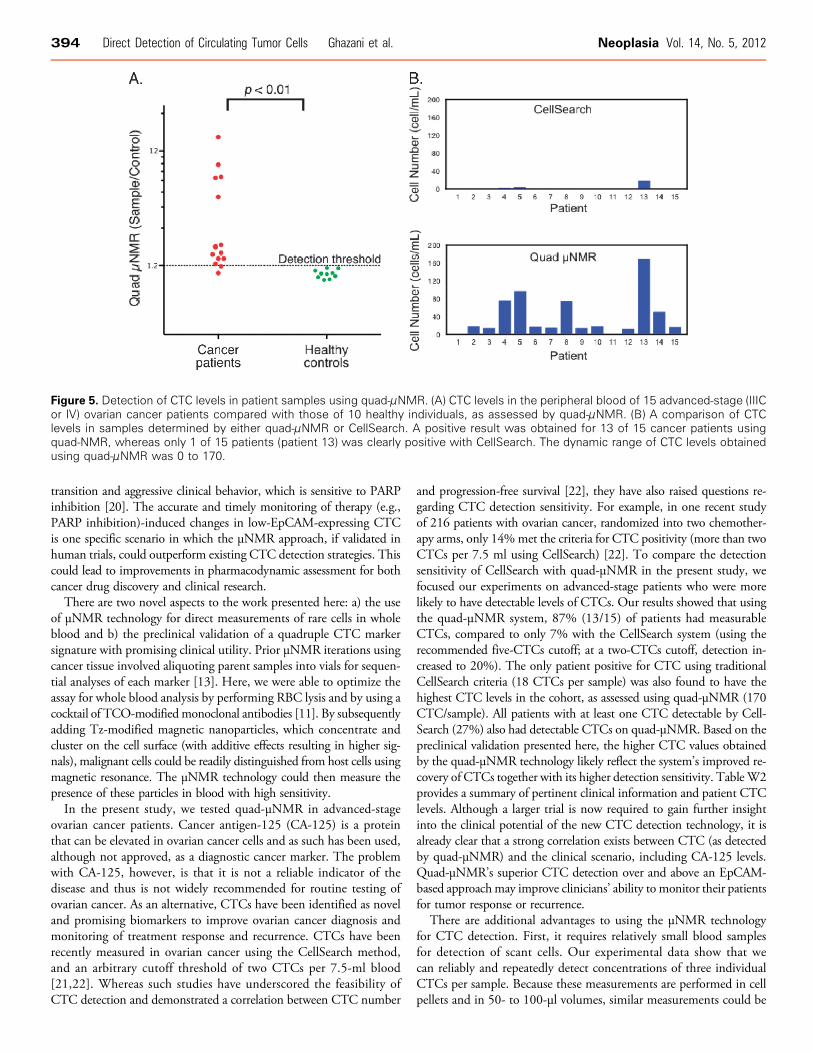
Figure 5. Detection of CTC levels in patient samples using quad-μNMR. (A) CTC levels in the peripheral blood of 15 advanced-stage (IIICor IV) ovarian cancer patients compared with those of 10 healthy individuals, as assessed by quad-μNMR. (B) A comparison of CTClevels in samples determined by either quad-μNMR or CellSearch. A positive result was obtained for 13 of 15 cancer patients usingquad-NMR, whereas only 1 of 15 patients (patient 13) was clearly positive with CellSearch. The dynamic range of CTC levels obtainedusing quad-μNMR was 0 to 170.
394 Direct Detection of Circulating Tumor Cells Ghazani et al. Neoplasia Vol. 14, No. 5, 2012
transition and aggressive clinical behavior, which is sensitive to PARPinhibition [20]. The accurate and timely monitoring of therapy (e.g.,PARP inhibition)-induced changes in low-EpCAM-expressing CTCis one specific scenario in which the μNMR approach, if validated inhuman trials, could outperform existing CTC detection strategies. Thiscould lead to improvements in pharmacodynamic assessment for bothcancer drug discovery and clinical research.
There are two novel aspects to the work presented here: a) the useof μNMR technology for direct measurements of rare cells in wholeblood and b) the preclinical validation of a quadruple CTC markersignature with promising clinical utility. Prior μNMR iterations usingcancer tissue involved aliquoting parent samples into vials for sequen-tial analyses of each marker [13]. Here, we were able to optimize theassay for whole blood analysis by performing RBC lysis and by using acocktail of TCO-modified monoclonal antibodies [11]. By subsequentlyadding Tz-modified magnetic nanoparticles, which concentrate andcluster on the cell surface (with additive effects resulting in higher sig-nals), malignant cells could be readily distinguished from host cells usingmagnetic resonance. The μNMR technology could then measure thepresence of these particles in blood with high sensitivity.
In the present study, we tested quad-μNMR in advanced-stageovarian cancer patients. Cancer antigen-125 (CA-125) is a proteinthat can be elevated in ovarian cancer cells and as such has been used,although not approved, as a diagnostic cancer marker. The problemwith CA-125, however, is that it is not a reliable indicator of thedisease and thus is not widely recommended for routine testing ofovarian cancer. As an alternative, CTCs have been identified as noveland promising biomarkers to improve ovarian cancer diagnosis andmonitoring of treatment response and recurrence. CTCs have beenrecently measured in ovarian cancer using the CellSearch method,and an arbitrary cutoff threshold of two CTCs per 7.5-ml blood[21,22]. Whereas such studies have underscored the feasibility ofCTC detection and demonstrated a correlation between CTC number
and progression-free survival [22], they have also raised questions re-garding CTC detection sensitivity. For example, in one recent studyof 216 patients with ovarian cancer, randomized into two chemother-apy arms, only 14%met the criteria for CTC positivity (more than twoCTCs per 7.5 ml using CellSearch) [22]. To compare the detectionsensitivity of CellSearch with quad-μNMR in the present study, wefocused our experiments on advanced-stage patients who were morelikely to have detectable levels of CTCs. Our results showed that usingthe quad-μNMR system, 87% (13/15) of patients had measurableCTCs, compared to only 7% with the CellSearch system (using therecommended five-CTCs cutoff; at a two-CTCs cutoff, detection in-creased to 20%). The only patient positive for CTC using traditionalCellSearch criteria (18 CTCs per sample) was also found to have thehighest CTC levels in the cohort, as assessed using quad-μNMR (170CTC/sample). All patients with at least one CTC detectable by Cell-Search (27%) also had detectable CTCs on quad-μNMR. Based on thepreclinical validation presented here, the higher CTC values obtainedby the quad-μNMR technology likely reflect the system’s improved re-covery of CTCs together with its higher detection sensitivity. TableW2provides a summary of pertinent clinical information and patient CTClevels. Although a larger trial is now required to gain further insightinto the clinical potential of the new CTC detection technology, it isalready clear that a strong correlation exists between CTC (as detectedby quad-μNMR) and the clinical scenario, including CA-125 levels.Quad-μNMR’s superior CTC detection over and above an EpCAM-based approachmay improve clinicians’ ability to monitor their patientsfor tumor response or recurrence.
There are additional advantages to using the μNMR technologyfor CTC detection. First, it requires relatively small blood samplesfor detection of scant cells. Our experimental data show that wecan reliably and repeatedly detect concentrations of three individualCTCs per sample. Because these measurements are performed in cellpellets and in 50- to 100-μl volumes, similar measurements could be
Neoplasia Vol. 14, No. 5, 2012 Direct Detection of Circulating Tumor Cells Ghazani et al. 395
performed in both larger blood volumes (to maximize the chance ofdetecting rare cells) as well as in blood samples as small as 100 μl.Using μNMR, we show an average CTC detection rate of 38%; thispercentage is approximately four to six times higher than thatobtained using the CellSearch system. It is likely that this detectionsensitivity could be yet further increased by using nanoparticles withhigher magnetic moments and by continuing to optimize the device.Second, the portability of the assay is truly point-of-care and readilyadaptable to the clinical scenario. Its modular use (TCO-labeled anti-bodies) could also be easily modified to include other cancer markersubsets. The use of this strategy for some targets may be obvious(TTF-1 for lung cancer, PSMA for prostate cancer populations),but perhaps the biggest improvement in detection sensitivity willcome from the detection of other emerging targets such as under-glycosylated and immaturely glycoslyated cancer cells [23], circulatingDNA [24], and/or of unique endothelial cell populations (e.g., breastcancer patients often have distinct CD34/VEGFR1 populations intheir peripheral circulation). Finally, μNMR represents a platformtechnology that could be multiplexed onto chips for the detectionof other diagnostic targets even beyond that of protein markers, forexample, circulating DNA or exosomes. Although these possibilitieswere not addressed in the present study, this is an area of ongoinginvestigation within our laboratory.Advances in CTC detection and profiling will undoubtedly con-
tribute to our understanding of human cancer biology. The μNMRassay in the present study will likely benefit such investigations. Akey remaining question is whether CTC levels and characteristics willbe useful for clinical decision making. The implications of such de-cisions are not trivial and demand robust and accurate profiling; thisis simply not possible using a single universal marker.
AcknowledgmentsThe authors thank N. Sergeyev for nanomaterial synthesis, T. Reinerfor preparing TCO, S. Hilderbrand for synthesizing reactive Tz,D. Issadore for μNMR developments, D. Kindleberger and A. Lyfor CellSearch measurements, and Y. Fisher-Jeffes for article editing.The authors also thank M. Birrer, R. Penson, and C. Krasner for help-ing to identify patients for peripheral blood collection. The authors areparticularly indebted to Daniel Haber and Mehmet Toner for theirmany valuable discussions and experiment suggestions.
References[1] van de Stolpe A, Pantel K, Sleijfer S, Terstappen LW, and den Toonder JM
(2011). Circulating tumor cell isolation and diagnostics: toward routine clinicaluse. Cancer Res 71, 5955–5960.
[2] Nagrath S, Sequist LV, Maheswaran S, Bell DW, Irimia D, Ulkus L, SmithMR, Kwak EL, Digumarthy S, Muzikansky A, et al. (2007). Isolation of rarecirculating tumour cells in cancer patients by microchip technology. Nature450, 1235–1239.
[3] Pantel K, Brakenhoff RH, and Brandt B (2008). Detection, clinical relevanceand specific biological properties of disseminating tumour cells. Nat Rev Cancer8, 329–340.
[4] Armstrong AJ, Marengo MS, Oltean S, Kemeny G, Bitting RL, Turnbull JD,Herold CI, Marcom PK, George DJ, and Garcia-Blanco MA (2011). Circulat-ing tumor cells from patients with advanced prostate and breast cancer displayboth epithelial and mesenchymal markers. Mol Cancer Res 9, 997–1007.
[5] Cohen SJ, Punt CJA, Iannotti N, Saidman BH, Sabbath KD, Gabrail NY,Picus J, Morse M, Mitchell E, Miller MC, et al. (2008). Relationship ofcirculating tumor cells to tumor response, progression-free survival, and over-
all survival in patients with metastatic colorectal cancer. J Clin Oncol 26,3213–3221.
[6] Cristofanilli M, Budd GT, Ellis MJ, Stopeck A, Matera J, Miller MC, ReubenJM, Doyle GV, Allard WJ, Terstappen LW, et al. (2004). Circulating tumorcells, disease progression, and survival in metastatic breast cancer. N Engl JMed 351, 781–791.
[7] de Bono JS, Scher HI, Montgomery RB, Parker C, Miller MC, Tissing H,Doyle GV, Terstappen LW, Pienta KJ, and Raghavan D (2008). Circulatingtumor cells predict survival benefit from treatment in metastatic castration-resistant prostate cancer. Clin Cancer Res 14, 6302–6309.
[8] Krebs MG, Sloane R, Priest L, Lancashire L, Hou JM, Greystoke A, Ward TH,Ferraldeschi R, Hughes A, Clack G, et al. (2011). Evaluation and prognosticsignificance of circulating tumor cells in patients with non–small-cell lungcancer. J Clin Oncol 29, 1556–1563.
[9] Maheswaran S, Sequist LV, Nagrath S, Ulkus L, Brannigan B, Collura CV,Inserra E, Diederichs S, Iafrate AJ, Bell DW, et al. (2008). Detection of muta-tions in EGFR in circulating lung-cancer cells. N Engl J Med 359, 366–377.
[10] Giljohann DA and Mirkin CA (2009). Drivers of biodiagnostic development.Nature 462, 461–464.
[11] Haun JB, Devaraj NK, Hilderbrand SA, Lee H, and Weissleder R (2010).Bioorthogonal chemistry amplifies nanoparticle binding and enhances the sen-sitivity of cell detection. Nat Nanotechnol 5, 660–665.
[12] De Giorgi U, Valero V, Rohren E, Mego M, Doyle GV, Miller MC, Ueno NT,Handy BC, Reuben JM, Macapinlac HA, et al. (2010). Circulating tumor cellsand bone metastases as detected by FDG-PET/CT in patients with metastaticbreast cancer. Ann Oncol 21, 33–39.
[13] Haun JB, Castro CM, Wang R, Peterson VM, Marinelli BS, Lee H, andWeissleder R (2011). Micro-NMR for rapid molecular analysis of human tumorsamples. Sci Transl Med 3, 71ra16.
[14] Issadore D, Min C, Liong M, Chung J, Weissleder R, and Lee H (2011).Miniature magnetic resonance system for point-of-care diagnostics. Lab Chip11, 2282–2287.
[15] Konigsberg R, Obermayr E, Bises G, Pfeiler G, Gneist M, Wrba F, de Santis M,Zeillinger R, Hudec M, and Dittrich C (2011). Detection of EpCAM positiveand negative circulating tumor cells in metastatic breast cancer patients. ActaOncol 50, 700–710.
[16] Mostert B, Kraan J, Bolt-de Vries J, van der Spoel P, Sieuwerts AM, Schutte M,Timmermans AM, Foekens R, Martens JW, Gratama JW, et al. (2011). Detec-tion of circulating tumor cells in breast cancer may improve through enrichmentwith anti-CD146. Breast Cancer Res Treat 127, 33–41.
[17] Sieuwerts AM, Kraan J, Bolt J, van der Spoel P, Elstrodt F, Schutte M, MartensJW, Gratama JW, Sleijfer S, and Foekens JA (2009). Anti–epithelial cell adhe-sion molecule antibodies and the detection of circulating normal-like breasttumor cells. J Natl Cancer Inst 101, 61–66.
[18] Sieuwerts AM, Mostert B, Bolt-de Vries J, Peeters D, de Jongh FE, StouthardJM, Dirix LY, van Dam PA, Van Galen A, de Weerd V, et al. (2011). mRNAand microRNA expression profiles in circulating tumor cells and primary tumorsof metastatic breast cancer patients. Clin Cancer Res 17, 3600–3618.
[19] Went PT, Lugli A, Meier S, Bundi M, Mirlacher M, Sauter G, and Dirnhofer S(2004). Frequent EpCam protein expression in human carcinomas. Hum Pathol35, 122–128.
[20] Blick T, Widodo E, Hugo H, Waltham M, Lenburg ME, Neve RM, andThompson EW (2008). Epithelial mesenchymal transition traits in humanbreast cancer cell lines. Clin Exp Metastasis 25, 629–642.
[21] Behbakht K, Sill MW, Darcy KM, Rubin SC, Mannel RS, Waggoner S,Schilder RJ, Cai KQ, Godwin AK, and Alpaugh RK (2011). Phase II trial ofthe mTOR inhibitor, temsirolimus and evaluation of circulating tumor cells andtumor biomarkers in persistent and recurrent epithelial ovarian and primaryperitoneal malignancies: a Gynecologic Oncology Group study. Gynecol Oncol123, 19–26.
[22] Poveda A, Kaye SB, McCormack R, Wang S, Parekh T, Ricci D, LebedinskyCA, Tercero JC, Zintl P, and Monk BJ (2011). Circulating tumor cells predictprogression free survival and overall survival in patients with relapsed/recurrentadvanced ovarian cancer. Gynecol Oncol 122, 567–572.
[23] Meany DL and Chan DW (2011). Aberrant glycosylation associated with en-zymes as cancer biomarkers. Clin Proteomics 8, 7.
[24] Hanash SM, Baik CS, and Kallioniemi O (2011). Emerging molecular biomarkers—blood-based strategies to detect and monitor cancer. Nat Rev Clin Oncol 8,142–150.
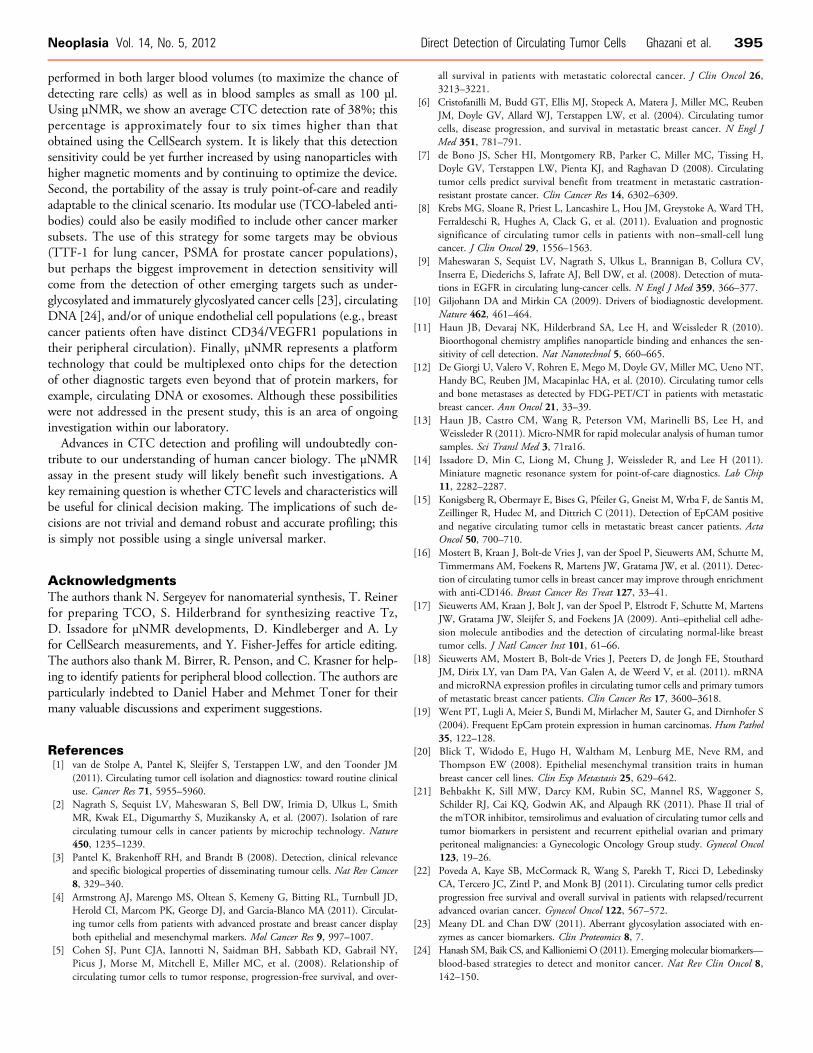
Figure W1. Effect of media on μNMR detection. Three aliquots ofSKBR3 cells (200/ml, 1000/ml, and 2000/ml) were each spiked into7-ml samples of whole blood. Cancer cells were then targeted us-ing the HER-2 antibody in untreated whole blood (red line), wholeblood treated with Ficoll (blue line), and whole blood treated with aRBC lysis procedure (green line). Compared to the other methods,RBC cell lysis treatment resulted in higher detectable μNMR sig-nals and was thus adopted for subsequent comparisons.
Figure W2. Effect of fixation on μNMR detection. Three aliquots ofSKBR3 cells (140/ml, 1100/ml, and 6300/ml) were spiked into 7-mlsamples of whole blood for duplicate experiments. In these experi-ments, cell fixation was done either before (blue line) or after (redline) labeling with the HER-2 antibody. μNMR data show that cellfixation before labeling produces better results.
Table W1. List of Antibodies and Their Associated Characteristics Relevant to the Study.
Marker
Clone Species Isotype MW MW (TCO) TCO Valency CompanyEpCAM
158206 Mouse IgG2b 150,600 ± 300 152,100 ± 200 9.7 R&D Systems (Minneapolis, MN) HER2 Trastuzumab Human IgG1 148,700 ± 300 152,300 ± 400 23.2 Genentech (San Francisco, CA) EGFR Cetuximab Hu/Ms NA 152,400 ± 300 153,800 ± 200 9.2 Imclone Systems (New York, NY) MUC-1 M01102909 Mouse IgG1 151,900 ± 200 152,600 ± 200 4.8 Fitzgerald Ind. (Acton, MA)Table W2. Selected Clinical Scenarios Illustrating the Potential Utility of Quad-μNMR.
Clinical Scenario
Subject No. CA-125 Cell SearchCTCQuad-NMRCTC
Quad Value
Stage IV
8 11 0 15 1.38 11 17 0 13 1.24 6 57 0 16 1.5 7 99 0 75 6.96 2 139 0 19 1.82 1 145 0 0 1.03 5 145 0 18 1.73 15 307 0 15 1.38 12 1123 18 170 15.9 4 1142 4 97 9.09Progressive disease
14 48 0 17 1.55 6 57 0 16 1.5 7 99 0 75 6.96 2 139 0 19 1.82 15 307 0 15 1.38 12 1123 18 170 15.9 4 1142 4 97 9.09 9 1707 0 19 1.77Any CellSearch positive
13 136 1 51 4.75 3 895 3 76 7.11 12 1123 18 170 15.9 4 1142 4 97 9.09


![FLAC [1ex]Context-Sensitive Grammarsflac/pdf/lect-20.pdf · FLAC Context-Sensitive Grammars Klaus Sutner Carnegie Mellon Universality Fall 2017](https://static.fdocument.org/doc/165x107/5af8735b7f8b9aff288bd145/flac-1excontext-sensitive-flacpdflect-20pdfflac-context-sensitive-grammars.jpg)