Tumor Evasion of the Immune System by Converting CD4 CD25 T ...
Wayne State University
Wayne State University Theses
1-1-2012
Modulation Of Anti-Tumor Immune Response ByTgf-Β-Inducible Early Gene 1 (tieg1)Andi CaniWayne State University,
Follow this and additional works at: http://digitalcommons.wayne.edu/oa_theses
This Open Access Thesis is brought to you for free and open access by DigitalCommons@WayneState. It has been accepted for inclusion in WayneState University Theses by an authorized administrator of DigitalCommons@WayneState.
Recommended CitationCani, Andi, "Modulation Of Anti-Tumor Immune Response By Tgf-Β-Inducible Early Gene 1 (tieg1)" (2012). Wayne State UniversityTheses. Paper 202.
MODULATION OF ANTI-TUMOR IMMUNE RESPONSE BY TGF-β-INDUCIBLE EARLY GENE 1 (TIEG1)
by
ANDI CANI
THESIS
Submitted to the Graduate School
of Wayne State University,
Detroit, Michigan
in partial fulfillment of the requirements
for the degree of
MASTER OF SCIENCE
2012
MAJOR: BIOCHEMISTRY AND MOLECULAR BIOLOGY
Approved by:
_____________________________________ Advisor Date

ii
DEDICATION
To my family,
for their love and support in every step of my life.
iii
ACKNOWLEDGEMENTS
Thanks to:
• Thesis advisor: Dr. Wei-Zen Wei, Karmanos Cancer Institute and Department of
Oncology, Wayne State University School of Medicine – for her scientific
guidance and career advice. Thanks for having me on the team.
• Thesis committee members: Dr. Chunying Li, Dr. Ladislau Kovari, Dr. Maik
Hüttemann, Department of Biochemistry and Molecular Biology, Wayne State
University School of Medicine – for their time and careful scientific supervision of
this project as well as advice on academic and career matters during my time in
the program.
• Project advisors: Dr. Venuprasad Poojary, Karmanos Cancer Institute and
Department of Oncology, Wayne State University School of Medicine – for
generously providing the TIEG1 knockout mice and valuable advice on this
project. Dr. Yi-chi Kong, Department of Immunology and Microbiology, Wayne
State University School of Medicine – for her scientific input and encouragement
during my time in the program
• Statistics advisor: Dr. Judith Abrams, Director of Biostatistics Core, Karmanos
Cancer Institute – for providing her expertise in analysis of key data.
iv
• Original generator of TIEG1 knockout mice: Dr. Thomas Spelsberg, Department
of Biochemistry and Molecular Biology, Mayo Clinic
• Current and former Wei lab members: Special thanks to Joyce Reyes, MS for
initial characterization of the TIEG1-/- mouse line and continued efforts on
elucidating further the mechanisms of their immune response; also thanks to
Ilham Bettahi, PhD; Heather Gibson, PhD; Jennifer Oliver, PhD; Richard
Jones, PhD; Jonathan Ringler, MS; Brian Frenzell; Jesse Veenstra; Marie
Piechocki, PhD; Jennifer Jacob, PhD; Paula Whittington, MD, PhD.
• Division of Laboratory Animal Resources, Wayne State University
• Students, Faculty and Staff of the Department of Biochemistry and Molecular
Biology, Wayne State University School of Medicine.
v
TABLE OF CONTENTS
Dedication …………………………………………………………………………….. ii
Acknowledgements ………………………………………………………………….. iii
List of Figures ………………………………………………………………………… vii
Chapter 1. Introduction ……………………………...………………………………. 1
1.1 Cancer Immunotherapy ......................................................................... 1
1.2 Her-2 positive cancers and DNA vaccination ........................................ 3
1.3 The Immune System: B cells ................................................................. 6
1.4 The Immune System: T cells ................................................................. 8
1.5 The Immune System: Immune Suppression ......................................... 11
1.6 Inducible Regulatory T cells, TGF-β and Cancer .................................. 14
1.7 TGF-β-inducible early gene 1 (TIEG1) .................................................. 16
Chapter 2. Materials and Methods ………..…………………….……………...….. 20
Chapter 3. Results …………..………………………………………….………….... 25
3.1 PCR Genotyping of TIEG1-/- Line ......................................................... 25
3.2 Allogeneic Splenocyte Immunization ..................................................... 27
3.3 Immunization with Her-2-Expressing Tumor Cells ................................ 32
vi
3.4 Her-2 DNA Vaccination ......................................................................... 34
3.5 IgG Subclass in Her-2 DNA Vaccination ............................................... 37
3.6 In Vivo B Cell Numbers and In Vitro Proliferation .................................. 39
3.7 Natural Treg and Myeloid-Derived Suppressor Cells ............................ 41
3.8 Tumor Growth ....................................................................................... 43
3.9 TIEG1 Selection …………………........................................................... 47
Chapter 4. Discussion …………………………………………………….…………. 50
Appendix …………………………………………………………………….…..….… 56
References ………………………………………………………………………….... 59
Abstract …………………………………………………………….…………………. 70
Autobiographical Statement …………………………………………..………....…. 72
vii
LIST OF FIGURES
Figure 1.1 The Her-2 oncoprotein ………………………………………….…….. 4
Figure 1.2 DNA vaccination ………………………………………………….….… 5
Figure 1.3 The humoral immune response ………………………………….…... 8
Figure 1.4 The cellular immune response ………………………………………. 10
Figure 1.5 Immunosuppressive mechanisms …………………………………… 12
Figure 1.6 TGF-β induction of Foxp3 via TIEG1 in naïve CD4+ T cells ……… 18
Figure 3.1 Generation and genotyping of TIEG1-/- mouse line ………...…….. 26
Figure 3.2 Allogeneic Splenocyte Immunization …………………...…………... 31
Figure 3.3 Immunization with Her-2-Expressing Tumor Cells ……..………….. 34
Figure 3.4 Her-2 DNA Vaccination …………………………….…………………. 37
Figure 3.5 IgG Subclass in Her-2 DNA Vaccination ………………………..….. 39
Figure 3.6 In Vivo B Cell Numbers and In Vitro Proliferation …...…….………. 40
Figure 3.7 Natural Treg and Myeloid-Derived Suppressor Cells ………….….. 42
Figure 3.8 Tumor Growth ………………………………….……………...………. 46
Figure 3.9 TIEG1-/-Selection ….……………….………………………….……… 48
1
CHAPTER 1
INTRODUCTION
1.1 Cancer Immunotherapy
Cancer immunotherapy, or the use of the immune system to fight tumors, has
emerged as a promising strategy in the war on cancer in the last decade. However,
different forms of immunotherapy in clinical trials, aimed at boosting antitumor immunity,
have been only partially successful and have generally failed to trigger an immune
response sufficient to eradicate all cancer cells, especially in patients with advanced
disease1. This is usually attributed to the organism’s inability to mount a robust effector
antitumor immune response. A growing tumor does not usually go unnoticed by the
immune system, although the response is relatively weak2. Various immunotherapy
techniques take advantage of this response by providing help in the form of vaccines,
adjuvants or passive transfer of immune effector components. One major obstacle
encountered however, is that the immune response induced is relatively weak because
the immune system is somewhat tolerant to immunogenic molecules on the tumor
surface named tumor associated antigens (TAA). This may be due to the fact that these
antigens are simply normal self-proteins expressed in greater quantity or mutated self-
proteins with only slight variations in structure. In addition, unlike a bacterial or viral
infection, TAAs are usually found in a weakly immunogenic context, making them poor
activators of the immune system. Vaccine and adjuvant strategies that are aimed at
increasing their immunogenicity usually have only moderate effects in enhancing the
immune response3. In a different mechanism, the tumor itself, with its high capability for
2
mutation, will adapt by “hiding” its TAAs and/or downregulating expression of the major
histocompatibility complex (MHC), (a molecule that enables the immune system to “see”
these antigens), via a phenomenon called immune evasion. This is the case in triple-
negative breast cancer, which lacks expression the surface antigens: estrogen and
progesterone receptors as well as the epidermal growth factor receptor Her-24.
While poor response to self-proteins and immune evasion are important obstacles,
perhaps the main barrier to cancer immunotherapy remains the suppression of the
immune system, a mechanism that is directed in large part by the tumor itself and takes
place in the surrounding environment5. The tumor microenvironment (TME) is an area
of relative proximity to the tumor, characterized by an interaction of cancer cells with
cells in the surrounding normal tissue, the immune system as well as various
components of the extracellular matrix and soluble cell signaling factors. Tumor cells
direct the components of the TME to work in its favor by suppressing the immune
system, among other mechanisms67. One way is by induction of enzymes such as
indoleamine 2,3-dioxygenase or arginase that have the effect of starving the immune
cells of important biochemical building blocks as well as triggering of direct
immunosuppressive pathways8. Another important mechanism is the release of soluble
factors (called cytokines) with suppressive function such as transforming growth factor
beta (TGF-β) and interleukin-10 (IL-10)9 10. These cytokines act primarily by recruiting or
converting immune cells whose duty is to suppress the effector cells of the immune
system. Prominent among these are the regulatory T cells (Treg)11, which are
characterized by expression of the master transcription factor Foxp3 and by their ability
to dampen an overly stimulated immune response, maintain tolerance to self antigens
3
as well as enable tumor immune escape12 13. Overcoming this suppression by Treg in
order to generate a stronger immune response and better anti-tumor protection remains
one of the main goals of cancer immunotherapy.
1.2 Her-2 positive cancers and DNA vaccination
Her-2, also known as ErbB-2 or E2, is an important proto-oncogene and tumor
associated antigen (TAA). It is the second of the four-member family of ErbB receptors
where another prominent member is Epidermal Growth Factor Receptor (EGFR or Her-
1). The human ErbB-2 homologue Her-2, a 185 kDa transmembrane protein14 whose
version in the rat is called neu, is found at moderate levels in normal cells and
participates in tissue growth and organ formation. Excessive Her-2 signaling however
contributes to malignant growth and this receptor was shown to be indeed
overexpressed in various types of cancer, notably in 25-30% of breast malignancies as
well as in ovarian tumors15. Gene amplification is responsible for Her-2 overexpression
in some but not all tumor cases. Regardless of the mechanism however, excessive Her-
2 expression has been associated with more aggressive cancers16. Upon dimerization
with other ErbB family members on the cell surface, Her-2 will transduce signaling
through its receptor tyrosine kinase activity to the PI3 and MAP kinase pathways to
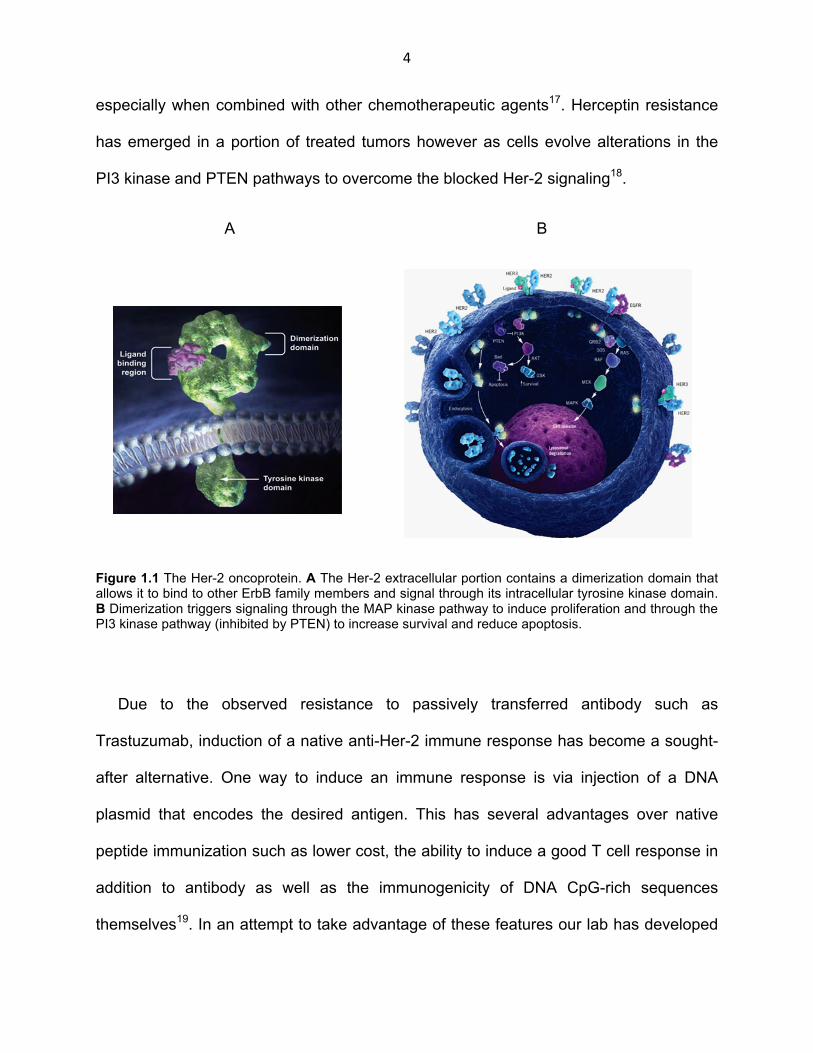
increase cell survival and proliferation and inhibit apoptosis (Fig. 1.1 A, B). Anti-Her-2
antibody has been detected in cancer patients and Her-2 has become an important
immunogenic TAA. In fact, treatment with humanized monoclonal anti-Her-2 antibody
Trastuzumab (Herceptin) that blocks receptor activity has shown some clinical efficacy
4
especially when combined with other chemotherapeutic agents17. Herceptin resistance
has emerged in a portion of treated tumors however as cells evolve alterations in the
PI3 kinase and PTEN pathways to overcome the blocked Her-2 signaling18.
A B
Figure 1.1 The Her-2 oncoprotein. A The Her-2 extracellular portion contains a dimerization domain that allows it to bind to other ErbB family members and signal through its intracellular tyrosine kinase domain. B Dimerization triggers signaling through the MAP kinase pathway to induce proliferation and through the PI3 kinase pathway (inhibited by PTEN) to increase survival and reduce apoptosis.
Due to the observed resistance to passively transferred antibody such as
Trastuzumab, induction of a native anti-Her-2 immune response has become a sought-
after alternative. One way to induce an immune response is via injection of a DNA
plasmid that encodes the desired antigen. This has several advantages over native
peptide immunization such as lower cost, the ability to induce a good T cell response in
addition to antibody as well as the immunogenicity of DNA CpG-rich sequences
themselves19. In an attempt to take advantage of these features our lab has developed
5
several variants of a Her-2 DNA vaccine. These include a version that encodes a
mutated Her-2 at the intracellular domain tyrosine kinase active site (pE2A), a truncated
protein that is missing the intracellular domain entirely (pE2TM) as well as a secreted
version that has only part of the extracellular domain (psecE2)20. In addition, a fusion
DNA vaccine between Her-2 and its rat homologue neu was generated (pE2N), which
induced the strongest anti-Her-2 immune response and protection from tumor in mice21.
Vaccination of human Her-2 positive breast cancer patients with pE2A in a pilot clinical
trial demonstrated vaccine safety and long-lasting anti-Her-2 immune response19.
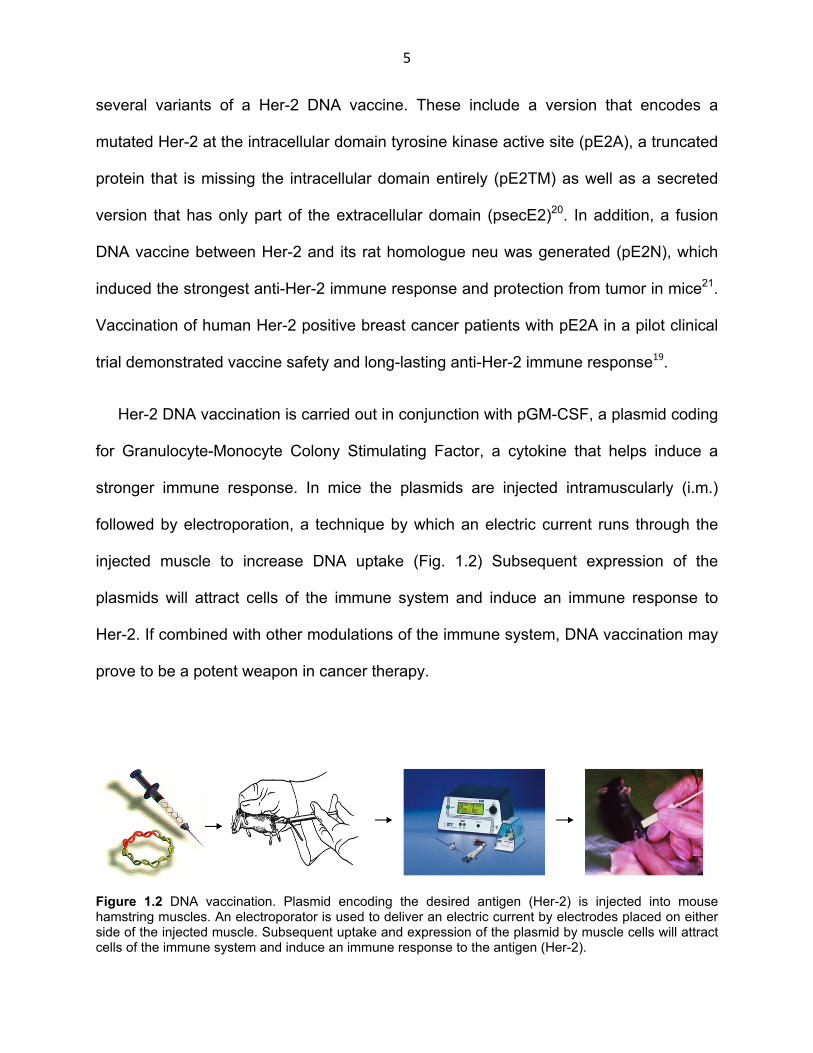
Her-2 DNA vaccination is carried out in conjunction with pGM-CSF, a plasmid coding
for Granulocyte-Monocyte Colony Stimulating Factor, a cytokine that helps induce a
stronger immune response. In mice the plasmids are injected intramuscularly (i.m.)
followed by electroporation, a technique by which an electric current runs through the
injected muscle to increase DNA uptake (Fig. 1.2) Subsequent expression of the
plasmids will attract cells of the immune system and induce an immune response to
Her-2. If combined with other modulations of the immune system, DNA vaccination may
prove to be a potent weapon in cancer therapy.
Figure 1.2 DNA vaccination. Plasmid encoding the desired antigen (Her-2) is injected into mouse hamstring muscles. An electroporator is used to deliver an electric current by electrodes placed on either side of the injected muscle. Subsequent uptake and expression of the plasmid by muscle cells will attract cells of the immune system and induce an immune response to the antigen (Her-2).
6
1.3 The Immune System: B cells
The most common role of the different components of the immune system is to clear
infections by pathogenic microorganisms. It is these same cells and soluble products of
the immune system that carry out an anti-cancer immune response as well. In either
case the effector response can be categorized into humoral (soluble) or cellular22. The
humoral immune response is based on the action of antibodies, small globular proteins
produced by B cells that recognize and bind to their specific target. The cellular arm of
the immune system on the other hand works by the direct action of T cells in killing
specific target cells or by releasing mediators that direct other components of the
immune system and coordinate the entire response. Both of these branches of an
effector immune response are important for successful cancer immunotherapy23.
The B cells are generated in the bone marrow from hematopoietic stem cells (HSC)
and they undergo several maturation steps until they become capable of producing
antibody in response to antigenic stimuli. Starting out as pro-B cells, they rearrange
their antibody genes in a random fashion in order to generate antibodies specific to a
particular portion of a foreign molecule (epitope), at which stage they are called pre-B
cells. Once a productive antibody gene rearrangement is complete and can be
expressed on the cell surface as a B cell receptor (BCR), the cell is defined as an
immature B cell. After further differentiation and selection, the B cell leaves the bone
marrow to go to the spleen and lymph nodes in the periphery as a functional, non-self-
reactive, naïve (or mature) B cell where it will wait for eventual encounter with an
antigen via its BCR. Upon proper stimulation the B cell will be induced to produce
antibody which will bind with great affinity to the epitope on the target antigen. This can
7
cause elimination of the target cell simply by neutralizing it from carrying out its actions,
calling in another system of plasma proteins called complement to lyse the cell or by
marking the cell for phagocytosis by other cells of the immune system (opsonization)
(Fig. 1.3 A).
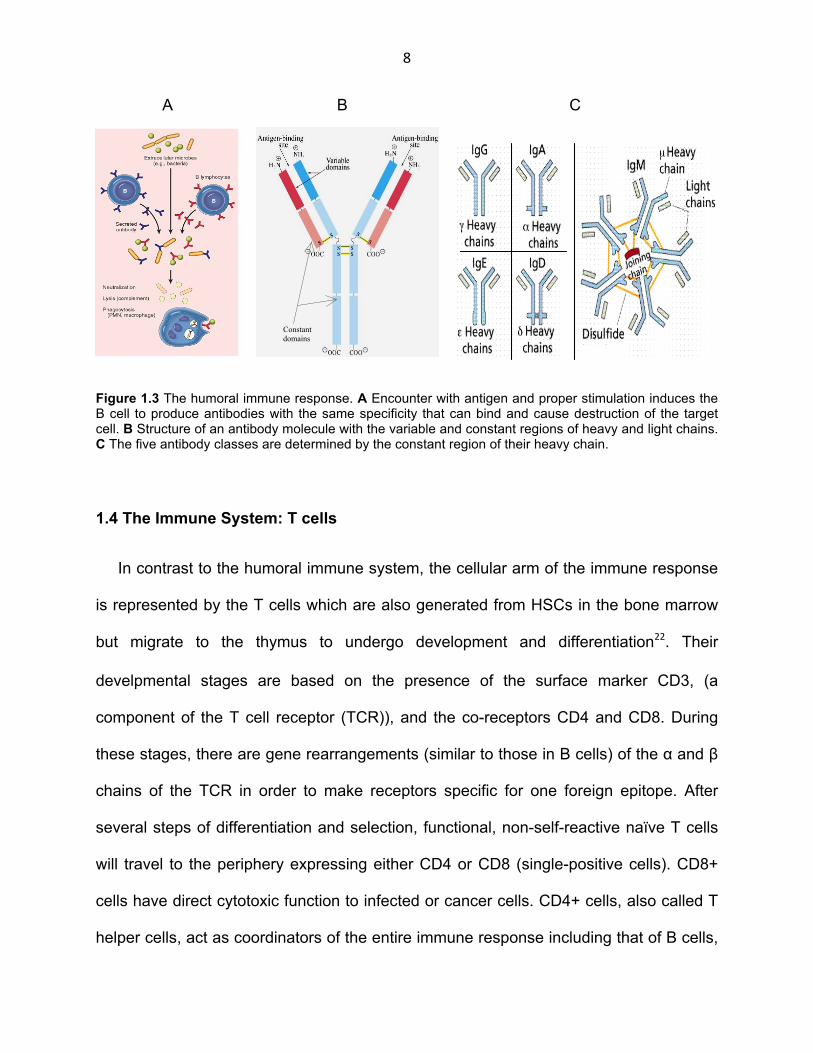
An antibody is a protein composed of globular structures called immunoglobulin
domains and contains two heavy and two light chains held together by disulfide bonds.
Each has a variable N-terminus region which recognizes the antigen and a constant C-
terminus region which, in the case of the heavy chain, determines the antibody type or
class (Fig. 1.3 B, C). There are five classes of antibody, IgG, IgA, IgE, IgD and IgM
corresponding to γ, α, ε, δ and µ heavy chains. The class determines the function of the
antibody with respect to the stage of the immune response or the body tissue where the
antibody is most active. In addition, each class can comprise more subclasses
representing more minor variations in their heavy chain such as the IgG1, 2, 3 and 4
subclasses of IgG. These also differ in the type of response, their abundance as well as
the stage of the immune response they partake in22.
8
A B C
Figure 1.3 The humoral immune response. A Encounter with antigen and proper stimulation induces the B cell to produce antibodies with the same specificity that can bind and cause destruction of the target cell. B Structure of an antibody molecule with the variable and constant regions of heavy and light chains. C The five antibody classes are determined by the constant region of their heavy chain.
1.4 The Immune System: T cells
In contrast to the humoral immune system, the cellular arm of the immune response
is represented by the T cells which are also generated from HSCs in the bone marrow
but migrate to the thymus to undergo development and differentiation22. Their
develpmental stages are based on the presence of the surface marker CD3, (a
component of the T cell receptor (TCR)), and the co-receptors CD4 and CD8. During
these stages, there are gene rearrangements (similar to those in B cells) of the α and β
chains of the TCR in order to make receptors specific for one foreign epitope. After
several steps of differentiation and selection, functional, non-self-reactive naïve T cells
will travel to the periphery expressing either CD4 or CD8 (single-positive cells). CD8+
cells have direct cytotoxic function to infected or cancer cells. CD4+ cells, also called T
helper cells, act as coordinators of the entire immune response including that of B cells,
Constant domains
9
cytotoxic CD8 T cells and other cells by virtue of cytokines, the soluble products they
release (Fig. 1.4 A).
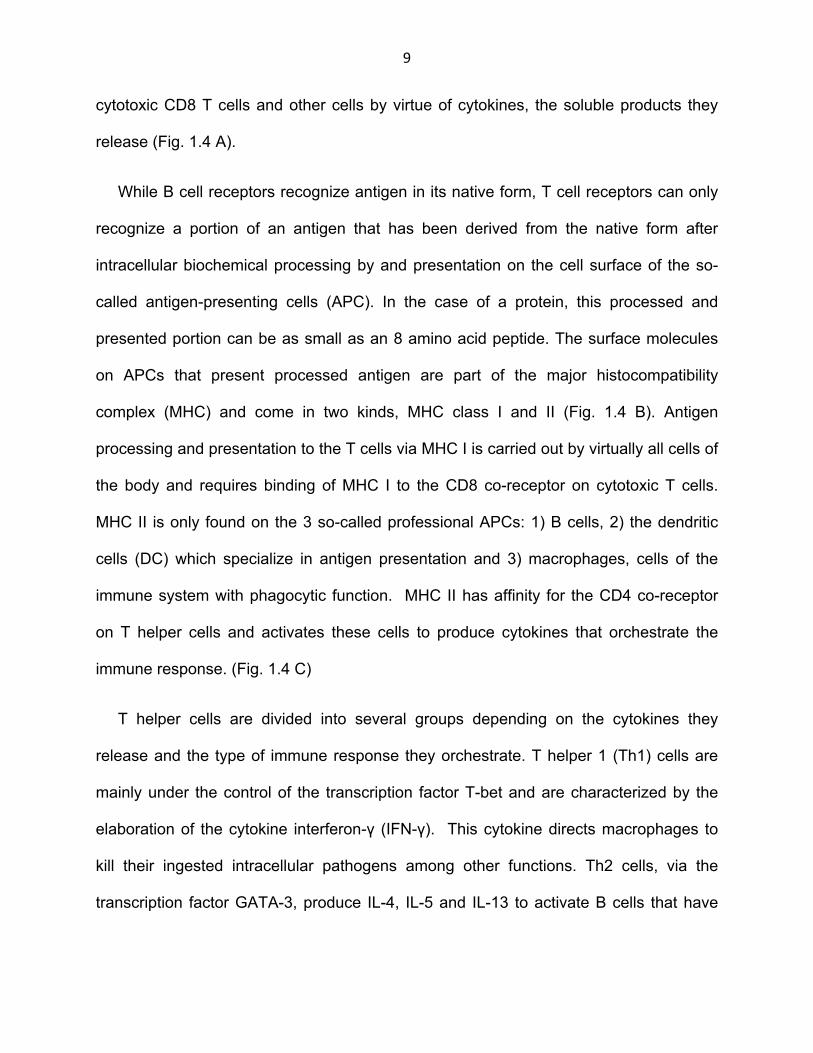
While B cell receptors recognize antigen in its native form, T cell receptors can only
recognize a portion of an antigen that has been derived from the native form after
intracellular biochemical processing by and presentation on the cell surface of the so-
called antigen-presenting cells (APC). In the case of a protein, this processed and
presented portion can be as small as an 8 amino acid peptide. The surface molecules
on APCs that present processed antigen are part of the major histocompatibility
complex (MHC) and come in two kinds, MHC class I and II (Fig. 1.4 B). Antigen
processing and presentation to the T cells via MHC I is carried out by virtually all cells of
the body and requires binding of MHC I to the CD8 co-receptor on cytotoxic T cells.
MHC II is only found on the 3 so-called professional APCs: 1) B cells, 2) the dendritic
cells (DC) which specialize in antigen presentation and 3) macrophages, cells of the
immune system with phagocytic function. MHC II has affinity for the CD4 co-receptor
on T helper cells and activates these cells to produce cytokines that orchestrate the
immune response. (Fig. 1.4 C)
T helper cells are divided into several groups depending on the cytokines they
release and the type of immune response they orchestrate. T helper 1 (Th1) cells are
mainly under the control of the transcription factor T-bet and are characterized by the
elaboration of the cytokine interferon-γ (IFN-γ). This cytokine directs macrophages to
kill their ingested intracellular pathogens among other functions. Th2 cells, via the
transcription factor GATA-3, produce IL-4, IL-5 and IL-13 to activate B cells that have
10
already had contact with the antigen via their BCR. Another type of T helper cells, Th17,
is involved in allergic or autoimmune responses via their cytokine IL-1722.
A B C
Figure 1.4 The cellular immune response. A Encounter with antigen presenting cells induces the T helper cell to produce cytokines that can activate B cells, cytotoxic T cells or macrophages. B Structure of the MHC – peptide – TCR complex. C CD4 and CD8 co-receptors on T cells restrict presentation to MHC II and MHC I respectively.
While engagement of the TCR with the antigen peptide-carrying MHC on antigen
presenting cells is an essential signal for T cell activation, it is usually not sufficient.
Additional signaling is required and that is accomplished by the interaction of co-
stimulatory molecules on APCs with their counterparts on T cells. Some important co-
stimulatory interactions are those of CD80 and CD86 (also called B7.1 and B7.2) on
APCs with CD28 on T cells or binding of CD40 on APCs with CD40-L (ligand) on T
cells. Other interactions may be inhibitory to T cells such as those between the same
CD80/CD86 mentioned above with the co-inhibitor CTLA-4 on T cells.
11
1.5 The Immune System: Immune Suppression
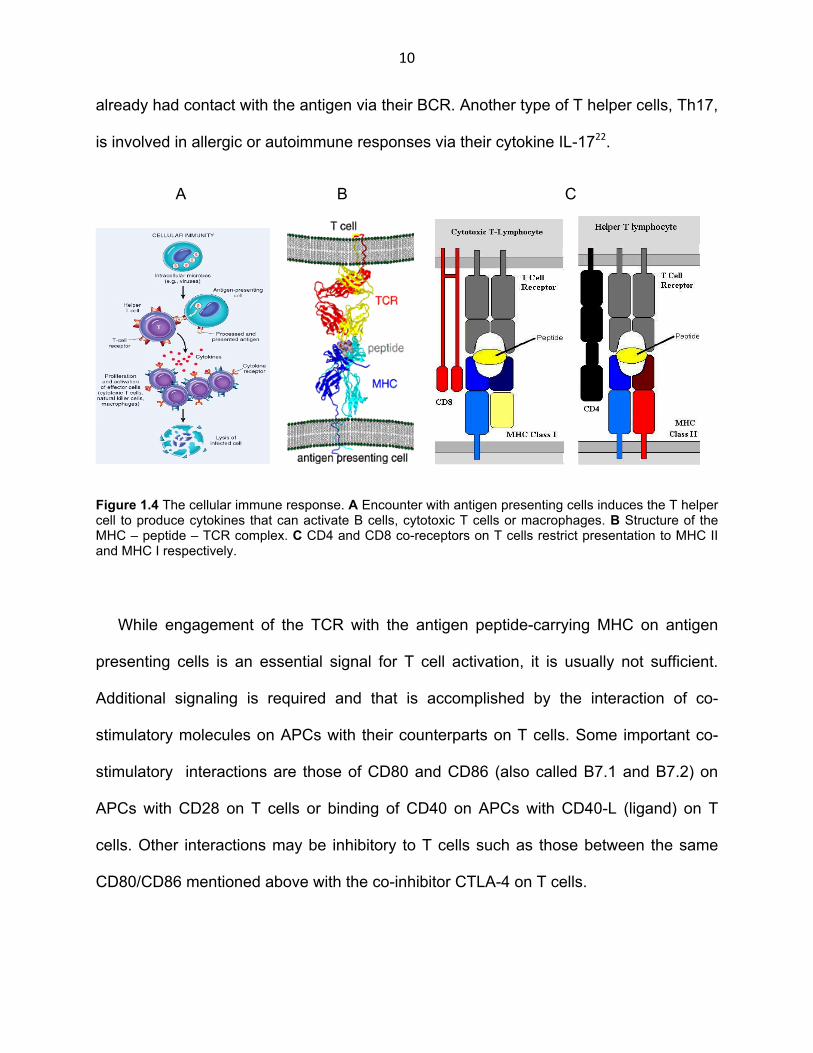
While the cells described above have effector functions in an immune response,
another type of T helper cell, regulatory T cells (Treg) carry out immune supressive
functions under the control of Foxp3, a member of the forkhead/winged-helix family of
transcription factors24 25. Treg express the CD25 surface marker in addition to CD426,
although not exclusively. The evidence for Treg’s suppressive function rests on 3 key
pieces of evidence: 1) their ability to inhibit autoimmune pathological conditions in vivo,
2) the in vitro inhibition of proliferation of naïve T cells stimulated via the T cell receptor
and 3) the observation that induced expression of Foxp3 in naïve T cells converts them
into cells with suppressive Treg phenotype27. The mechanisms by which Treg suppress
are still somewhat debatable and evidence has been found for several of them. Treg
can interact in a contact-dependent manner via surface molecules such as CTLA-4 to
send negative signaling to antigen presenting cells or even have direct cytotoxic effects
on cells of the immune system. Alternatively they can release immunosuppressive
cytokines such as TGF-β, IL-10 and IL-35 in a contact-independent manner27 (Fig. 1.5
A, B, C).
As T cells, Treg have T cell receptors with specific antigen recognition ability.
Polyclonal populations of Treg with varying antigen specificities are perfectly capable of
suppression, although there is evidence that monoclonal antigen-specific Treg may be
even more efficient in inhibiting an immune response28. Regardless of which of the
above mechanisms are prevalent, there is little debate that Treg are essential in
dampening an overy stimulated immune response, providing immune tolerance to self-
antigens and inhibiting antitumor immunity29 30. In fact depletion of Treg has been
12
accompanied by some autoimmune side effects. It has been shown however, that
elimination of Treg greatly enhances anti-tumor immunity31 32 33.
A B
C D
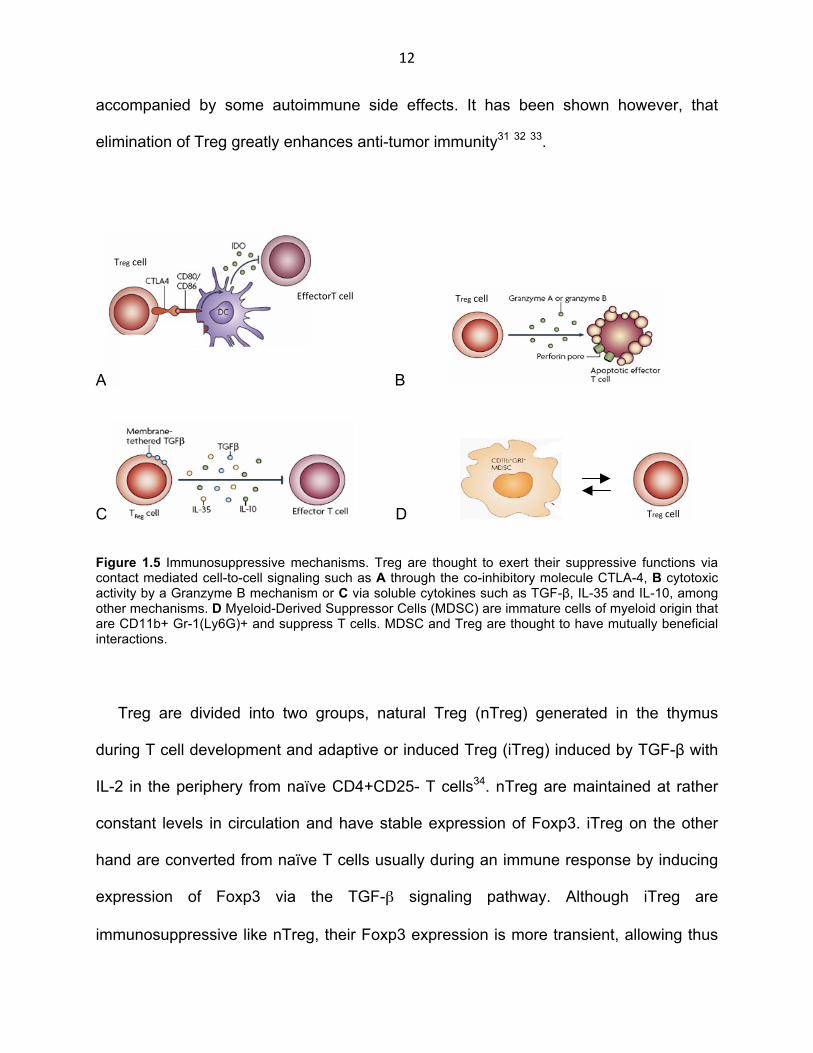
Figure 1.5 Immunosuppressive mechanisms. Treg are thought to exert their suppressive functions via contact mediated cell-to-cell signaling such as A through the co-inhibitory molecule CTLA-4, B cytotoxic activity by a Granzyme B mechanism or C via soluble cytokines such as TGF-β, IL-35 and IL-10, among other mechanisms. D Myeloid-Derived Suppressor Cells (MDSC) are immature cells of myeloid origin that are CD11b+ Gr-1(Ly6G)+ and suppress T cells. MDSC and Treg are thought to have mutually beneficial interactions.
Treg are divided into two groups, natural Treg (nTreg) generated in the thymus
during T cell development and adaptive or induced Treg (iTreg) induced by TGF-β with
IL-2 in the periphery from naïve CD4+CD25- T cells34. nTreg are maintained at rather
constant levels in circulation and have stable expression of Foxp3. iTreg on the other
hand are converted from naïve T cells usually during an immune response by inducing
expression of Foxp3 via the TGF-β signaling pathway. Although iTreg are
immunosuppressive like nTreg, their Foxp3 expression is more transient, allowing thus
Tregcell
TregcellEffectorTcell
Tregcell
13
the immune system to have a temporary or localized suppression of the immune
response. The stable vs. transient expression of Foxp3 in Treg is controlled by
epigenetic regulation at its promoter. CpG methylation at a certain enhancer element is
important in preventing stable Foxp3 expression in all non-nTreg cells35 36. Another
enhancer region has been shown to undergo histone acetylation in order to induce
expression of Foxp3. Signaling via the TGF-β receptor, which participates in iTreg
conversion, has been implicated in this epigenetic-level control of Foxp3 expression37.
Interestingly, conditions that combine TGF-β with IL-6, an inflammatory cytokine, direct
naïve CD4+CD25- T cells to convert to Th17 cells, thus diverting the immune response
from a suppressive into a pro-inflammatory one38 39 40 41.
The immunosuppressive functions described above are carried out by T cells, which
are part of the lymphoid lineage of immune cells (as are B cells). The myeloid lineage is
another important branch of bone marrow-derived cells and it includes cells mentioned
earlier such as macrophages and dendritic cells as well as the granulocytes, comprising
the neutrophils, basophils, eosinophils etc. A more recently discovered population of the
myeloid lineage was shown to be a potent inhibitor of T cell effector functions and is
recognized as an important branch of the suppressive immune system. This population
of cells is named Myeloid-Derived Suppressor Cells (MDSC) and was initially shown to
expand in cancer42. These cells are characterized by expression of the surface markers
CD11b and Gr-1/Ly6G in mice and have since been implicated in immune suppression
during inflammation as well as infection43. Rather than being a distinct subset of myeloid
cells, MDSC are a heterogeneous mixture of macrophages, dendritic cells and
granulocytes maintained at an immature stage of their development. MDSC are
14
activated by cytokines such as IFN-γ, Granulocyte-Monocyte Colony-Stimulating Factor
(GM-CSF) and TGF-β. MDSCs themselves may be a source of TGF-β and are thought
to have a mutually beneficial interaction with Treg44 (Fig. 1.5 D).
1.6 Inducible Regulatory T cells, TGF-β and Cancer
As mentioned earlier, Treg play an important role in helping tumors escape the
immune system and are considered a major target in cancer immunotherapy. In fact,
depletion of Treg with antibodies directed at CD25 has shown improvement in antitumor
response45. Although CD25 is generally a reliable marker for Treg, it is also transiently
expressed on all activated T cells, including the effector anti-tumor T cells one hopes to
generate, thus making depletion of all CD25-bearing cells problematic46. In addition,
pan-depletion of Treg carries with it the risk of autoimmunity especially in a susceptible
organism31 32. Evidence shows that the naturally occurring nTreg are not the only
immunosuppressive cells associated with cancer. In fact iTreg play a very important role
in this regard and their contribution is independent of that of nTreg47 48. As previously
described, iTreg are formerly naïve CD4+CD25- T cells that have been converted to
suppressive, Foxp3-expressing CD4+CD25+ Treg by the action of TGF-β and IL-2
following TCR stimulation. It is conceivable that naïve T cells in the TME are induced to
express Foxp3 in the right cytokine environment and that this would be beneficial to a
growing tumor trying to evade immune control. The tumor would have an advantage in
releasing or causing other cells of the surrounding stroma to release cytokines that
create an environment that is conducive to iTreg conversion. In fact iTreg are present in
15
the TME and have been shown to contribute to this tumor-directed
immunosuppression49 50 51.
The action of TGF-β is key in order for the tumor to hi-jack the iTreg
immunosuppressive mechanism and the presence of this cytokine has been
documented in the tumor microenvironment52 53. Different kinds of cells elaborate TGF-β
in the tumor vicinity and these include the tumor cells themselves as well as the
surrounding stroma, with tumor-infiltrating immune cells prominent among them49.
Targeting TGF-β in cancer immunotherapy however is not straightforward since it is a
ubiquitous molecule with rather pleiotropic effects. The actions of TGF-β in cancer can
be pro-tumorigenic as well as tumor-suppressive. In addition to aiding tumors to evade
the immune response as described above, TGF-β also helps cancer spread by assisting
in the tumor epithelial to mesenchymal transition (EMT), whereby epithelial cancer cells
break the barrier of the lamina propria and invade the connective tissue underneath
paving the way for metastasis54. On the other hand, activation of the TGF-β pathway in
cancer cells sends tumor suppressive signals that cause decrease in proliferation
among other actions53. This is demonstrated by the fact that inactivation of the TGF-β
receptor or other upstream components of the pathway induces malignant
transformation in cells that already have other oncogenic mutations55. These pro and
anti-tumorigenic effects depend on the context and make specific targeting of the iTreg-
dependent immunosuppressive function of TGF-β difficult to tease out. Targeting
downstream elements of the TGF-β pathway that lead to induction of Foxp3 in iTreg
becomes a more feasible alternative.
16
1.7 TGF-β-inducible early gene 1 (TIEG1)
The TGF-β pathway evolved in vertebrates to participate in various processes such
as development, wound-repair and the immune system53. The ligand family includes
TGF-β itself which is active in immune modulation among other functions, as well as
factors such as bone morphogenetic proteins (BMP) that participate in bone formation,
nodal and lefty that determine left-right asymmetry during organogenesis etc. The active
TGF-β ligand is a 25 kDa dimeric protein that binds to and brings together two
serine/threonine kinase receptors, the TGF-β receptors type I and II thus triggering their
autophosphorylation. The receptors then phosphorylate and activate members 2 and 3
of the Smad family which form a complex and after partnering with Smad4 are
translocated to the nucleus. Upon associating with or activating other general or tissue-
specific transcription factors from various families (bHLH, homeobox, zinc-finger etc.),
the Smad complex triggers a specific pattern of gene expression56.
One of the earliest proteins to be activated by TGF-β signaling (within 30 minutes) is
TIEG1 (TGF-β-Inducible Early Gene 1) also known as KLF10 (Krϋppel-Like Factor 10).
TIEG1 (KLF10) is a transcription factor that was originally discovered in the Spelsberg
lab at the Mayo clinic as a gene important in human bone mineralization by osteoblasts
and differentiation of osteoclasts57. This 72 kDa protein is a member of the KLF family, a
subgroup of the zinc-finger transcription factors that is characterized by a C-terminal
DNA binding domain composed of 3 C2H2 zinc-finger motifs with a highly conserved 7-
residue sequence (TGEKP(Y/F)X) between them58. This gene has been shown to mimic
some actions of TGF-β by being pro-apoptotic and anti-proliferative59 60. Deficiency of
17
TIEG1 has been linked to some signs of cardiac hypertrophy61 and skeletal weakness62
63.
In a T cell context, Venuprasad et al. have shown that upon signaling from the TGF-
β-Smad pathway, cytoplasmic TIEG1 is mono-ubiquitinated by the E3 ubiquitin ligase
Itch and is thus marked for nuclear localization where it can carry out its function as a
transcription factor. A major function of TIEG1 in the nucleus is activation of the
promoter of Foxp3, the master regulator of T cells with a suppressive phenotype (Fig.
1.6) They also demonstrated that when TGF-β is combined with IL-6, (a condition which
directs the naïve T cell away from the Treg phenotype and toward Th17) this will in fact
cause poly-ubiquitination of TIEG1 (as opposed to mono-ubiquitination) and prevent its
nuclear translocation and Foxp3 induction64. Knocking out TIEG1 or Itch in CD4+ T cells
severely impairs their ability to induce expression of Foxp3 and to convert iTreg from
naïve CD4+CD25- T cells. As a result, TGF-β-treated naïve T cells from TIEG1-/- mice
had reduced suppressive activity in vitro and were unable to keep in check the immune
response in a model of induced allergic inflammation of the airways65. Furthermore Cao
et al. showed that in addition to Foxp3, the TGF-β promoter itself is another activation
target of TIEG1 in a positive feedback mechanism of iTreg conversion. In fact
overexpression of TIEG1 induced expression of both TGF-β and Foxp3 and this caused
a reduction of markers for other competing effector T cell lineages, such as Th1 and
Th2, whereas TIEG1 ablation had the opposite effect. Transfer of CD4+CD25- naïve T
cells from TIEG1-/- mice into a mouse model of inflammatory atherosclerosis increased
atherosclerotic lesions, indicating inability of TIEG1-/- naïve T cells to be converted to
the immunosuppressive iTreg66 58. Further studies by the Venuprasad group showed
18
that growth of TRAMP-C2 tumor in unimmunized TIEG1-/- mice was inhibited, indicating
a stronger antitumor immune response, an effect attributed to the absence of
immunosuppression by iTreg64.
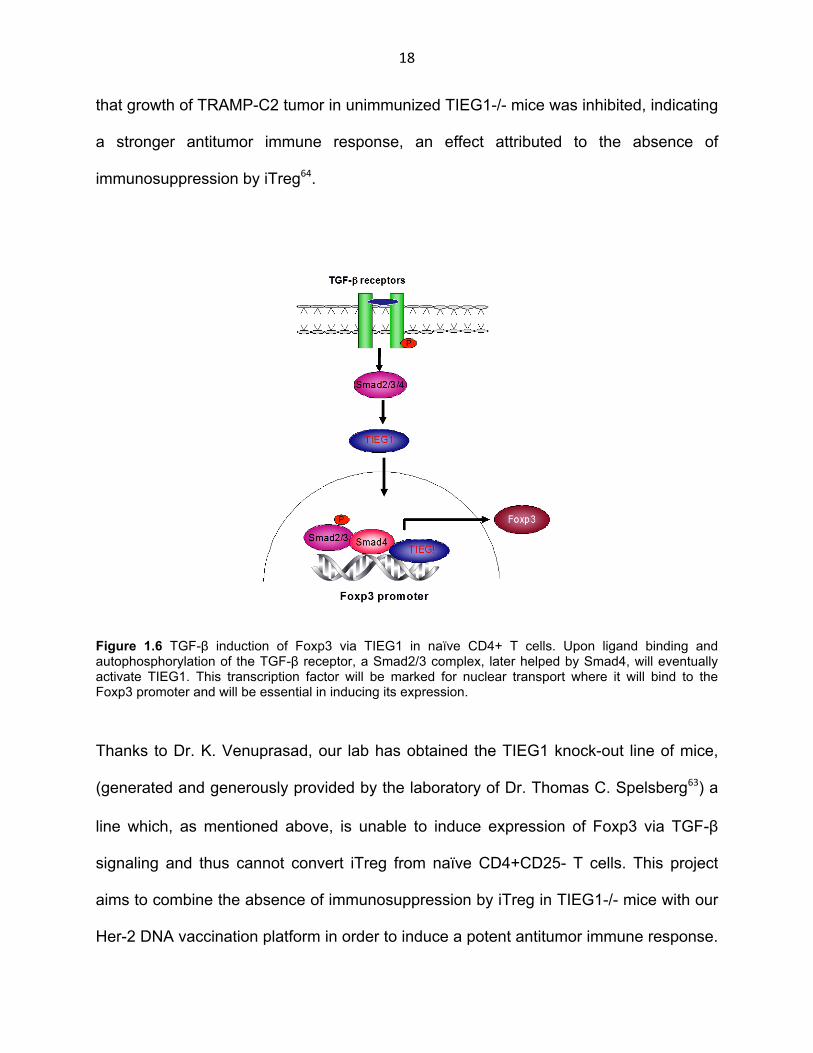
Figure 1.6 TGF-β induction of Foxp3 via TIEG1 in naïve CD4+ T cells. Upon ligand binding and autophosphorylation of the TGF-β receptor, a Smad2/3 complex, later helped by Smad4, will eventually activate TIEG1. This transcription factor will be marked for nuclear transport where it will bind to the Foxp3 promoter and will be essential in inducing its expression.
Thanks to Dr. K. Venuprasad, our lab has obtained the TIEG1 knock-out line of mice,
(generated and generously provided by the laboratory of Dr. Thomas C. Spelsberg63) a
line which, as mentioned above, is unable to induce expression of Foxp3 via TGF-β
signaling and thus cannot convert iTreg from naïve CD4+CD25- T cells. This project
aims to combine the absence of immunosuppression by iTreg in TIEG1-/- mice with our
Her-2 DNA vaccination platform in order to induce a potent antitumor immune response.

19
TIEG1-/- and wild type mice will be vaccinated with Her-2 + GM-CSF DNA, and their B
and T cell immune response as well as tumor growth will be assessed. In addition, in
vitro testing of spleen cells from TIEG1-/- and wild type mice will be performed.
20
CHAPTER 2
MATERIALS AND METHODS
Mice
All procedures involving mice were conducted in accordance with institutional guidelines
and under the supervision and/or approval of the Wayne State University Division of
Laboratory Animal Resources (WSU DLAR). Wild type C57Bl/6 and BALB/C mice were
purchased from the National Institutes of Health (NIH) or generated in house from
breeding. C57BL/6 TIEG1 knockout mice, generated in the laboratory of Dr. T. C.
Spelsberg, were generously provided by Dr. K. Venuprasad. TIEG1-/- were maintained
by inbreeding with other TIEG1-/- mice. A selected sub strain of TEIG1-/- mice with
severely impaired antibody response was generated from the original TIEG1-/- line and
is maintained by inbreeding with other TIEG1-/- mice from this selected sub strain.
C57BL/6 Her-2 transgenic mice were generated in our laboratory and are maintained as
heterozygous mice by back-cross breeding with wild type C57Bl/6. C57BL/6 TIEG1-/-
Her-2 Tg mice were generated in our laboratory by two rounds of breeding from TIEG1-
/- males and Her-2 Tg females and are maintained by breeding of TIEG1-/- Her-2 Tg
males with TIEG1-/- females.
21
Plasmids and Vaccinations
pE2TM, pE2N and empty vector pVax (control) were previously described20 21. pGM-
CSF encoding murine GM-CSF was provided by Dr. N. Nishisaki at Osaka University,
Osaka, Japan. In the allogeneic immunization, mice received 5x10⁶ splenocytes from
BALB/C or C57Bl/6 (control) background via i.p. injection 3 times at 2 week intervals. In
the tumor cell immunization mice received 3x10⁶ irradiated TC-1/E2 cells (20x103 rad)
i.p. twice with a 10 week interval between injections. In the DNA vaccination mice
received 50 µg of pE2TM/pE2N/pVax and pGM-CSF plasmid DNA each (in 50 ul PBS)
via i.m. injection in the hamstring muscles 3 times at 2 week intervals. Each vaccination
was immediately followed by square wave electroporation over the injection site using a
BTX830 (BTX Harvard Apparatus, Holliston, MA) electroporator apparatus. A tweezer
electrode was used to deliver 8 pulses at 100 V at 25 ms per pulse, 4 in each direction.
Cell Lines and Reagents
All tissue culture reagents were purchased from Invitrogen and Gibco BRL. Cell lines
were maintained in vitro in a starting medium composed of DMEM supplemented with
5% cosmic calf serum (HyClone, Logan, UT), 5% fetal bovine serum (Hyclone, Logan,
UT), 2 mM l-glutamine, 0.1 mM non-essential amino acids, 100 units/ml penicillin, 100
µg/ml streptomycin, 0.5 mM sodium pyruvate (SDME 5+5). Variations from this medium
are noted below for each cell line. E0771/Her-2 cells were maintained in DMEM with
20% fetal bovine serum and 0.1mg/ml neomycin. TC-1 cells (generously provided by Dr.
T. C. Wu, The Johns Hopkins University, Baltimore, MD) were maintained in SDME 5+5
22
with 0.4 mg/ml neomycin. TC-1/E2 cells were generated by transfecting TC-1 cells with
Her-2 and maintained in TC-1 media (see above) + 7.5 µg/ml puromycin. 3T3 cells were
maintained in SDME 5+5 media. 3T3/KB cells were maintained in SDME 5+5 with 0.6
mg/ml neomycin and 7.5 µg/ml puromycin. Other reagents were purchased from Sigma.
Antibodies were purchased from BD biosciences and Invitrogen. PCR reagents were
purchased from Qiagen.
CD25 Depletion
To deplete CD25+ regulatory T cells (Treg), mice were injected twice i.p. with 0.5 mg of
PC61 mAb (in 0.3 ml volume) at a one week interval with the second injection given 3
days before the first vaccination.
Tumor Challenge and Measurement
Ten days after the third vaccination, mice were inoculated s.c. in the flank with 2×10⁵
E0771/Her-2 cells. Tumor growth was monitored by palpation, and tumor diameter was
measured in two perpendicular dimensions with a caliper at 3-day or weekly intervals.
Tumor volume was calculated as width2 x length x ½. Mice were sacrificed when any
one dimension of the tumor reached 20mm.
23
Measurement of Antibody Response by Flow Cytometry
In allogeneic immunization, sera from the immunized mice were used to stain BALB/C
splenocytes and detected with fluorophore-conjugated Fcγ secondary antibody by a BD
Canto II flow cytometer. We constructed the standard curve by staining BALB/C
splenocytes with anti-Kd (clone SF1-1.1) antibody and used regression analysis to
calculate serum IgG antibody concentrations (see note in text). In the Her-2 tumor cell
and DNA vaccine experiments sera from the immunized mice were used to stain TC-
1/E2 cells and detected with fluorophore-conjugated Fcγ secondary antibody. We
constructed the standard curve by staining TC-1/E2 cells with anti-Her-2 (clone Ab-5)
antibody and used regression analysis to calculate serum IgG antibody concentrations.
Measurement of T Cell Response by IFN-γ ELISPOT Assay
96-well HTS IP plates (Millipore, Bedford, MA), were pre-coated with 2.5 µg/ml rat anti-
mouse IFN-γ. Spleen cells were added to the wells in the presence of 3T3 or 3T3/KB
cells for allogeneic immunization and TC-1 or TC-1/E2 cells for Her-2 immunization at
1:10 APC : lymphocyte ratio in R10 media (RPMI1640 supplemented with 10% FBS,
100 units/ml penicillin, 100 µg/ml streptomycin and 10mM HEPES). Other control wells
had medium or Concanavalin A. Following 48 hr incubation, cells were removed and
captured IFN-γ was detected with biotinylated rat anti-mouse IFN-γ, avidin-HRP and the
substrate 3-amino-9-ethylcarbazole. The visualized cytokine spots were counted with
the ImmunoSpot analyzer (CTL, Cleveland, OH), and the results were expressed as
number of cytokine-producing cells per 106 splenocytes.

24
Statistical Analysis
Data were analyzed using the student’s t-test (or Kruskall-Wallis test where appropriate,
see note in text). Select data were analyzed with the help of Dr. Judith Abrams,
(Biostatistics Core, Karmanos Cancer Institute, Detroit, MI).
25
CHAPTER 3
RESULTS
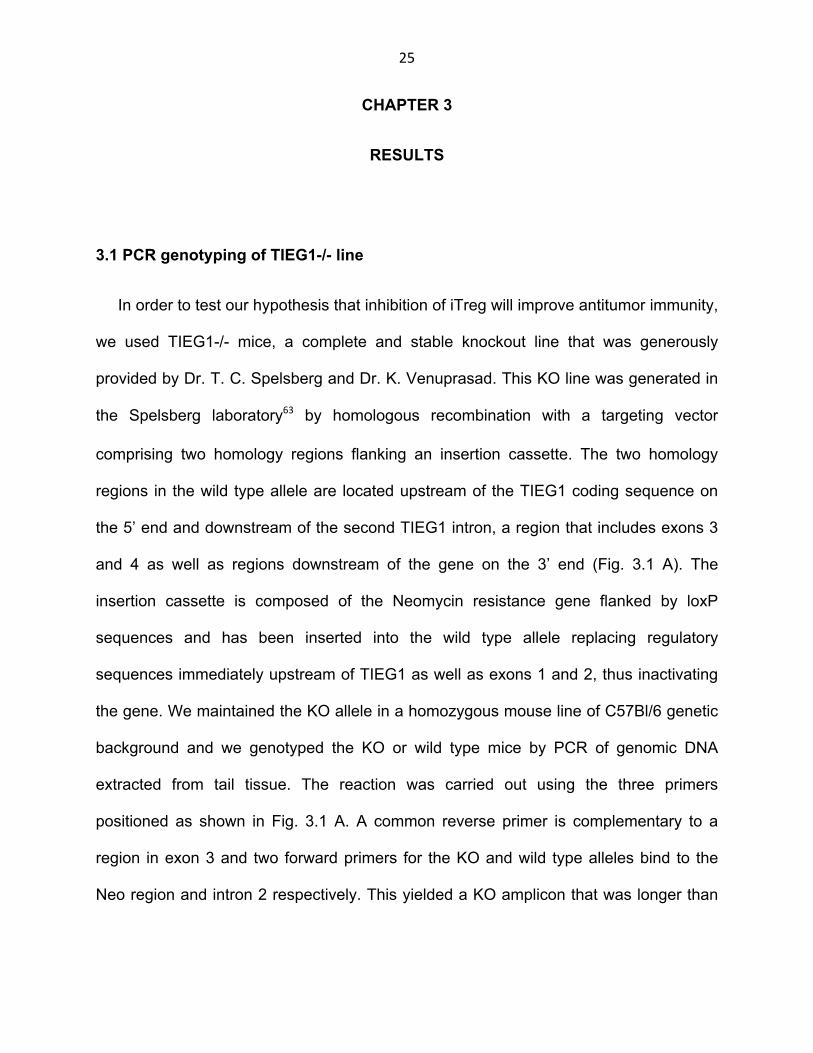
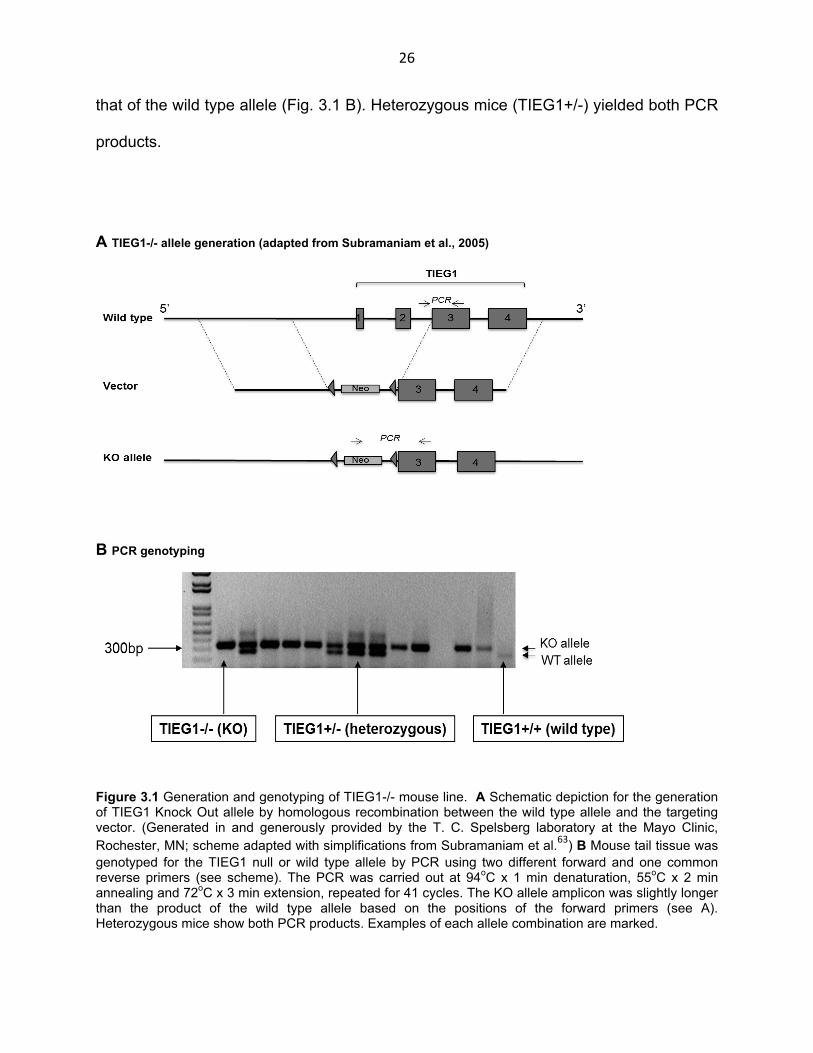
3.1 PCR genotyping of TIEG1-/- line
In order to test our hypothesis that inhibition of iTreg will improve antitumor immunity,
we used TIEG1-/- mice, a complete and stable knockout line that was generously
provided by Dr. T. C. Spelsberg and Dr. K. Venuprasad. This KO line was generated in
the Spelsberg laboratory63 by homologous recombination with a targeting vector
comprising two homology regions flanking an insertion cassette. The two homology
regions in the wild type allele are located upstream of the TIEG1 coding sequence on
the 5’ end and downstream of the second TIEG1 intron, a region that includes exons 3
and 4 as well as regions downstream of the gene on the 3’ end (Fig. 3.1 A). The
insertion cassette is composed of the Neomycin resistance gene flanked by loxP
sequences and has been inserted into the wild type allele replacing regulatory
sequences immediately upstream of TIEG1 as well as exons 1 and 2, thus inactivating
the gene. We maintained the KO allele in a homozygous mouse line of C57Bl/6 genetic
background and we genotyped the KO or wild type mice by PCR of genomic DNA
extracted from tail tissue. The reaction was carried out using the three primers
positioned as shown in Fig. 3.1 A. A common reverse primer is complementary to a
region in exon 3 and two forward primers for the KO and wild type alleles bind to the
Neo region and intron 2 respectively. This yielded a KO amplicon that was longer than
26
that of the wild type allele (Fig. 3.1 B). Heterozygous mice (TIEG1+/-) yielded both PCR
products.
A TIEG1-/- allele generation (adapted from Subramaniam et al., 2005)
B PCR genotyping
Figure 3.1 Generation and genotyping of TIEG1-/- mouse line. A Schematic depiction for the generation of TIEG1 Knock Out allele by homologous recombination between the wild type allele and the targeting vector. (Generated in and generously provided by the T. C. Spelsberg laboratory at the Mayo Clinic, Rochester, MN; scheme adapted with simplifications from Subramaniam et al.63) B Mouse tail tissue was genotyped for the TIEG1 null or wild type allele by PCR using two different forward and one common reverse primers (see scheme). The PCR was carried out at 94oC x 1 min denaturation, 55oC x 2 min annealing and 72oC x 3 min extension, repeated for 41 cycles. The KO allele amplicon was slightly longer than the product of the wild type allele based on the positions of the forward primers (see A). Heterozygous mice show both PCR products. Examples of each allele combination are marked.
27
3.2 Stronger T cell response but comparable antibody response to immunization
with allogeneic splenocytes in TIEG1-/- mice
TIEG1-/- mice were shown to be incapable of converting naïve CD4+ T cells into
Foxp3-expressing iTreg with immunosuppressive phenotype. In order to test whether
this impairment in immune suppression has an effect on our antitumor vaccination we
first tested the immune response of TIEG1-/- mice to a common antigen such as
allogeneic (foreign) MHC. MHC is the cell surface protein used to present antigen to T
cells and is encoded by a gene with great allelic variability between individuals making it
a strong immunogen and the basis for immunological transplant rejection. TIEG1-/- and
wild type mice were immunized with spleen cells from mice of a different genetic
background (BALB/C) where the MHC molecules serve as the main immunogenic
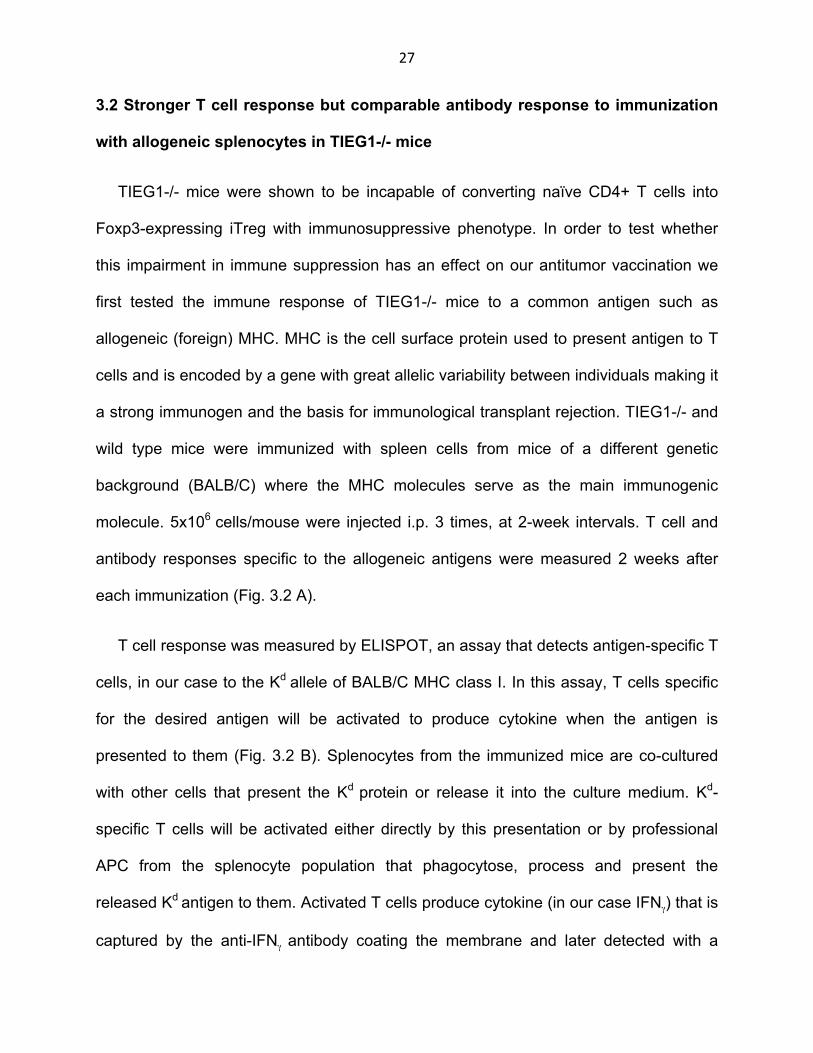
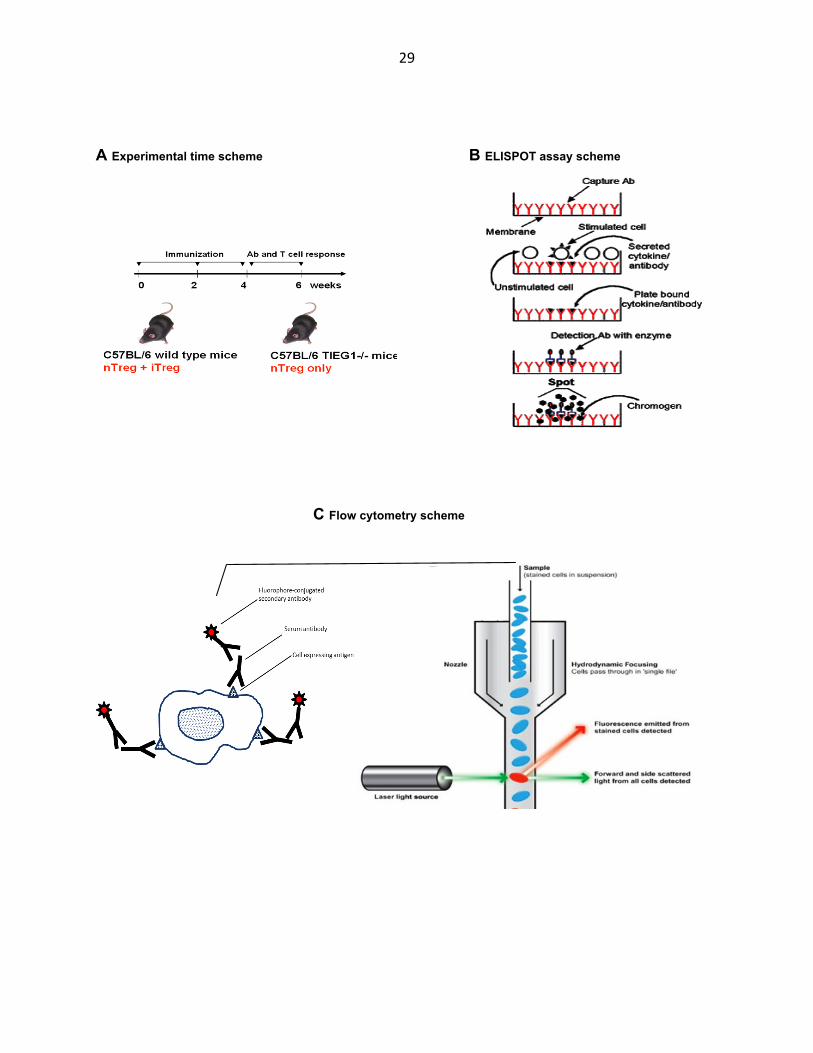
molecule. 5x10⁶ cells/mouse were injected i.p. 3 times, at 2-week intervals. T cell and
antibody responses specific to the allogeneic antigens were measured 2 weeks after
each immunization (Fig. 3.2 A).
T cell response was measured by ELISPOT, an assay that detects antigen-specific T
cells, in our case to the Kd allele of BALB/C MHC class I. In this assay, T cells specific
for the desired antigen will be activated to produce cytokine when the antigen is
presented to them (Fig. 3.2 B). Splenocytes from the immunized mice are co-cultured
with other cells that present the Kd protein or release it into the culture medium. Kd-
specific T cells will be activated either directly by this presentation or by professional
APC from the splenocyte population that phagocytose, process and present the
released Kd antigen to them. Activated T cells produce cytokine (in our case IFNγ) that is
captured by the anti-IFNγ antibody coating the membrane and later detected with a
28
secondary antibody linked to an enzymatic colorimetric reaction that creates a spot on
the membrane. The density of spots is proportional to the concentration of Kd-specific T
cells generated during the immunization.
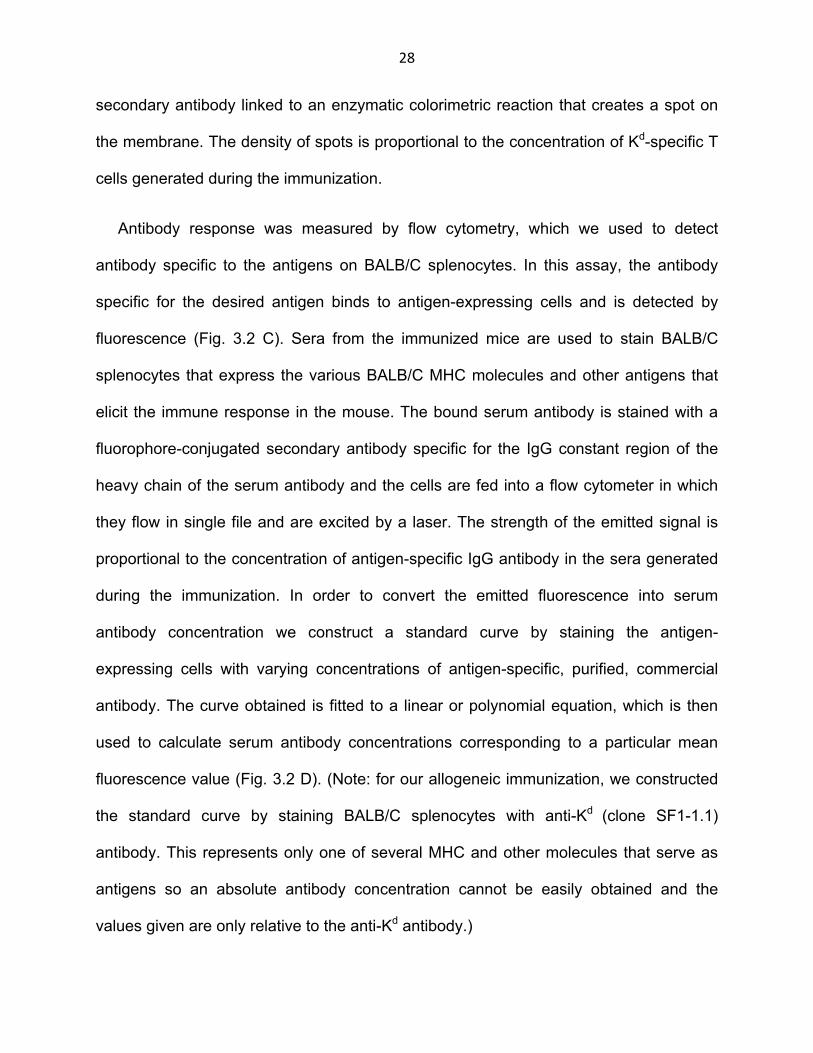
Antibody response was measured by flow cytometry, which we used to detect
antibody specific to the antigens on BALB/C splenocytes. In this assay, the antibody
specific for the desired antigen binds to antigen-expressing cells and is detected by
fluorescence (Fig. 3.2 C). Sera from the immunized mice are used to stain BALB/C
splenocytes that express the various BALB/C MHC molecules and other antigens that
elicit the immune response in the mouse. The bound serum antibody is stained with a
fluorophore-conjugated secondary antibody specific for the IgG constant region of the
heavy chain of the serum antibody and the cells are fed into a flow cytometer in which
they flow in single file and are excited by a laser. The strength of the emitted signal is
proportional to the concentration of antigen-specific IgG antibody in the sera generated
during the immunization. In order to convert the emitted fluorescence into serum
antibody concentration we construct a standard curve by staining the antigen-
expressing cells with varying concentrations of antigen-specific, purified, commercial
antibody. The curve obtained is fitted to a linear or polynomial equation, which is then
used to calculate serum antibody concentrations corresponding to a particular mean
fluorescence value (Fig. 3.2 D). (Note: for our allogeneic immunization, we constructed
the standard curve by staining BALB/C splenocytes with anti-Kd (clone SF1-1.1)
antibody. This represents only one of several MHC and other molecules that serve as
antigens so an absolute antibody concentration cannot be easily obtained and the
values given are only relative to the anti-Kd antibody.)
29
A Experimental time scheme B ELISPOT assay scheme
C Flow cytometry scheme
30
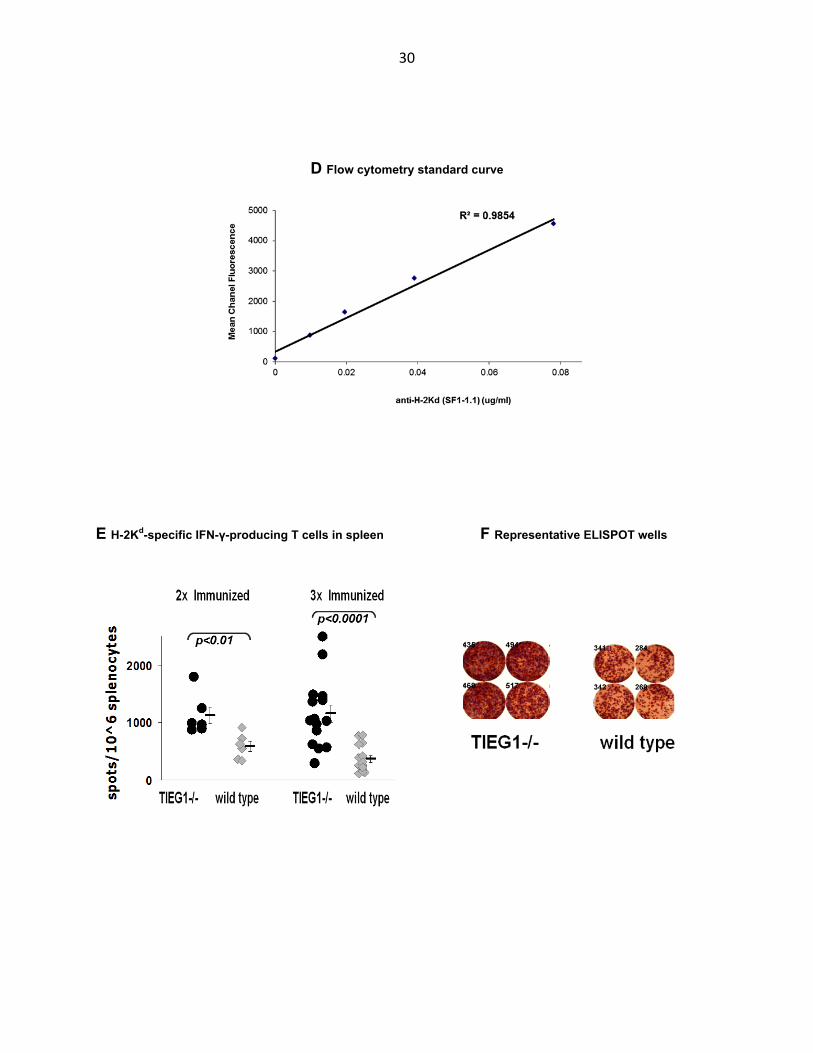
D Flow cytometry standard curve
E H-2Kd-specific IFN-γ-producing T cells in spleen F Representative ELISPOT wells
31
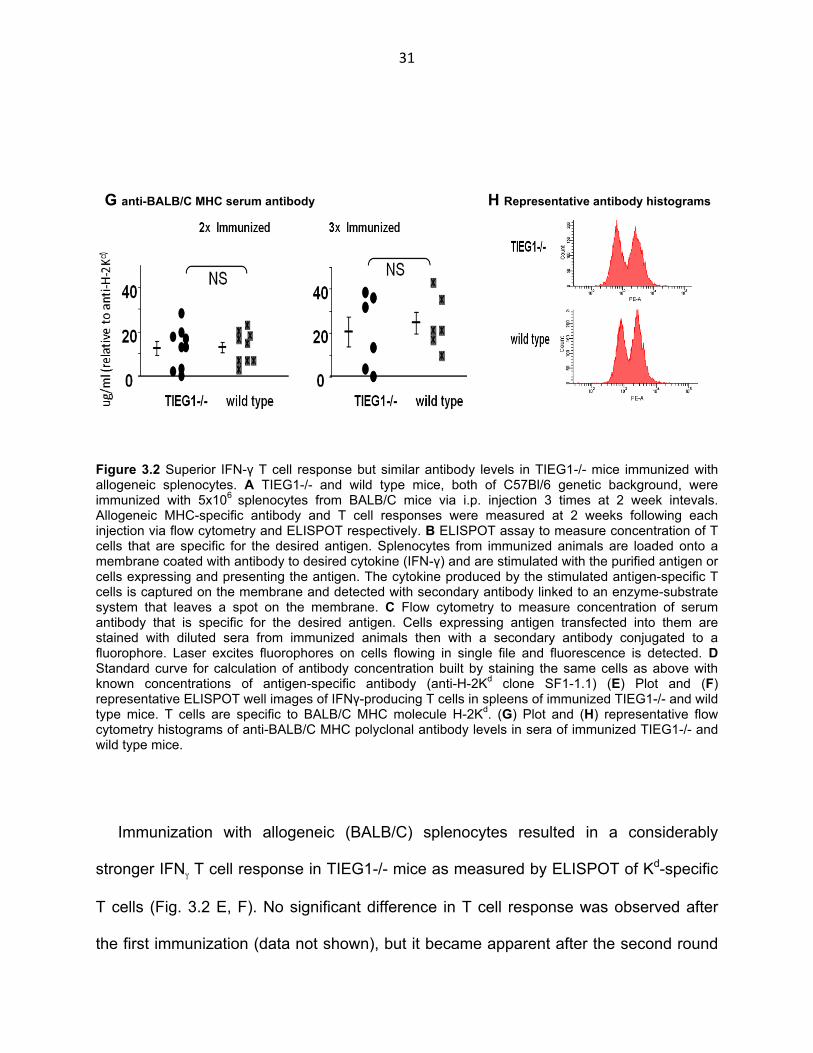
G anti-BALB/C MHC serum antibody H Representative antibody histograms
Figure 3.2 Superior IFN-γ T cell response but similar antibody levels in TIEG1-/- mice immunized with allogeneic splenocytes. A TIEG1-/- and wild type mice, both of C57Bl/6 genetic background, were immunized with 5x10⁶ splenocytes from BALB/C mice via i.p. injection 3 times at 2 week intevals. Allogeneic MHC-specific antibody and T cell responses were measured at 2 weeks following each injection via flow cytometry and ELISPOT respectively. B ELISPOT assay to measure concentration of T cells that are specific for the desired antigen. Splenocytes from immunized animals are loaded onto a membrane coated with antibody to desired cytokine (IFN-γ) and are stimulated with the purified antigen or cells expressing and presenting the antigen. The cytokine produced by the stimulated antigen-specific T cells is captured on the membrane and detected with secondary antibody linked to an enzyme-substrate system that leaves a spot on the membrane. C Flow cytometry to measure concentration of serum antibody that is specific for the desired antigen. Cells expressing antigen transfected into them are stained with diluted sera from immunized animals then with a secondary antibody conjugated to a fluorophore. Laser excites fluorophores on cells flowing in single file and fluorescence is detected. D Standard curve for calculation of antibody concentration built by staining the same cells as above with known concentrations of antigen-specific antibody (anti-H-2Kd clone SF1-1.1) (E) Plot and (F) representative ELISPOT well images of IFNγ-producing T cells in spleens of immunized TIEG1-/- and wild type mice. T cells are specific to BALB/C MHC molecule H-2Kd. (G) Plot and (H) representative flow cytometry histograms of anti-BALB/C MHC polyclonal antibody levels in sera of immunized TIEG1-/- and wild type mice.
Immunization with allogeneic (BALB/C) splenocytes resulted in a considerably
stronger IFNγ T cell response in TIEG1-/- mice as measured by ELISPOT of Kd-specific
T cells (Fig. 3.2 E, F). No significant difference in T cell response was observed after
the first immunization (data not shown), but it became apparent after the second round
32
of immunizations and especially after the third. The concentration of Kd-specific T cells
in spleens of some TIEG1-/- mice was as high as 2500 cells/106 splenocytes or
approximately 0.85% of all T cells in the spleen whereas in the wild type mice the
concentration did not exceed 800 cells/106 splenocytes or 0.27% of T cells. (T cell
response in TIEG1-/- mice showed a greater variability than in wild type mice also.)
Absence of iTreg however, did not have the same effect in the IgG antibody response of
TIEG1-/- mice as compared to their wild type counterparts (Fig. 3.2 G, H). No significant
difference between the two strains of mice was observed. Each successive
immunization increased the antibody response in both the knockout and wild type
strains but any possible difference between the two groups was not noticeable with the
flow cytometric method we used.
3.3 Stronger T cell response but comparable antibody response to immunization
with Her-2-expressing tumor cells in TIEG1-/- mice
In order to test whether absence of iTreg has an effect on immunity to the
oncoprotein Her-2, we conducted a small, pilot experiment to test the immune response
of TIEG1-/- mice to injection with Her-2 in the context of tumor cells expressing this
protein. TIEG1-/- and wild type mice were vaccinated with TC-1/E2, a mouse epithelial
lung cell line that has been transformed with Human Papilloma Virus-16 oncogenes E6
and E7 as well as ras to become immortalized (generously provided by Dr. T. C. Wu)
and then transfected to express the Her-2 (E2) protein. Mice received 3x10⁶ TC-1/E2
cells (irradiated to prevent tumor growth), i.p., twice with a 10 week interval between
33
injections. Her-2-specific antibody and T cell responses were measured by flow
cytometry and ELISPOT, two weeks post injection. T cell response was measured with
ELISPOT by stimulating splenocytes with TC-1/E2 cells. Antibody response was
measured with flow cytometry by staining TC-1/E2 cells with sera from the vaccinated
mice. We constructed the standard curve by staining TC-1/E2 cells with purified
commercial anti-Her-2 (clone Ab-5) antibody to obtain absolute serum Her-2 antibody
concentrations.
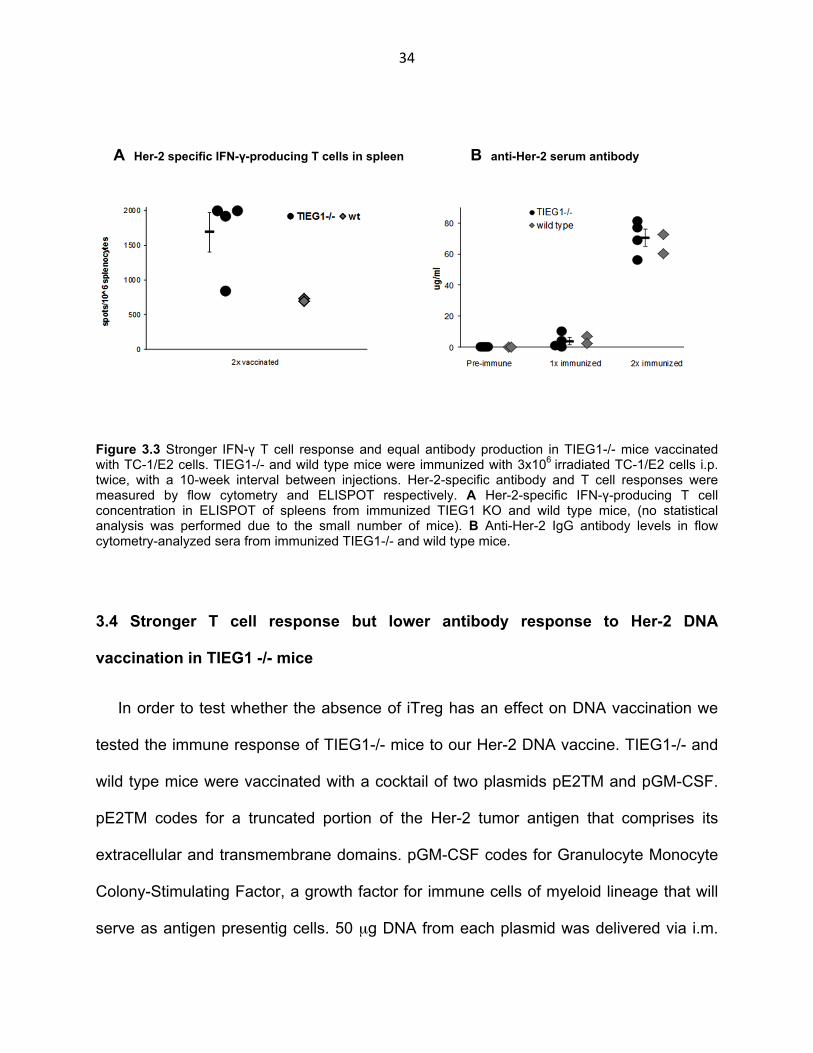
As in the case of allogeneic splenocytes, immunization with irradiated TC-1/E2 cells
resulted in a stronger IFNγ T cell response in TIEG1-/- mice (after the second
immunization) (Fig. 3.3 A). The concentration of Her-2-specific T cells in spleens of 3
TIEG1-/- mice was nearly 2000 cells/106 splenocytes with only one mouse responding
at around 800cells/106 splenocytes. On the other hand, T cell response in the two wild
type mice tested was around 700 cells/106 splenocytes. As with allogeneic splenocyte
immunization, absence of iTreg or TIEG1 did not make a difference in the antibody
response of TIEG1-/- mice as compared to their wild type counterparts (Fig. 3.3 B).
Serum IgG concentrations in response to TC-1/E2 were comparable in the two groups
after the first and second immunizations. In conclusion, a pilot experiment testing anti-
Her-2 immunity via immunization with Her-2-expressing irradiated tumor cells yielded a
more robust T cell response but comparable antibody levels.
34
A Her-2 specific IFN-γ-producing T cells in spleen B anti-Her-2 serum antibody
Figure 3.3 Stronger IFN-γ T cell response and equal antibody production in TIEG1-/- mice vaccinated with TC-1/E2 cells. TIEG1-/- and wild type mice were immunized with 3x10⁶ irradiated TC-1/E2 cells i.p. twice, with a 10-week interval between injections. Her-2-specific antibody and T cell responses were measured by flow cytometry and ELISPOT respectively. A Her-2-specific IFN-γ-producing T cell concentration in ELISPOT of spleens from immunized TIEG1 KO and wild type mice, (no statistical analysis was performed due to the small number of mice). B Anti-Her-2 IgG antibody levels in flow cytometry-analyzed sera from immunized TIEG1-/- and wild type mice.
3.4 Stronger T cell response but lower antibody response to Her-2 DNA
vaccination in TIEG1 -/- mice
In order to test whether the absence of iTreg has an effect on DNA vaccination we
tested the immune response of TIEG1-/- mice to our Her-2 DNA vaccine. TIEG1-/- and
wild type mice were vaccinated with a cocktail of two plasmids pE2TM and pGM-CSF.
pE2TM codes for a truncated portion of the Her-2 tumor antigen that comprises its
extracellular and transmembrane domains. pGM-CSF codes for Granulocyte Monocyte
Colony-Stimulating Factor, a growth factor for immune cells of myeloid lineage that will
serve as antigen presentig cells. 50 µg DNA from each plasmid was delivered via i.m.
35
injection in the hamstring region and electroporation for 3 times at 2 week intevals. Her-
2-specific antibody and T cell responses were measured at 2 weeks following each
injection via flow cytometry and ELISPOT as before. T cell response was measured with
ELISPOT by stimulating splenocytes with the TC-1/E2 cell line which expresses Her-2.
Antibody response was measured with flow cytometry, by staining TC-1/E2 cells with
sera from the vaccinated mice. We constructed the standard curve by staining TC-1/E2
cells with anti-Her-2 (clone Ab-5) antibody to obtain absolute serum Her-2 antibody
concentrations.
As in the case of allogeneic splenocyte immunization, vaccination with pE2TM +
pGM-CSF resulted in a stronger IFNγ T cell response in TIEG1-/- mice (Fig. 3.4 A). No
significant difference in T cell response was observed after the first (data not shown) or
second vaccination, but it became apparent after the third immunization. The
concentration of Her-2-specific T cells in spleens of TIEG1-/- mice was as high as 1100
cells/106 splenocytes with a mean of approximately 500 cells/106 splenocytes. T cell
response in the wild type mice on the other hand did not exceed 500 cells/106
splenocytes with a mean of only 200cells/106 splenocytes. As with the allogeneic
splenocyte immunization, T cell response to DNA vaccine in TIEG1-/- mice showed a
greater variability than in wild type mice with a few non-responders present. In fact the
Kruskall-Wallis test showed good statistical significance of the difference in the third
vaccination T cell response between the two groups (p-value shown in figure), whereas
a student’s t-test, a statistical test that is more sensitive to outlying data, did not, (not
shown).

36
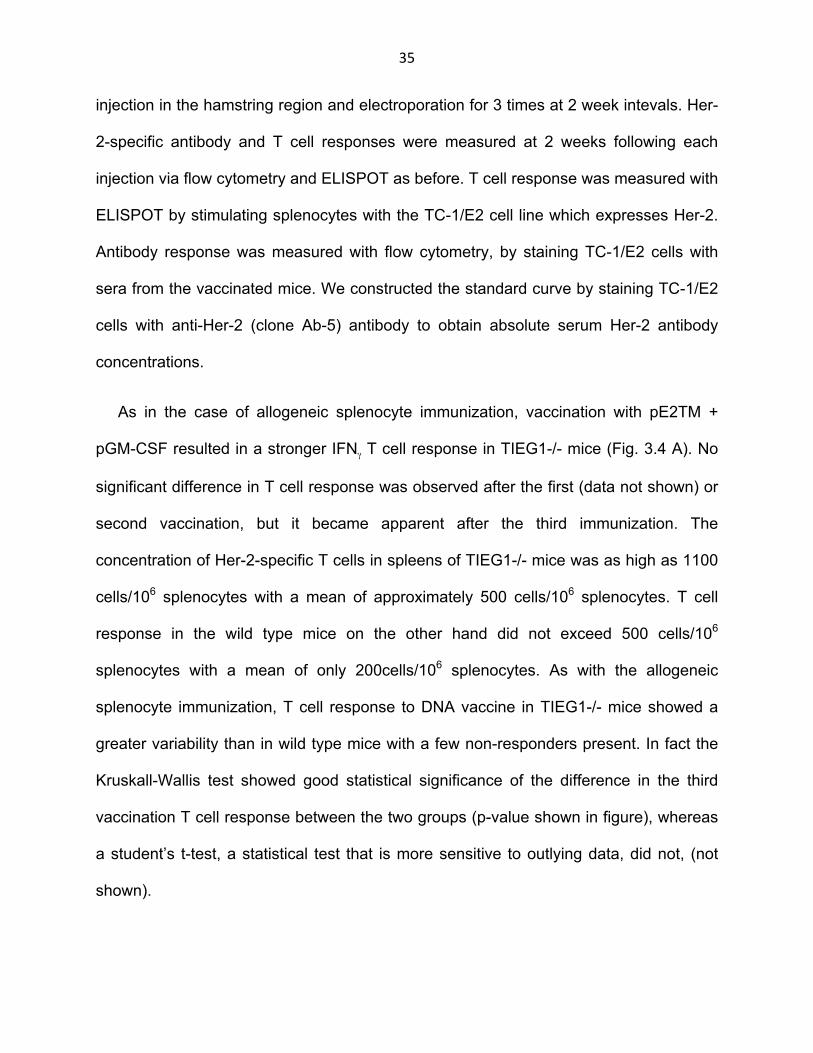
As in the case of allogeneic splenocyte immunization, absence of iTreg or TIEG1 did
not have the same positive effect in the antibody response of TIEG1-/- mice as
compared to their wild type counterparts (Fig. 3.4 B). In fact, IgG response to Her-2
DNA vaccine was surprisingly lower in TIEG1-/- mice starting as early as the first
vaccination and continuing throughout the experiment with strong statistical
significance. Several of the TIEG1-/- mice in particular showed a strikingly impaired
initial antibody response after one vaccination. The same mice tracked throughout the
experiment were very slow to initiate production of anti Her-2 IgG, showing any
detectable antibody levels only after 3 vaccinations. This indicated that, while absence
of iTreg may allow a more robust T cell response, TIEG1 might be involved in other
pathways important in the immune response, specifically that of B cells.
A Her-2 specific IFN-γ-producing T cells in spleen
37
B anti-Her-2 serum antibody
Figure 3.4 Stronger IFN-γ T cell response and lower antibody production in TIEG1-/- mice vaccinated with Her-2 DNA. TIEG1-/- and wild type mice were vaccinated with 50 µg of pE2TM (Her-2 extracellular and transmembrane domains) and pGM-CSF (Granulocyte Monocyte Colony-Stimulating Factor) plasmid DNA each via i.m. injection and electroporation 3 times at 2 week intevals. Her-2-specific antibody and T cell responses were measured at 2 weeks following each injection via flow cytometry and ELISPOT respectively. A Plot of Her-2-specific IFN-γ-producing T cells in ELISPOT of spleens from immunized TIEG1 KO and wild type mice, (*p value shown for Kruskall-Wallis test). B Plot of anti-Her-2 IgG antibody levels in flow cytometry-analyzed sera from immunized TIEG1-/- and wild type mice.
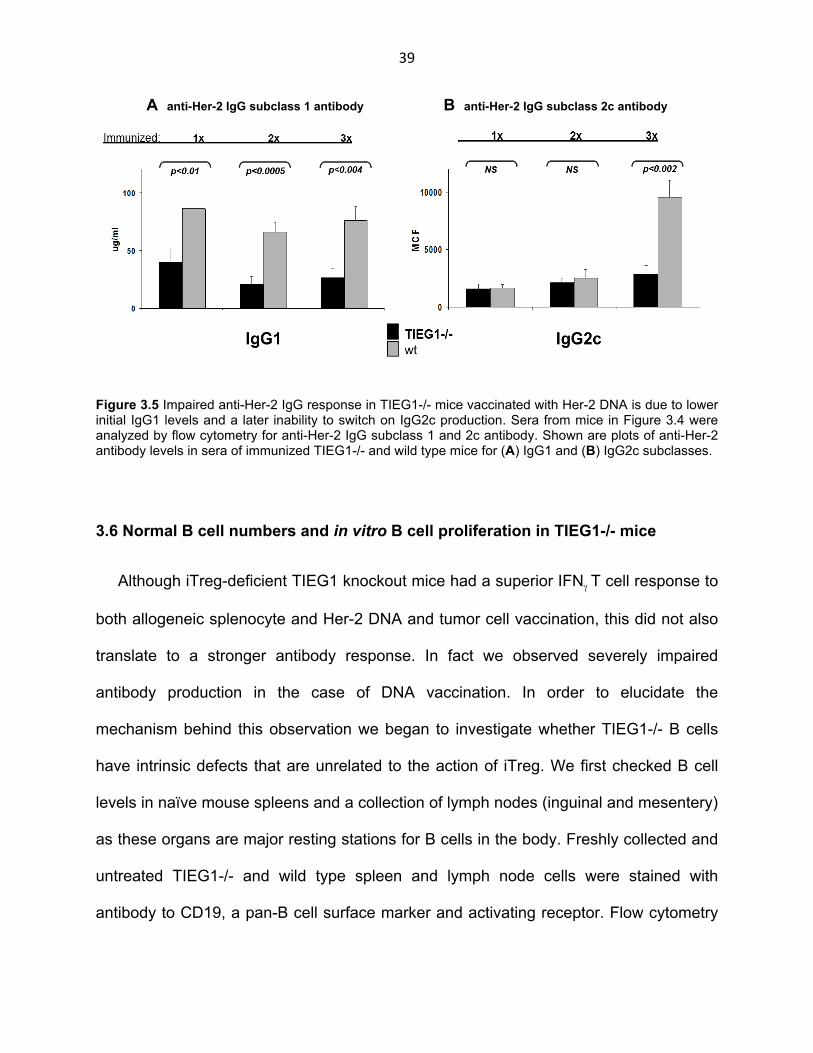
3.5 Deficient IgG1 subclass antibody production and impaired switch to subclass
IgG2c in Her-2 DNA vaccination of TIEG1-/- mice
Given that the IgG response to Her-2 DNA vaccination was impaired in TIEG1-/-
mice, we further investigated weather this disparity was due to different contributions
among the IgG subclasses. We measured levels of IgG1, IgG2c and IgG3 in the sera of
the vaccinated mice by flow cytometry using labeled secondary antibodies specific for
each subclass. (Mice of the C57Bl/6 strain have only the c version of the IgG2 gene).
Given that the purified commercial anti-Her-2 antibody (Ab-5) used to construct the
standard curve is an IgG1, we could calculate the real IgG1 serum concentrations,
38
whereas the other IgG subclasses could only be measured as relative fluorescence
intensities.
IgG1 was the subclass that appeared earliest in the anti-Her-2 IgG response in both
the TIEG1-/- and wild type strains (Fig. 3.5 A). In keeping with the trend observed in
total IgG (Fig. 3.4 B), IgG1 levels were significantly lower in TIEG1-/- mice starting with
the first vaccination and continuing to stay impaired for the rest of the experiment.
Levels of IgG2c were negligible after the first and second vaccinations for both the
TIEG1-/- and wild type groups, indicating that a switch to this subclass happens in later
stages of Her-2 DNA vaccination (Fig. 3.5 B). Indeed IgG2c showed a strong response
in wild type mice after the third vaccination. However, this increase was almost absent
in the TIEG1-/- group indicating an inability of TIEG1-/- mice to switch to production of
an antibody of a different subclass. IgG3 is a relatively minor component of the IgG
response and its levels in our sera were negligible (data not shown). In conclusion,
lower IgG levels in TIEG1-/- mice are due to an impaired IgG1 response as well as a
later inability to switch on production of IgG2c.
39
A anti-Her-2 IgG subclass 1 antibody B anti-Her-2 IgG subclass 2c antibody
Figure 3.5 Impaired anti-Her-2 IgG response in TIEG1-/- mice vaccinated with Her-2 DNA is due to lower initial IgG1 levels and a later inability to switch on IgG2c production. Sera from mice in Figure 3.4 were analyzed by flow cytometry for anti-Her-2 IgG subclass 1 and 2c antibody. Shown are plots of anti-Her-2 antibody levels in sera of immunized TIEG1-/- and wild type mice for (A) IgG1 and (B) IgG2c subclasses.
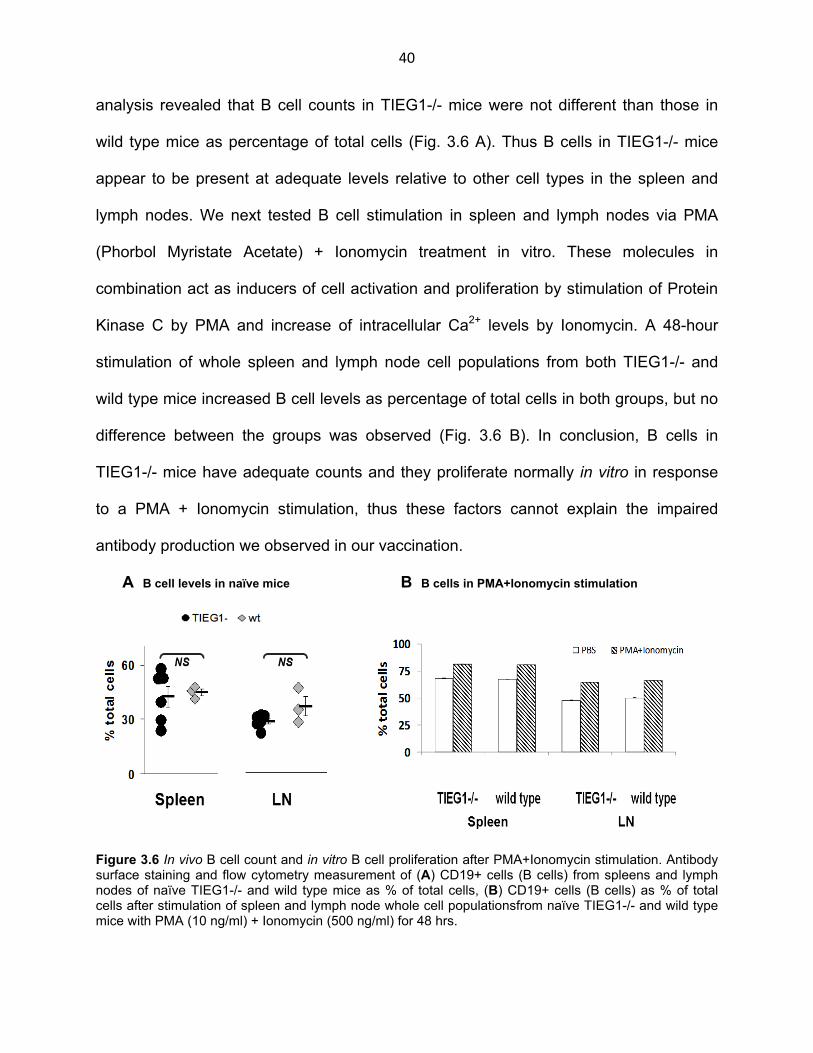
3.6 Normal B cell numbers and in vitro B cell proliferation in TIEG1-/- mice
Although iTreg-deficient TIEG1 knockout mice had a superior IFNγ T cell response to
both allogeneic splenocyte and Her-2 DNA and tumor cell vaccination, this did not also
translate to a stronger antibody response. In fact we observed severely impaired
antibody production in the case of DNA vaccination. In order to elucidate the
mechanism behind this observation we began to investigate whether TIEG1-/- B cells
have intrinsic defects that are unrelated to the action of iTreg. We first checked B cell
levels in naïve mouse spleens and a collection of lymph nodes (inguinal and mesentery)
as these organs are major resting stations for B cells in the body. Freshly collected and
untreated TIEG1-/- and wild type spleen and lymph node cells were stained with
antibody to CD19, a pan-B cell surface marker and activating receptor. Flow cytometry
40
analysis revealed that B cell counts in TIEG1-/- mice were not different than those in
wild type mice as percentage of total cells (Fig. 3.6 A). Thus B cells in TIEG1-/- mice
appear to be present at adequate levels relative to other cell types in the spleen and
lymph nodes. We next tested B cell stimulation in spleen and lymph nodes via PMA
(Phorbol Myristate Acetate) + Ionomycin treatment in vitro. These molecules in
combination act as inducers of cell activation and proliferation by stimulation of Protein
Kinase C by PMA and increase of intracellular Ca2+ levels by Ionomycin. A 48-hour
stimulation of whole spleen and lymph node cell populations from both TIEG1-/- and
wild type mice increased B cell levels as percentage of total cells in both groups, but no
difference between the groups was observed (Fig. 3.6 B). In conclusion, B cells in
TIEG1-/- mice have adequate counts and they proliferate normally in vitro in response
to a PMA + Ionomycin stimulation, thus these factors cannot explain the impaired
antibody production we observed in our vaccination.
A B cell levels in naïve mice B B cells in PMA+Ionomycin stimulation
Figure 3.6 In vivo B cell count and in vitro B cell proliferation after PMA+Ionomycin stimulation. Antibody surface staining and flow cytometry measurement of (A) CD19+ cells (B cells) from spleens and lymph nodes of naïve TIEG1-/- and wild type mice as % of total cells, (B) CD19+ cells (B cells) as % of total cells after stimulation of spleen and lymph node whole cell populationsfrom naïve TIEG1-/- and wild type mice with PMA (10 ng/ml) + Ionomycin (500 ng/ml) for 48 hrs.
41
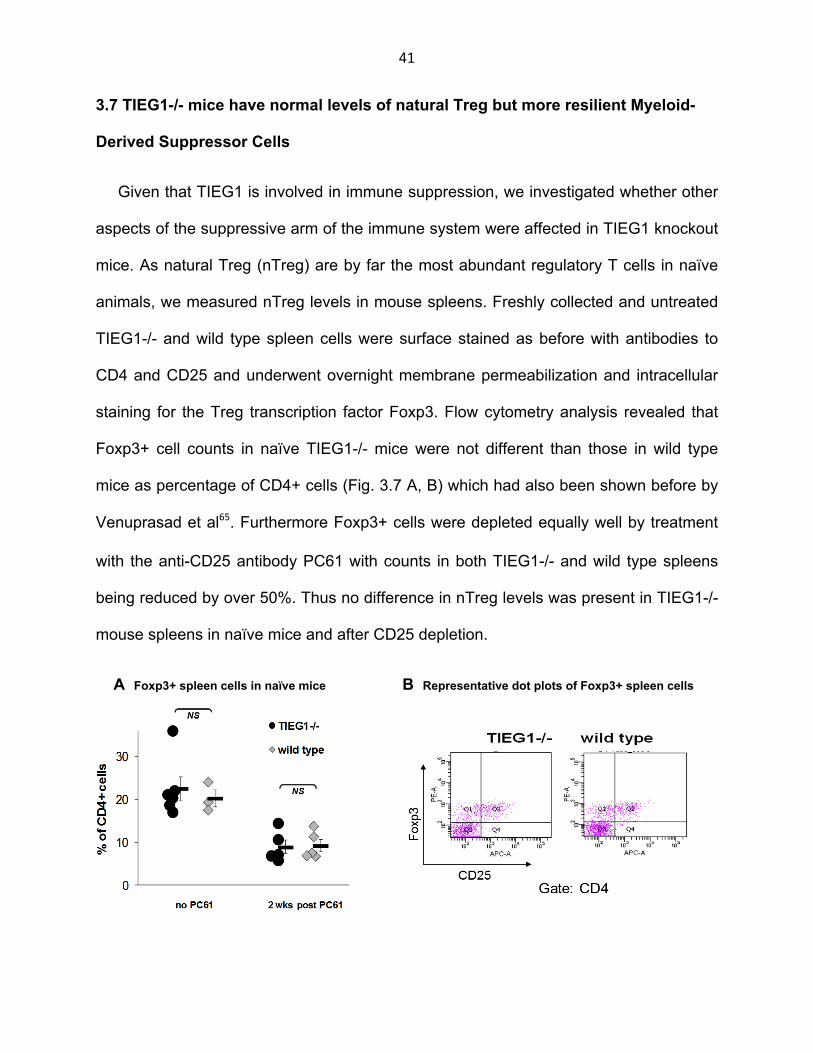
3.7 TIEG1-/- mice have normal levels of natural Treg but more resilient Myeloid-
Derived Suppressor Cells
Given that TIEG1 is involved in immune suppression, we investigated whether other
aspects of the suppressive arm of the immune system were affected in TIEG1 knockout
mice. As natural Treg (nTreg) are by far the most abundant regulatory T cells in naïve
animals, we measured nTreg levels in mouse spleens. Freshly collected and untreated
TIEG1-/- and wild type spleen cells were surface stained as before with antibodies to
CD4 and CD25 and underwent overnight membrane permeabilization and intracellular
staining for the Treg transcription factor Foxp3. Flow cytometry analysis revealed that
Foxp3+ cell counts in naïve TIEG1-/- mice were not different than those in wild type
mice as percentage of CD4+ cells (Fig. 3.7 A, B) which had also been shown before by
Venuprasad et al65. Furthermore Foxp3+ cells were depleted equally well by treatment
with the anti-CD25 antibody PC61 with counts in both TIEG1-/- and wild type spleens
being reduced by over 50%. Thus no difference in nTreg levels was present in TIEG1-/-
mouse spleens in naïve mice and after CD25 depletion.
A Foxp3+ spleen cells in naïve mice B Representative dot plots of Foxp3+ spleen cells
42
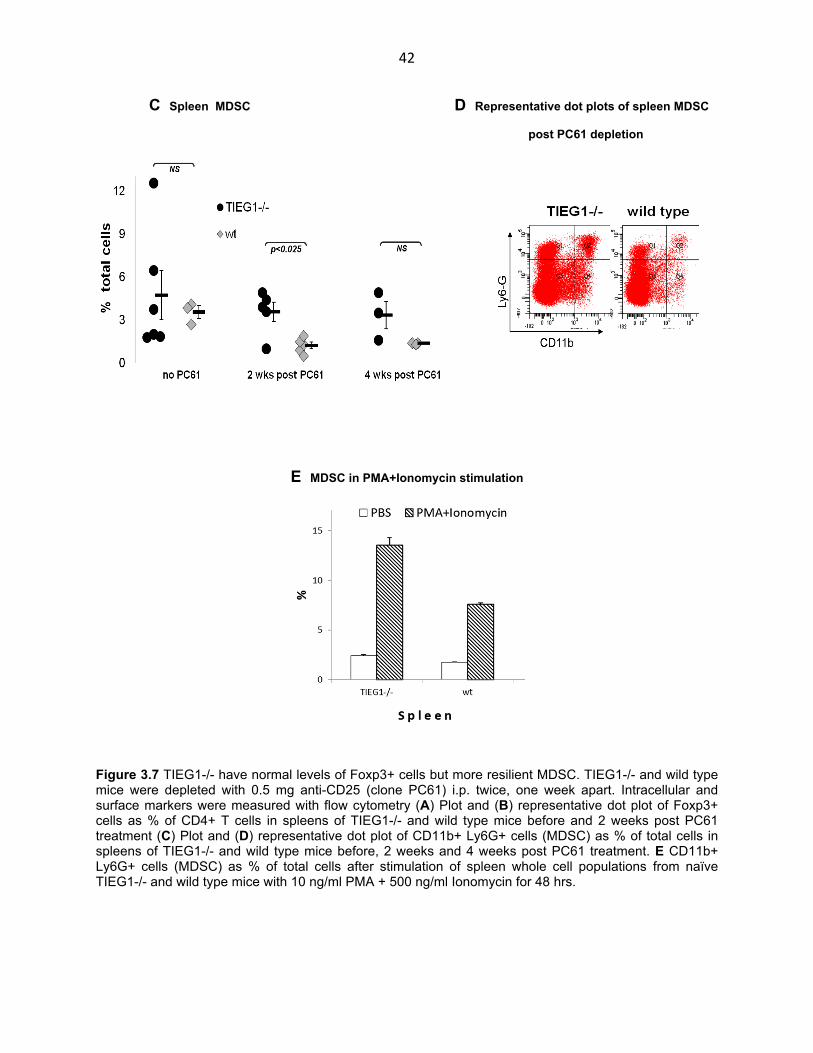
C Spleen MDSC D Representative dot plots of spleen MDSC
post PC61 depletion
E MDSC in PMA+Ionomycin stimulation
Figure 3.7 TIEG1-/- have normal levels of Foxp3+ cells but more resilient MDSC. TIEG1-/- and wild type mice were depleted with 0.5 mg anti-CD25 (clone PC61) i.p. twice, one week apart. Intracellular and surface markers were measured with flow cytometry (A) Plot and (B) representative dot plot of Foxp3+ cells as % of CD4+ T cells in spleens of TIEG1-/- and wild type mice before and 2 weeks post PC61 treatment (C) Plot and (D) representative dot plot of CD11b+ Ly6G+ cells (MDSC) as % of total cells in spleens of TIEG1-/- and wild type mice before, 2 weeks and 4 weeks post PC61 treatment. E CD11b+ Ly6G+ cells (MDSC) as % of total cells after stimulation of spleen whole cell populations from naïve TIEG1-/- and wild type mice with 10 ng/ml PMA + 500 ng/ml Ionomycin for 48 hrs.
43
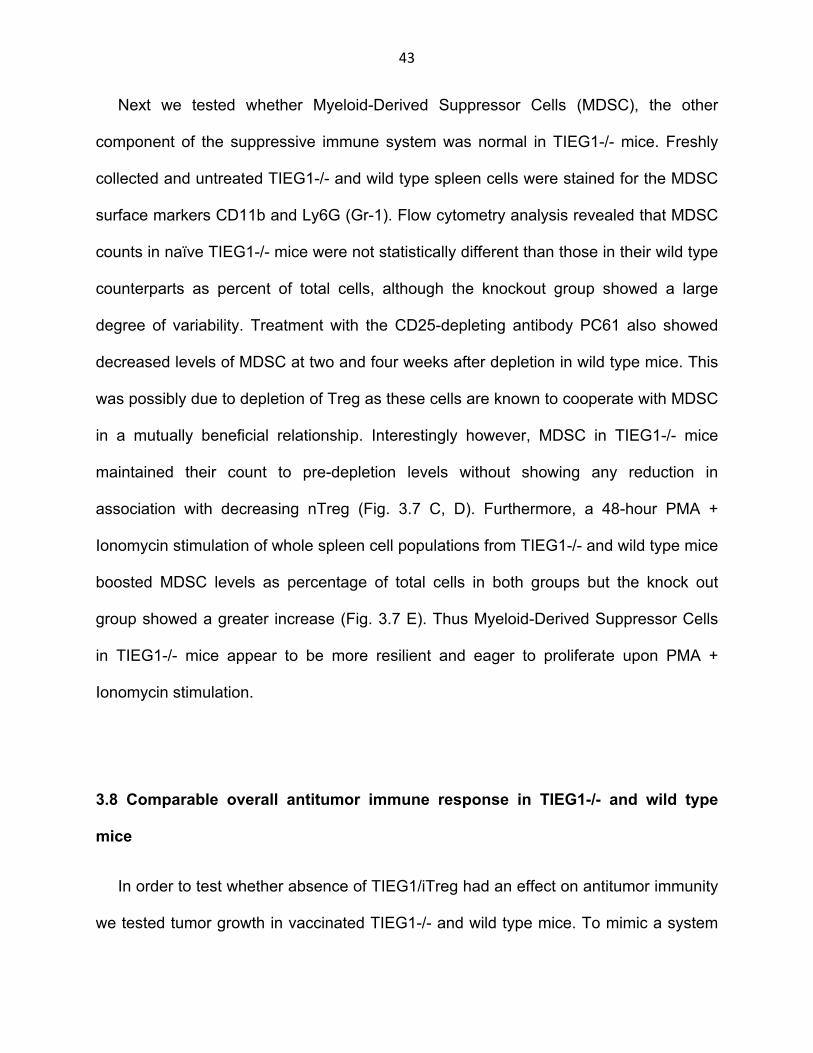
Next we tested whether Myeloid-Derived Suppressor Cells (MDSC), the other
component of the suppressive immune system was normal in TIEG1-/- mice. Freshly
collected and untreated TIEG1-/- and wild type spleen cells were stained for the MDSC
surface markers CD11b and Ly6G (Gr-1). Flow cytometry analysis revealed that MDSC
counts in naïve TIEG1-/- mice were not statistically different than those in their wild type
counterparts as percent of total cells, although the knockout group showed a large
degree of variability. Treatment with the CD25-depleting antibody PC61 also showed
decreased levels of MDSC at two and four weeks after depletion in wild type mice. This
was possibly due to depletion of Treg as these cells are known to cooperate with MDSC
in a mutually beneficial relationship. Interestingly however, MDSC in TIEG1-/- mice
maintained their count to pre-depletion levels without showing any reduction in
association with decreasing nTreg (Fig. 3.7 C, D). Furthermore, a 48-hour PMA +
Ionomycin stimulation of whole spleen cell populations from TIEG1-/- and wild type mice
boosted MDSC levels as percentage of total cells in both groups but the knock out
group showed a greater increase (Fig. 3.7 E). Thus Myeloid-Derived Suppressor Cells
in TIEG1-/- mice appear to be more resilient and eager to proliferate upon PMA +
Ionomycin stimulation.
3.8 Comparable overall antitumor immune response in TIEG1-/- and wild type
mice
In order to test whether absence of TIEG1/iTreg had an effect on antitumor immunity
we tested tumor growth in vaccinated TIEG1-/- and wild type mice. To mimic a system
44
where a tumor associated antigen such as the human oncoprotein Her-2 is tolerated by
the immune system as self (similar to a human patient with Her-2+ cancer), we used a
human Her-2 transgenic (Tg) line of mice generated in our lab. In these mice,
expression of the Her-2 transgene is under the control of the whey acidic protein (WAP)
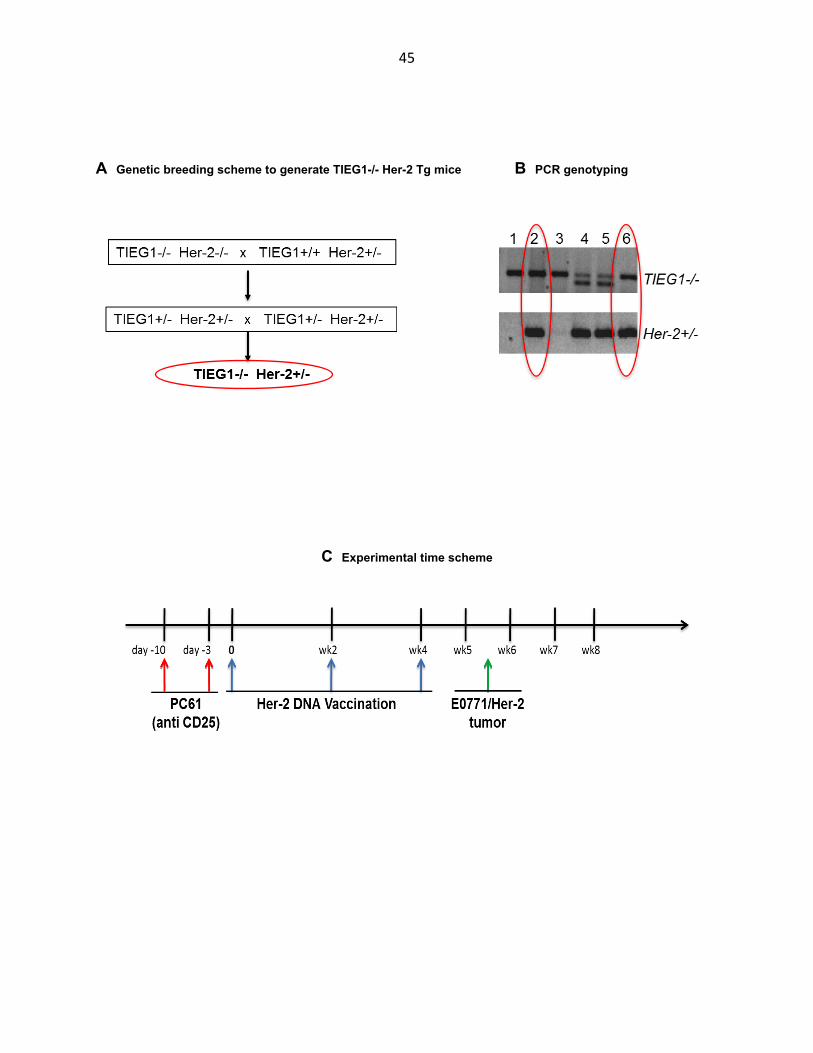
promoter67. We first generated mice that are both TIEG1 knock out and Her-2 Tg by two
rounds of breeding of TIEG1-/- mice with Her-2 Tg heterozygous mice (both of C57Bl/6
genetic background) as shown in Fig. 3.8 A. Mice were genotyped by TIEG1 and Her-2
PCR and knock out-transgenic offspring were selected to test the antitumor response
with Her-2 Tg mice as control (Fig. 3.8 B).
In order to induce an adequate immune response to a self antigen such as Her-2 in
transgenic mice it is necessary to temporarily deplete nTreg prior to DNA vaccination.
TIEG1 KO Her-2 Tg mice and Her-2 Tg controls were injected i.p. with 0.5 mg anti-
CD25 (PC61) antibody twice with a 7 day interval between treatments (Fig. 3.8 C).
Three days after the second injection mice were started on a vaccination scheme with
pE2N plasmid which codes for a hybrid fusion between human Her-2 and its rat
homologue neu as well as pGM-CSF plasmid as in the earlier vaccination experiment.
50 µg DNA of each plasmid was delivered via i.m. injection in the hamstring region and
electroporation for 3 times at 2 week intevals as described earlier. 10 days after the
third vaccination mice were challenged with 2x10⁵ E0771/Her-2 cells, a mouse C57Bl/6
tumor line that has been transfected to express Her-2 thus mimicking a Her-2 positive
malignancy. By this time the effect of PC61 on CD25+ cells is over and CD25+ iTreg
can be normally converted in wild type mice but are unable to do so in TIEG1 knock
outs. Tumor growth was measured over the next several weeks at 3-7 day intervals.
45
A Genetic breeding scheme to generate TIEG1-/- Her-2 Tg mice B PCR genotyping
C Experimental time scheme

46
D Tumor volume
Figure 3.8 TIEG1-/- mice have a comparable antitumor immune response to wild type mice. A TIEG1 KO Her-2 Tg mice were generated by two rounds of breeding starting with TIEG1-/- and Her-2+/- mice to make TIEG1-/- Her2+/- offspring. B Pups were screened separately by PCR for the TIEG1 KO allele as described in Figure 3.1 and for the Her-2 transgene (94oC x 30 sec denaturation, 65oC x 1 min annealing and 72oC x 1 min extension, repeated for 33 cycles). C TIEG1 KO Her-2 Tg mice (and Her-2 Tg controls) were depleted with 0.5 mg anti-CD25 (clone PC61) i.p. twice, one week apart. 3 days later they started Her-2 DNA vaccination with 50 µg of pE2N (human Her-2 - rat neu hybrid) and pGM-CSF (Granulocyte Monocyte Colony-Stimulating Factor) plasmid DNA each via i.m. injection and electroporation 3 times at 2-week intevals. 10 days later mice were challenged with 2x10⁵ E0771/Her2 tumor cells at the flank and tumor size was measured at 3-day or weekly intervals after that. D Tumor volume in mm3 (log scale) calculated as the product of tumor width2 x length x 1/2, showed no major difference between TIEG1-/- and wild type mice.
Initially tumors became palpable and grew more slowly in TIEG1-/- mice compared
to wild type controls up to the third week post challenge when the tumor burden in these
mice was smaller than in the wild type group in a statistically significant manner (Fig. 3.8
D). After this point, tumor growth in TIEG1 -/- mice accelerated and caught up with that
in control mice and the two groups remained not different statistically for the rest of the
experiment. The slight advantage in initial antitumor immune response to Her-2 DNA
vaccination that we observed in TIEG1-/- mice, possibly due to absence of iTreg, may
have been erased later by inadequate anti-Her-2 antibodies and perhaps greater
47
immune suppression by Myeloid-Derived Suppressor Cells in these mice as was shown
earlier. In conclusion, TIEG1-/- mice were not able to mount a stronger overall antitumor
immune response.
3.9 A selection process yielded a sub strain of TIEG1-/- mice with a more severely
impaired antibody response
Although TIEG1 KO mice had a generally stronger T cell response, as noted earlier
we observed a greater degree of variability in these mice compared to their wild type
counterparts. An analysis of the earlier Her-2 DNA vaccination experiment showed that
strong IFNγ response in individual mice did not correlate with excessively impaired
antibody production in the same animal (data not shown). A possible explanation for the
variability in T cell response could be genetic factors unknown to us. For this reason we
sought to select for TIEG1-/- mice that have a particularly robust T cell response to DNA
vaccination. Given that the splenectomy we perform in mice in order to obtain cells for
our ELISPOT assay is a terminal procedure, we used inguinal lymph nodes obtained by
survival surgery. Mice were vaccinated similarly to earlier experiments with 50 µg DNA
each of pE2TM + pGM-CSF delivered via i.m. injection in the hamstring region followed
by electroporation for 3 times at 2 week intevals. T cell response was measured at 2
weeks following the third vaccination via ELISPOT as before (Fig. 3.9 A). One male and
two females with the strongest IFNγ response (data not shown) were selected for
breeding. Offspring of the selected mice as well as non-selected TIEG1-/- and wild type
48
controls underwent Her-2 DNA vaccination according to the same scheme as above, 3
times at 2-week intervals.
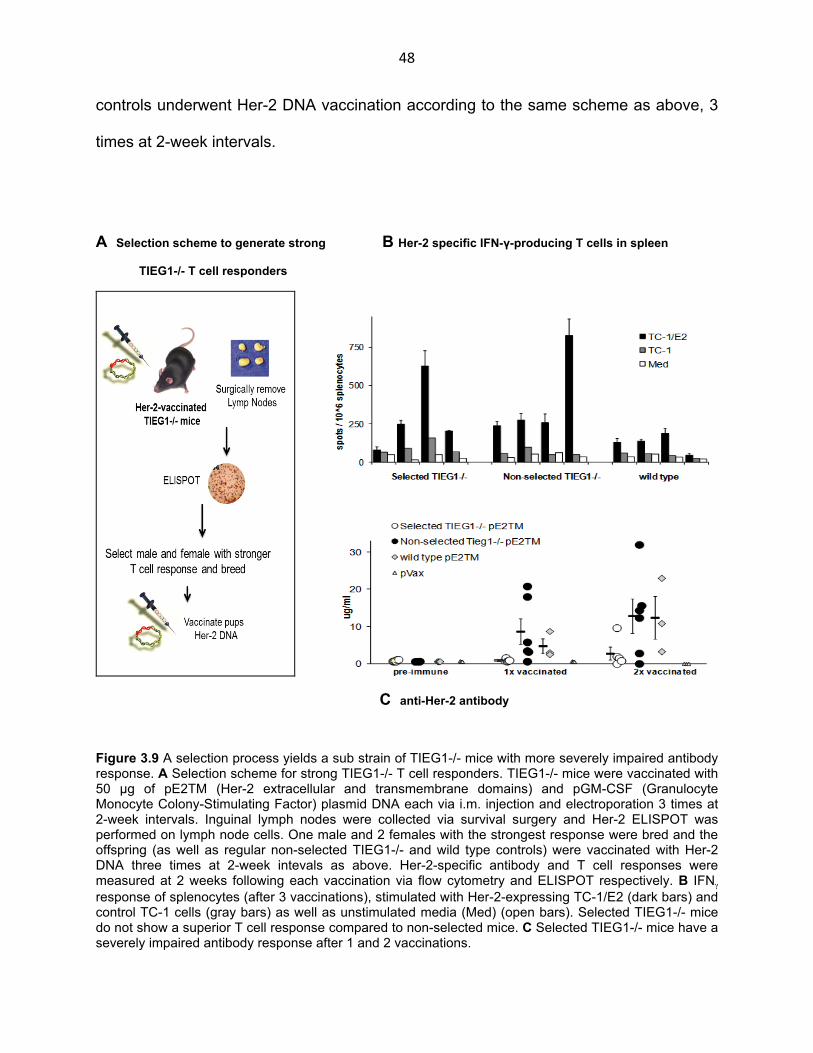
A Selection scheme to generate strong B Her-2 specific IFN-γ-producing T cells in spleen
TIEG1-/- T cell responders
C anti-Her-2 antibody
Figure 3.9 A selection process yields a sub strain of TIEG1-/- mice with more severely impaired antibody response. A Selection scheme for strong TIEG1-/- T cell responders. TIEG1-/- mice were vaccinated with 50 µg of pE2TM (Her-2 extracellular and transmembrane domains) and pGM-CSF (Granulocyte Monocyte Colony-Stimulating Factor) plasmid DNA each via i.m. injection and electroporation 3 times at 2-week intervals. Inguinal lymph nodes were collected via survival surgery and Her-2 ELISPOT was performed on lymph node cells. One male and 2 females with the strongest response were bred and the offspring (as well as regular non-selected TIEG1-/- and wild type controls) were vaccinated with Her-2 DNA three times at 2-week intevals as above. Her-2-specific antibody and T cell responses were measured at 2 weeks following each vaccination via flow cytometry and ELISPOT respectively. B IFNγ
response of splenocytes (after 3 vaccinations), stimulated with Her-2-expressing TC-1/E2 (dark bars) and control TC-1 cells (gray bars) as well as unstimulated media (Med) (open bars). Selected TIEG1-/- mice do not show a superior T cell response compared to non-selected mice. C Selected TIEG1-/- mice have a severely impaired antibody response after 1 and 2 vaccinations.
49
As observed earlier, TIEG1-/- mice as a whole had a stronger T cell response than
wild type controls (Fig. 3.9 B). Selected TIEG1-/- mice however, did not show any
superiority in their T cell response compared to the non-selected, knockout group. In
addition, the variability in IFN-γ T cell response in the selected group seemed to be just
as great among the non-selected mice. Interestingly however, selected mice had
severely impaired levels of anti-Her-2 IgG that continued to stay almost at baseline for
the duration of the experiment (Fig. 3.9 C). That the selection process yielded mice with
almost inexistent antibody response to Her-2 DNA vaccination was unlikely to be due to
the selection criteria for strong T cell response. As mentioned earlier, strong IFNγ
response did not correlate with low IgG levels in individual mice. Furthermore, as
mentioned above, the selected pups themselves did not show a superior ELISPOT
response. Earlier in the project we identified a group of TIEG1-/- mice with particularly
low antibody response to DNA vaccination. We believe that the selection process
inadvertently yielded TIEG1-/- mice with more severely impaired antibody response.
50
CHAPTER 4
DISCUSSION
In this study we tested tumor growth and immune response to various antigens and
immunization methods in mice lacking the TGF-β-Inducible Early Gene 1 (TIEG1).
These mice have normal development and lifespan and showed no signs of disease.
One important immune system defect in TIEG1-/- mice however is their inability to
convert naïve CD4+ T cells into inducible regulatory T cells (iTreg) with immune
suppressive function under the action of the cytokine TGF-β. This conversion happens
normally during an immune response and is an important one among the few immune
suppressive mechanisms an organism employs in order to prevent immune-mediated
tissue damage. Since many suppressive effects of Treg are geared toward T cells
directly or indirectly (via antigen presenting cells), we tested T cell INFγ production in
response to allogeneic splenocytes, Her-2 expressing tumor cells and Her-2 DNA
vaccine. T cells in TIEG1-/- mice responded more strongly to all three immunizations.
This was in line with our hypothesis that iTreg are important in keeping these immune
responses in check and their absence will allow greater activation of T cells. Upon
encountering antigen such as various MHC molecules or Her-2 fragments, antigen
presenting cells will travel to lymph nodes where they will interact with T cells that have
receptors specific for these antigens normally present in the T cell repertoire. How many
and how strongly T cells will be activated and will proliferate depends in part on the
effector or suppressive character of the local microenvironment which is determined by
51
a variety of cell types and the cytokines they produce. We showed that after a few
immunizations, mice lacking iTreg allowed a more robust specific effector T cell
activation and proliferation without any observable adverse effects. It is likely that the
IFNγ-producing T cells we detected in our ELISPOT assay are from a mixture of CD4+
(helper) and CD8+ (cytotoxic) cells since the antigen is probably both presented by our
APC to CD8+ cells via MHC I as well as released in the medium where it can be picked
up by native APC among the mouse splenocytes and presented to CD4+ cells via MHC
II. Of note, although the T cell response was generally higher in TIEG1-/- mice, there
was a great variability in the response in all three types of immunization with a few mice
responding very weakly. In fact, although the T cell difference showed strong statistical
significance for the allogeneic immunization, the same difference was not
straightforward to establish statistically in Her-2 DNA vaccination due to this variation.
Out of two statistical tests employed, student’s t-test and the Kruskall-Wallis test, only
the latter yielded a p-value of less than 0.05 in the case of Her-2 DNA vaccination. We
saw however that the great majority of TIEG1-/- mice had levels of Her-2-specific IFNγ-
producing T cells in their spleens that were much higher than those in the wild type
group.
If absence of iTreg made a difference in T cell response, the effect on B cells was
not as straightforward. The antibody levels we observed in response to the cell-based
immunizations with allogeneic splenocytes and Her-2 expressing tumor cells were not
higher in TIEG1-/- mice compared to wild type controls. Specific IgG levels in the two
groups were in fact equivalent. In the case of DNA vaccination we observed an antibody
response that was actually inferior in TIEG1-/- mice. Furthermore, we showed that this

52
lower IgG concentration in TIEG1-/- sera was due to an initial impaired IgG1 subtype
response as well as an inability to switch to IgG2c after a few rounds of vaccination.
Deficiency in iTreg conversion is unlikely to be responsible for any of these observations
regarding the B cell response in TIEG1-/- mice. As mentioned previously, the first step
for B cell activation and eventual antibody production is encounter with antigen. In
respect to B cells, antigens can be T cell independent (T-I) or -dependent (T-D)22. A T-I
antigen, usually a bacterial cell wall polysaccharide with many repeating units (called a
Type 2 T-I antigen), can crosslink many B cell receptors on the cell surface and does
not require further help. A T-D antigen, usually of protein origin, in addition to
recognition by the BCR, also requires processing and presentation by the B cell to a
CD4+ T helper cell with TCR specific for the same antigen. The three methods of
immunization we performed will eventually produce protein antigens that will require
CD4+ T cell help and are thus T-D antigens. As observed, the immunization-induced
antigen-specific T cells in TIEG1-/- mice were more abundant than in wild types. This
would argue for a stronger B cell response and not an equal or weaker one, which is
what we observed. In addition, the inability of the TIEG1-/- humoral immune system to
later switch to IgG2c, an IgG subclass associated with a Th1 response in mice, also
argues against our observations. Th1-type responses are orchestrated by CD4+ T cells
that elaborate cytokines such as IFNγ which was abundant in our T cell response to
Her-2 DNA vaccination, especially later in the experiment. Thus an explanation for our
defective antibody response based on ineffective T cell help and iTreg deficiency
becomes implausible.
53
The observed deficiency in antibody production indicates rather that TIEG1 might be
involved in other cellular pathways intrinsic to the B cell response. Since we observed
no abnormalities in in vivo B cell numbers or in vitro pan-stimulation via PMA +
Ionomycin, we looked for reported effects of TIEG1 on B cells in literature that were
previously unknown to us. A report by Rian et al.68 showed that TIEG1 is temporally
expressed during B cell development with high levels in early B and Pro-B cells but
undergoes a marked downregulation thereafter, namely in the pre-B and immature B
cell stages. As mentioned earlier, TGF-β and TIEG1 have antiproliferative effects. In
fact the above study showed that TGF-β/TIEG1 stimulation or ectopic overexpression in
pre-B acute lymphoblastic leukemia (ALL) cells inhibited their proliferation and allowed
them to escape chemotherapy that targets dividing cells. Thus, a tight regulation of
TIEG1 expression in specific stages of B cell lymphopoiesis is necessary. The absence
of TIEG1 in our knock out line may interfere with B cell development and be responsible
for our findings in antibody levels. Furthermore, Rian et al. implicated in this process the
transcription factor Id3 whose mRNA induction parallels that of TIEG169. Id3 is one of 4
members of the Id proteins (Inhibitors of Differentiation) which are part of the basic-
helix-loop-helix (bHLH) family of transcription factors. Id proteins dimerize with the other
family members (bHLH and E-proteins) and prevent them from acting as transcription
activators70. Id3 is indeed linked to TIEG1 by the fact that a minor variant of TIEG1
called EGRα (or EGR1), a gene that uses an alternative exon 1 via a different
promoter71 induces expression of Id372. Interestingly, a study of Id3-/- mice by Zhuang
et al. revealed defects in B cell response similar to our observations in the TIEG1-/-
line73. Thus, although Id3-/- mice had normal B cell numbers (as did TIEG1-/- mice),
54
they showed reduced levels of IgG1 and IgG2a in naïve sera. These mice had a
severely impaired response to a Type 2 T-independent antigen in all antibody classes
and IgG subclasses. More importantly to our project Id3-/- mice showed impaired ability
to switch to IgG2a (another version of IgG2c) and IgG3 in response to a T-dependent
antigen. In vitro, their B cells showed proliferation defects in response to BCR
stimulation (unless it was delivered in conjunction with IL-4) but they had normal
proliferation with PMA + Ionomycin and other generic non-BCR stimulants as did
TIEG1-/- B cells. This indicates that defects in the TIEG1/EGR1-Id3 pathway could be
responsible for the abnormal antibody responses we observed.
The fact that absence of TIEG1 did not necessarily cause a defective antibody
response in the two cell-based immunizations seems to contradict the above argument.
One explanation could be that these mice were immunized with rather large doses of
allogeneic spleen cells or Her-2 expressing tumor cells (3-5x10⁶/mouse). Differences in
strong antibody responses may not be detectable with our flow cytometric method and
may require analysis of further diluted serum samples with other techniques such as
ELISA. Another explanation could be that defective B cell responses in Her-2 DNA-
vaccinated TIEG1-/- mice are due to factors intrinsic to DNA vaccination. A DNA-
induced immune response requires cross-presentation by a special kind of antigen
presenting cell among other features typical for DNA vaccination and TIEG1 could be
involved in pathways governing this mechanism.
A direct effect of TIEG1 in T cells, independent of iTreg suppression, should not be
discounted also. Specifically Id3, supposedly a downstream protein of TIEG1, is an
inhibitor of GATA3, the Th2 transcription factor. Indeed, Id3-/- T cells have much higher
55
levels of GATA3 mRNA74. Th2 cytokines favor antibody over T cell responses, however
this is inconsistent with our finding of lower antibody levels. The TIEG1/EGR1-Id3
pathway was also shown to be important in the generation of γδ T cells75 (a special kind
of TCR), however we did not observe any differences in γδ T cells in naïve mice (data
not shown). Lastly, Id3 was also shown to be important in the generation of a Th17
response74, however we did not test for these cells. Addressing these issues will require
testing of TIEG1-/- B or T cells in vitro in response to various stimuli. Mice from the
selected sub strain that have a severely impaired immune response should be used for
these studies.
The fact that we did not observe a superior antitumor immune response in TIEG1-/-
mice challenged with E0771/Her-2 cancer cells is perhaps not surprising considering
the apparent pleiotropic and sometimes contradictory effects of absence of TIEG1 in
immunity. The potent antitumor effects of the stronger T cell response we showed in the
knockout mice could have been obviated by a weaker antibody response as well as
higher levels of immunosuppressive MDSC, which we observed in these mice in vitro. In
conclusion, targeting the transcription factor TIEG1 in cancer immunotherapy showed
some encouraging features, but these were accompanied by other undesirable effects.
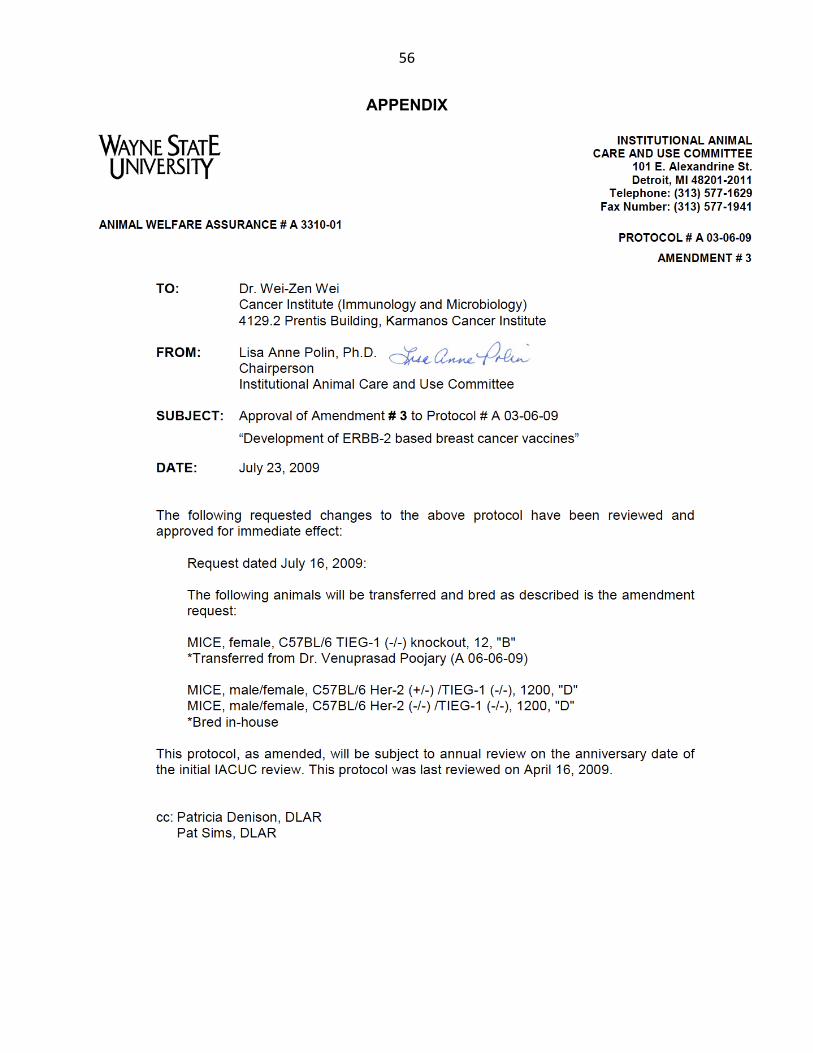
56
APPENDIX
57
58
59
REFERENCES
1Rosenberg,S.A.,Yang,J.C.,Restifo,N.P.(2004)Cancerimmunotherapy:movingbeyond
currentvaccines,NatureMedicine10,909‐915
2Ward,R.L.,Hawkins,N.J.,Coomber,D.,Disis,M.L.(1999)AntibodyimmunitytotheHER‐
2/neuoncogenicproteininpatientswithcolorectalcancer,HumanImmunolgy60,510‐515
3Klebanoff,C.A.,Acquavella,N.,Yu,Z.,Restifo,N.P.(2010)Therapeuticcancervaccines:
arewethereyet?ImmunologicalReviews239,27‐44
4Elias,A.D.(2010)Triple‐negativebreastcancer:ashortreview,AmericanJournalof
ClinicalOncology33,637‐645
5Hurwitz,A.A.,Watkins,S.K.(2012)Immunesuppressioninthetumormicroenvironment:
arolefordendriticcell‐mediatedtolerizationofTcells,CancerImmunologyImmunotherapy
61,289‐293
6Albini,A.,Sporn,M.B.(2007)Thetumormicroenvironmentasatargetfor
chemoprevention,NatureReviewsCancer7,139‐147
7Liao,D.,Liu,Z.,Wrasidlo,W.J.,Luo,Y.,Nguyen,G.,Chen,T.,Xiang,R.,Reisfeld,R.A.
(2011)TargetedtherapeuticremodelingofthetumormicroenvironmentimprovesanHER‐2
DNAvaccineandpreventsrecurrenceinamurinebreastcancermodel,CancerResearch71,
5688‐5696
8Katz,J.B.,Muller,A.J.,Prendergast,G.C.(2008)Indoleamine2,3‐dioxygenaseinT‐cell
toleranceandtumoralimmuneescape,ImmunologicalReviews222,206‐221
60
9 Cools,N.,VanTendeloo,V.F.I.,Smits,E.L.J.M.,Lenjou,M.,Nijs,G.,VanBockstaele,D.R.,
Berneman,Z.N.,Ponsaerts,P.(2008)Immunosuppressioninducedbyimmaturedendritic
cellsismediatedbyTGF‐β/IL‐10double‐positiveCD4+regulatoryTcells,JournalofCellular
andMolecularMedicine12,690–700
10Yang,L.,Pang,Y.,Moses,H.L.(2010)TGF‐betaandimmunecells:animportant
regulatoryaxisinthetumormicroenvironmentandprogression,TrendsinImmunology31,
220‐227
11Sakaguchi,S.(2005)NaturallyarisingFoxp3‐expressingCD25+CD4+regulatoryTcellsin
immunologicaltolerancetoselfandnon‐self,NatureImmunology6,345‐52
12Zou,W.(2006)RegulatoryTcells,tumourimmunityandimmunotherapy,NatureReviews
Immunology6,295‐307
13Wilke,C.M.,Wu,K.,Zhao,E.,Wang,G.,Zou,W.(2010)Prognosticsignificanceof
regulatoryTcellsintumor,InternationalJournalofCancer127,748-758
14Bargmann,C.I.,Hung,M.C.,Weinberg,R.A.(1986)Theneuoncogeneencodesan
epidermalgrowthfactorreceptor‐relatedprotein,Nature319,226‐230
15Slamon,D.J.,Godolphin,W.,Jones,L.A.,Holt,J.A.,Wong,S.G.,Keith,D.E.,Levin,W.J.,
Stuart,S.G.,Udove,J.,Ullrich,A.,Press,M.F.(1989)StudiesoftheHER‐2/neuproto‐
oncogeneinhumanbreastandovariancancer,Science244,707‐712
16Fulton,A.,Miller,F.,Weise,A.,Wei,W.Z.(2006‐2007)Prospectsofcontrollingbreast
cancermetastasisbyimmuneintervention,BreastDisease26,115‐127
61
17Romond,E.H.,Perez,E.A.,Bryant,J.,Suman,V.J.,Geyer,C.E.Jr.,Davidson,N.E.,Tan‐
Chiu,E.,Martino,S.,Paik,S.,Kaufman,P.A.,Swain,S.M.,Pisansky,T.M.,Fehrenbacher,L.,
Kutteh,L.A.,Vogel,V.G.,Visscher,D.W.,Yothers,G.,Jenkins,R.B.,Brown,A.M.,Dakhil,S.
R.,Mamounas,E.P.,Lingle,W.L.,Klein,P.M.,Ingle,J.N.,Wolmark,N.(2005)Trastuzumab
plusadjuvantchemotherapyforoperableHER2‐positivebreastcancer,NewEnglandJournal
ofMedicine353,1673‐1684
18Berns,K.,Horlings,H.M.,Hennessy,B.T.,Madiredjo,M.,Hijmans,E.M.,Beelen,K.,Linn,
S.C.,Gonzalez‐Angulo,A.M.,Stemke‐Hale,K.,Hauptmann,M.,Beijersbergen,R.L.,Mills,G.
B.,vandeVijver,M.J.,Bernards,R.(2007)AfunctionalgeneticapproachidentifiesthePI3K
pathwayasamajordeterminantoftrastuzumabresistanceinbreastcancer,CancerCell12,
395‐402
19Norell,H.,Poschke,I.,Charo,J.,Wei,W.Z.,Erskine,C.,Piechocki,M.P.,Knutson,K.L.,
Bergh,J.,Lidbrink,E.,Kiessling,R.(2010)VaccinationwithaplasmidDNAencodingHER‐
2/neutogetherwithlowdosesofGM‐CSFandIL‐2inpatientswithmetastaticbreast
carcinoma:apilotclinicaltrial,JournalofTranslationalMedicine8,53
20Wei,W.Z.,Jacob,J.,Radkevich‐Brown,O.,Whittington,P.,Kong,Y.C.(2008)The"A,B
andC"ofHer‐2DNAvaccinedevelopment,CancerImmunologyandImmunotherapy57,
1711‐1717
21Jacob,J.B.,Quaglino,E.,Radkevich‐Brown,O.,Jones,R.F.,Piechocki,M.P.,Reyes,J.D.,
Weise,A.,Amici,A.,Wei,W.Z.(2010)CombininghumanandratsequencesinHer‐2DNA
vaccinesbluntsimmunetoleranceanddrivesantitumorimmunity,CancerResearch70,119‐
128
62
22Janeway,C.A.,Travers,P.,Walport,M.,Shlomchik,M.J.(2001)Immunobiology5,the
immunesysteminhealthanddisease(5thed),GarlandPublishing
23Jacob,J.B.,Quaglino,E.,Radkevich‐Brown,O.,Jones,R.F.,Piechocki,M.P.,Reyes,J.D.,
Weise,A.,Amici,A.,Wei,WZ.(2010)CombininghumanandratsequencesinHer‐2DNA
vaccinesbluntsimmunetoleranceanddrivesantitumorimmunity,CancerResearch70,119‐
128
24Shevach,E.M.(2001)Certifiedprofessionals:CD4+CD25+suppressorTcells,Journalof
ExperimentalMedicine193,F41‐F45
25Sakaguchi,S.(2004)NaturallyarisingCD4+regulatoryTcellsforimmunologicself‐
toleranceandnegativecontroloftheimmuneresponses,AnnualReviewofImmunology22,
531‐562
26Sakaguchi,S.,Sakaguchi,N.,Asano,M.,Itoh,M.,Toda,M.(1995)Immunologicself‐
tolerancemaintainedbyactivatedT‐cellsexpressingIL‐2receptorα‐chains(CD25).
Breakdownofasinglemechanismofself‐tolerancecausesvariousautoimmunediseases,
JournalofImmunology155,1151‐1164
27Sakaguchi,S.,Wing,K.,Onishi,Y.,Prieto‐Martin,P.,Yamaguchi,T.(2009)RegulatoryT
cells:howdotheysuppressimmuneresponses?InternationalImmunology21,1105‐1111
28DiPaolo,R.J.,Brinster,C.,Davidson,T.S.,Andersson,J.,Glass,D.,Shevach,E.M.(2007)
Autoantigen‐specificTGF‐β‐inducedFoxp3+regulatoryTcellspreventautoimmunityby
inhibitingdendriticcellsfromactivatingautoreactiveTcellsJournalofImmunology179,
4685‐4693
63
29Fujimoto,S.,Greene,M.,Sehon,A.H.(1975)ImmunosupressorTcellsintumorbearing
host,ImmunologicalCommunications4,201‐217
30Zou,W.(2005)Immunosupressivenetworksinthetumorenvironmentandtheir
therapeuticrelevance,NatureReviewsCancer5,263‐274
31Shimizu,J.,Yamazaki,S.,Sakaguchi,S.(1999)Inductionoftumorimmunitybyremoving
CD25+CD4+Tcells:acommonbasisbetweentumorimmunityandautoimmunity,Journalof
Immunology163,5211‐5218
32Jacob,J.B.,Kong,Y.C.,Nalbantoglu,I.,Snower,D.P.,Wei,W.Z.(2009)Tumorregression
followingDNAvaccinationandregulatoryTcelldepletioninneutransgenicmiceleadstoan
increasedriskofautoimmunity,JournalofImmunology182,5873‐5881
33Onizuka,S.,Tawara,I.,Shimizu,J.,Sakaguchi,S.,Fujita,T.,Nakayama,E.(1999)Tumor
rejectionbyinvivoadministrationofanti‐CD25(interleukin‐2receptoralpha)monoclonal
antibody,CancerResearch59,3128‐3133
34Chen,W.J.,Jin,W.,Hardegen,N.,Lei,K.,Li,L.,Marinos,N.,McGrady,G.,Wahl,S.M.
(2003)ConversionofperipheralCD4+CD25‐naiveTcellstoCD4+CD25+regulatoryTcellsby
TGF‐βinductionoftranscriptionfactorFoxp3,TheJournalofExperimentalMedicine198,
1875–1886
35Lal,G.,Zhang,N.,vanderTouw,W.,Ding,Y.,Ju,W.,Bottinger,E.P.,Reid,S.P.,Levy,D.
E.,Bromberg,J.S.(2009)EpigeneticregulationofFoxp3expressioninregulatory
TcellsbyDNAmethylation,JournalofImmunology182,259–273
36Lal,G.,Bromberg,J.S.(2009)EpigeneticmechanismsofregulationofFoxp3expression,
Blood114,3727‐3735
64
37Tone,Y.,Furuuchi,K.,Kojima,Y.,Tykocinski,M.L.,Greene,M.I.,Tone,M.(2008)Smad3
andNFATcooperatetoinduceFoxp3expressionthroughitsenhancer,NatureImmunology
9,194‐202
38Veldhoen,M.,Hocking,R.J.,Atkins,C.J.,Locksley,R.M.,Stockinger,B.(2006)TGFβinthe
contextofaninflammatorycytokinemilieusupportsdenovodifferentiationofIL‐17‐
producingTcells,Immunity24,179–189
39Bettelli,E.,Carrier,Y.,Gao,W.,Korn,T.,Strom,T.B.,Oukka,M.,Weiner,H.L.,Kuchroo,
V.K.(2006)Reciprocaldevelopmentalpathwaysforthegenerationofpathogeniceffector
TH17andregulatoryTcells,Nature441,235‐238
40Mangan,P.R.,Harrington,L.E.,O’Quinn,D.B.,Helms,W.S.,Bullard,D.C.,Elson,C.O.,
Hatton,R.D.,Wahl,S.M.,Schoeb,T.R.,Weaver,C.T.(2006)Transforminggrowthfactor‐β
inducesdevelopmentoftheTh17lineage,Nature441,231‐234
41Littman,D.R.,Rudensky,A.Y.(2010)Th17andregulatoryTcellsinmediatingand
restraininginflammation,Cell140,845–858
42Young,M.R.,Newby,M.,Wepsic,H.T.(1987)Hematopoiesisandsuppressorbone
marrowcellsinmicebearinglargemetastaticLewislungcarcinomatumors,Cancer
Research47,100‐105
43Gabrilovich,D.I.,Nagaraj,S.(2009)Myeloid‐derivedsuppressorcellsasregulatorsofthe
immunesystem,NatureReviewsImmunology9,162‐174
44Yang,L.,Huang,J.,Ren,X.,Gorska,A.E.,Chytil,A.,Aakre,M.,Carbone,D.P.,Matrisian,L.
M.,Richmond,A.,Lin,P.C.,Moses,H.L.(2008)AbrogationofTGF‐βsignalinginmammary
65
carcinomasrecruitsGr‐1+CD11b+myeloidcellsthatpromotemetastasis,CancerCell13,
23–35
45Golgher,D.,Jones,E.,Powrie,F.,Elliott,T.,Gallimore,A.(2002)DepletionofCD25+
regulatorycellsuncoversimmuneresponsestosharedmurinetumorrejectionantigens,
EuropeanJournalofImmunology32,3267–3275
46Colombo,M.P.,Piconese,S.(2007)RegulatoryT‐cellinhibitionversusdepletion:theright
choiceincancerimmunotherapy,NatureReviewsCancer7,880‐887
47Zhou,G.,Levitsky,H.I.(2007)NaturalregulatoryTcellsanddenovo‐inducedregulatoryT
cellscontributeindependentlytotumor‐specifictolerance,TheJournalofImmunology178,
2155–2162
48Lafaille,M.A.C.,Lafaille,J.J.(2009)NaturalandadaptiveFoxp3+regulatoryTcells:more
ofthesameoradivisionoflabor?Immunity30,626‐635
49Liu,V.C.,Wong,L.Y.,Jang,T.,Shah,A.H.,Park,I.,Yang,X.,Zhang,Q.,Lonning,S.,
Teicher,B.A.,Lee,C.(2007)Tumorevasionoftheimmunesystembyconverting
CD4+CD25‐TcellsintoCD4+CD25+Tregulatorycells:roleoftumor‐derivedTGF‐β,The
JournalofImmunology178,2883–2892.
50Nishikawa,H.,Kato,T.,Tanida,K.,Hiasa,A.,Tawara,I.,Ikeda,H.,Ikarashi,Y.,Wakasugi,
H.,Kronenberg,M.,Nakayama,T.,Taniguchi,M.,Kuribayashi,K.,Old,L.J.,Shiku,H.(2003)
CD4+CD25+Tcellsrespondingtoserologicallydefinedautoantigenssuppressantitumor
immuneresponses,ProceedingsoftheNationalAcademyofSciencesoftheUSA100,
10902–10906
66
51Yang,Z.Z.,Novak,A.J.,Ziesmer,S.C.,Witzig,T.E.,Ansell,S.M.(2007)CD70+non‐
HodgkinlymphomaBcellsinduceFoxp3expressionandregulatoryfunctioninintratumoral
CD4+CD25‐Tcells,Blood110,2537‐2544
52Xie,W.,Mertens,J.C.,Reiss,D.J.,Rimm,D.L.,Camp,R.L.,Haffty,B.G.,Reiss,M.(2002)
AlterationsofSmadsignalinginhumanbreastcarcinomaareassociatedwithpooroutcome:
atissuemicroarraystudy,CancerResearch62,497–505,
53Massagué,J.(2008)TGF‐βinCancer,Cell134,215‐230
54Mani,S.A.,Guo,W.,Liao,M.J.,Eaton,E.N.,Ayyanan,A.,Zhou,A.Y.,Brooks,M.,
Reinhard,F.,Zhang,C.C.,Shipitsin,M.,Campbell,L.L.,Polyak,Brisken,C.,Yang,J.,
Weinberg,R.A.(2008)Theepithelial‐mesenchymaltransitiongeneratescellswith
propertiesofstemcells,Cell133,704–715.
55Muñoz,N.M.,Upton,M.,Rojas,A.,Washington,M.K.,Lin,L.,Chytil,A.,Sozmen,E.G.,
Madison,B.B.,Pozzi,A.,Moon,R.T.,Moses,H.L.,Grady,W.M.(2006)Transforming
growthfactorbetareceptortypeIIinactivationinducesthemalignanttransformationof
intestinalneoplasmsinitiatedbyApcmutation,CancerResearch66,9837–9844
56Massagué,J.,Seoane,J.,Wotton,D.(2005)Smadtranscriptionfactors,Genesand
Developement19,2783–2810
57Subramaniam,M.,Harris,S.A.,Oursier,M.J.,Rasmussen,K.,Riggs,B.L.,Spelsberg,T.C.
(1995)IdentificationofanovelTGF‐β‐regulatedgeneencodingaputativezincfingerprotein
inhumanosteoblasts,NucleicAcidsResearch23,4907‐4912
58Cao,Z.,Sun,X.,Icli,B.,Wara,A.K.,Feinberg,M.W.(2010)RoleofKrϋppel‐likefactorsin
leukocytedevelopment,function,anddisease,Blood116,4404‐4414
67
59Tachibana,I.,Imoto,M.,Adjei,P.N.,Gores,G.J.,Subramaniam,M.,Spelsberg,T.C.,
Urrutia,R.(1997)OverexpressionoftheTGFβ‐regulatedzincfingerencodinggene,TIEG,
inducesapoptosisinpancreaticepithelialcells,JournalofClinicalInvestigation99,2365–
2374
60Subramaniam,M.,Hawse,J.R.,Johnsen,S.A.,Spelsberg,T.C.(2007)RoleofTIEG1in
biologicalprocessesanddiseasestates,JournalofCellularBiochemistry102,539–548
61Rajamannan,N.M.,Subramaniam,M.,Abraham,T.P.,Vasile,V.C.,Ackerman,M.J.,
Monroe,D.G.,Chew,T.L.,Spelsberg,T.C.(2007)TGFβinducibleearlygene‐1(TIEG1)and
cardiachypertrophy:discoveryandcharacterizationofanovelsignalingpathway,Journalof
CellularBiochemistry100,315–325
62Bensamoun,S.F.,Hawse,J.R.,Subramaniam,M.,Ilharreborde,B.,Bassillais,A.,
Benhamou,C.L.,Fraser,D.G.,Oursler,M.J.,Amadio,P.C.,An,K.N.,Spelsberg,T.C.(2006)
TGF‐βinducibleearlygene‐1knockoutmicedisplaydefectsinbonestrengthand
microarchitecture,Bone39,1244–1251
63Subramaniam,M.,Gorny,G.,Johnsen,S.A.,Monroe,D.G.,Evans,G.L.,Fraser,,D.G.,
Rickard,D.J.,Rasmussen,K.,vanDeursen,J.M.A.,Turner,R.T.,Oursler,M.J.,Spelsberg,T.
C.(2005)TIEG1nullmouse‐derivedosteoblastsaredefectiveinmineralizationandin
supportofosteoclastdifferentiationinvitro,MolecularandCellularBiology25,1191–1199
64Peng,D.J.,Zeng,M.,Muromoto,R.,Matsuda,T.,Shimoda,K.,Subramaniam,M.,
Spelsberg,T.C.,Wei,W.Z.,Venuprasad,K.(2011)TumorgrowthofTIEG1regulatesFoxp3
expressionandnoncanonicalK27‐linkedpolyubiquitination,TheJournalofImmunolgy186,
5638‐5647
68
65Venuprasad,K.,Huang,H.,Harada,Y.,Elly,C.,Subramaniam,M.,Spelsberg,T.C.,Su,J.,
Liu,Y.C.(2008)TheE3ubiquitinligaseItchregulatesexpressionoftranscriptionfactor
Foxp3andairwayinflammationbyenhancingthefunctionoftranscriptionfactorTIEG1,
NatureImmunology9,245‐253
66Cao,Z.,Wara,A.K.,Icli,B.,Sun,X.,Packard,R.R.S.,Esen,F.,Stapleton,C.J.,
Subramaniam,M.,Kretschmer,K.,Apostolou,I.,vonBoehmer,H.,Hansson,G.K.,
Spelsberg,T.C.,Libby,P.,Feinberg,M.W.(2009)Kruppel‐likefactorKLF10targets
transforminggrowthfactor‐β‐1toregulateCD4(+)CD25(‐)TcellsandTregulatorycells,
JournalofBiologicalChemistry284,24914‐24924
67Piechocki,M.P.,Ho,Y.S.,Pilon,S.,Wei,W.Z.(2003)HumanErbB‐2(Her‐2)transgenic
mice:amodelsystemfortestingHer‐2basedvaccines,TheJournalofImmunology171,
5787‐5794
68Døsen‐Dahl,G.,Munthe,E.,Nygren,M.K.,Stubberud,H.,Hystad,M.E.,Rian,E.(2008)
BonemarrowstromacellsregulateTIEG1expressioninacutelymphoblasticleukemiacells:
roleofTGFbeta/BMP‐6andTIEG1inchemotherapyescape,InternationalJournalofCancer
123,2759‐2766
69Døsen,G.,Nygren,M.K.,Stubberud,H.,Rian,E.(2007)TheroleofTGF‐βInducibleEarly
Gene1(TIEG1)inhumanbonemarrowBlymphopoiesis,(12thCongressoftheEuropean
HematologyAssociation,Abstract),Haemtologica92,[suppl.2]:366.Abstract0986
70Kee,B.L.(2009)EandIDproteinsbranchout,NatureReviewsImmunology9,175‐184
71Fautsch,M.P.,Vrabel,A.,Subramaniam,M.,Hefferen,T.E.,Spelsberg,T.C.,Wieben,E.
D.(1998)TGFbeta‐inducibleearlygene(TIEG)alsocodesforearlygrowthresponsealpha
69
(EGRalpha):evidenceofmultipletranscriptsfromalternatepromoters,Genomics51,408‐
416
72Engel,I.,Murre,C.(2001)ThefunctionofE‐andIdproteinsinlymphocytedevelopment,
NatureReviewsImmunology1,193‐199
73Pan,L.,Sato,S.,Frederick,J.P.,Sun,X.H.,Zhuang,Y.(1999)Impairedimmuneresponses
andB‐cellproliferationinmicelackingtheId3gene,MolecularandCellularBiology19,
5969‐5980
74Maruyama.T.,Li,J.,Vaque,J.P.,Konkel,J.E.,Wang,W.,Zhang,B.,Zhang,P.,Zamarron,
B.F.,Yu,D.,Wu,Y.,Zhuang,Y.,Gutkind,J.S.,Chen,W.(2011)Controlofthedifferentiation
ofregulatoryTcellsandT(H)17cellsbytheDNA‐bindinginhibitorId3,NatureImmunology
12,86‐95
75Lauritsen,J.P.H.,Wong,G.W.,Lee,S.Y.,Lefebvre,J.M.,Ciofani,M.,Rhodes,M.,Kappes,
D.J.,Zúñiga‐Pflücker,J.C.,Wiest,D.L.(2009)DifferentialinductionofId3signalslineage
divergence,Notch‐independentdifferentiation,andfunctionalmaturationofγδTcells,
Immunity31,565–575

70
ABSTRACT
MODULATION OF ANTI-TUMOR IMMUNE RESPONSE BY TGF-β-INDUCILE EARLY GENE 1 (TIEG1)
by
ANDI CANI
December 2012
Advisor: Dr. Wei-Zen Wei
Major: Biochemistry and Molecular Biology
Degree: Master of Science
Cancer immunotherapy has had limited clinical efficacy partly because regulatory T
cells (Treg) suppress the immune response to tumor-associated antigens. Inducible
regulatory T cells (iTreg), which are converted from naïve CD4 T cells by TGF-β, an
abundant cytokine in the tumor microenvironment, may contribute to this immune
suppression. Induction of Foxp3 by TGF-β is mediated by the transcription factor TIEG1
and abrogation of this protein prevents Foxp3 expression. We are testing the
hypothesis that blockade of TIEG1 to prevent iTreg conversion will enhance immune
response in DNA vaccination to the tumor associated antigen Her-2. Wild type and
TIEG1 knockout mice in C57BL/6 background were immunized with three different
antigens, then immune responses were compared. In TIEG1-/- mice, immunization with
allogeneic spleen cells resulted in a stronger T cell response with comparable levels of
antibody. Similarly, Her-2-expressing irradiated tumor cells induced a stronger anti-Her-
2 T cell response in TIEG1-/- mice, without a significant difference in antibody levels.
DNA vaccine encoding human Her-2 also induced a stronger T cell response but with
71
reduced IgG antibody titers specifically in IgG1 and deficient switching to IgG2c. B cells
in TIEG1-/- mice had adequate counts in vivo and they proliferated normally in vitro in
response to PMA + Ionomycin stimulation. Foxp3+ cells had adequate numbers in
TIEG1-/- mice whereas Myeloid Derived Suppressor Cells had stronger proliferation to
PMA + Ionomycin stimulation. Initially tumors grew more slowly in TIEG1-/- mice but the
difference disappeared later. A new sub strain of TIEG1-/- mice was derived that has
similar T cell response but more severely impaired antibody response. Together, these
data suggest an amplified T (but not B) cell response in TIEG1-/- mice, indicating
pleiotropic immune modulating effects of TIEG1.

72
AUTOBIOGRAPHICAL STATEMENT
AUTOBIOGRAPHICAL STATEMENT
Name: Andi Cani
Date of Birth: 30 November, 1979
Father’s name: Dr. Kleomeni Cani MD, PhD
Mother’s name: Zhaneta Cani
Education:
Bachelor of Science, Wayne State University, Detroit, MI, USA (2007)
Major: Chemistry (Emphasis in Biochemistry)
Master of Science, Wayne State University, (2010-2012)
Major: Biochemistry and Molecular Biology
Advisor: Dr. Wei-Zen Wei