SEISMIC DESIGN OF SINGLE-STORY PRECAST STRUCTURES FOR …
36
SEISMIC DESIGN OF SINGLE-STORY PRECAST STRUCTURES FOR 1 P-Δ EFFECTS 2 Marianna Ercolino a , Crescenzo Petrone b , Gennaro Magliulo c and Gaetano Manfredi c 3 a University of Greenwich, Department of Engineering Science, Central Avenue, Medway 4 Campus ME4 4TB Chatham, UK 5 b University College London, Department of Civil, Environmental & Geomatic Engineering, 6 Chadwick Building, WC1E 6BT London, UK 7 c University of Naples Federico II, Department of Structures for Engineering and 8 Architecture, via Claudio 21, 80125 Naples, Italy 9 Biography: Marianna Ercolino is a Senior Lecturer in Civil Engineering at the Department 10 of Engineering Science at the University of Greenwich, London, UK. She has served ACI 11 Italy Chapter as Treasurer and Secretary from 2013 to 2015. She received a PhD in 12 Earthquake Engineering from the University of Naples Federico II, Italy, in 2014. Her 13 research interests are the seismic performance of buildings and infrastructures and non- 14 destructive techniques for structural health monitoring. 15 Crescenzo Petrone is a Research Associate at University College London, London, UK. He 16 received his BS, MSc and PhD in Earthquake Engineering from the University of Naples 17 Federico II, Italy, in 2008, 2010 and 2014, respectively. His research interests include the 18 performance of the built environment under different natural hazards, as earthquake and 19 tsunami. 20 ACI member Gennaro Magliulo is an Assistant Professor at University of Naples Federico 21 II, Naples, Italy. He received his BS, MSc and PhD in Structural Engineering from the 22 University of Naples Federico II, Italy, in 1995, 1997 and 2001, respectively. He has served 23 ACI Italy Chapter as Treasurer and Secretary from 2003 to 2012 and as member of the Board 24
Transcript of SEISMIC DESIGN OF SINGLE-STORY PRECAST STRUCTURES FOR …

SEISMIC DESIGN OF SINGLE-STORY PRECAST STRUCTURES FOR 1
P-Δ EFFECTS 2
Marianna Ercolinoa, Crescenzo Petroneb, Gennaro Magliuloc and Gaetano Manfredic 3
aUniversity of Greenwich, Department of Engineering Science, Central Avenue, Medway 4
Campus ME4 4TB Chatham, UK 5
bUniversity College London, Department of Civil, Environmental & Geomatic Engineering, 6
Chadwick Building, WC1E 6BT London, UK 7
cUniversity of Naples Federico II, Department of Structures for Engineering and 8
Architecture, via Claudio 21, 80125 Naples, Italy 9
Biography: Marianna Ercolino is a Senior Lecturer in Civil Engineering at the Department 10
of Engineering Science at the University of Greenwich, London, UK. She has served ACI 11
Italy Chapter as Treasurer and Secretary from 2013 to 2015. She received a PhD in 12
Earthquake Engineering from the University of Naples Federico II, Italy, in 2014. Her 13
research interests are the seismic performance of buildings and infrastructures and non-14
destructive techniques for structural health monitoring. 15
Crescenzo Petrone is a Research Associate at University College London, London, UK. He 16
received his BS, MSc and PhD in Earthquake Engineering from the University of Naples 17
Federico II, Italy, in 2008, 2010 and 2014, respectively. His research interests include the 18
performance of the built environment under different natural hazards, as earthquake and 19
tsunami. 20
ACI member Gennaro Magliulo is an Assistant Professor at University of Naples Federico 21
II, Naples, Italy. He received his BS, MSc and PhD in Structural Engineering from the 22
University of Naples Federico II, Italy, in 1995, 1997 and 2001, respectively. He has served 23
ACI Italy Chapter as Treasurer and Secretary from 2003 to 2012 and as member of the Board 24
of Directors since 2013. His research interests include earthquake engineering and reinforced 1
concrete structures. 2
Gaetano Manfredi is the Rector of the University of Naples Federico II, Naples, Italy. He 3
received his BS, MSc and PhD in Structural Engineering from the University of Naples 4
Federico II, Italy, in 1986, 1988 and 1993, respectively. His research interests include 5
earthquake engineering, reinforced concrete structures and masonry structures. 6
ABSTRACT 7
A systematic parametric study is performed in order to both (a) investigate the influence of P-8
Δ effects on the seismic response of RC precast one-story structures and (b) assess the 9
efficiency of the corresponding code provisions. At this aim, different design approaches are 10
considered in order to critically review current design provisions included in current building 11
codes with particular focus on Eurocode 8. Numerical analyses demonstrate the significance 12
of the P-Δ effects on the seismic demand in precast structures in terms of displacement 13
ductility. A modification of the approach of current building codes is proposed, which is 14
demonstrated to ensure both a safer behavior and more economic structures. 15
Keywords: P-Δ effects; seismic performance; RC precast structures; Eurocode; seismic 16
design 17
INTRODUCTION 18
When a flexible structure is subjected to horizontal actions, i.e. earthquake actions, the 19
gravity loads acting on the deformed configuration lead to a displacement amplification. This 20
is generally referred to as “P-Δ effects”, or geometric nonlinearity. The factors which govern 21
the intensity of P-Δ effects are the magnitude of the gravity loads and the horizontal 22
displacements induced by the earthquake load. In case either the displacement is significant 23
or gravity loads are large, P-Δ effects can lead to structural instability. Therefore, for flexible 24
structures these effects can be vital and they should be appropriately considered during the 25
seismic design of structures, for instance, by increasing the structure stiffness with member 1
oversizing. The described problem is particularly relevant for precast single-story buildings 2
because of the large flexibility of columns. One-story precast buildings consist of precast 3
columns connected at the top by pinned connections. This structural typology is very flexible 4
and the top horizontal displacement can achieve large values under severe seismic actions. 5
Such a structural typology exhibited significant damage after 2012 Emilia earthquake1-3. 6
In the last decades, several authors carried out research studies in order to investigate P-Δ 7
effects on single-story and multi-story buildings. Firstly, research studies focused on defining 8
when P-Δ effects are negligible4, 5. In these works, the authors defined whether P-Δ effects 9
had to be considered by means of a stability coefficient approach; i.e. some limit values of 10
these coefficients were proposed. The stability coefficient mainly depends on the lateral 11
stiffness of the structure, the ductility demand, and the axial loads. Bernal6 and MacRae7 12
studied this topic and both the authors proposed considering P-Δ effects by increasing the 13
strength of the structure in order to have the same ductility demand as in the structural 14
response without P-Δ effects. In Bernal 6 the amplification factor was defined as the ratio of 15
the strength required to a SDOF system in order to have a given peak displacement ductility 16
demand, with and without P-Δ effects. This amplification factor was strictly correlated to the 17
stability coefficient and displacement ductility; on the contrary, there was no significant 18
correlation of this factor with the structural period. In this study, the stability factor, θ, is 19
defined as the ratio between the axial load and the product of the lateral stiffness and the 20
structure height. MacRae7 demonstrated that the hardening ratio is the most significant 21
parameter in the study of P-Δ effects since this parameter controls the cumulative inelastic 22
deformation and the likely dynamic instability due to the geometric nonlinearity. Recently, 23
Amara et al.8 proposed an accurate analytical definition of the strength amplification factor as 24
a function of the kinematic ductility, the interstory drift sensitivity coefficient and the 25
equivalent viscous damping ratio of the system. Similarly to the other amplification factors, 1
this proposed coefficient should compensate the influence of P-Δ effects in the response of 2
SDOF systems. Humar et al.9 showed that P-Δ effects cause the dynamic instability of the 3
structure if the post-elastic stiffness becomes negative and in this case the amplification of 4
either the strength or the stiffness does not ensure stability. In a single-story structure, a 5
sufficient strain hardening (i.e., larger than the stability factor, θ) can ensure stability since 6
the post-yielding stiffness is positive even in presence of P-Δ effects. In a multi-storey 7
structure, there is no need to strengthen the structure for P−Δ effects if the displacement is in 8
the positive slope of the force–displacement relationship, obtained by a pushover curve. 9
Some research studies criticized the use of the stability coefficient and alternative methods 10
were proposed. Some examples of these works are described in the following. The use of the 11
conventional stability coefficient (θ) may require several iterations to converge in the final 12
design, because, for instance, the initial stiffness is unknown in the initial design phase. 13
Moreover, the stability coefficient neglects some important factors for the seismic safety of 14
structure, such as the shape of the controlling mechanism. In their work, Aschheim and 15
Montes10 used the Yield Point Spectra in order to evaluate the influence of P-Δ effects on the 16
lateral strength associated to constant ductility demands. The proposed design approach 17
provided the estimation of the yield displacement by means of the effective height, heff, 18
representing the magnitude of P-Δ effects. The advantage of this method is that both the 19
effective height and the yield displacement may be estimated in the design phase and they are 20
quite stable parameters, as the initial design concept is refined into the final design. 21
RESEARCH SIGNIFICANCE 22
Current building codes11, 12 consider P-Δ effects according to some of the above-described 23
research studies. The influence of P-Δ effects can be relevant for precast industrial buildings, 24
as it typically leads to a significant member oversizing during the design phase. Literature 25
research studies typically focused on theoretical models, i.e. generic SDOF systems, rather 1
than on real buildings, designed according to the code provisions. The paper aims to assess 2
the reliability of the current approach included in building codes, with particular focus to 3
Eurocode 811, to evaluate the influence of P-Δ effects on the design of single-story precast 4
buildings. The EC8 provisions are adopted in the design of the case-studies, such as the code 5
amplification factor and the minimum size of vertical elements. 6
METHODOLOGY 7
An extensive parametric study is performed on single-story precast structures by varying 8
both the structural geometric features and the seismicity level of the site. The influence of P-9
Δ effects is extensively assessed for the defined case-studies by means of nonlinear dynamic 10
analyses, as in Bernal6 and Humar, Mahgoub9. Each EC811 provision, used in order to take 11
into account P-Δ effects, is investigated and alternative design approaches are assessed by 12
comparing their results with the standard code approach. 13
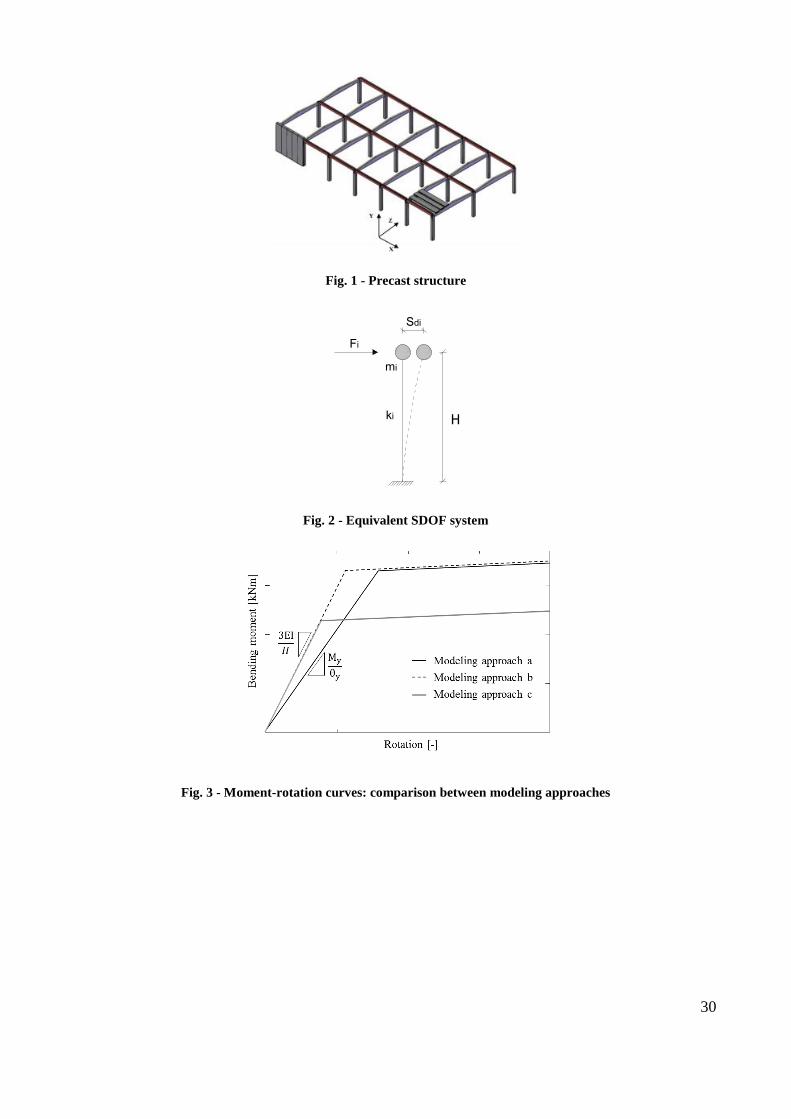
Most of precast industrial structures consist of one-story buildings with slender columns, 14
connected with socket foundations at the base (Fig. 1). Such a connection can ensure a fixed 15
joint at the column base in case the embedded length of the column is adequate (1.5 times the 16
column size), as demonstrated in past works13, 14. The columns are connected to the beams by 17
means of pinned connections (dowel connections), i.e. the flexural stiffness of the connection 18
is very low. This connection is the most typical one in precast buildings and it is also the 19
most critical for P-Δ effects because of the large flexibility of the buildings under seismic 20
actions. For this structural typology, the columns can be modelled as a SDOF system (Fig. 2), 21
characterized by their lateral stiffness and by a mass evaluated from a tributary area 22
approach. 23
Parametric study: selection of the structures 1
The case-studies are defined by varying both the height of the structure and the total seismic 2
mass. The assumed values represent a set of realistic single-story precast structures: four 3
values of the column height H, from 6 m to 12 m (19.7 ft-39.4 ft) and eight values of the 4
mass m, from 10 t to 150 t (22046 lb-330693 lb) are considered. These mass values reflect 5
realistic spans and vertical (permanent and live) loads in precast structures. The minimum 6
value is typical of small dimension structures without roof concrete slab. The maximum value 7
is typical of large dimension structures with a roof concrete slab of 5 cm (1.97 in). Moreover, 8
three design peak ground accelerations, ag, are considered: 0.15 g, 0.25 g and 0.35 g. The 9
total number of investigated structures is equal to 96. The case studies refer to a soil type B, 10
characterized by an average shear wave velocity Vs,30 in the range 360 m/s and 800 m/s 11
(1181 ft/sec-2625 ft/sec), according to EC8. 12
Each column of the case-study has a square cross-section and is designed according to 13
European Building Codes EC215 and EC8. A modal response spectrum analysis is performed 14
and the behavior factor is assumed equal to 3.5, according to the prescription by Italian 15
Building Code16 for ductility class high for single-story precast structures. The Damage 16
Limitation (DL) limit state is satisfied by restricting the inter-story drift to 1% for a frequent 17
earthquake, according to the procedure recommended by EC8 for importance class II. 18
The steel reinforcement has a yield characteristic strength of 450 MPa (9398 kips/ft2), 19
whereas the concrete characteristic compressive cylinder strength is equal to 45 MPa 20
(939.8 kips/ft2). The code design values are used in the design phase. In the design phase, the 21
column elastic stiffness is assumed equal to half of the corresponding gross stiffness to take 22
into account the effect of cracking; the period of the structure is evaluated as T = 2π√m k⁄ , 23
where k is the lateral stiffness of a cantilever scheme. The influence of P-Δ effects on the 24
seismic response is evaluated by means of the stability coefficient, θ, according to the EC8: 25
θ =P
H∙
dr
V ( 1 ) 1
In Eq.1 P is the gravity load, V is the total seismic shear, H is the story height and dr is the 2
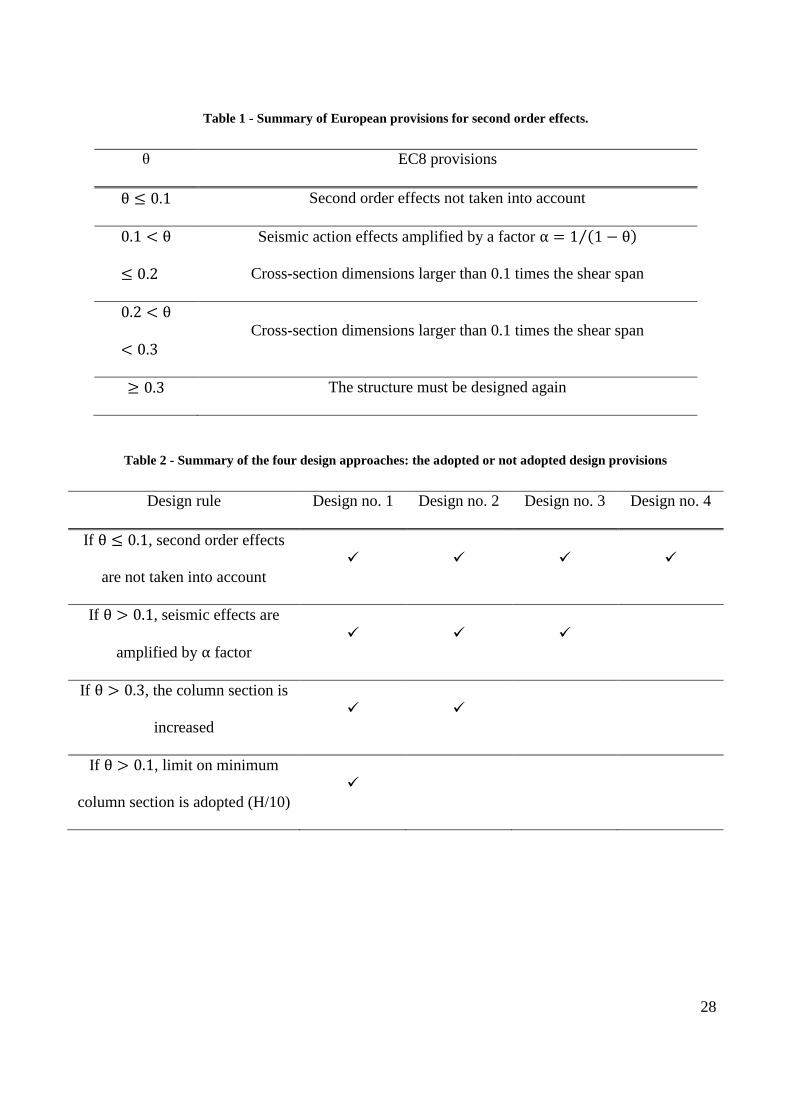
design inter-story drift. EC8 provides different prescriptions depending on the value of this 3
factor, which are summarized in Table 1. P-Δ effects are taken into account if θ is larger than 4
0.1: if θ is smaller than 0.2 the seismic effects should be amplified by a factor, α; the stability 5
factor cannot exceed 0.3. It should be noted that a similar approach is also found in ASCE 6
712, where the stability factor cannot exceed 0.25. If θ is larger than 0.1 in EC8, the cross-7
section dimensions of primary seismic columns should not be smaller than one tenth of the 8
larger distance between the point of contraflexure and the ends of the column, i.e. the shear 9
span. In the following, this code provision is called “H/10 rule”, because the column shear 10
span corresponds to the column height in the investigated structural typology. It should be 11
noted that Eurocode does not provide any prescription in case θ is in the range 0.2 and 0.3; in 12
this study, the structures are designed following the prescriptions of precast structures 13
characterized by θ larger than 0.1, i.e. amplification of the seismic effects and minimum 14
dimensions of the columns. 15
Parametric study: design approaches 16
Four different design approaches (Table 2) are conducted to evaluate the influence of each 17
design provision about second order effects. In particular: 18
- Design approach no. 1 → the structures are designed according to all the design 19
provisions included in Eurocode 8 for P-Δ effects. 20
- Design approach no. 2 → the structures are designed by neglecting the limit about the 21
minimum cross-section dimension of columns if θ is larger than 0.1 (H/10 rule). 22
- Design approach no. 3 → the structures are designed similarly to design no. 2, also 23
neglecting the limit on the maximum value of the stability factor (θ = 0.3). 24
- Design approach no. 4 → the cross-sections of the columns designed in the third 1
approach are used and the reinforcement is designed by neglecting P-Δ effects, i.e. 2
without multiplying the seismic effects by the factor α. 3
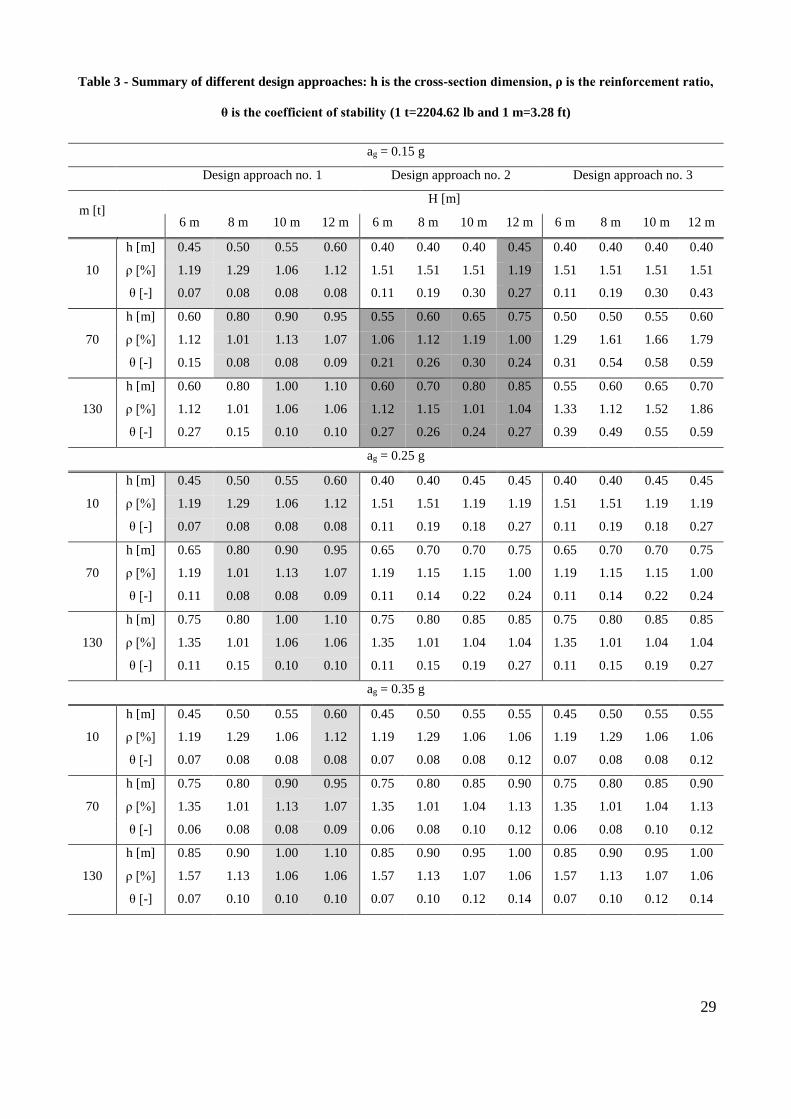
The results of the different design approaches are shown in Table 3 for each height and peak 4
ground acceleration and for some values of mass for the sake of brevity. The table includes 5
the column cross-section dimension (h); the geometric ratio of the longitudinal reinforcement 6
(ρ); and the stability coefficient (θ). The cells of Table 3 have different background colors in 7
order to inform the reader about the factor that mostly influenced the design. In particular, 8
white background is used if the DL limit state influenced the design of the column sections. 9
Light grey background is used if the limit of the minimum column section influenced the 10
design, i.e. H/10 rule; it is worth noting that in this case the cross-section dimension can be 11
smaller than one tenth of the column shear span since the increase of the cross-section may 12
cause θ smaller than 0.1. Dark grey background is used if the section dimensions were 13
increased because θ was larger than 0.3. Dashed background is used if the section was 14
increased because ρ was larger than the maximum limit value (4%). For the sake of brevity, 15
the results of design approach no. 4 are not shown in Table 3; they differ from the results of 16
design approach no. 3 only in terms of longitudinal reinforcement ratio (ρ). In particular, the 17
reinforcement ratio (ρ) decreases for the structures designed for 0.15 g up to 36% for the 18
highest structures (10 m and 12 m). The reinforcement ratio (ρ) does not change in most of 19
the cases with more severe seismic actions. Some conclusions can be drawn according to the 20
results of the four design approaches. 21
- The limitation of the minimum column dimension (H/10 rule) influenced the design 22
of most of the structures of approach no. 1 and this design provision leads to 23
significantly oversized structures17, particularly for low ag values. 24
- As expected, the column sections of design approach no. 2 are equal or smaller than 1
the sections of design approach no. 1. For low seismicity (ag = 0.15 g) the mean ratio 2
between the cross-section dimensions of approach no. 1 and approach no. 2 is equal to 3
1.24. The absence of the section limitation (H/10 rule) causes a low stiffness and, as a 4
consequence, a large value of θ (which might exceed 0.3, requiring an increase in 5
column cross section). A similar ratio is found for tall structures, i.e. 10 m and 12 m 6
(32.8 ft and 39.44 ft), at higher seismicity (ag = 0.25 g); in these cases, θ is smaller 7
than 0.3 and the DL limitation influences the section dimensions. For the highest ag 8
value (0.35 g), the difference between the two approaches is small: in approach no. 1, 9
even if the section was defined by the H/10 rule, the final column dimension is only 10
slightly larger than the dimension required by DL limit state. 11
- Structures designed according to approach no. 3 have the same features (section and 12
reinforcement) of the structures designed with approach no. 2 for ag = 0.25 g and 13
ag = 0.35 g. For ag=0.15 g, cross-section designed according to approach no. 3 are 14
about 30% smaller than approach no. 2, while the reinforcement ratio is increased of 15
about 50%. These differences are caused by the different factors influencing the 16
design: for approach no. 2, the governing rule typically is the need to re-design in case 17
θ is larger than 0.3; for approach no. 3 the governing rule typically is the 4% 18
limitation on maximum longitudinal reinforcement ratio. 19
- Sensibility coefficient θ is smaller than 0.2 for 0.35 g for the different considered 20
approaches; for 0.25 g, it is in the range 0.1÷0.3 for approaches no. 2 and no. 3, while 21
it is much smaller for approach no. 1. Large values of θ are recorded for approach no. 22
3 for ag = 0.15 g; in this case θ is larger than 0.3 for almost all the structures. This 23
phenomenon is caused by the fact that the smaller the peak ground acceleration, the 24
smaller the stiffness; this evidence confirms the conclusion in Andrews18 that P-Δ 1
effects are more influent in low seismic prone areas. 2
- A further observation concerns the fundamental period of vibration of buildings. By 3
moving from approach no. 1 to approach no. 3, the elastic stiffness decreases and, 4
consequently, the fundamental period increases. The period is larger than 2.0 s only 5
for some structures designed for approach no. 3 for ag = 0.15 g. For such long periods, 6
the design spectral acceleration is kept constant to 0.20 times ag value, as prescribed 7
by EC8. 8
Modelling 9
The four different design approaches are compared by means of nonlinear dynamic analyses. 10
The buildings are modelled as SDOF systems and a lumped plasticity approach is used to 11
simulate the nonlinear behavior of the column. The plastic hinges are assigned at the base of 12
the vertical elements. The columns are modeled with a stiff element and they are fixed at the 13
base. The nonlinear model does not take into account the steel bar strain penetration effects in 14
the valuation of the rotation at the base of the column. This assumption can underestimate the 15
drift under seismic actions19. A moment–rotation envelope is assigned at the base of the 16
SDOF system, which is idealized into a bi-linear relationship: an elastic-plastic envelope with 17
post-yield hardening is adopted. The values of the yield and ultimate bending moment, 𝑀𝑦 18
and 𝑀𝑢, are evaluated with a fiber analysis on the section. The yielding curvature is defined 19
as the minimum curvature at which the first steel fiber reaches the yielding strength or the 20
first concrete fiber reaches the compressive strain in the concrete at the peak stress, εc1. In the 21
fiber analysis the concrete confinement due to stirrups is considered, according to Mander, 22
Priestley20. Empirical formulas (Eqs. 2 and 3) are adopted for yielding and ultimate chord 23
rotation, as proposed by Fardis and Biskins21. The terms in the following equations are 24
defined in the reference paper for the sake of brevity. 25
𝜃𝑦 = 𝜙𝑦 ∙𝐿𝑉+𝑎𝑉𝑧
3+ 0.00135 (1 + 1,5
ℎ
𝐿𝑉) +
𝜀𝑦
𝑑−𝑑′∙
𝑑𝑏𝑓𝑦
6√𝑓𝑐 (2) 1
𝜃𝑢 =1
𝛾𝑒𝑙0.016 ∙ (0.3𝜈) [
𝑚𝑎𝑥(0.01;𝜔′)
𝑚𝑎𝑥(0.01;𝜔)𝑓𝑐]
0.225
(𝐿𝑉
ℎ)
0.35
25(𝛼𝜌𝑠𝑥
𝑓𝑦𝑤
𝑓𝑐)1.25(100𝜌𝑑) (3) 2
Ultimate bending moment and rotation allow computing the model post-yield hardening. 3
Mean values of material (steel and concrete) strength are used in the nonlinear analyses. They 4
are evaluated according to Eurocode 213 and Eurocode 8-2 prescriptions15, 22. The geometrical 5
nonlinearities are the unique source of degradation in the moment-curvature envelope. Such 6
an assumption is consistent with the main aim of this paper, i.e. to assess the influence of 7
code provisions for P-Δ effects on the seismic response of precast structures. Both the design 8
approaches and the adopted nonlinear model lead to two important considerations, as follows. 9
- The value of the fundamental period of vibration in the design phase is significantly 10
smaller than the period of the nonlinear model. The former is evaluated referring to 11
the gross section elastic stiffness of the cantilever scheme reduced by a 0.5 factor, 12
taking into account the section cracking, because of the low values of axial loads in 13
this type of structures; on the contrary, the period in the nonlinear analyses is 14
evaluated from the moment-rotation relationship, i.e. according to the secant stiffness 15
at the yielding point. 16
- During the design phase, both the code provisions and the material overstrength could 17
cause an overall structural overstrength, due to seismic detailing rules. For instance, in 18
the design phase the design mechanical features are adopted for the materials, while 19
the corresponding mean values are used in the dynamic analysis. According to 20
Fardis23, the code provision can lead to an overstrength equal to approximately 1.5 for 21
reinforced concrete frames. This value can be larger in case of low seismic intensity 22
and tall buildings because of specific seismic detailing, e.g. H/10 rule and minimum 23
reinforcement ratios. 24
In order to study the influence on the outcomes of the study of both the shift of fundamental 1
period and the design overstrength, three different nonlinear models are defined for the 2
plastic hinge at the column base. In particular, three moment-rotation envelopes are defined 3
(Fig. 3). 4
- Modeling approach a: the elastic stiffness, kel , of the moment-rotation envelope is 5
evaluated from the properties of column section as My θy⁄ . Yield and ultimate 6
rotation and bending moment are evaluated as described above (black solid line in 7
Fig. 3). 8
- Modeling approach b: the initial stiffness of the moment-rotation envelope is set 9
equal to the stiffness assumed during the design phase (black dash-dot line in Fig. 3): 10
the phenomenon of the period shift is therefore removed. The yielding moment and 11
hardening are assumed equal to the corresponding values in the modeling approach a; 12
the yielding rotation is derived from the yielding moment and the assumed elastic 13
stiffness as: My kel⁄ . 14
- Modeling approach c: the elastic stiffness is the same as in modeling approach b and 15
the yielding moment is evaluated from the design acceleration spectrum (gray solid 16
line in Fig. 3). Given the design acceleration, Sad, which corresponds to the 17
fundamental period of vibration T1, the bending moment is evaluated as follows: 18
𝐌𝐲 = {𝐒𝐚𝐝(𝐓𝟏) ∙ 𝐦 ∙ 𝐇 𝐩𝐞𝐫 𝛉 ≤ 𝟎. 𝟏
𝐒𝐚𝐝(𝐓𝟏) ∙ 𝐦 ∙ 𝐇 ∙ 𝟏 (𝟏 − 𝛉)⁄ 𝐩𝐞𝐫 𝟎. 𝟏 < 𝛉 < 𝟎. 𝟑 (4) 19
The bending moment is amplified by the coefficient 1 (1 − θ)⁄ if P-Δ effects were 20
considered in the design phase; in this way, the modeling approach c removes all the 21
overstrength sources (e.g., materials and code detailing provisions) and it takes into 22
account only the overstrength due to geometric nonlinearities. The evaluated 23
overstrength values are always larger than 1.5 and they can assume values up to 5 for 24
low seismic intensity (ag=0.15g and H=12m). The hardening is assumed equal to the 1
values in the other models. 2
Finally, it should be underlined that the behavior of the connections among members, e.g. 3
beam-to column connections24-26, are neglected and assumed to be infinitely strong and stiff. 4
Moreover, any influence of bidirectional loading on the behavior of RC elements27, 28 is not 5
taken into account here. 6
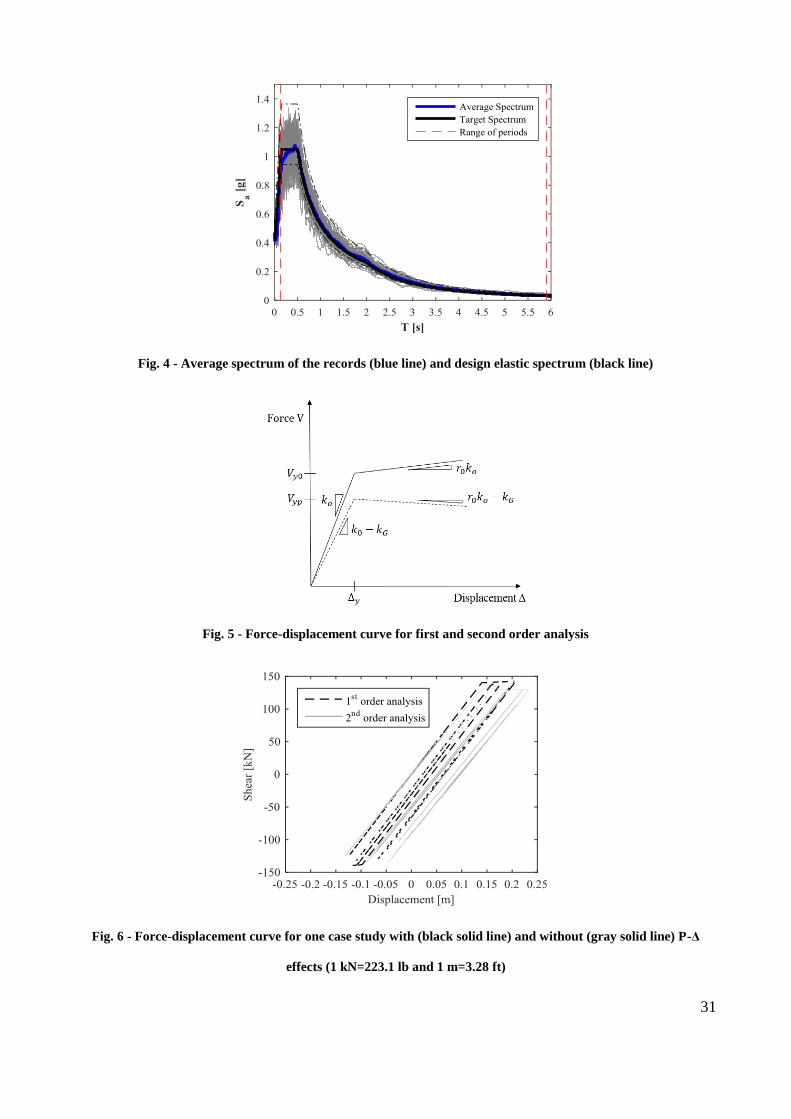
Input selection 7
The main goal of the study is the verification of the code approach, used to take into account 8
P-Δ effects during the design of RC precast structures. At this aim, fifty artificial acceleration 9
time histories for the dynamic analyses are selected and scaled in order to match the elastic 10
code spectrum at the three ag values for soil type B. The generation was performed by means of 11
the SIMQKE program29. The spectrum compatibility is requested in a wide period range 12
(0.12 ÷ 6.0 sec) in order to cover all the possible periods of the case studies11. Fig. 4 shows 13
the elastic spectra of the fifty selected records, scaled in order to match the design elastic 14
spectrum at ag = 0.35 g. In this figure, the average spectrum of the records (solid blue line) is 15
reported along with the design target spectrum (solid black line) and the period range of 16
spectrum compatibility (dashed red lines). 17
Analysis 18
Nonlinear dynamic analyses are performed for all the case studies described in the previous 19
sections with the above described accelerograms. As a consequence, 115,220 analyses are 20
performed: the 96 considered case studies are designed according to the four design 21
approaches; they are modelled according to three modeling approaches and the dynamic 22
analyses are performed by both neglecting (1st order analysis) and considering P-Δ effects 23
(2nd order analysis) with 50 accelerograms. For SDOF systems subjected to a ground 24
acceleration �̈�𝑠(𝑡), the equation of motion is: 25
𝒎�̈� + 𝒃�̇� + 𝒌𝟎𝒖 = −𝒎�̈�𝒔(𝒕) (5) 1
where m is the mass of the oscillator, b is the damping coefficient (the damping ratio 2
𝑏 2√𝑘0𝑚⁄ is assumed equal to 0.05), k0 is the first order elastic stiffness, 𝑢, �̇� and �̈� are the 3
relative displacement, the relative velocity and the relative acceleration of the system, 4
respectively. Newmark’s method30 is adopted and an algorithm is implemented in the 5
program Matlab®31 to solve the equation of motion. 6
Second order effects can be taken into account by decreasing the elastic first order stiffness 7
through a parameter, known as geometric stiffness, kG, which is evaluated as the ratio of the 8
axial force and the height of the system8. The ratio of the geometric stiffness and first order 9
stiffness is the stability coefficient θ. The equation of motion changes when P-Δ effects are 10
considered as follows: 11
𝒎�̈� + 𝒃�̇� + (𝒌𝟎 − 𝒌𝑮)𝒖 = −𝒎�̈�𝒔(𝒕) (6) 12
When the structure experiences nonlinear displacements, the equation of motion can be 13
solved at each time increment by replacing the elastic stiffness, k0, with the tangent stiffness, 14
r0k0, where r0 is the hardening ratio. The geometric stiffness remains constant, even if 15
nonlinearity develops in the SDOF system. The presence of P-Δ effects changes the moment-16
rotation envelope during the dynamic analyses; the moment-rotation envelope in first order 17
analysis is reported in Fig. 5 with solid line while the corresponding behavior in case second 18
order effects are taken into account is shown with dashed line. 𝑉𝑦𝑝 is the reduced yielding 19
force due to the second order effects. 20
RESULTS AND DISCUSSION 21
In this section, the results of nonlinear dynamic analyses are presented for the above-22
described case studies. The first section (“Strength vs ductility demand”) shows the 23
comparison between the first order analysis and the second order analysis to establish the 24
structural demand parameter mostly influenced by P-Δ effects. In order to study the influence 1
of the geometric nonlinearities, the three modeling approaches are compared in terms of 2
ductility demand and the effect of structural overstrength is evaluated (“Influence of the 3
design overstrength and stiffness”). The following sections discuss about the efficiency of the 4
code design provisions used to take into account the P-Δ effects: the limitation on the column 5
dimension (H/10 rule) and the limitation of the stability factor (θ > 0.3). The Section “Design 6
approach no. 4: P-Δ not taken into account” shows the results of the nonlinear dynamic 7
analyses on the case studies, designed according to design approach no.4, i.e. neglecting P-Δ 8
effects provisions. In the last Section (“When are P-Δ effects important?”) the comparison 9
between the analyses with and without P-Δ effects are presented and discussed. 10
Strength vs ductility demand 11
In this section, the influence of P-Δ effects on the seismic response of the investigated 12
structures is assessed by comparing the outcomes of nonlinear dynamic analyses. In 13
particular, the force-displacement curve for the first order analysis (black dashed line in Fig. 14
6) is compared to the corresponding curve for second order analysis (gray solid line in Fig. 15
6), considering a single case study, i.e H = 8 m, m = 50 t, ag = 0.35 g (H = 26.2 ft, 16
m = 110231 lb, ag = 0.35 g). Such a case study is designed according to design approach 17
no. 1 and modelled by adopting modeling approach a. The comparison in Fig. 6 leads to the 18
following conclusions: 19
- the values of the elastic stiffness in the two analyses are different; 20
- the maximum displacement in case P-Δ effects are taken into account is larger than 21
one recorded in the first order analysis; 22
- smaller value of shear force is recorded in the second order analysis. 23
In the following the influence of P-Δ effects is performed in terms of ductility demand rather 24
than in terms of demand forces8. 25
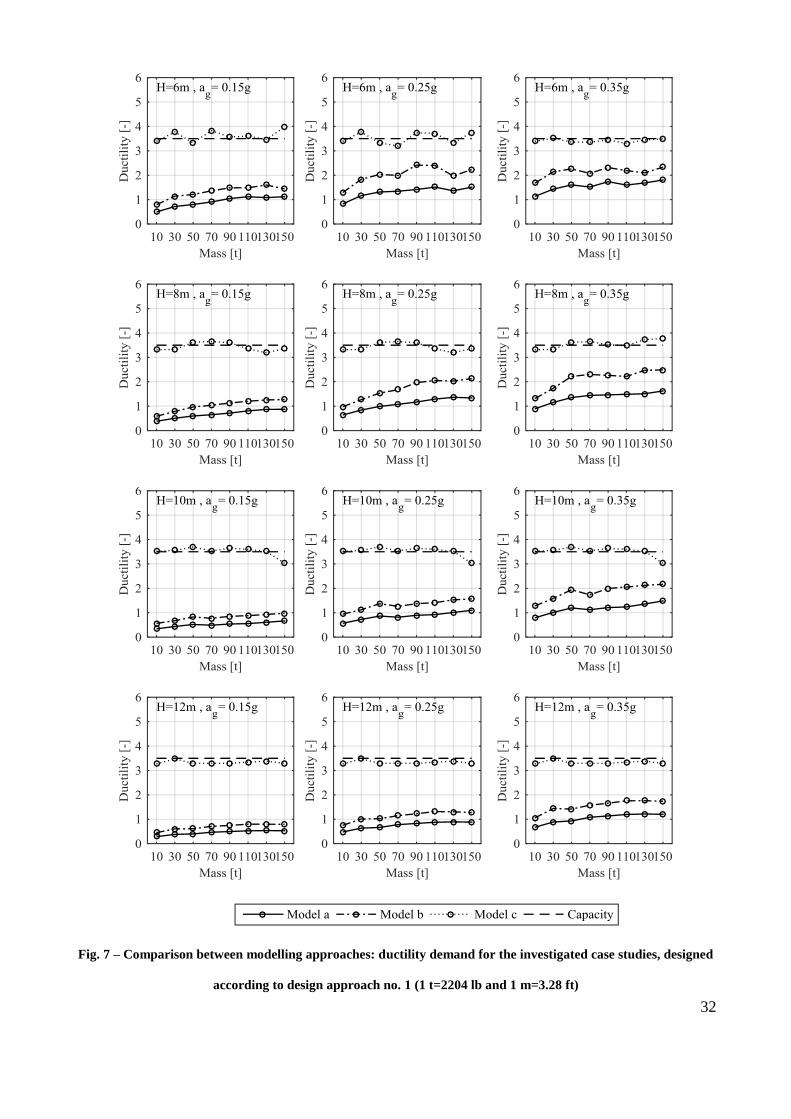
Influence of the design overstrength and stiffness 1
This section describes a comparison between the adopted modeling approaches when second 2
order analyses are performed. Fig. 7 shows the average value of displacement ductility 3
(maximum/yielding) demand versus the mass for all the structures designed according to 4
design approach no. 1. The yielding displacement is defined as the value of the yielding 5
rotation at the column base times the column height. The maximum displacement is defined 6
as the maximum displacement recorded during the nonlinear dynamic analysis at the column 7
top. In particular, each row in Fig. 7 refers to structures with the same height (H) and each 8
column refers to structures designed for the same peak ground acceleration on stiff soil (ag). 9
The continuous line indicates the results of modeling approach a, the dash-dotted line reports 10
the results of modeling approach b, while dotted line refers to modeling approach c; in these 11
plots, the displacement ductility capacity is also showed with a black dashed line and it is 12
evaluated according to Italian building code14 as: 13
𝛍𝐝 = {𝐪 𝐢𝐟 𝐓𝟏 ≥ 𝐓𝐂
𝟏 + (𝐪 − 𝟏) ∙𝐓𝐂
𝐓𝟏 𝐢𝐟 𝐓𝟏 < 𝐓𝐂
, 𝛍𝐝 ≤ 𝟓𝐪 − 𝟒 (7) 14
In these equations, q is the behavior factor, T1 is the fundamental period of vibration and TC is 15
the corner period. For all the structures, T1 is larger than TC and the ductility capacity is 16
always equal to 3.5, i.e. the value of the behavior factor used in this study, according to the 17
equal-displacement rule. 18
The curves show that overstrength has the most important role in the seismic response of the 19
structures: the displacement ductility demand significantly increases if modeling approach c 20
is adopted (dotted line in Fig. 7). Moreover, in this case, the demand is very close to the 21
capacity; on the contrary, the demand for the other two approaches is significantly lower than 22
the capacity. Less significant differences are recorded between the results with the modeling 23
approach a (solid lines in Fig. 7) and the ones with the modeling approach b (dash-dotted 24
lines in Fig. 7), denoting a smaller influence of the fundamental period of the structure 1
compared to structural overstrength. The largest values of overstrength refer to structures 2
designed for ag = 0.15 g; in this case, the ductility demand in modeling approach a is about 3
81% smaller than in modeling approach c. For ag = 0.25 g and 0.35 g, the discrepancy is 4
about 70% and 62%, respectively. This is caused by the design prescriptions on seismic 5
detailing, which give a larger influence for low ag. 6
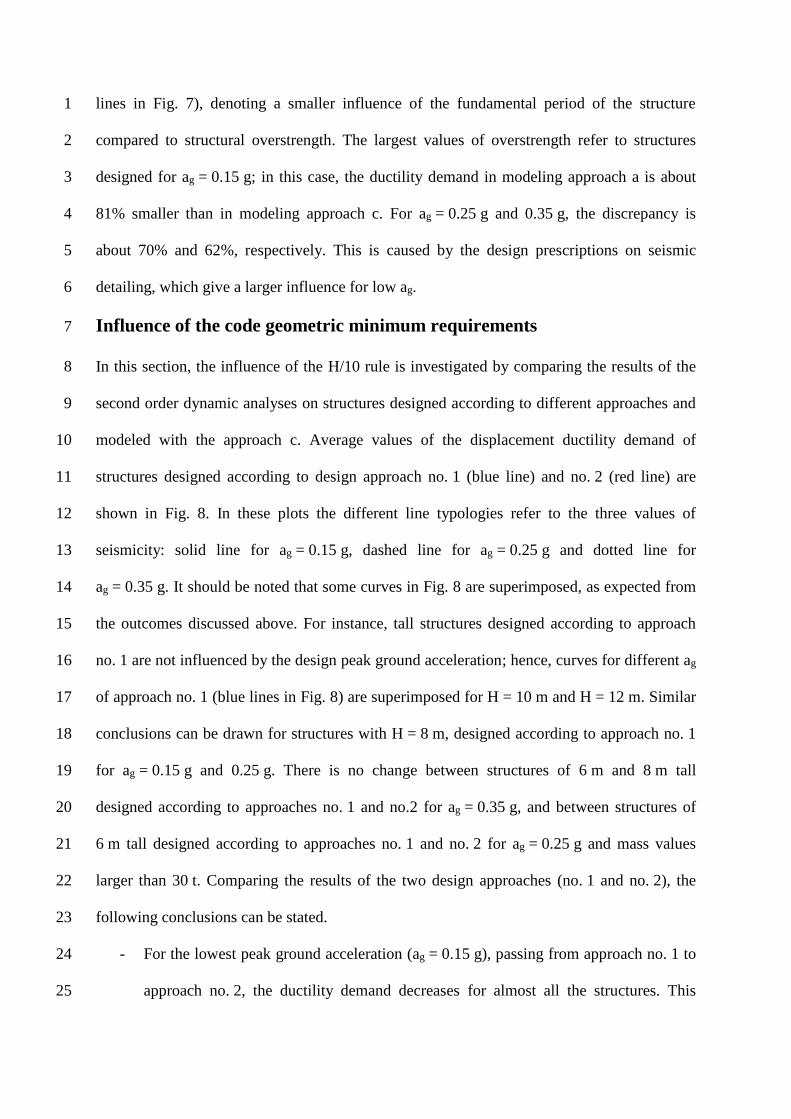
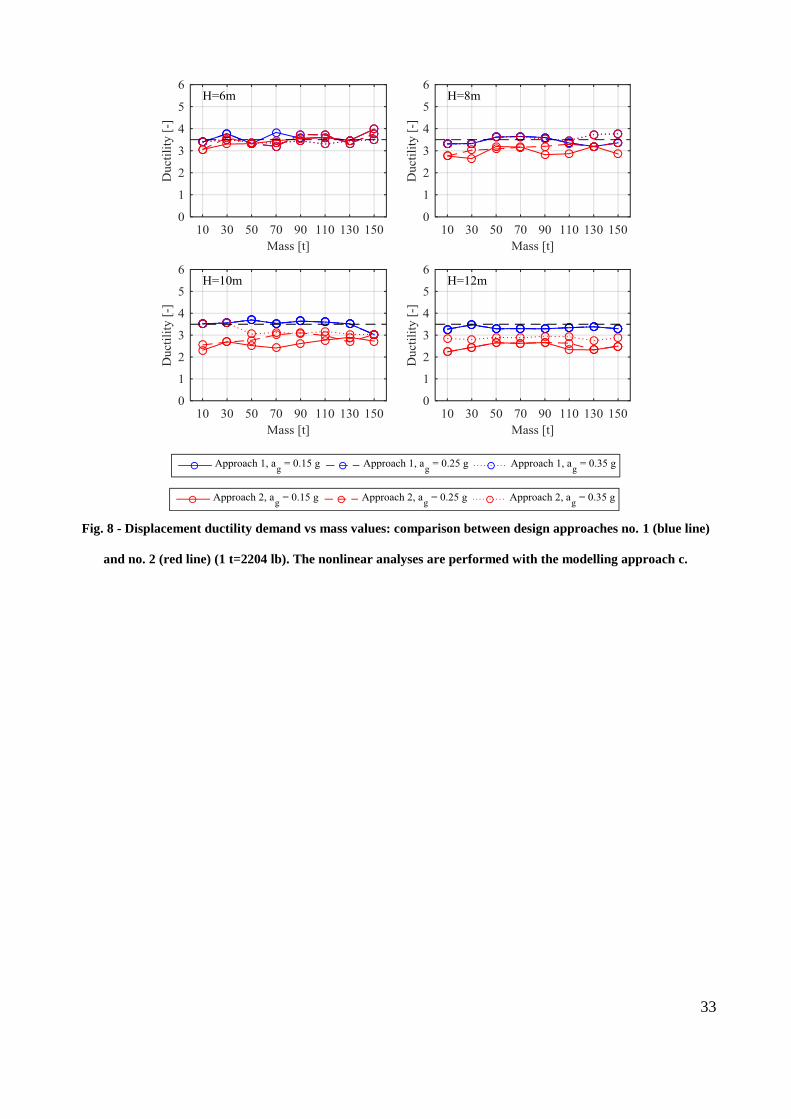
Influence of the code geometric minimum requirements 7
In this section, the influence of the H/10 rule is investigated by comparing the results of the 8
second order dynamic analyses on structures designed according to different approaches and 9
modeled with the approach c. Average values of the displacement ductility demand of 10
structures designed according to design approach no. 1 (blue line) and no. 2 (red line) are 11
shown in Fig. 8. In these plots the different line typologies refer to the three values of 12
seismicity: solid line for ag = 0.15 g, dashed line for ag = 0.25 g and dotted line for 13
ag = 0.35 g. It should be noted that some curves in Fig. 8 are superimposed, as expected from 14
the outcomes discussed above. For instance, tall structures designed according to approach 15
no. 1 are not influenced by the design peak ground acceleration; hence, curves for different ag 16
of approach no. 1 (blue lines in Fig. 8) are superimposed for H = 10 m and H = 12 m. Similar 17
conclusions can be drawn for structures with H = 8 m, designed according to approach no. 1 18
for ag = 0.15 g and 0.25 g. There is no change between structures of 6 m and 8 m tall 19
designed according to approaches no. 1 and no.2 for ag = 0.35 g, and between structures of 20
6 m tall designed according to approaches no. 1 and no. 2 for ag = 0.25 g and mass values 21
larger than 30 t. Comparing the results of the two design approaches (no. 1 and no. 2), the 22
following conclusions can be stated. 23
- For the lowest peak ground acceleration (ag = 0.15 g), passing from approach no. 1 to 24
approach no. 2, the ductility demand decreases for almost all the structures. This 25
result is mainly justified by the increase of the coefficient α; as observed in Table 3, 1
the values of the stability factor θ are close to 0.30 for design approach no. 2, then α is 2
about 1.40, and the yield moment increases of about 40%. 3
- The reduction of the ductility demand is larger for tall structures. This phenomenon 4
may be justified considering that period elongation due to geometric nonlinearities in 5
tall structures, characterized by a fundamental period close to 2sec, does not cause a 6
significant displacement demand increase. For short-to-medium period structures the 7
displacement increase is much more significant, given the shape of the code spectrum. 8
It can be concluded that the H/10 rule significantly influences the design of precast structures, 9
leading to more expensive buildings without improving their seismic safety. 10
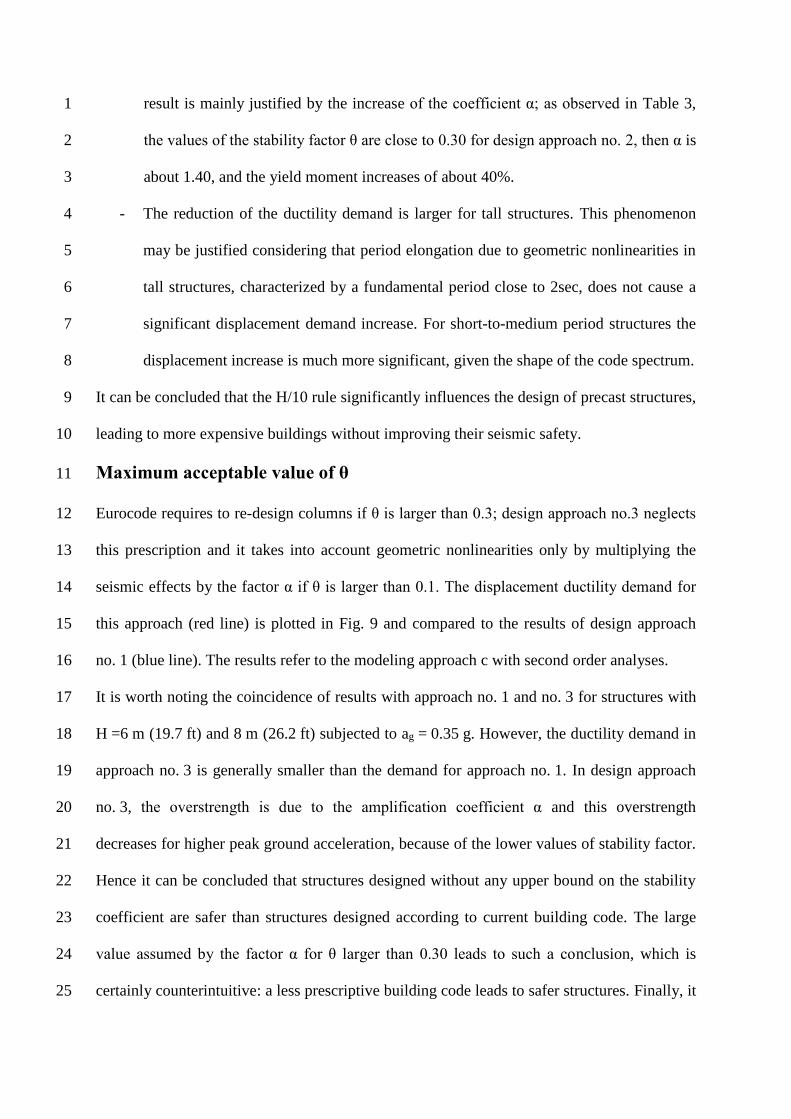
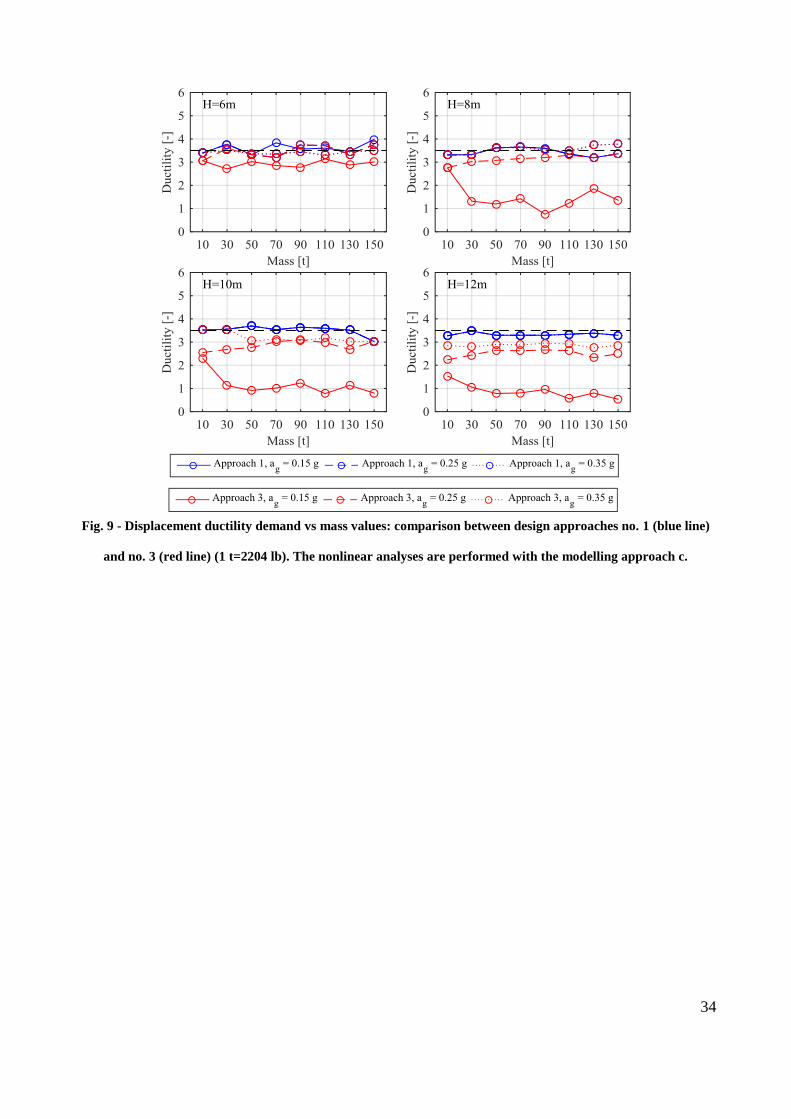
Maximum acceptable value of θ 11
Eurocode requires to re-design columns if θ is larger than 0.3; design approach no.3 neglects 12
this prescription and it takes into account geometric nonlinearities only by multiplying the 13
seismic effects by the factor α if θ is larger than 0.1. The displacement ductility demand for 14
this approach (red line) is plotted in Fig. 9 and compared to the results of design approach 15
no. 1 (blue line). The results refer to the modeling approach c with second order analyses. 16
It is worth noting the coincidence of results with approach no. 1 and no. 3 for structures with 17
H =6 m (19.7 ft) and 8 m (26.2 ft) subjected to ag = 0.35 g. However, the ductility demand in 18
approach no. 3 is generally smaller than the demand for approach no. 1. In design approach 19
no. 3, the overstrength is due to the amplification coefficient α and this overstrength 20
decreases for higher peak ground acceleration, because of the lower values of stability factor. 21
Hence it can be concluded that structures designed without any upper bound on the stability 22
coefficient are safer than structures designed according to current building code. The large 23
value assumed by the factor α for θ larger than 0.30 leads to such a conclusion, which is 24
certainly counterintuitive: a less prescriptive building code leads to safer structures. Finally, it 25
should be underlined that for some structures an additional source of overstrength is caused 1
by the prescription on the minimum design spectral acceleration, which cannot be smaller 2
than 0.20 times ag. Therefore, for long period structures, the corresponding spectral 3
acceleration in the nonlinear analysis is lower than the value assumed during the design 4
phase. 5
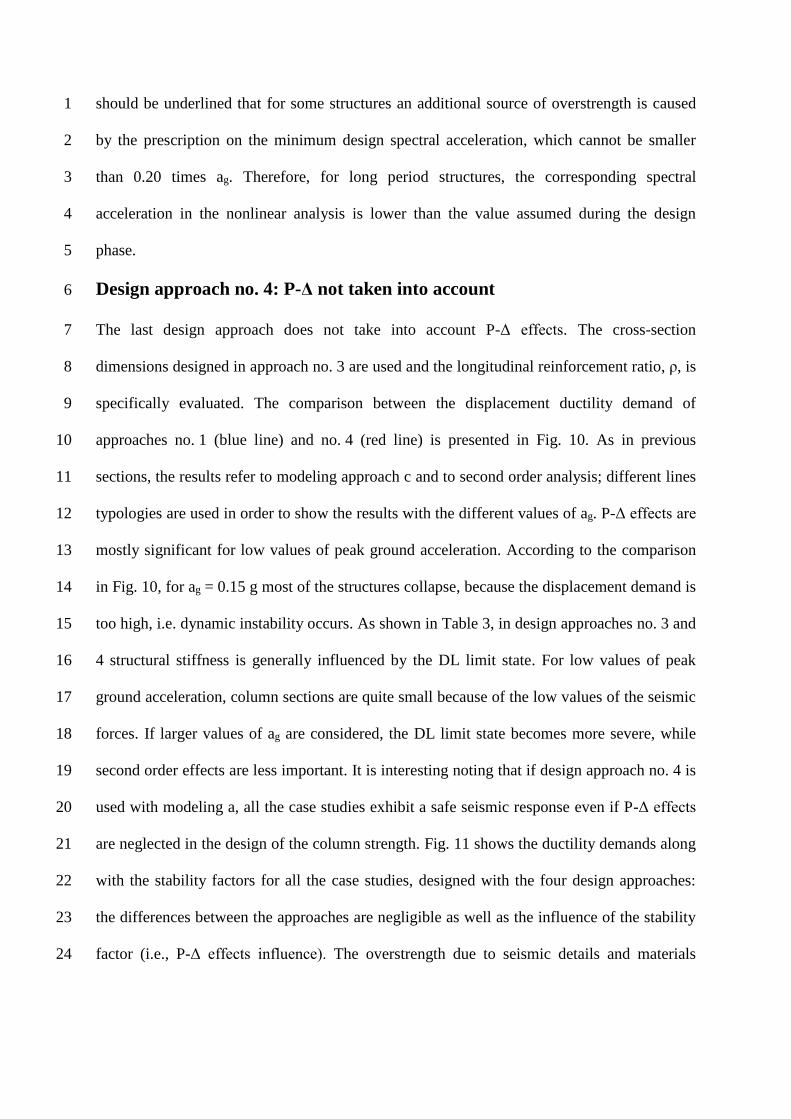
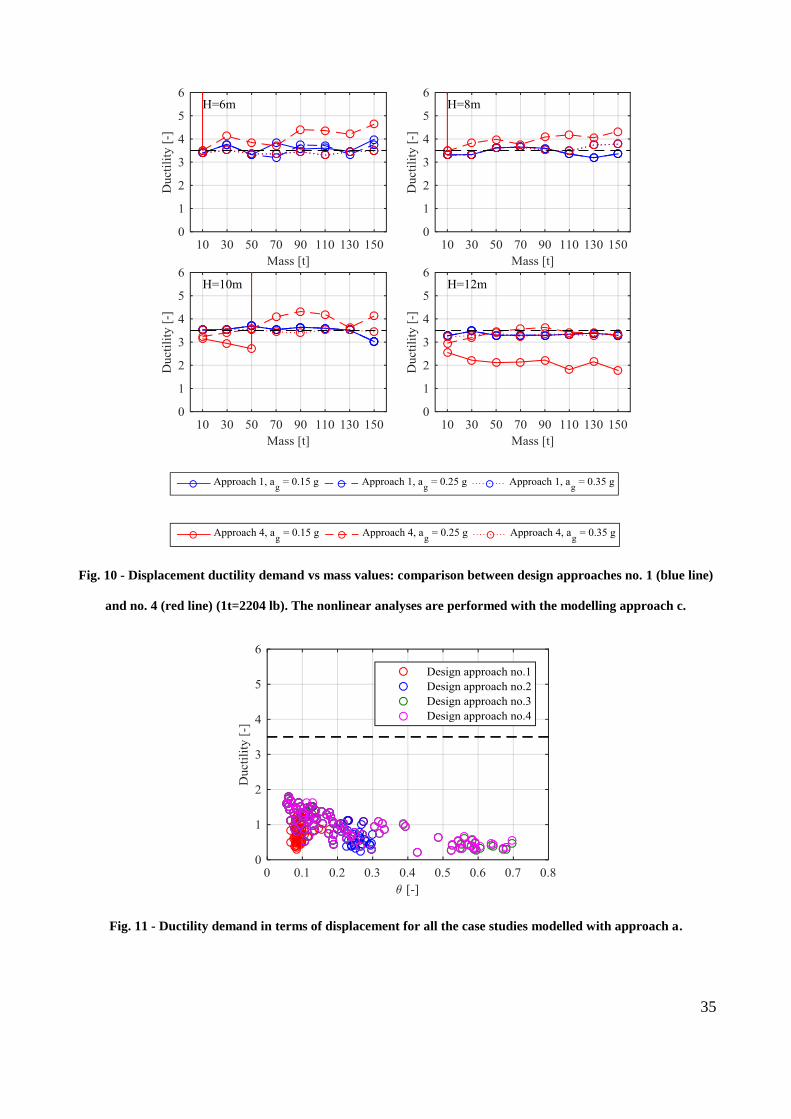
Design approach no. 4: P-Δ not taken into account 6
The last design approach does not take into account P-Δ effects. The cross-section 7
dimensions designed in approach no. 3 are used and the longitudinal reinforcement ratio, ρ, is 8
specifically evaluated. The comparison between the displacement ductility demand of 9
approaches no. 1 (blue line) and no. 4 (red line) is presented in Fig. 10. As in previous 10
sections, the results refer to modeling approach c and to second order analysis; different lines 11
typologies are used in order to show the results with the different values of ag. P-Δ effects are 12
mostly significant for low values of peak ground acceleration. According to the comparison 13
in Fig. 10, for ag = 0.15 g most of the structures collapse, because the displacement demand is 14
too high, i.e. dynamic instability occurs. As shown in Table 3, in design approaches no. 3 and 15
4 structural stiffness is generally influenced by the DL limit state. For low values of peak 16
ground acceleration, column sections are quite small because of the low values of the seismic 17
forces. If larger values of ag are considered, the DL limit state becomes more severe, while 18
second order effects are less important. It is interesting noting that if design approach no. 4 is 19
used with modeling a, all the case studies exhibit a safe seismic response even if P-Δ effects 20
are neglected in the design of the column strength. Fig. 11 shows the ductility demands along 21
with the stability factors for all the case studies, designed with the four design approaches: 22
the differences between the approaches are negligible as well as the influence of the stability 23
factor (i.e., P-Δ effects influence). The overstrength due to seismic details and materials 24
properties significantly increases the structure strength and this effect compensates the 1
increase of the displacement demand on the structure due to the geometric nonlinearities. 2
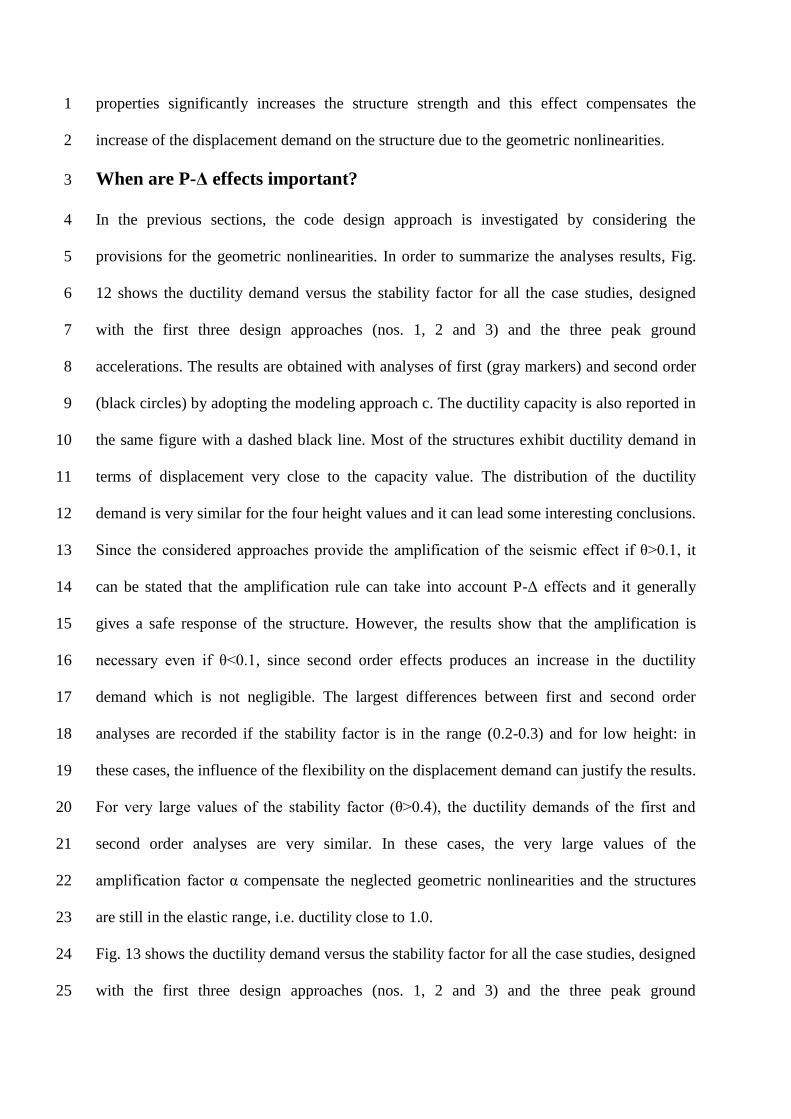
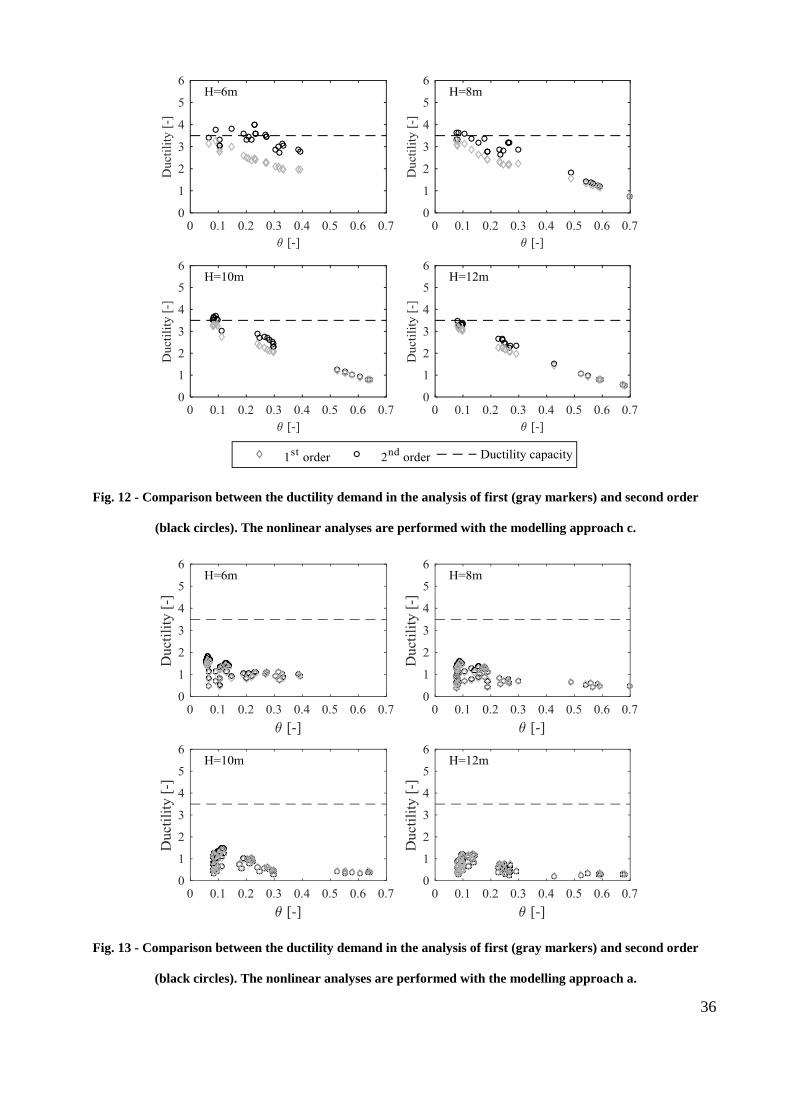
When are P-Δ effects important? 3
In the previous sections, the code design approach is investigated by considering the 4
provisions for the geometric nonlinearities. In order to summarize the analyses results, Fig. 5
12 shows the ductility demand versus the stability factor for all the case studies, designed 6
with the first three design approaches (nos. 1, 2 and 3) and the three peak ground 7
accelerations. The results are obtained with analyses of first (gray markers) and second order 8
(black circles) by adopting the modeling approach c. The ductility capacity is also reported in 9
the same figure with a dashed black line. Most of the structures exhibit ductility demand in 10
terms of displacement very close to the capacity value. The distribution of the ductility 11
demand is very similar for the four height values and it can lead some interesting conclusions. 12
Since the considered approaches provide the amplification of the seismic effect if θ>0.1, it 13
can be stated that the amplification rule can take into account P-Δ effects and it generally 14
gives a safe response of the structure. However, the results show that the amplification is 15
necessary even if θ<0.1, since second order effects produces an increase in the ductility 16
demand which is not negligible. The largest differences between first and second order 17
analyses are recorded if the stability factor is in the range (0.2-0.3) and for low height: in 18
these cases, the influence of the flexibility on the displacement demand can justify the results. 19
For very large values of the stability factor (θ>0.4), the ductility demands of the first and 20
second order analyses are very similar. In these cases, the very large values of the 21
amplification factor α compensate the neglected geometric nonlinearities and the structures 22
are still in the elastic range, i.e. ductility close to 1.0. 23
Fig. 13 shows the ductility demand versus the stability factor for all the case studies, designed 24
with the first three design approaches (nos. 1, 2 and 3) and the three peak ground 25
accelerations. The results are obtained by using the modelling approach a. The differences 1
between first order and second order analysis are negligible for any value of the stability 2
factor. However, it is worth noting that the largest difference is recorded if the stability factor 3
is lower than 0.1: in these cases, code provisions influence the design in terms of minimum 4
reinforcement ratio (1%), making significant the section dimension variation, caused by the 5
different design approaches. Moreover, the influence of the overstrength is again 6
demonstrated by the low value of ductility: most of the structures are still in the elastic range. 7
CONCLUSIONS 8
The aim of the study is to assess the current design approaches, with particular focus to 9
Eurocode 8, to take into account geometric nonlinearities in precast single-story structures. A 10
parametric study is performed on several precast structures designed according to Eurocodes 11
by varying the height of the columns and the vertical axial load. In order to establish the main 12
influenced parameters of the seismic response of the investigated structure, nonlinear 13
dynamic analyses are performed by both neglecting and considering P-Δ effects. Both 14
strength and stiffness degradation were not considered in the plastic hinge hysteresis. The 15
comparison of the analyses results shows that the ductility demand in terms of displacement 16
is the main parameter in order to represent the influence of the geometric nonlinearities. 17
Therefore, in the study, the safety of the structures is assessed by comparing the displacement 18
ductility demand with the capacity. The results of the nonlinear dynamic analyses with the 19
second order effects demonstrate that the current design approach provides very low ductility 20
demand for the structures. This result is mainly caused by two factors: the difference between 21
the design period and the period in the analyses and the structural overstrength, due to 22
seismic details and the materials overstrength. The influence of the prescriptions on second 23
order effects are investigated and the following conclusions are drawn. 24
Amplification of seismic effects is necessary even if θ<0.1. 25
Both the code limitation on the minimum column section if θ>0.1 and the limit of the 1
stability factor (0.3) do not increase the structural safety with respect to the seismic 2
actions. 3
If the structural design is performed by neglecting the limitations on both θ and the 4
column section, the structural safety is still guaranteed by amplifying the seismic 5
effects by α. 6
If P-Δ effects are totally neglected in the design phase, structural safety can be 7
insufficient. 8
Finally, it should be noted that the above mentioned results can be also applicable to other 9
building codes with a similar approach to P-Δ effects, such as ASCE 7, providing that the 10
structural typology is similar and the considered structure falls within the parametric study 11
described herein. The study does not model the effect of the additional rotation at the column 12
base due to the foundation system; therefore, the presented outcomes can be applied to 13
buildings with adequate column-to-foundation connections. 14
ACKNOWLEDGEMENTS 15
This study was funded by both the Italian Department of Civil Protection in the frame of the 16
national project DPC - ReLUIS 2015. The passionate support of Eng. Antonella Guerra to the 17
execution of the analyses is gratefully acknowledged. 18
REFERENCES 19
1. Belleri A, Brunesi E, Nascimbene R, Pagani M, Riva P, "Seismic Performance of 20
Precast Industrial Facilities Following Major Earthquakes in the Italian Territory," Journal of 21
Performance of Constructed Facilities, V. 29, No. 5, 2015, pp. 04014135. 22
2. Bournas DA, Negro P, Taucer FF, "Performance of industrial buildings during the 1
Emilia earthquakes in Northern Italy and recommendations for their strengthening," Bulletin 2
of Earthquake Engineering, V. 12, No. 5, 2014, pp. 2383-404. 3
3. Magliulo G, Ercolino M, Petrone C, Coppola O, Manfredi G, "The Emilia 4
Earthquake: the Seismic Performance of Precast Reinforced Concrete Buildings," Earthquake 5
Spectra, V. 30, No. 2, 2014, pp. 891-912. 6
4. Paulay T, "A consideration of P-Delta effects in ductile reinforced concrete frames," 7
Bulletin of the New Zealand national society for earthquake engineering, V. 11, No. 3, 1978, 8
pp. 151-60. 9
5. Moss PJ, Carr AJ, "The effects of large displacements on the Earthquake Reponse of 10
Tall Structures," Bulletin of the New Zealand national society for earthquake engineering, V. 11
13, No. 4, 1981, pp. 317-20. 12
6. Bernal D, "Amplification factors for inelastic dynamic P-Δ effects in earthquake 13
analysis," Earthquake Engineering and Structural Dynamics, V. 15, 1987, pp. 635-51. 14
7. MacRae GA, "P−Δ effects on single-degree-of-freedom structures in earthquakes," 15
Earthquake Spectra, V. 10, 1994, pp. 539-68. 16
8. Amara F, Bosco M, Marino EM, Rossi PP, "An accurate strength amplification factor 17
for the design of SDOF systems with P–Δ effects," Earthquake Engineering and Structural 18
Dynamics, V. 43, 2014, pp. 589–611. 19
9. Humar J, Mahgoub M, Ghorbanie-Asl M, "Effect of second-order forces on seismic 20
response," Canadian Journal of Civil Engineering, V. 33, No. 6, 2006, pp. 692-706. 21
10. Aschheim M, Montes EH, "The representation of P-Delta effects using yield point 22
spectra," Engineering Structures, V. 25, No. 11, 2003, pp. 1387-96. 23
11. CEN, "Design of structures for earthquake resistance, part 1," Eurocode 8, V. 24
Brussels, 2005. 25
12. American Society of Civil Engineers, "ASCE/SEI 7-10: Minimum Design Loads for 1
Buildings and Other Structures," Reston, Virginia, US, 2010. 2
13. Osanai Y, Watanabe F, Okamoto S, "Stress transfer mechanism of socket base 3
connections with precast concrete columns," Aci Structural Journal, V. 93, No. 3, 1996, pp. 4
266-76. 5
14. Negro P, Toniolo G, "Design Guidelines for Connections of Precast Structures under 6
Seismic Actions," Joint Research Centre of the European Commission, 2012. 7
15. CEN, "Eurocode 2: Design of concrete structures - Part 1-1: General rules and rules 8
for buildings. EN 1992-1-1," Brussels, Belgium, 2004. 9
16. DM 14/01/2008, "Norme tecniche per le costruzioni," Roma, Italia, Gazzetta 10
Ufficiale. 11
17. Brunesi E, Nascimbene R, Bolognini D, Bellotti D, "Experimental investigation of the 12
cyclic response of reinforced precast concrete framed structures," PCI Journal, V. 60, No. 2, 13
2015, pp. 57-79. 14
18. Andrews AL, "Slenderness Effects in Earthquake Resisting Frames," Bulletin of the 15
New Zealand national society for earthquake engineering, V. 10, No. 3, 1977, pp. 154-8. 16
19. Zhao J, Sritharan S, "Modeling of strain penetration effects in fiber-based analysis of 17
reinforced concrete structures," Aci Structural Journal, V. 104, No. 2, 2007, pp. 133-41. 18
20. Mander JB, Priestley MJN, Park R, "Theoretical Stress-Strain Model for Confined 19
Concrete," Journal of Structural Engineering-Asce, V. 114, No. 8, 1988, pp. 1804-26. 20
21. Fardis MN, Biskins DE, "Deformation capacity of RC members, as controlled by 21
flexure or shear," In: Kabeyasawa T, Shiohara H (eds) Performance-based engineering for 22
earthquake resistant reinforced concrete structures, a volume honoring Shunsuke Otani, 23
University of Tokyo, 2003. 24
22. CEN, "Eurocode 8: design of structures for earthquake resistance - Part 2: Bridges. 1
EN 1998-2," Brussels, Belgium., 2003. 2
23. Fardis MN, "Seismic design, assessment and retrofitting of concrete buildings based 3
on EN-Eurocode 8," 2009. 4
24. Zoubek B, Fischinger M, Isakovic T, "Estimation of the cyclic capacity of beam-to-5
column dowel connections in precast industrial buildings," Bulletin of Earthquake 6
Engineering, V. 13, No. 7, 2015, pp. 2145-68. 7
25. Magliulo G, Ercolino M, Cimmino M, Capozzi V, Manfredi G, "FEM analysis of the 8
strength of RC beam-to-column dowel connections under monotonic actions," Construction 9
and Building Materials, V. 69, 2014, pp. 271-84. 10
26. Magliulo G, Ercolino M, Cimmino M, Capozzi V, Manfredi G, "Cyclic shear test on a 11
dowel beam-to-column connection of precast buildings," Earthquake and Structures, V. 9, 12
No. 3, 2015, pp. 541-62. 13
27. Rodrigues H, Varum H, Arêde A, Costa A, "Comparative efficiency analysis of 14
different nonlinear modelling strategies to simulate the biaxial response of RC columns," 15
Earthquake Engineering and Engineering Vibration, V. 11, No. 4, 2012, pp. 553-66. 16
28. Magliulo G, Ramasco R, "Seismic response of three-dimensional r/c multi-storey 17
frame building under uni- and bi-directional input ground motion," Earthquake Engineering 18
and Structural Dynamics, V. 36, No. 12, 2007, pp. 1641-57. 19
29. SIMQKE, "Simulation of Earthquake Ground Motions," 2008. 20
30. Chopra AK, "Dynamics of structures: Theory and Applications to Earthquake 21
Engineering." Englewood Cliffs, New Jersey, USA: Prentice Hall; 1995. 22
31. The MathWorks Inc., "MATLAB Release 2015a," Natick, Massachusetts, United 23
States, 2015. 24
25
26
TABLES AND FIGURES
List of Tables:
Table 1 - Summary of European provisions for second order effects.
Table 2 - Summary of the four design approaches: the adopted or not adopted design provisions
Table 3 - Summary of different design approaches: h is the cross-section dimension, ρ is the
reinforcement ratio, θ is the coefficient of stability (1 t=2204.62 lb and 1 m=3.28 ft)
List of Figures:
Fig. 1 - Precast structure
Fig. 2 - Equivalent SDOF system
Fig. 3 - Moment-rotation curves: comparison between modeling approaches
Fig. 4 - Average spectrum of the records (blue line) and design elastic spectrum (black line)
Fig. 5 - Force-displacement curve for first and second order analysis
Fig. 6 - Force-displacement curve for one case study with (black solid line) and without (gray solid
line) P-Δ effects (1 kN=223.1 lb and 1 m=3.28 ft)
Fig. 7 – Comparison between modelling approaches: ductility demand for the investigated case
studies, designed according to design approach no. 1 (1 t=2204 lb and 1 m=3.28 ft)
Fig. 8 - Displacement ductility demand vs mass values: comparison between design approaches
no. 1 (blue line) and no. 2 (red line) (1 t=2204 lb). The nonlinear analyses are performed with the
modelling approach c.
Fig. 9 - Displacement ductility demand vs mass values: comparison between design approaches
no. 1 (blue line) and no. 3 (red line) (1 t=2204 lb). The nonlinear analyses are performed with the
modelling approach c.
Fig. 10 - Displacement ductility demand vs mass values: comparison between design approaches
no. 1 (blue line) and no. 4 (red line) (1t=2204 lb). The nonlinear analyses are performed with the
modelling approach c.

27
Fig. 11 - Ductility demand in terms of displacement for all the case studies modelled with approach
a.
Fig. 12 - Comparison between the ductility demand in the analysis of first (gray markers) and
second order (black circles). The nonlinear analyses are performed with the modelling approach c.
Fig. 13 - Comparison between the ductility demand in the analysis of first (gray markers) and
second order (black circles). The nonlinear analyses are performed with the modelling approach a.
28
Table 1 - Summary of European provisions for second order effects.
θ EC8 provisions
θ ≤ 0.1 Second order effects not taken into account
0.1 < θ
≤ 0.2
Seismic action effects amplified by a factor α = 1 (1 − θ)⁄
Cross-section dimensions larger than 0.1 times the shear span
0.2 < θ
< 0.3
Cross-section dimensions larger than 0.1 times the shear span
≥ 0.3 The structure must be designed again
Table 2 - Summary of the four design approaches: the adopted or not adopted design provisions
Design rule Design no. 1 Design no. 2 Design no. 3 Design no. 4
If θ ≤ 0.1, second order effects
are not taken into account
If θ > 0.1, seismic effects are
amplified by α factor
If θ > 0.3, the column section is
increased
If θ > 0.1, limit on minimum
column section is adopted (H/10)
29
Table 3 - Summary of different design approaches: h is the cross-section dimension, ρ is the reinforcement ratio,
θ is the coefficient of stability (1 t=2204.62 lb and 1 m=3.28 ft)
ag = 0.15 g
Design approach no. 1 Design approach no. 2 Design approach no. 3
m [t] H [m]
6 m 8 m 10 m 12 m 6 m 8 m 10 m 12 m 6 m 8 m 10 m 12 m
10
h [m] 0.45 0.50 0.55 0.60 0.40 0.40 0.40 0.45 0.40 0.40 0.40 0.40
ρ [%] 1.19 1.29 1.06 1.12 1.51 1.51 1.51 1.19 1.51 1.51 1.51 1.51
θ [-] 0.07 0.08 0.08 0.08 0.11 0.19 0.30 0.27 0.11 0.19 0.30 0.43
70
h [m] 0.60 0.80 0.90 0.95 0.55 0.60 0.65 0.75 0.50 0.50 0.55 0.60
ρ [%] 1.12 1.01 1.13 1.07 1.06 1.12 1.19 1.00 1.29 1.61 1.66 1.79
θ [-] 0.15 0.08 0.08 0.09 0.21 0.26 0.30 0.24 0.31 0.54 0.58 0.59
130
h [m] 0.60 0.80 1.00 1.10 0.60 0.70 0.80 0.85 0.55 0.60 0.65 0.70
ρ [%] 1.12 1.01 1.06 1.06 1.12 1.15 1.01 1.04 1.33 1.12 1.52 1.86
θ [-] 0.27 0.15 0.10 0.10 0.27 0.26 0.24 0.27 0.39 0.49 0.55 0.59
ag = 0.25 g
10
h [m] 0.45 0.50 0.55 0.60 0.40 0.40 0.45 0.45 0.40 0.40 0.45 0.45
ρ [%] 1.19 1.29 1.06 1.12 1.51 1.51 1.19 1.19 1.51 1.51 1.19 1.19
θ [-] 0.07 0.08 0.08 0.08 0.11 0.19 0.18 0.27 0.11 0.19 0.18 0.27
70
h [m] 0.65 0.80 0.90 0.95 0.65 0.70 0.70 0.75 0.65 0.70 0.70 0.75
ρ [%] 1.19 1.01 1.13 1.07 1.19 1.15 1.15 1.00 1.19 1.15 1.15 1.00
θ [-] 0.11 0.08 0.08 0.09 0.11 0.14 0.22 0.24 0.11 0.14 0.22 0.24
130
h [m] 0.75 0.80 1.00 1.10 0.75 0.80 0.85 0.85 0.75 0.80 0.85 0.85
ρ [%] 1.35 1.01 1.06 1.06 1.35 1.01 1.04 1.04 1.35 1.01 1.04 1.04
θ [-] 0.11 0.15 0.10 0.10 0.11 0.15 0.19 0.27 0.11 0.15 0.19 0.27
ag = 0.35 g
10
h [m] 0.45 0.50 0.55 0.60 0.45 0.50 0.55 0.55 0.45 0.50 0.55 0.55
ρ [%] 1.19 1.29 1.06 1.12 1.19 1.29 1.06 1.06 1.19 1.29 1.06 1.06
θ [-] 0.07 0.08 0.08 0.08 0.07 0.08 0.08 0.12 0.07 0.08 0.08 0.12
70
h [m] 0.75 0.80 0.90 0.95 0.75 0.80 0.85 0.90 0.75 0.80 0.85 0.90
ρ [%] 1.35 1.01 1.13 1.07 1.35 1.01 1.04 1.13 1.35 1.01 1.04 1.13
θ [-] 0.06 0.08 0.08 0.09 0.06 0.08 0.10 0.12 0.06 0.08 0.10 0.12
130
h [m] 0.85 0.90 1.00 1.10 0.85 0.90 0.95 1.00 0.85 0.90 0.95 1.00
ρ [%] 1.57 1.13 1.06 1.06 1.57 1.13 1.07 1.06 1.57 1.13 1.07 1.06
θ [-] 0.07 0.10 0.10 0.10 0.07 0.10 0.12 0.14 0.07 0.10 0.12 0.14
30
Fig. 1 - Precast structure
Fig. 2 - Equivalent SDOF system
Fig. 3 - Moment-rotation curves: comparison between modeling approaches
H
31
Fig. 4 - Average spectrum of the records (blue line) and design elastic spectrum (black line)
Fig. 5 - Force-displacement curve for first and second order analysis
Fig. 6 - Force-displacement curve for one case study with (black solid line) and without (gray solid line) P-Δ
effects (1 kN=223.1 lb and 1 m=3.28 ft)
32
Fig. 7 – Comparison between modelling approaches: ductility demand for the investigated case studies, designed
according to design approach no. 1 (1 t=2204 lb and 1 m=3.28 ft)
33
Fig. 8 - Displacement ductility demand vs mass values: comparison between design approaches no. 1 (blue line)
and no. 2 (red line) (1 t=2204 lb). The nonlinear analyses are performed with the modelling approach c.
34
Fig. 9 - Displacement ductility demand vs mass values: comparison between design approaches no. 1 (blue line)
and no. 3 (red line) (1 t=2204 lb). The nonlinear analyses are performed with the modelling approach c.
35
Fig. 10 - Displacement ductility demand vs mass values: comparison between design approaches no. 1 (blue line)
and no. 4 (red line) (1t=2204 lb). The nonlinear analyses are performed with the modelling approach c.
Fig. 11 - Ductility demand in terms of displacement for all the case studies modelled with approach a.
36
Fig. 12 - Comparison between the ductility demand in the analysis of first (gray markers) and second order
(black circles). The nonlinear analyses are performed with the modelling approach c.
Fig. 13 - Comparison between the ductility demand in the analysis of first (gray markers) and second order
(black circles). The nonlinear analyses are performed with the modelling approach a.