
Section 10.4 Hypothesis Testing for Population Proportions HAWKES LEARNING SYSTEMS math courseware...
12
Section 10.4 Hypothesis Testing for Population Proportions HAWKES LEARNING SYSTEMS math courseware specialists Copyright © 2008 by Hawkes Learning Systems/Quant Systems, Inc. All rights reserved.
-
Upload
scarlett-davidson -
Category
Documents
-
view
227 -
download
0
Transcript of Section 10.4 Hypothesis Testing for Population Proportions HAWKES LEARNING SYSTEMS math courseware...
Section 10.4
Hypothesis Testing for Population Proportions
HAWKES LEARNING SYSTEMS
math courseware specialists
Copyright © 2008 by Hawkes Learning
Systems/Quant Systems, Inc.
All rights reserved.
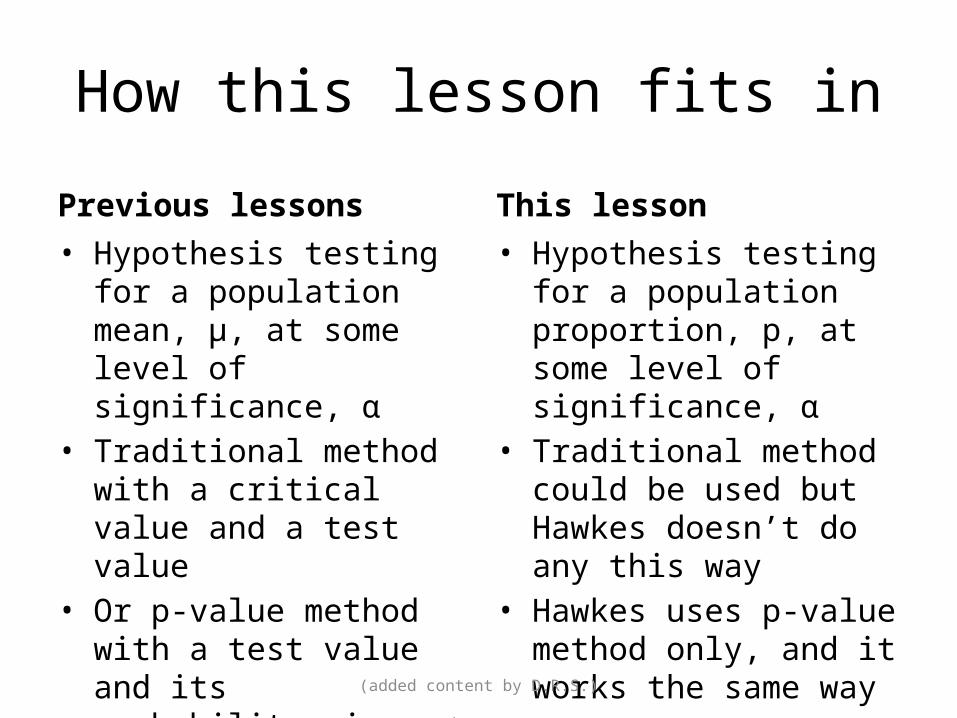
How this lesson fits in
Previous lessons• Hypothesis testing for a
population mean, μ, at some level of significance, α
• Traditional method with a critical value and a test value
• Or p-value method with a test value and its probability: is p < α? If so, then reject H0.
This lesson• Hypothesis testing for a
population proportion, p, at some level of significance, α
• Traditional method could be used but Hawkes doesn’t do any this way
• Hawkes uses p-value method only, and it works the same way
(added content by D.R.S.)
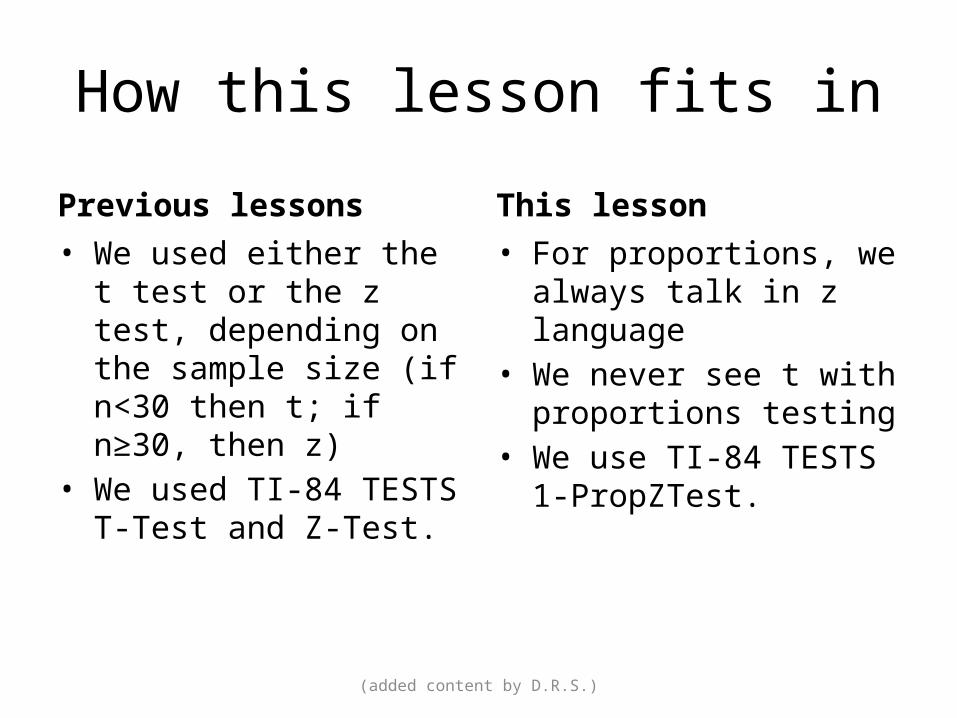
How this lesson fits in
Previous lessons• We used either the t test or
the z test, depending on the sample size (if n<30 then t; if n≥30, then z)
• We used TI-84 TESTS T-Test and Z-Test.
This lesson• For proportions, we always
talk in z language• We never see t with
proportions testing• We use TI-84 TESTS
1-PropZTest.
(added content by D.R.S.)
HAWKES LEARNING SYSTEMS
math courseware specialists
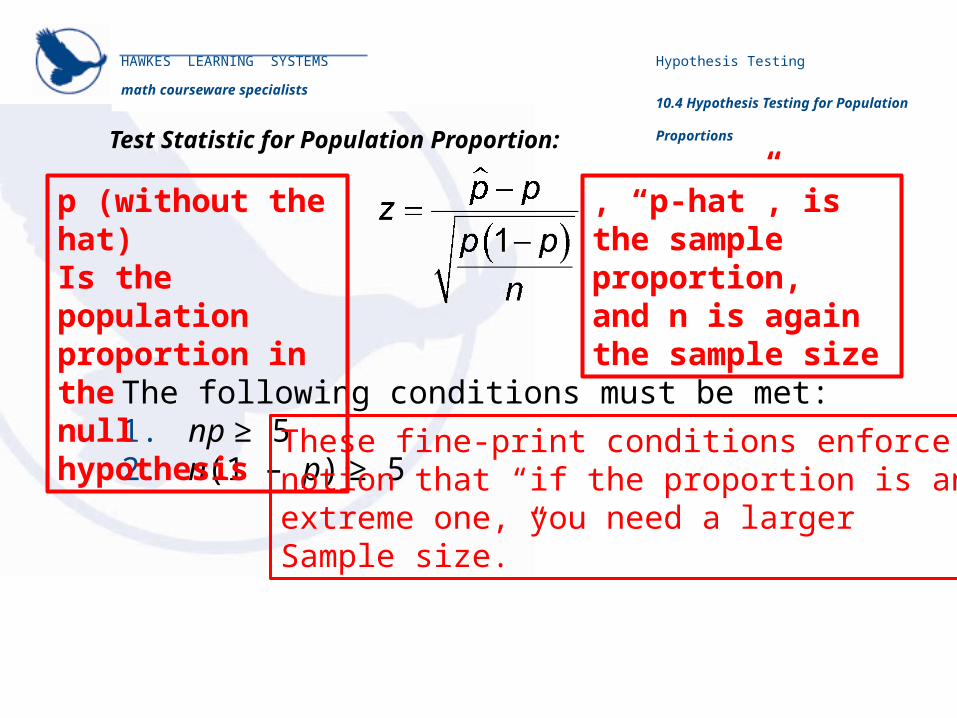
Test Statistic for Population Proportion:
Hypothesis Testing
10.4 Hypothesis Testing for Population
Proportions
The following conditions must be met:1. np ≥ 52. n(1 – p) ≥ 5
p (without the hat)Is the population proportion in the null hypothesis
, “p-hat”, is the sample proportion, and n is again the sample size
These fine-print conditions enforce thenotion that “if the proportion is an extreme one, you need a largerSample size.”
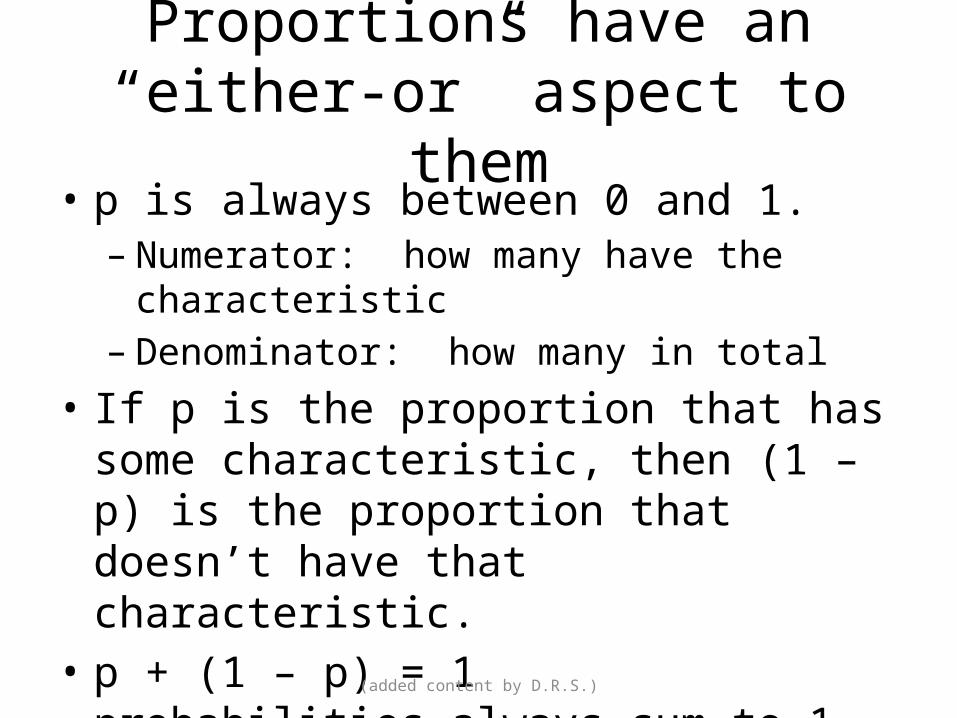
Proportions have an “either-or” aspect to them
• p is always between 0 and 1.– Numerator: how many have the characteristic– Denominator: how many in total
• If p is the proportion that has some characteristic, then (1 – p) is the proportion that doesn’t have that characteristic.
• p + (1 – p) = 1 probabilities always sum to 1• Sometimes you see it written as q: q = 1 – p
(added content by D.R.S.)
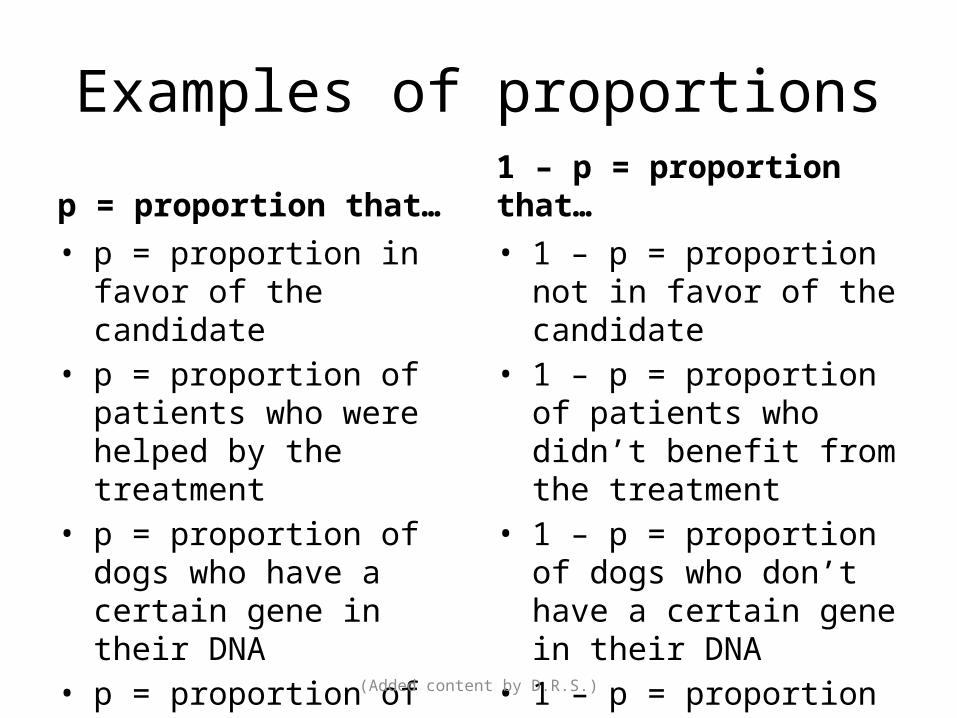
Examples of proportions
p = proportion that…• p = proportion in favor of
the candidate• p = proportion of patients
who were helped by the treatment
• p = proportion of dogs who have a certain gene in their DNA
• p = proportion of defective units we manufactured
1 – p = proportion that…• 1 – p = proportion not in
favor of the candidate• 1 – p = proportion of
patients who didn’t benefit from the treatment
• 1 – p = proportion of dogs who don’t have a certain gene in their DNA
• 1 – p = proportion of good units we manufactured
(Added content by D.R.S.)
HAWKES LEARNING SYSTEMS
math courseware specialists
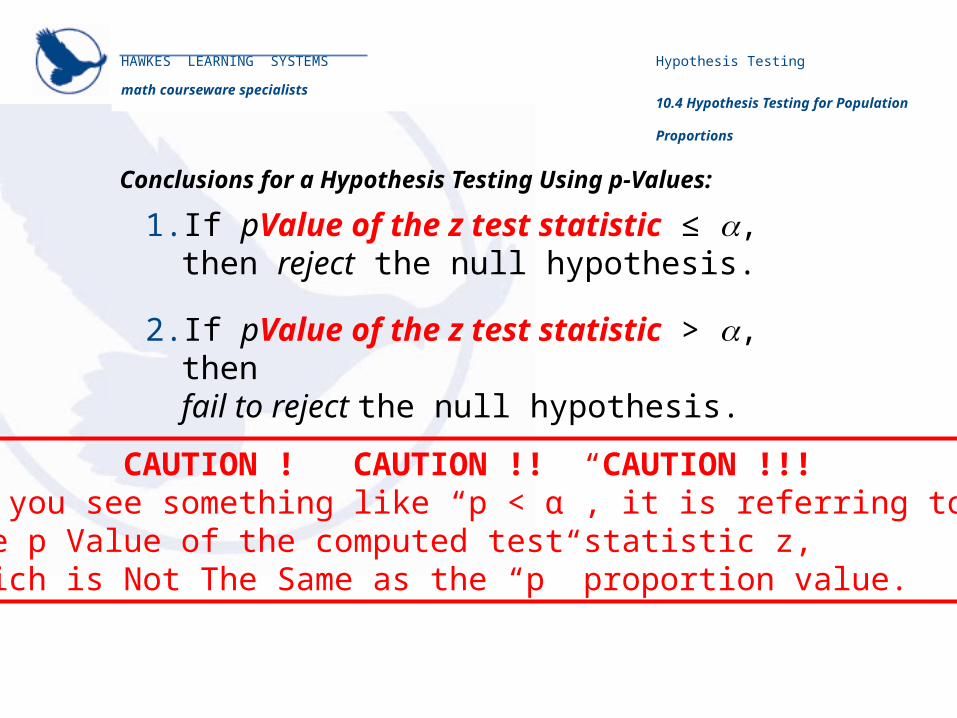
Conclusions for a Hypothesis Testing Using p-Values:
1. If pValue of the z test statistic ≤ a, then reject the null hypothesis.
2. If pValue of the z test statistic > a, then fail to reject the null hypothesis.
Hypothesis Testing
10.4 Hypothesis Testing for Population
Proportions
CAUTION ! CAUTION !! CAUTION !!!If you see something like “p < α”, it is referring to the p Value of the computed test statistic z, which is Not The Same as the “p” proportion value.
HAWKES LEARNING SYSTEMS
math courseware specialists
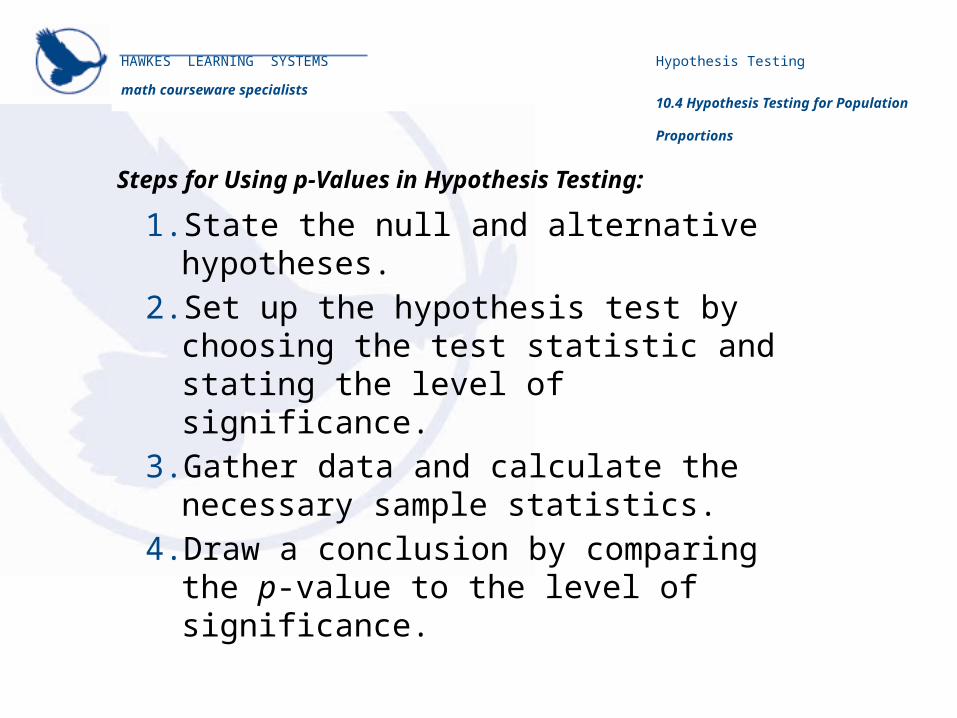
Steps for Using p-Values in Hypothesis Testing:
1. State the null and alternative hypotheses.2. Set up the hypothesis test by choosing the
test statistic and stating the level of significance.
3. Gather data and calculate the necessary sample statistics.
4. Draw a conclusion by comparing the p-value to the level of significance.
Hypothesis Testing
10.4 Hypothesis Testing for Population
Proportions
HAWKES LEARNING SYSTEMS
math courseware specialists
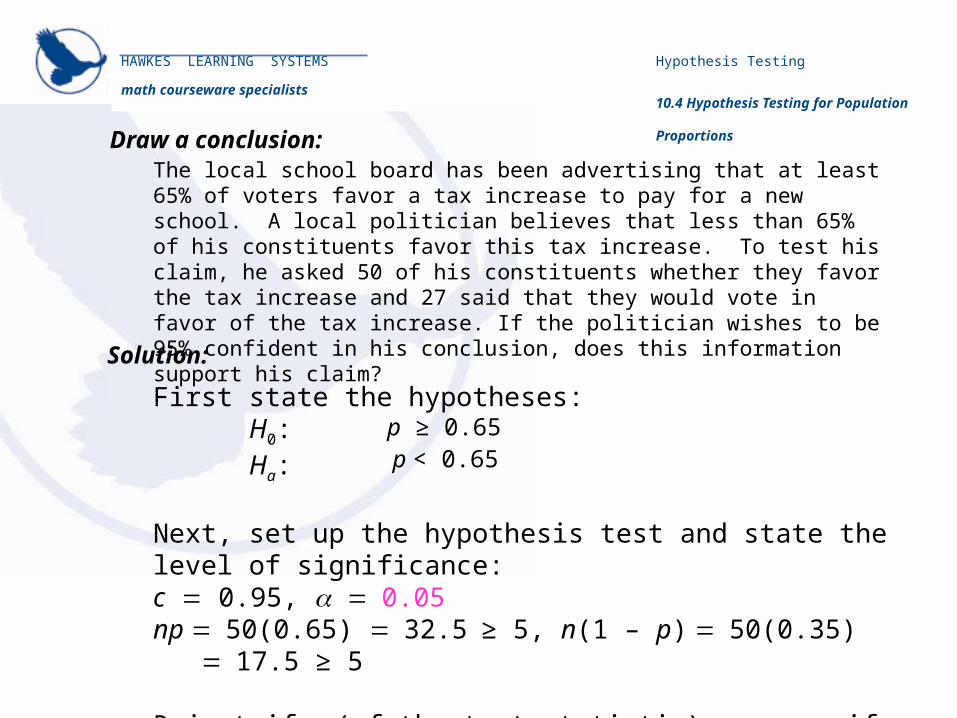
Draw a conclusion:The local school board has been advertising that at least 65% of voters favor a tax increase to pay for a new school. A local politician believes that less than 65% of his constituents favor this tax increase. To test his claim, he asked 50 of his constituents whether they favor the tax increase and 27 said that they would vote in favor of the tax increase. If the politician wishes to be 95% confident in his conclusion, does this information support his claim?
Solution:
First state the hypotheses:H0:Ha:
Next, set up the hypothesis test and state the level of significance:c = 0.95, a = 0.05np = 50(0.65) = 32.5 ≥ 5, n(1 – p) = 50(0.35) = 17.5 ≥ 5
Reject if p (of the test statistic) < a, or if p < 0.05.
p ≥ 0.65p < 0.65
Hypothesis Testing
10.4 Hypothesis Testing for Population
Proportions
HAWKES LEARNING SYSTEMS
math courseware specialists
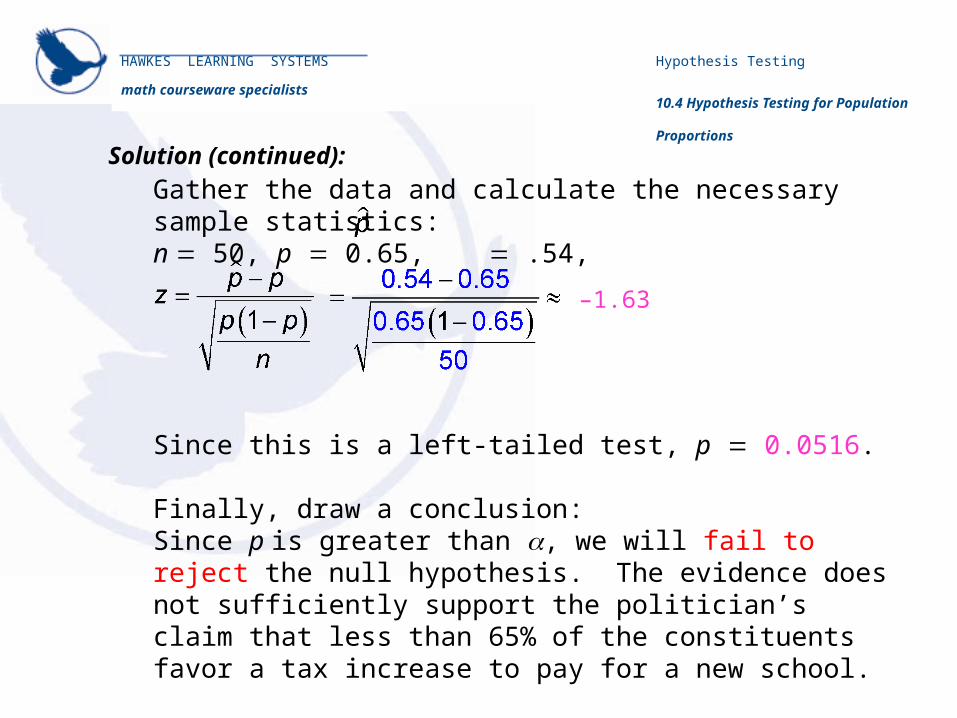
Solution (continued):
Gather the data and calculate the necessary sample statistics:n = 50, p = 0.65, = .54,
Since this is a left-tailed test, p = 0.0516.
Finally, draw a conclusion:Since p is greater than a, we will fail to reject the null hypothesis. The evidence does not sufficiently support the politician’s claim that less than 65% of the constituents favor a tax increase to pay for a new school.
–1.63
Hypothesis Testing
10.4 Hypothesis Testing for Population
Proportions
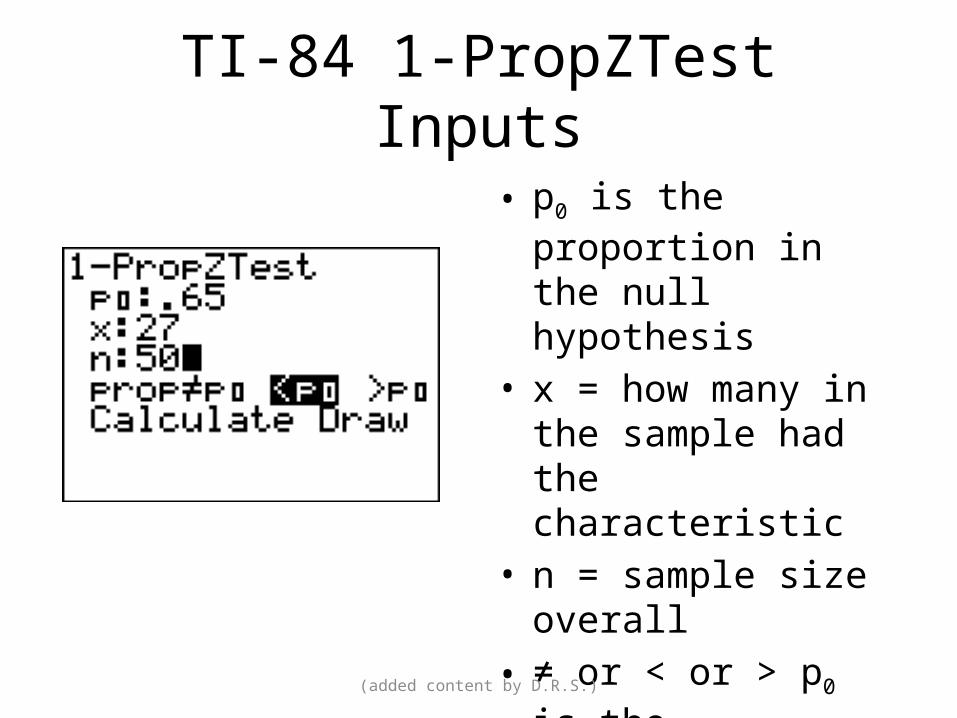
TI-84 1-PropZTest Inputs
• p0 is the proportion in the null hypothesis
• x = how many in the sample had the characteristic
• n = sample size overall• ≠ or < or > p0 is the
alternative hypothesis• Highlight Calculate and
press ENTER(added content by D.R.S.)
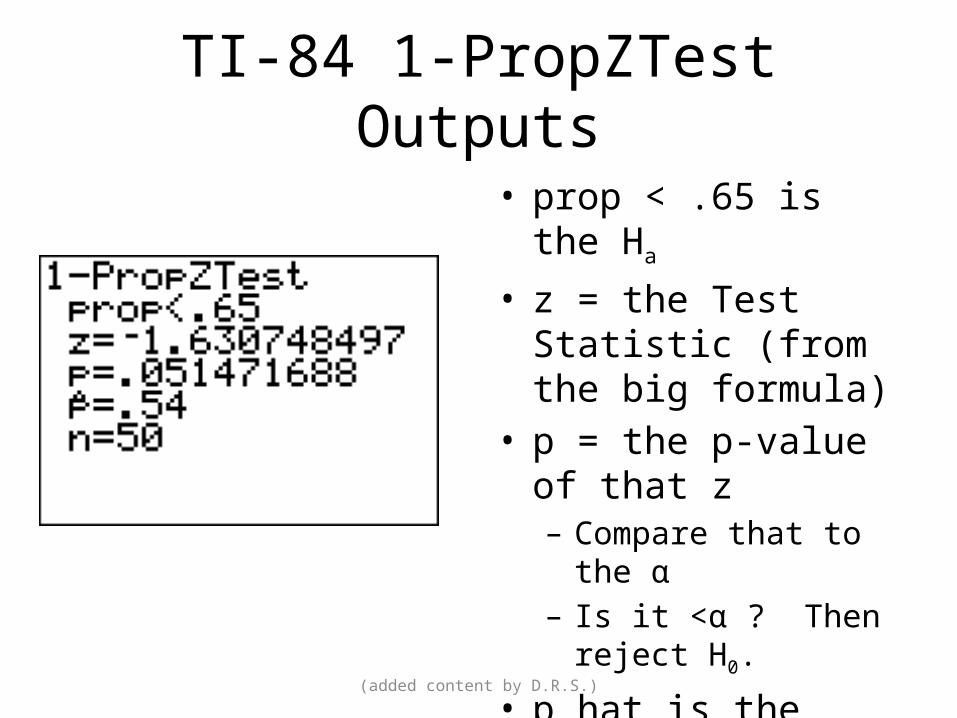
TI-84 1-PropZTest Outputs
• prop < .65 is the Ha
• z = the Test Statistic (from the big formula)
• p = the p-value of that z– Compare that to the α– Is it <α ? Then reject H0.
• p_hat is the sample proportion, = x / n
• n = sample size n
(added content by D.R.S.)


![Counterfactual Model for Learning Systems · Definition [IPS Utility Estimator]: Given 𝑆= 1, 1,𝛿1,…, 𝑛, 𝑛,𝛿𝑛 collected under 𝜋0, Unbiased estimate of utility](https://static.fdocument.org/doc/165x107/605dfe01ff887e0a3a7cc2b8/counterfactual-model-for-learning-definition-ips-utility-estimator-given-.jpg)