Satellite monitoring of dust storms over southwest Asia
27
Satellite monitoring of dust storms over southwest Asia Dr. Alireza Rashki Ferdowsi university of Mashhad, Mashhad, Iran [email protected]
Transcript of Satellite monitoring of dust storms over southwest Asia
Satellite monitoring of dust storms over southwest Asia
Dr. Alireza Rashki
Ferdowsi university of Mashhad, Mashhad, Iran
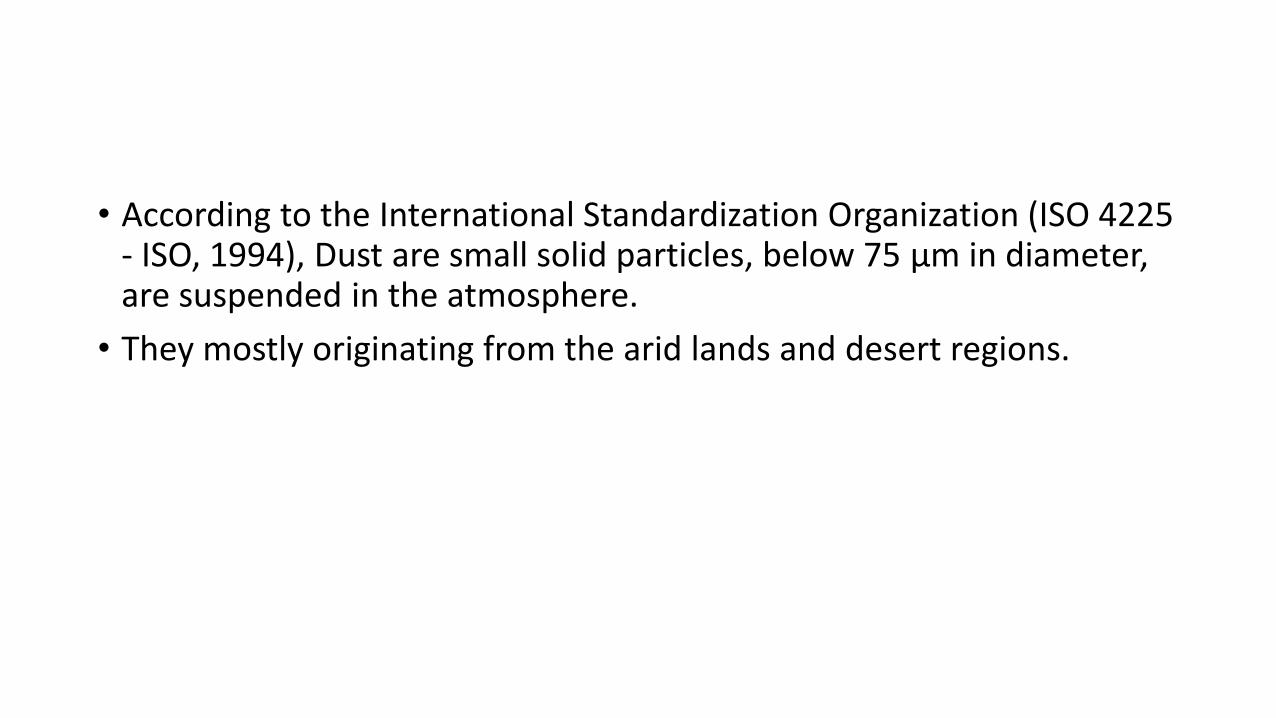
• According to the International Standardization Organization (ISO 4225 - ISO, 1994), Dust are small solid particles, below 75 μm in diameter, are suspended in the atmosphere.
• They mostly originating from the arid lands and desert regions.
• Dust cycle is an integral part of the Earth system
• Desert dust in recent years has grown increasingly and has important role in climate change of the world (Park and Jung, 2008).
•dust has direct effects on air pollution, disruption of Transportation
Systems, prevalence of respiratory disease (Samet et al., 2000Goudie , 2014
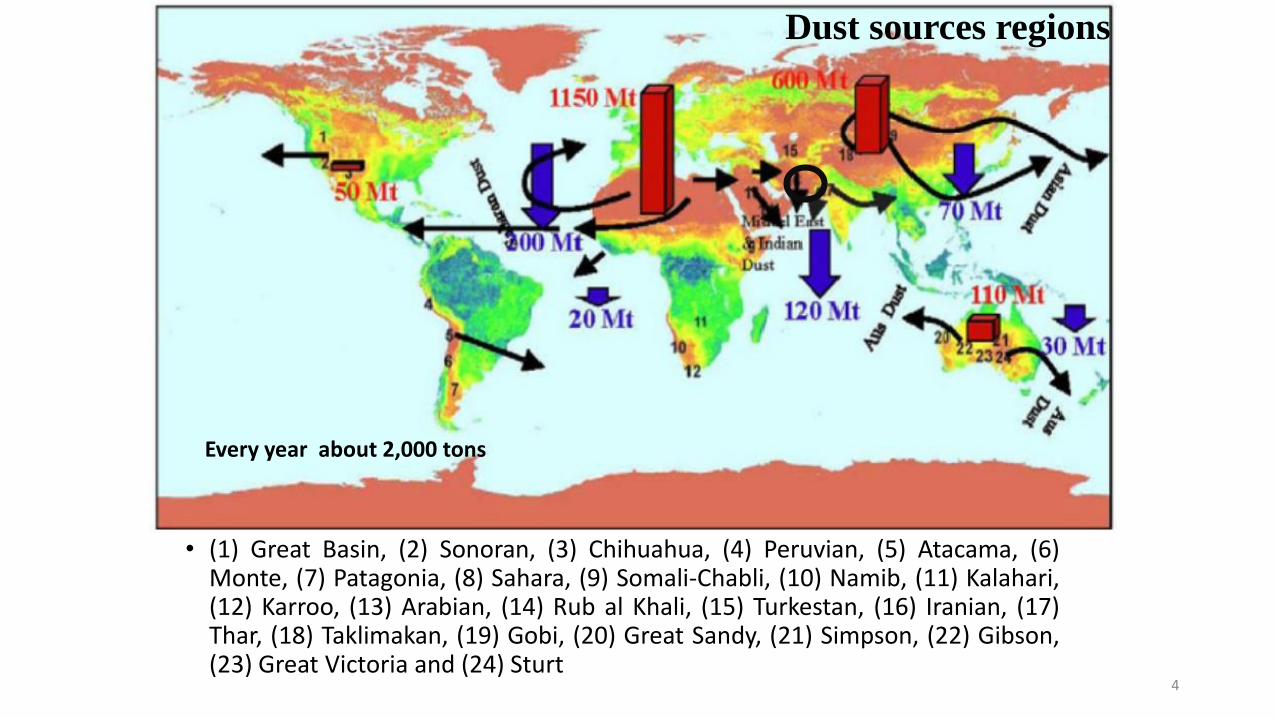
Dust sources regions
4
• (1) Great Basin, (2) Sonoran, (3) Chihuahua, (4) Peruvian, (5) Atacama, (6)Monte, (7) Patagonia, (8) Sahara, (9) Somali-Chabli, (10) Namib, (11) Kalahari,(12) Karroo, (13) Arabian, (14) Rub al Khali, (15) Turkestan, (16) Iranian, (17)Thar, (18) Taklimakan, (19) Gobi, (20) Great Sandy, (21) Simpson, (22) Gibson,(23) Great Victoria and (24) Sturt
Every year about 2,000 tons
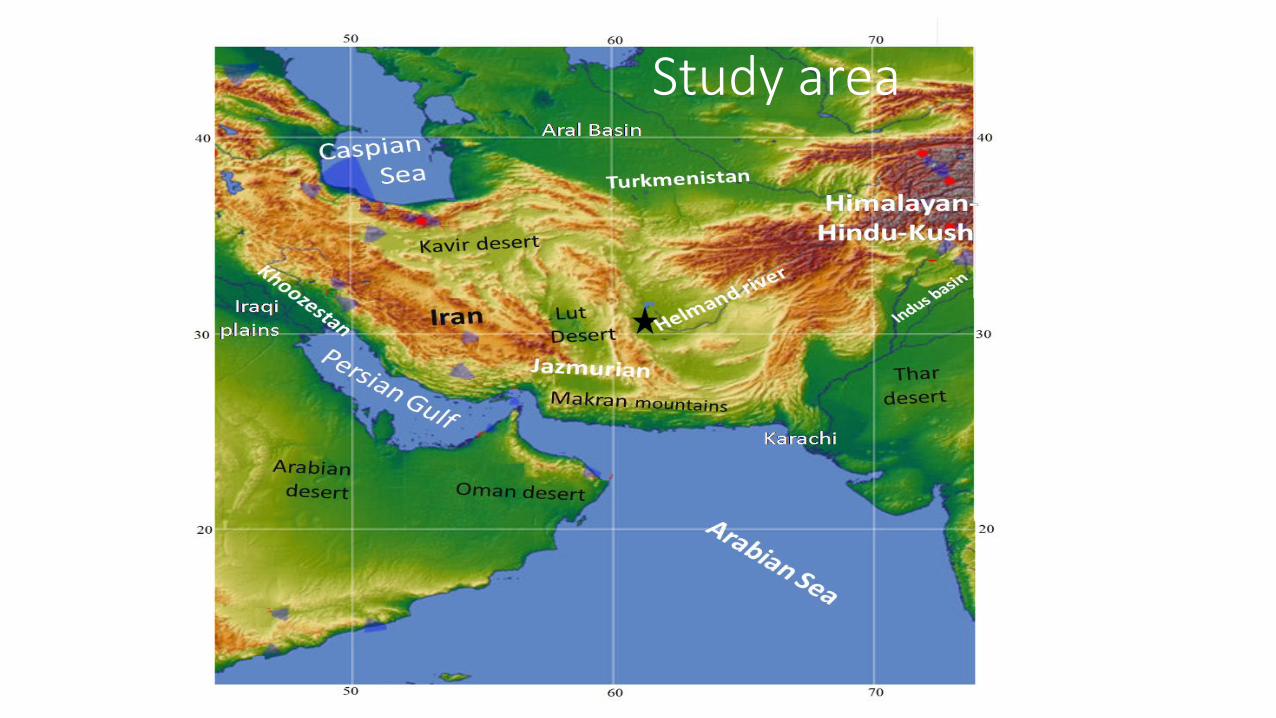
Study area
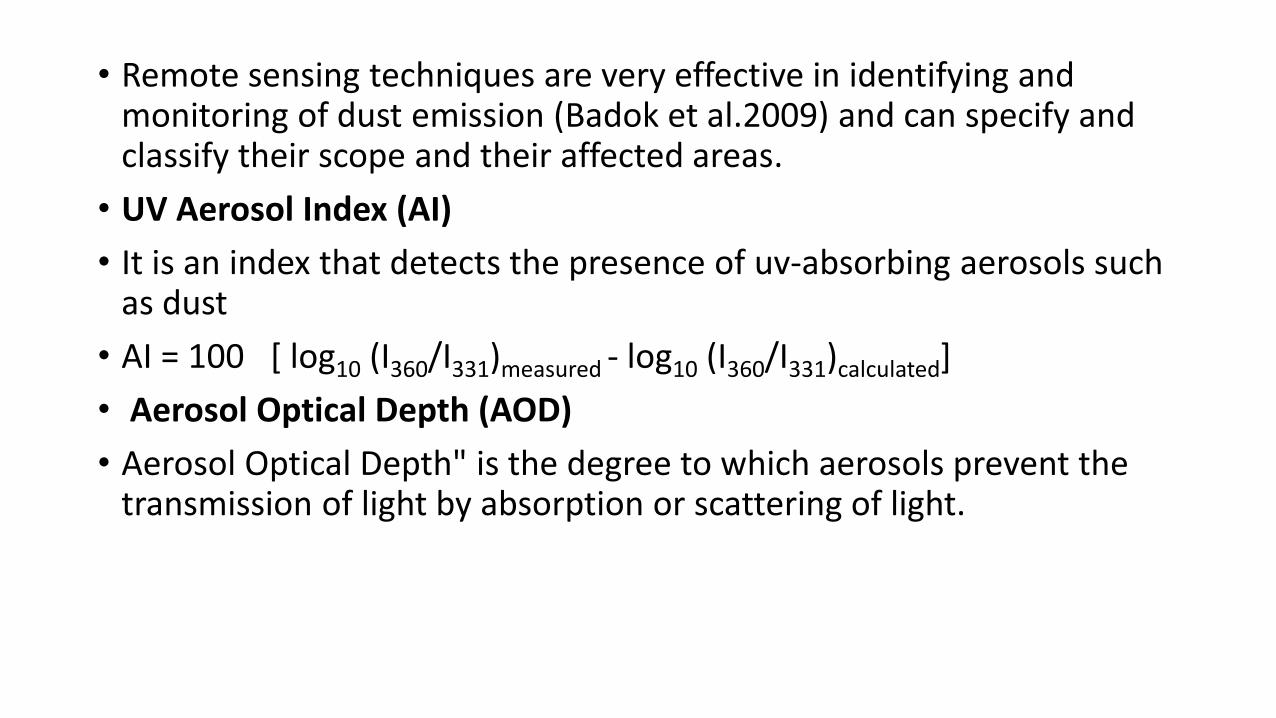
• Remote sensing techniques are very effective in identifying and monitoring of dust emission (Badok et al.2009) and can specify and classify their scope and their affected areas.
• UV Aerosol Index (AI)
• It is an index that detects the presence of uv-absorbing aerosols such as dust
• AI = 100 [ log10 (I360/I331)measured - log10 (I360/I331)calculated]
• Aerosol Optical Depth (AOD)
• Aerosol Optical Depth" is the degree to which aerosols prevent the transmission of light by absorption or scattering of light.
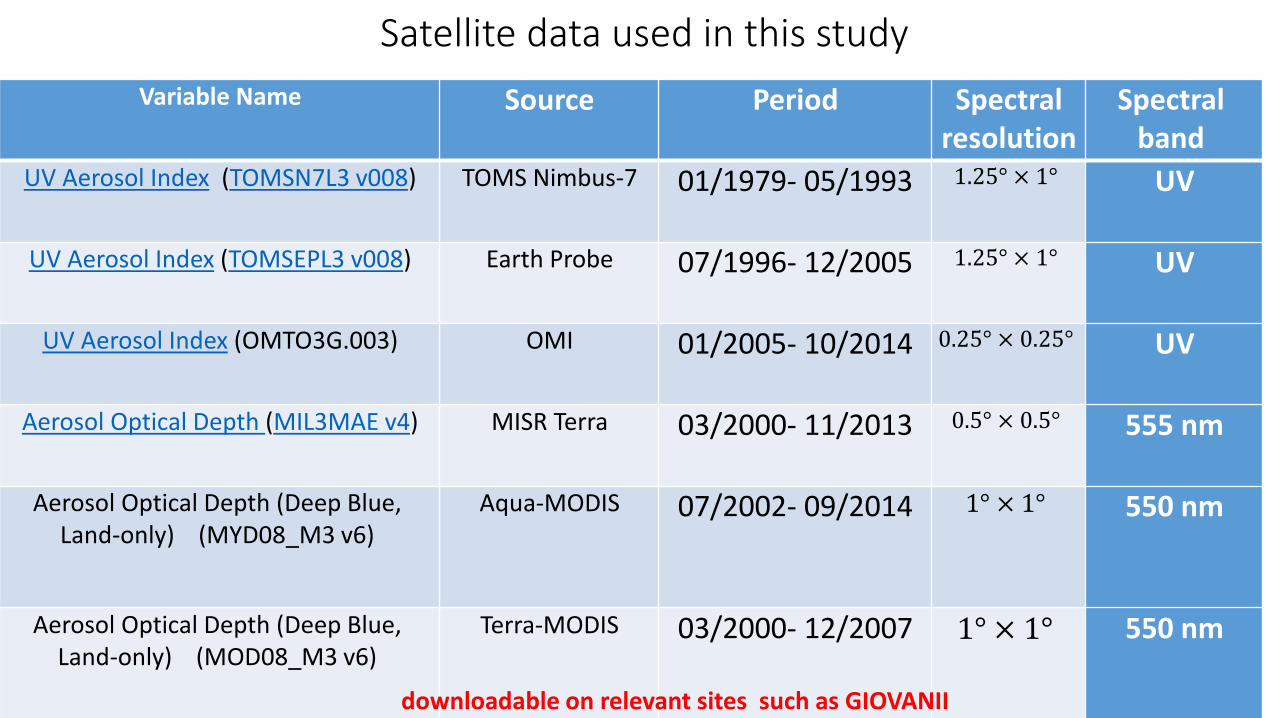
Satellite data used in this study
Spectral band
Spectral resolution
PeriodSourceVariable Name
UV1.25° × 1°01/1979- 05/1993TOMS Nimbus-7UV Aerosol Index (TOMSN7L3 v008)
UV1.25° × 1°07/1996- 12/2005Earth ProbeUV Aerosol Index (TOMSEPL3 v008)
UV0.25° × 0.25°01/2005- 10/2014OMIUV Aerosol Index (OMTO3G.003)
555 nm0.5° × 0.5°03/2000- 11/2013MISR TerraAerosol Optical Depth (MIL3MAE v4)
550 nm1° × 1°07/2002- 09/2014Aqua-MODISAerosol Optical Depth (Deep Blue, Land-only) (MYD08_M3 v6)
550 nm1° × 1°03/2000- 12/2007Terra-MODISAerosol Optical Depth (Deep Blue, Land-only) (MOD08_M3 v6)
downloadable on relevant sites such as GIOVANII
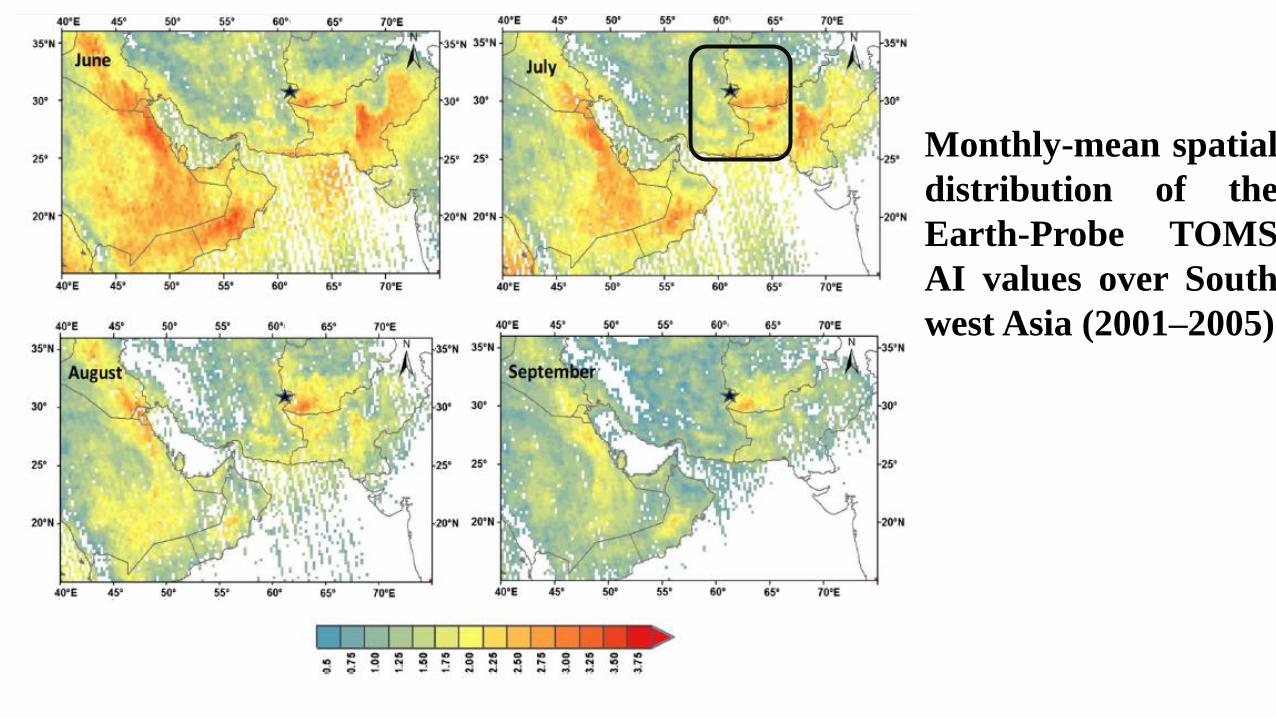
Monthly-mean spatial
distribution of the
Earth-Probe TOMS
AI values over South
west Asia (2001–2005)
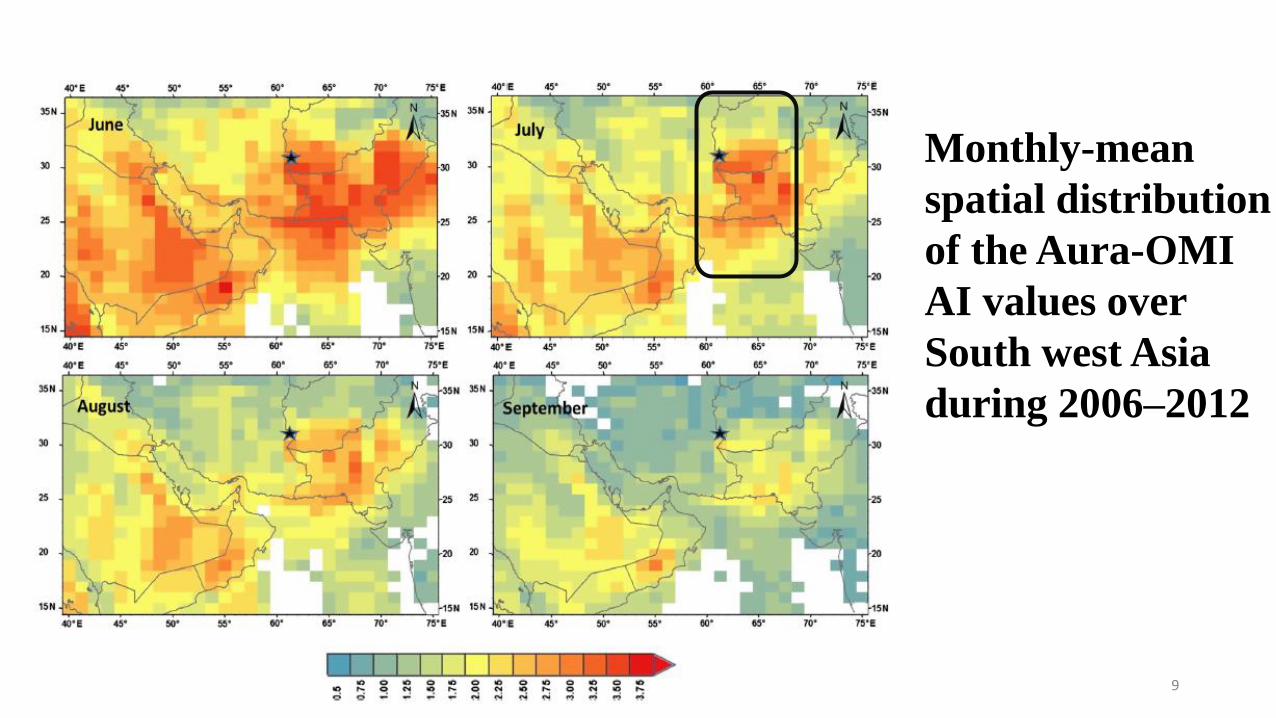
Monthly-mean
spatial distribution
of the Aura-OMI
AI values over
South west Asia
during 2006–2012
12/7/2017 9
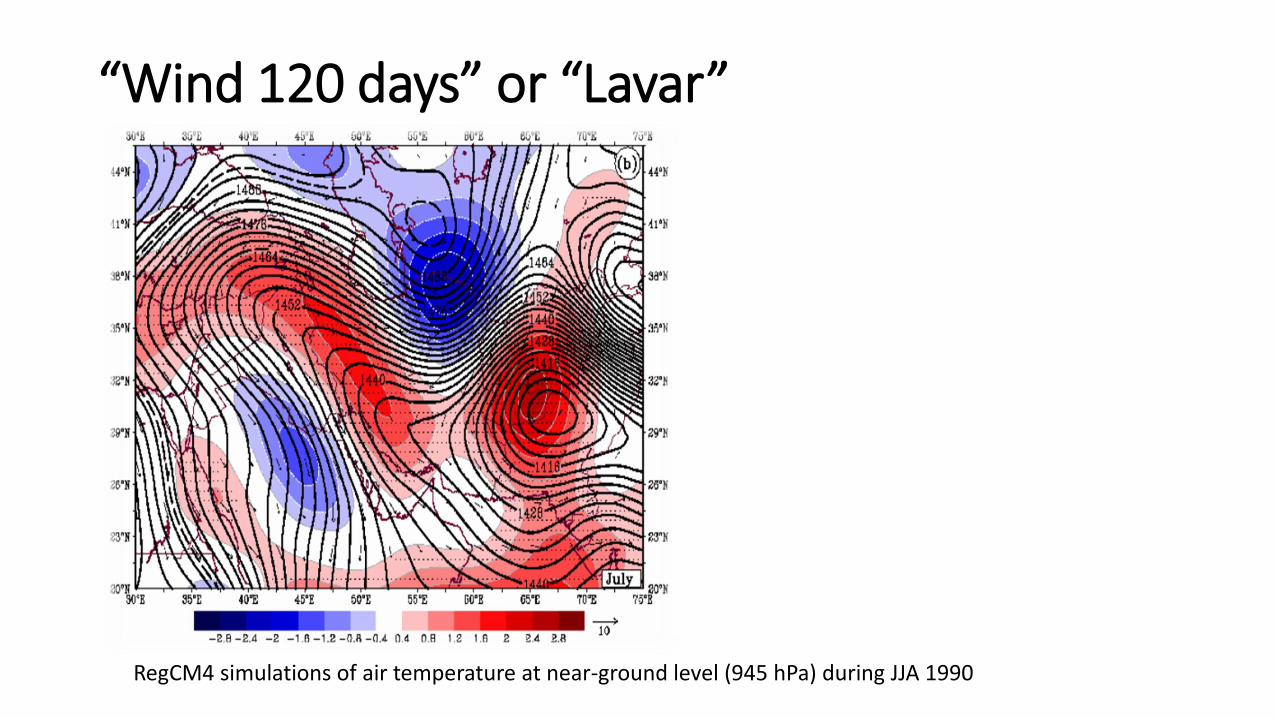
“Wind 120 days” or “Lavar”
RegCM4 simulations of air temperature at near-ground level (945 hPa) during JJA 1990
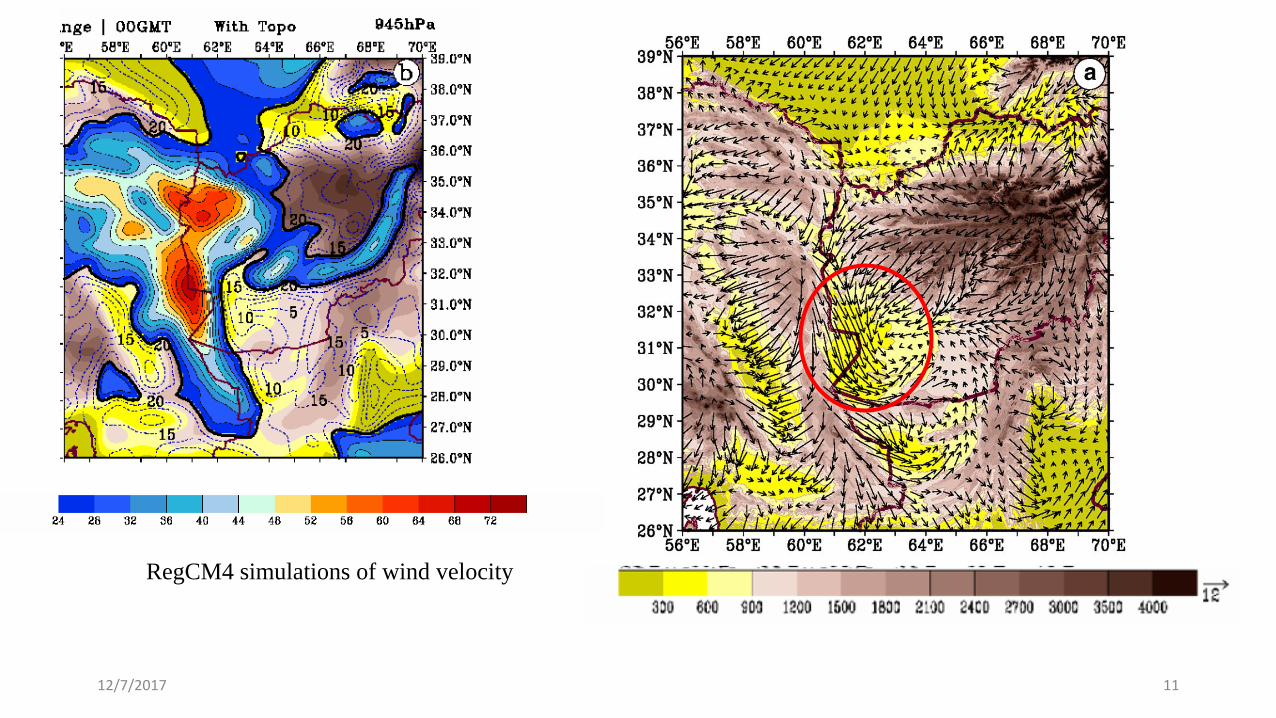
12/7/2017 11
RegCM4 simulations of wind velocity
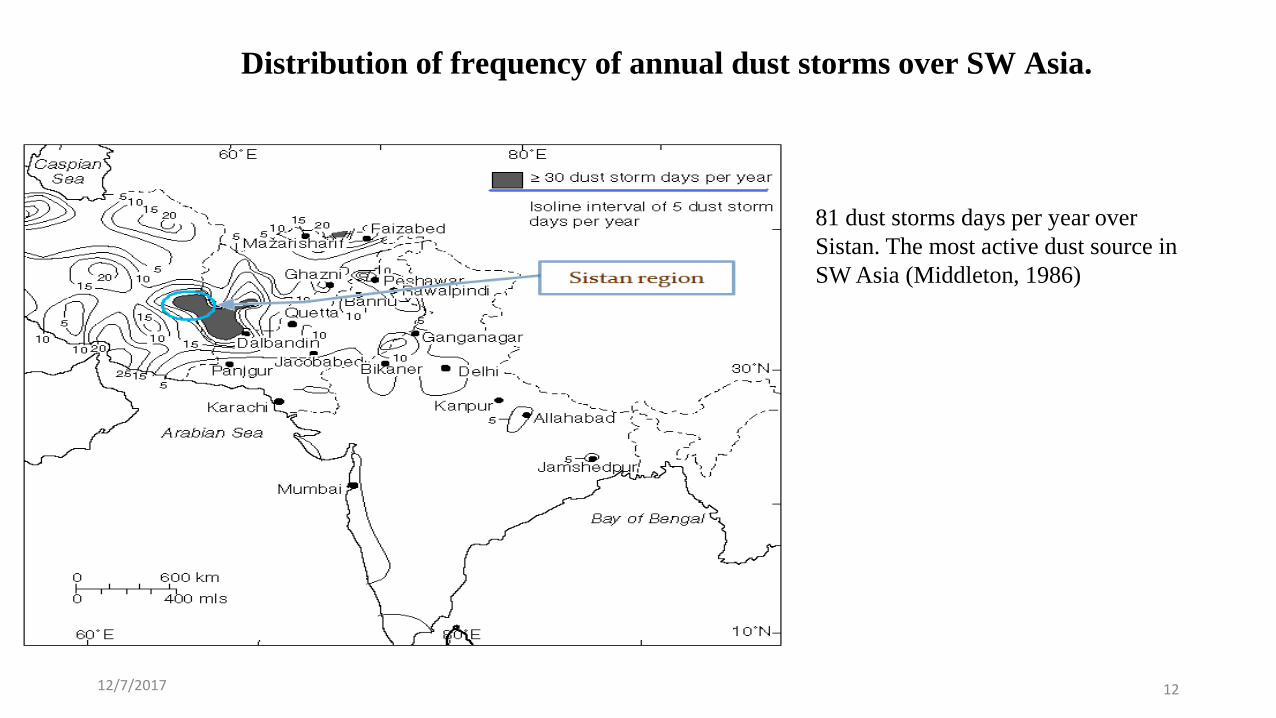
Distribution of frequency of annual dust storms over SW Asia.
12/7/2017 12
81 dust storms days per year over
Sistan. The most active dust source in
SW Asia (Middleton, 1986)
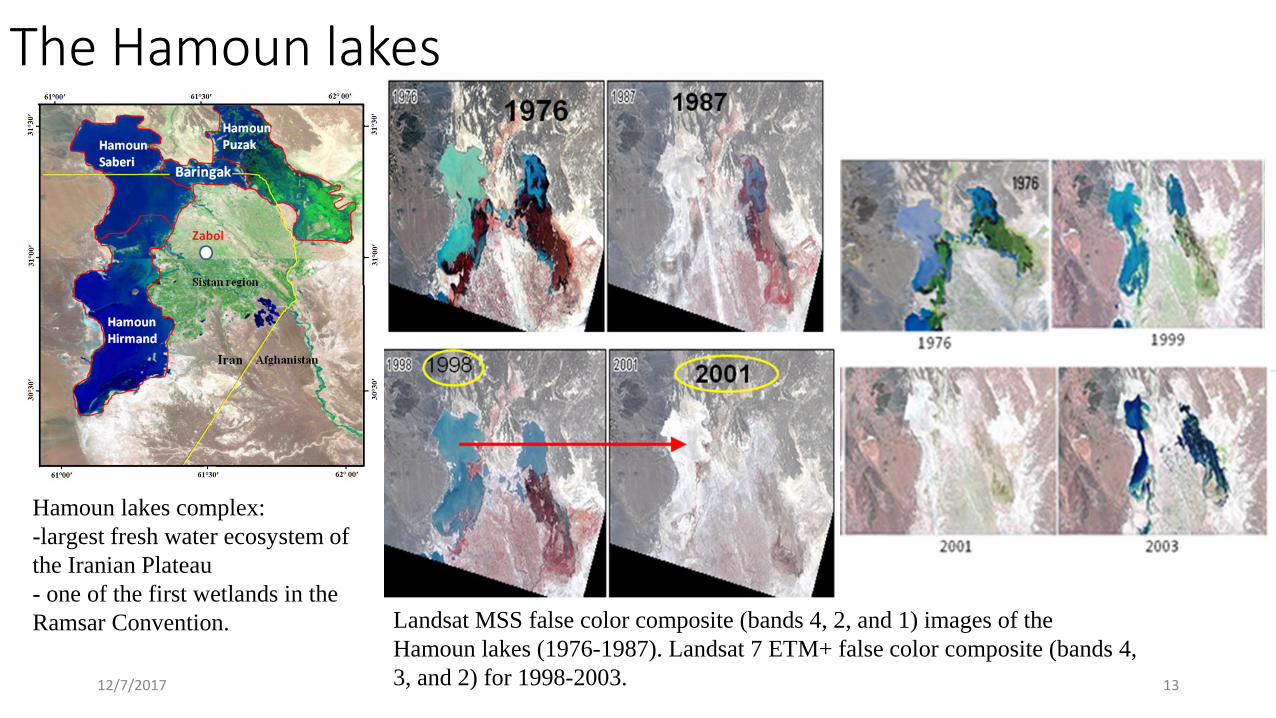
The Hamoun lakes
Hamoun lakes complex:
-largest fresh water ecosystem of
the Iranian Plateau
- one of the first wetlands in the
Ramsar Convention. Landsat MSS false color composite (bands 4, 2, and 1) images of the
Hamoun lakes (1976-1987). Landsat 7 ETM+ false color composite (bands 4,
3, and 2) for 1998-2003. 12/7/2017 13
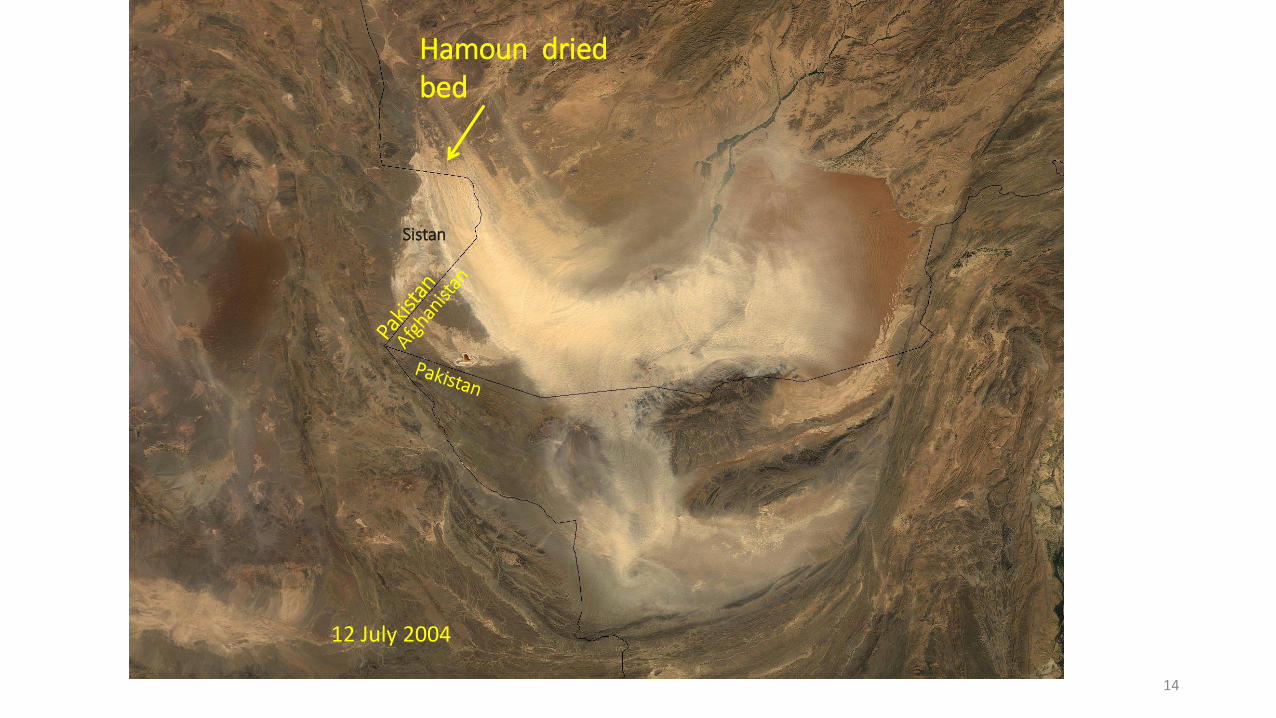
14
Sistan
Hamoun dried bed
12 July 2004
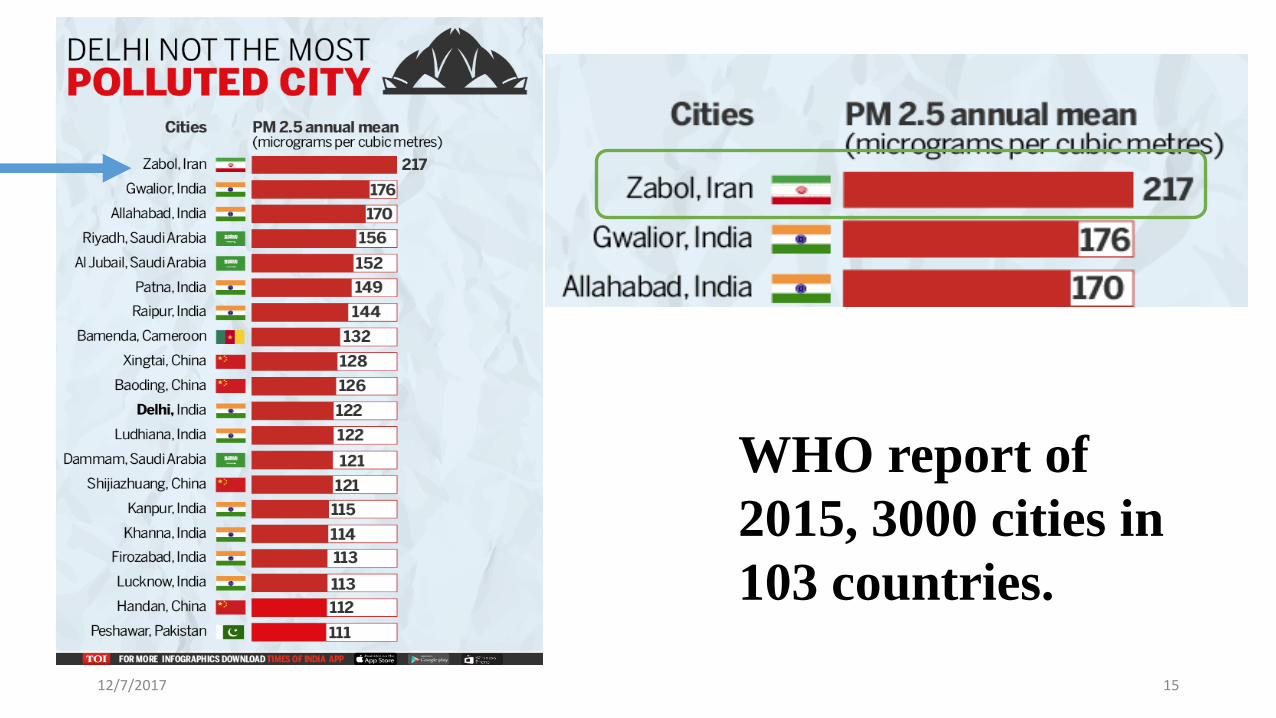
WHO report of
2015, 3000 cities in
103 countries.
12/7/2017 15
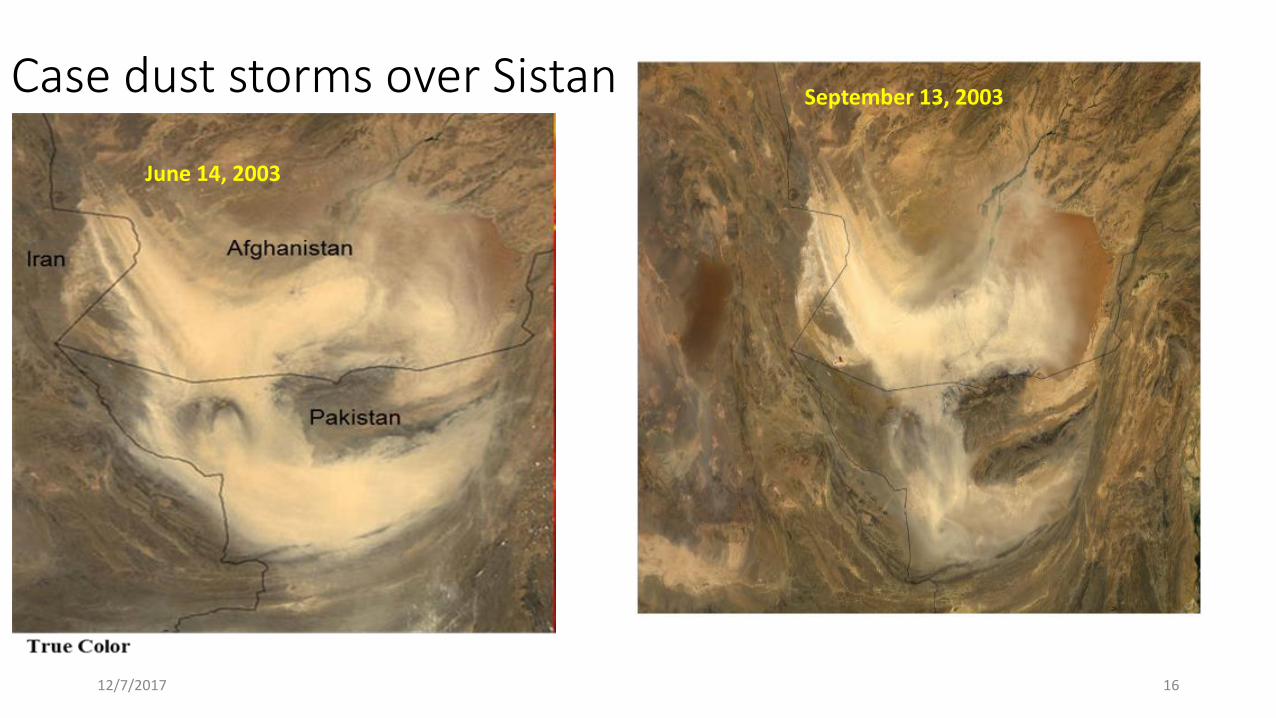
Case dust storms over SistanSeptember 13, 2003
June 14, 2003
12/7/2017 16
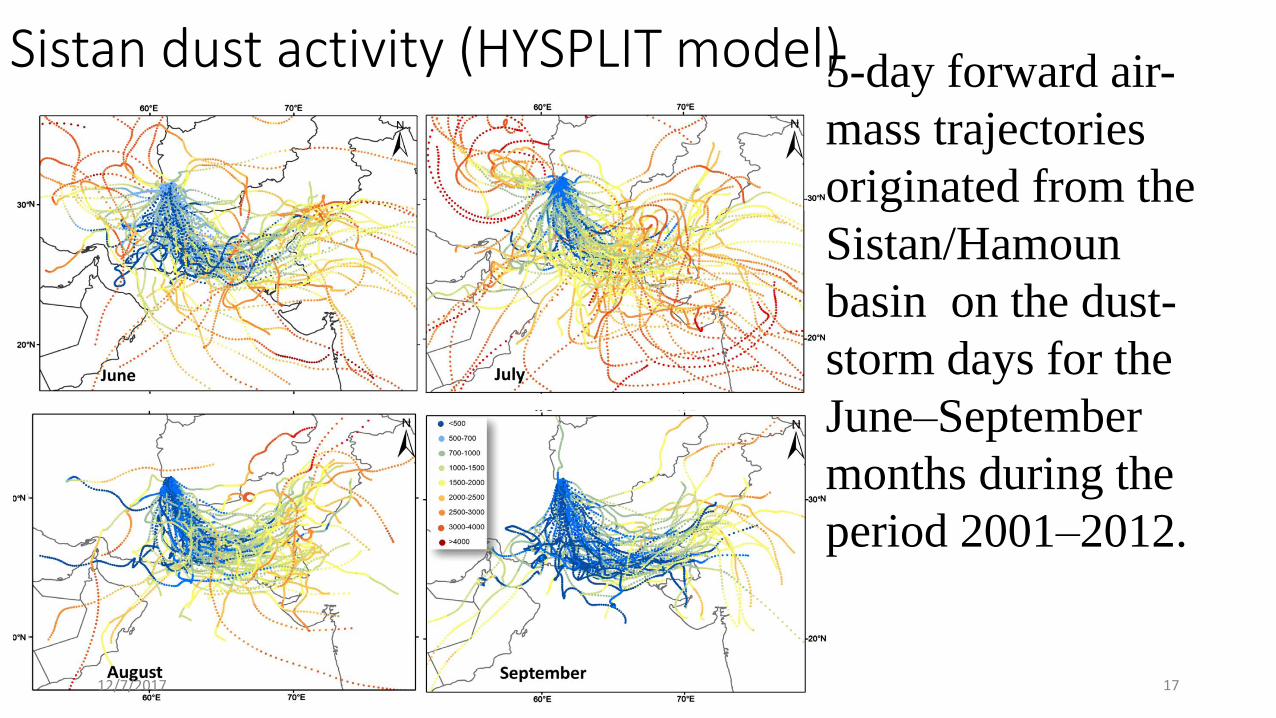
Sistan dust activity (HYSPLIT model)5-day forward air-
mass trajectories
originated from the
Sistan/Hamoun
basin on the dust-
storm days for the
June–September
months during the
period 2001–2012.
12/7/2017 17
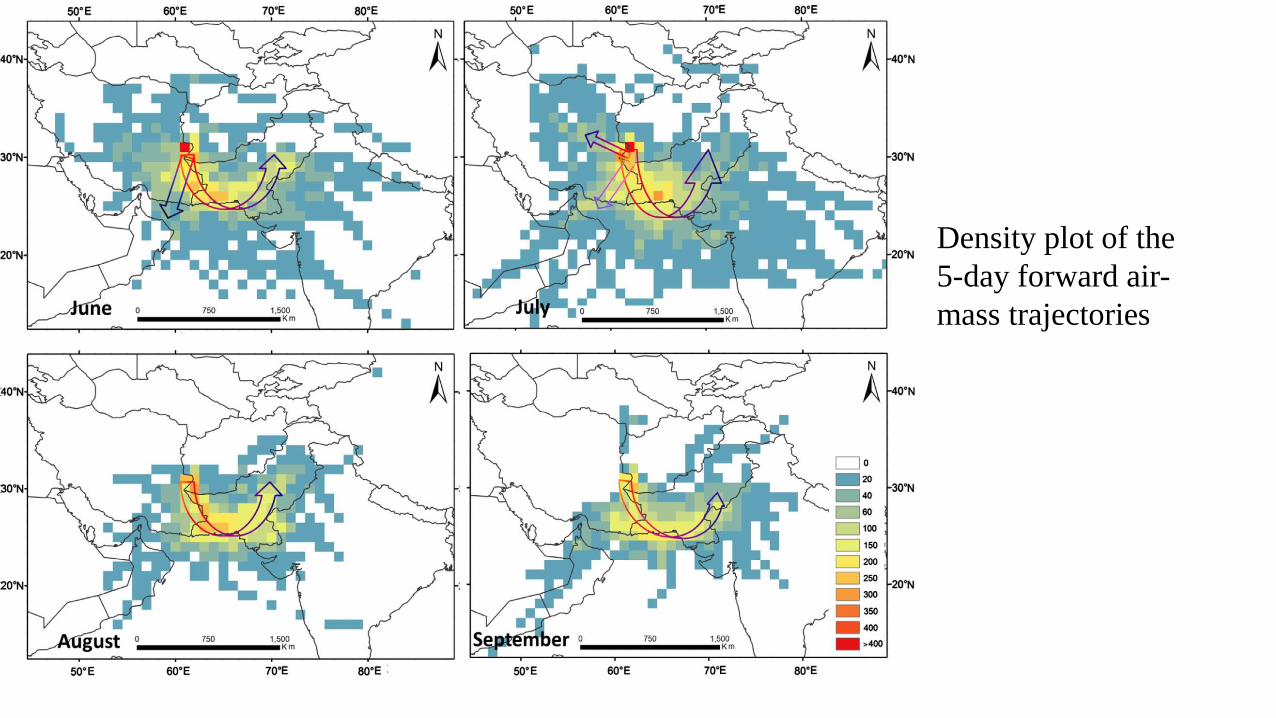
Density plot of the
5-day forward air-
mass trajectories
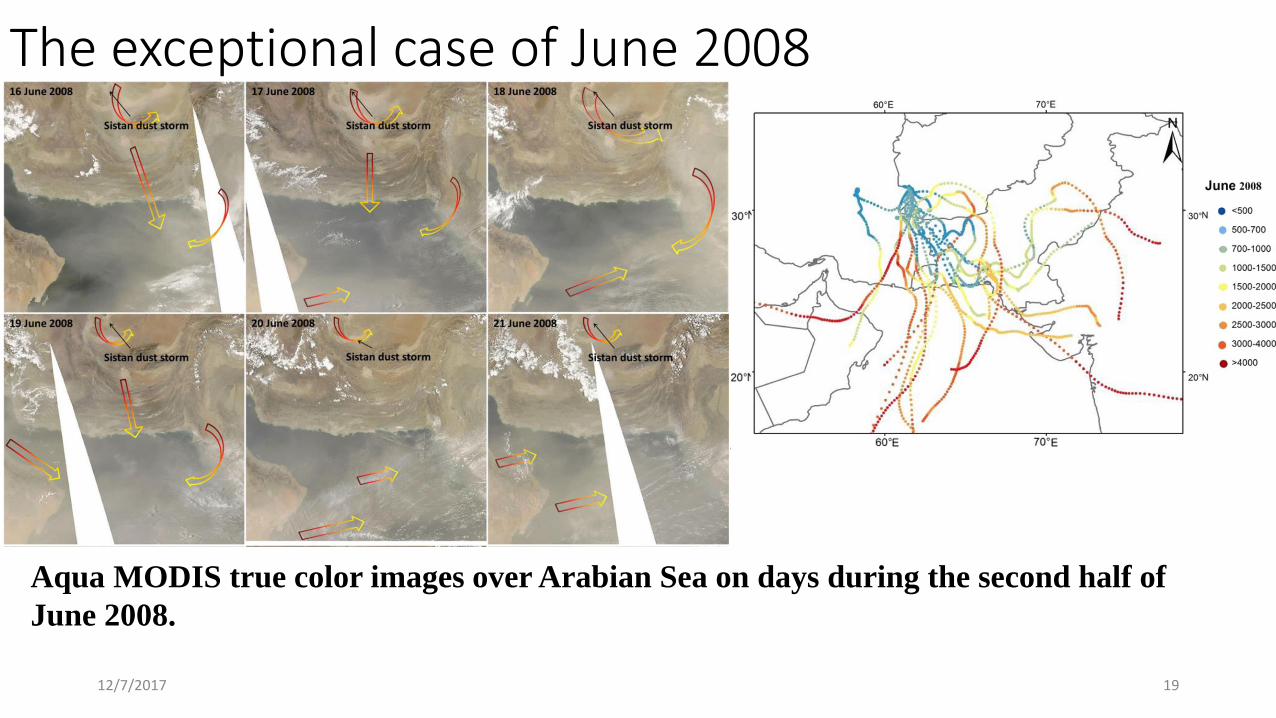
The exceptional case of June 2008
Aqua MODIS true color images over Arabian Sea on days during the second half of
June 2008.
12/7/2017 19
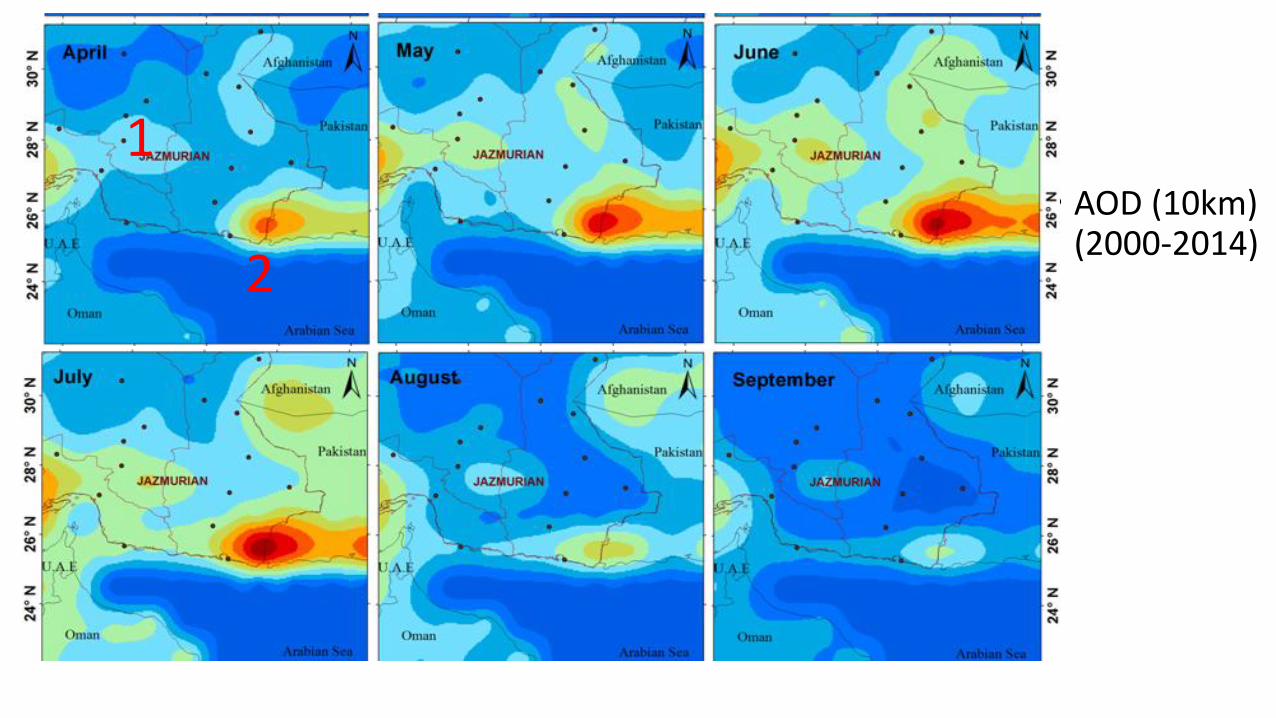
• AOD (10km) (2000-2014)
1
2
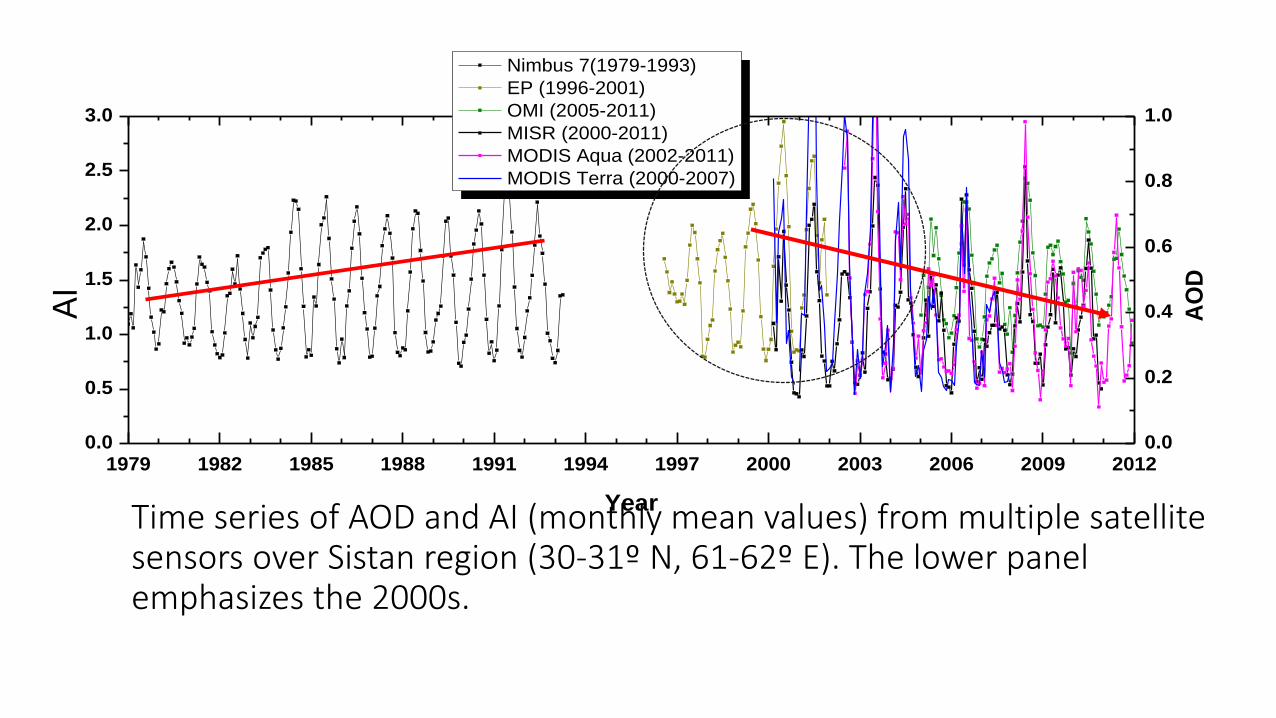
Time series of AOD and AI (monthly mean values) from multiple satellite sensors over Sistan region (30-31º N, 61-62º E). The lower panel emphasizes the 2000s.
1979 1982 1985 1988 1991 1994 1997 2000 2003 2006 2009 20120.0
0.5
1.0
1.5
2.0
2.5
3.0
Nimbus 7(1979-1993)
EP (1996-2001)
OMI (2005-2011)
MISR (2000-2011)
MODIS Aqua (2002-2011)
MODIS Terra (2000-2007)
Year
AI
0.0
0.2
0.4
0.6
0.8
1.0
AO
D
1.2
1.6
2.0
2.4
2.8
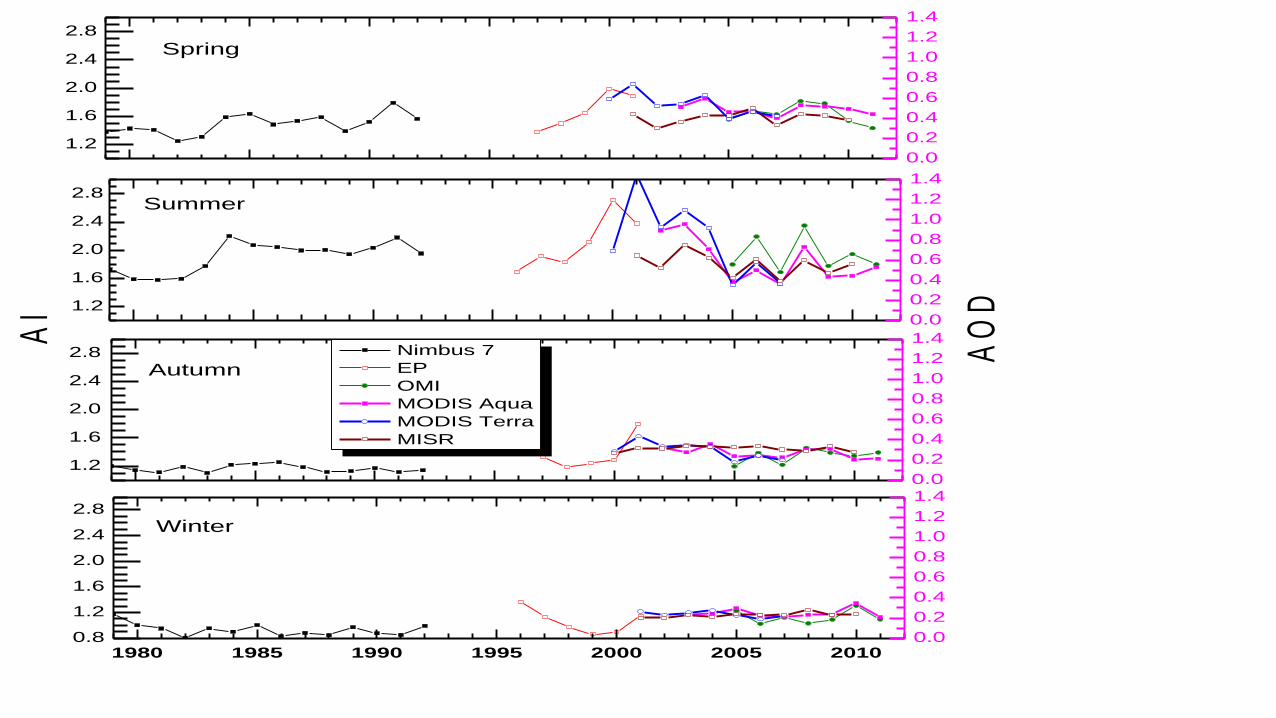
Nimbus 7
EP
OMI
MODIS Aqua
MODIS Terra
MISR
A I
0.0
0.2
0.4
0.6
0.8
1.0
1.2
1.4
1.2
1.6
2.0
2.4
2.8
Spring
Summer
Autumn
Winter
0.0
0.2
0.4
0.6
0.8
1.0
1.2
1.4
1.2
1.6
2.0
2.4
2.8
0.0
0.2
0.4
0.6
0.8
1.0
1.2
1.4
1980 1985 1990 1995 2000 2005 20100.8
1.2
1.6
2.0
2.4
2.8
0.0
0.2
0.4
0.6
0.8
1.0
1.2
1.4
A O
D
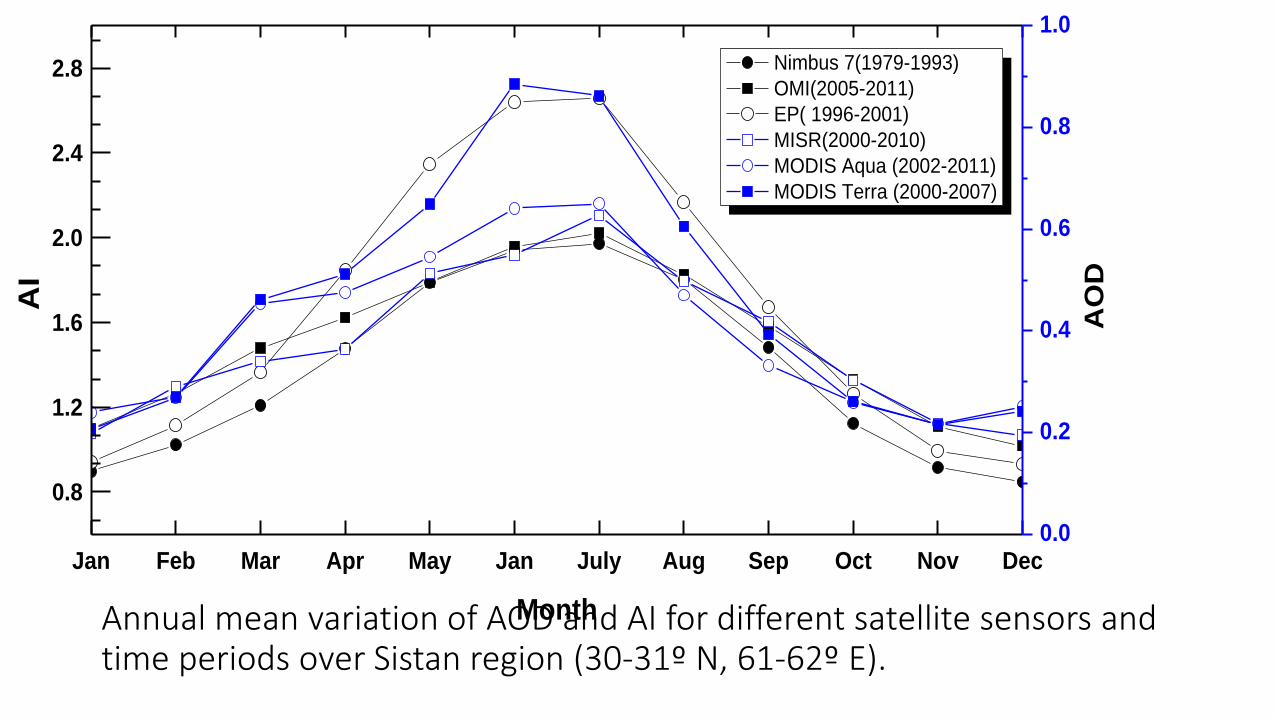
Annual mean variation of AOD and AI for different satellite sensors and time periods over Sistan region (30-31º N, 61-62º E).
Jan Feb Mar Apr May Jan July Aug Sep Oct Nov Dec
0.8
1.2
1.6
2.0
2.4
2.8 Nimbus 7(1979-1993)
OMI(2005-2011)
EP( 1996-2001)
MISR(2000-2010)
MODIS Aqua (2002-2011)
MODIS Terra (2000-2007)
Month
AI
0.0
0.2
0.4
0.6
0.8
1.0
AO
D
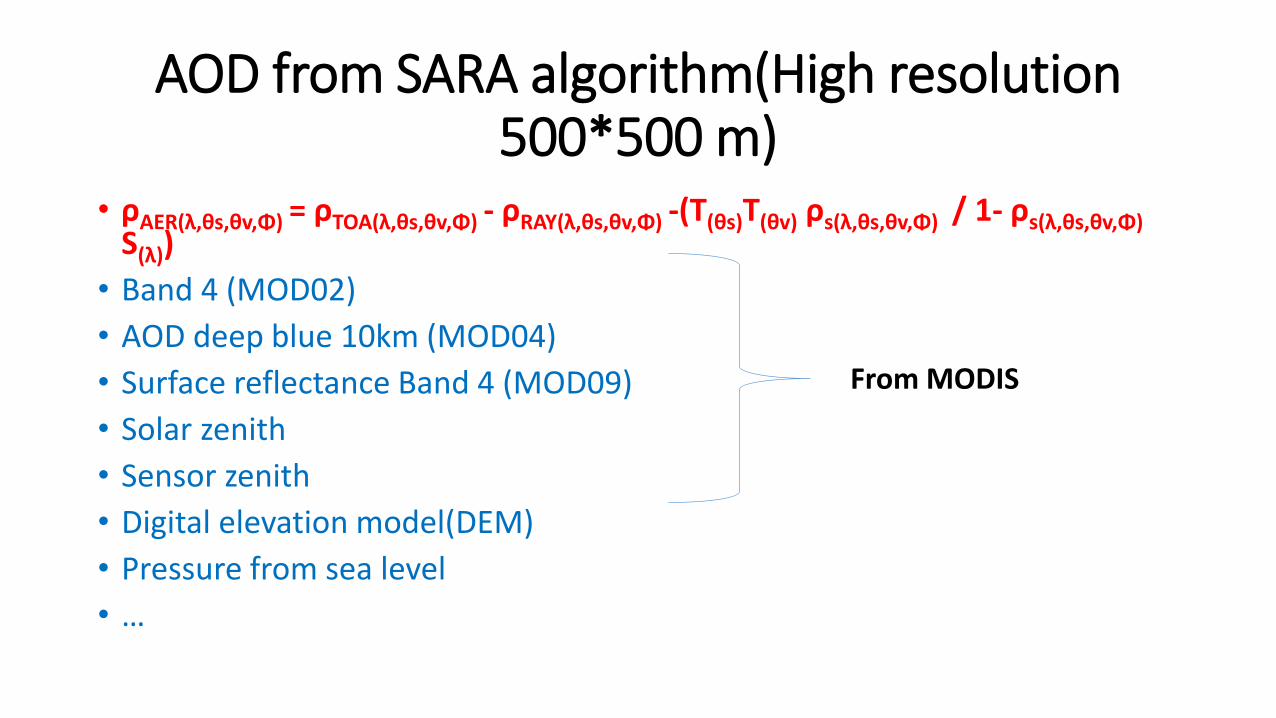
AOD from SARA algorithm(High resolution 500*500 m)
• ρAER(λ,θs,θv,Φ) = ρTOA(λ,θs,θv,Φ) - ρRAY(λ,θs,θv,Φ) -(T(θs)T(θv) ρs(λ,θs,θv,Φ) / 1- ρs(λ,θs,θv,Φ)S(λ))
• Band 4 (MOD02)
• AOD deep blue 10km (MOD04)
• Surface reflectance Band 4 (MOD09)
• Solar zenith
• Sensor zenith
• Digital elevation model(DEM)
• Pressure from sea level
• …
From MODIS
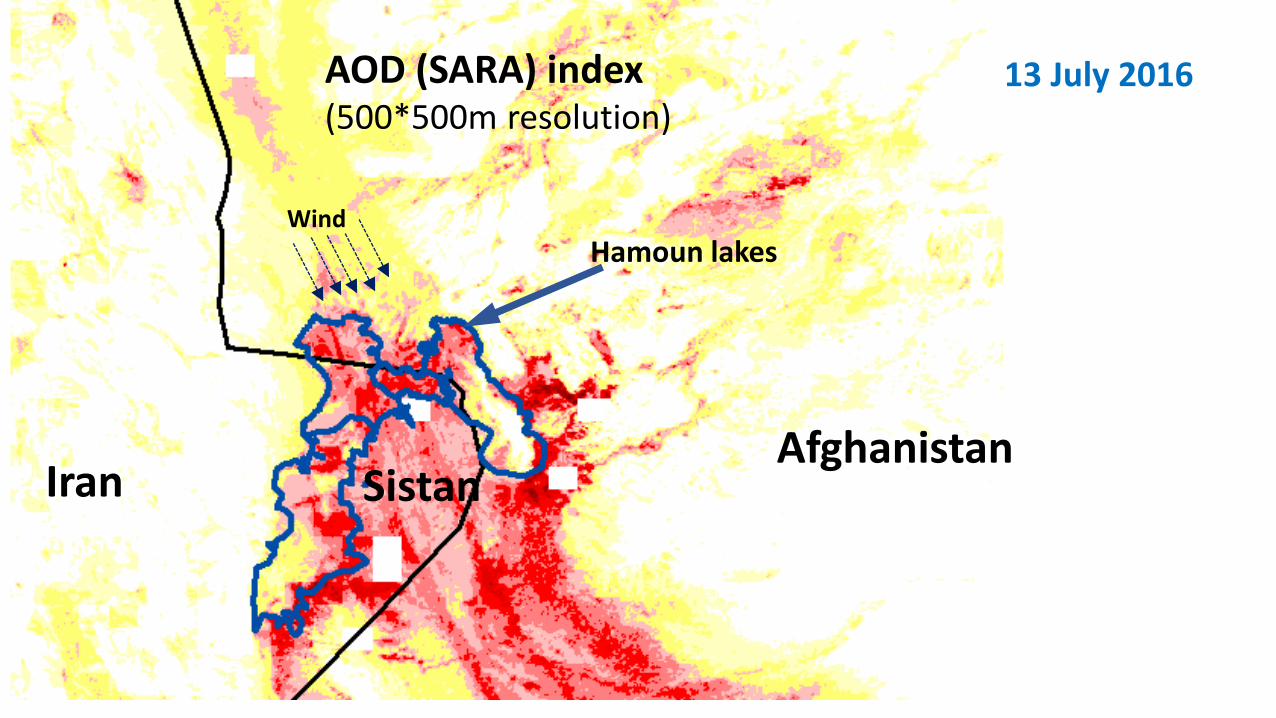
AOD (SARA) index (500*500m resolution)
13 July 2016
IranAfghanistan
Hamoun lakes
Sistan
Wind
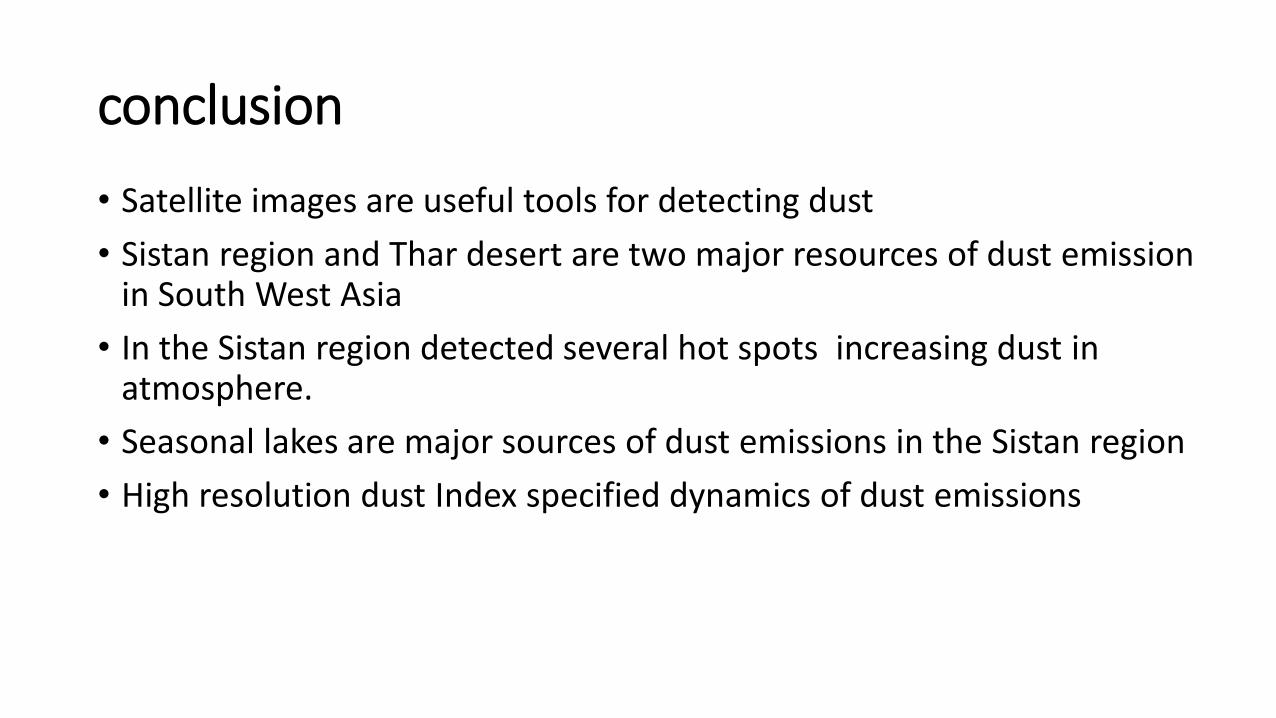
conclusion
• Satellite images are useful tools for detecting dust
• Sistan region and Thar desert are two major resources of dust emission in South West Asia
• In the Sistan region detected several hot spots increasing dust in atmosphere.
• Seasonal lakes are major sources of dust emissions in the Sistan region
• High resolution dust Index specified dynamics of dust emissions