Resistivity - UTSA of the material the wire is composed of. The SI units of resistivity are...
8
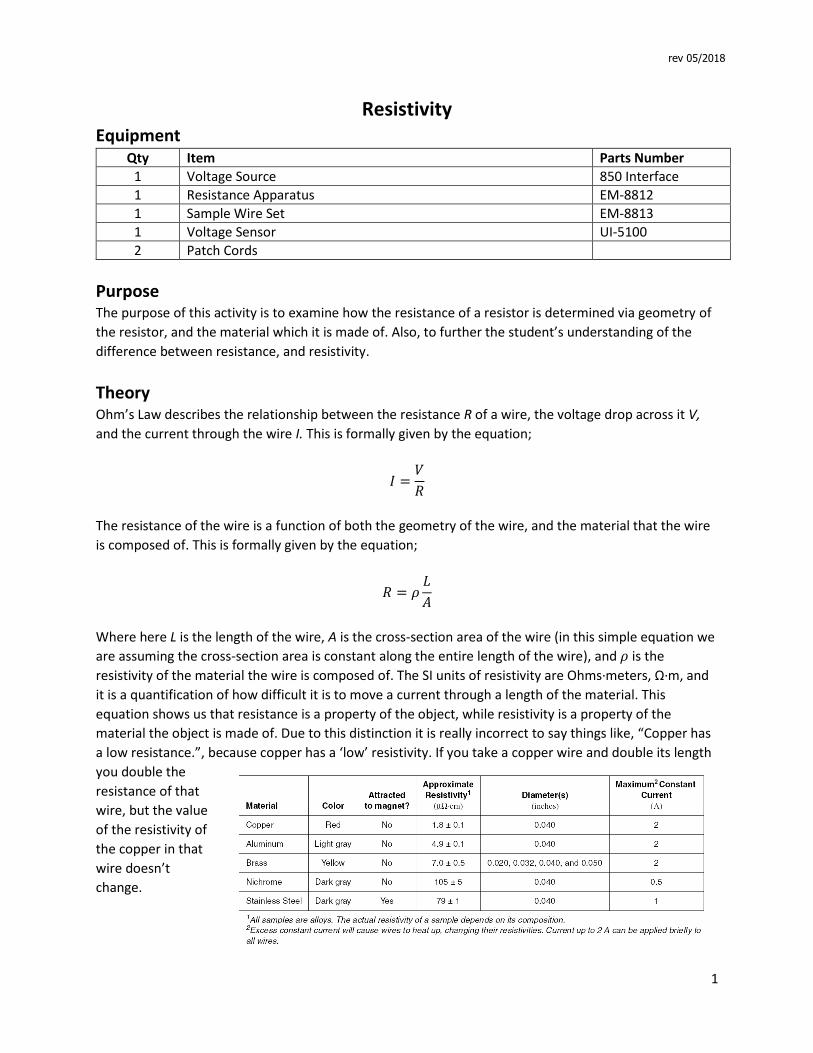
1 Resistivity Equipment Qty Item Parts Number 1 Voltage Source 850 Interface 1 Resistance Apparatus EM-8812 1 Sample Wire Set EM-8813 1 Voltage Sensor UI-5100 2 Patch Cords Purpose The purpose of this activity is to examine how the resistance of a resistor is determined via geometry of the resistor, and the material which it is made of. Also, to further the student’s understanding of the difference between resistance, and resistivity. Theory Ohm’s Law describes the relationship between the resistance R of a wire, the voltage drop across it V, and the current through the wire I. This is formally given by the equation; = The resistance of the wire is a function of both the geometry of the wire, and the material that the wire is composed of. This is formally given by the equation; = Where here L is the length of the wire, A is the cross-section area of the wire (in this simple equation we are assuming the cross-section area is constant along the entire length of the wire), and is the resistivity of the material the wire is composed of. The SI units of resistivity are Ohms·meters, Ω·m, and it is a quantification of how difficult it is to move a current through a length of the material. This equation shows us that resistance is a property of the object, while resistivity is a property of the material the object is made of. Due to this distinction it is really incorrect to say things like, “Copper has a low resistance.”, because copper has a ‘low’ resistivity. If you take a copper wire and double its length you double the resistance of that wire, but the value of the resistivity of the copper in that wire doesn’t change. rev 05/2018
Transcript of Resistivity - UTSA of the material the wire is composed of. The SI units of resistivity are...
1
Resistivity
EquipmentQty Item Parts Number
1 Voltage Source 850 Interface
1 Resistance Apparatus EM-8812
1 Sample Wire Set EM-8813
1 Voltage Sensor UI-5100
2 Patch Cords
PurposeThe purpose of this activity is to examine how the resistance of a resistor is determined via geometry of
the resistor, and the material which it is made of. Also, to further the student’s understanding of the
difference between resistance, and resistivity.
TheoryOhm’s Law describes the relationship between the resistance R of a wire, the voltage drop across it V,
and the current through the wire I. This is formally given by the equation;
𝐼 =𝑉
𝑅
The resistance of the wire is a function of both the geometry of the wire, and the material that the wire
is composed of. This is formally given by the equation;
𝑅 = 𝜌𝐿
𝐴
Where here L is the length of the wire, A is the cross-section area of the wire (in this simple equation we
are assuming the cross-section area is constant along the entire length of the wire), and 𝜌 is the
resistivity of the material the wire is composed of. The SI units of resistivity are Ohms·meters, Ω·m, and
it is a quantification of how difficult it is to move a current through a length of the material. This
equation shows us that resistance is a property of the object, while resistivity is a property of the
material the object is made of. Due to this distinction it is really incorrect to say things like, “Copper has
a low resistance.”, because copper has a ‘low’ resistivity. If you take a copper wire and double its length
you double the
resistance of that
wire, but the value
of the resistivity of
the copper in that
wire doesn’t
change.
rev 05/2018
2
Setup
1. Open the Capstone software. On the left side of the main screen is the Tool Bar. Click on the
Hardware Setup icon. This will open the Setup window.
Click on Analog Channel A of the picture of the 850 Universal Interface in the Setup
window, and then scroll down, and add the ‘Voltage Sensor’.
Click on Output Channel 1 of the picture of the 850 Universal Interface in the Setup
window, and then scroll down, and add the ‘Output Voltage-Current Sensor’.
2. On the bottom center left of the main screen the Sample Rate Tab should now say ‘
Common Rate’.
Set the Sample Rate to 1 Hz.
3. Right to the right of the Sample Rate is the Recording Conditions icon, click on it. This should
open up the Recording conditions window.
Click on ‘Stop condition’.
Set Condition type to ‘Time Based’.
Set Record Time to 1.00 seconds.
Click on ‘ok’.
4. In the Tool Bar, now click on the Signal Generator Icon. This will open the Signal Generator
window.
5. In the Signal Generator window click on the tab “850 output 1” tab. This will open up the
options window for the output generator 1.
6. Set the Waveform to a “DC”.
7. Set the DC Voltage to 2 volts.
8. Set the Voltage Limit to 2 volts.
9. Set the Current Limit to 1.10 A.
10. Set the Generator to “Auto”, so that it will start and stop automatically when you start and stop
collecting data.
11. Close the Tool Bar.
12. In the main window click on the ‘Two Displays” option. (Bottom left option). A two display
window should appear.
13. In the Display Bar, on the right side of the main screen, click and hold down the ‘digits’ icon,
then drag it out to the top display, and then release. Repeat for the bottom display as well.
14. For the top digits display click on ‘select measurement’ and select ‘Voltage Ch A (V)’
15. For the bottom digits display click on ‘select measurement’ and select ‘Output Current, Ch 1 (A)’.
16. Putting a wire in the Resistance Apparatus.
Move the Reference Probe, and the Slider Probe to their “parked” positions.
Twist the two black handles counterclockwise to open the clamps to allow the wire to
slide into position.
Slide the 0.050 inch diameter Copper wire into position such that each end passes
underneath both a probe, and one of the clamps.
3
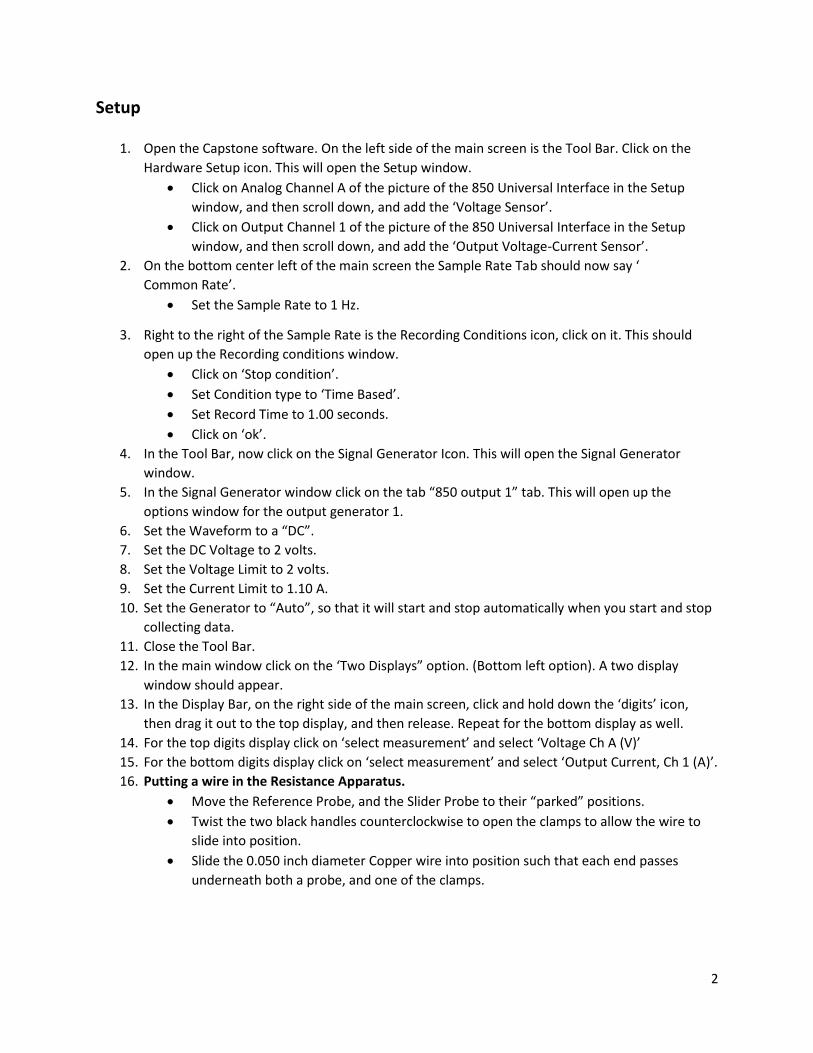
Tighten the clamps to hold the wire in place, but don’t tighten too much. As soon as you
get a little resistance stop tightening.
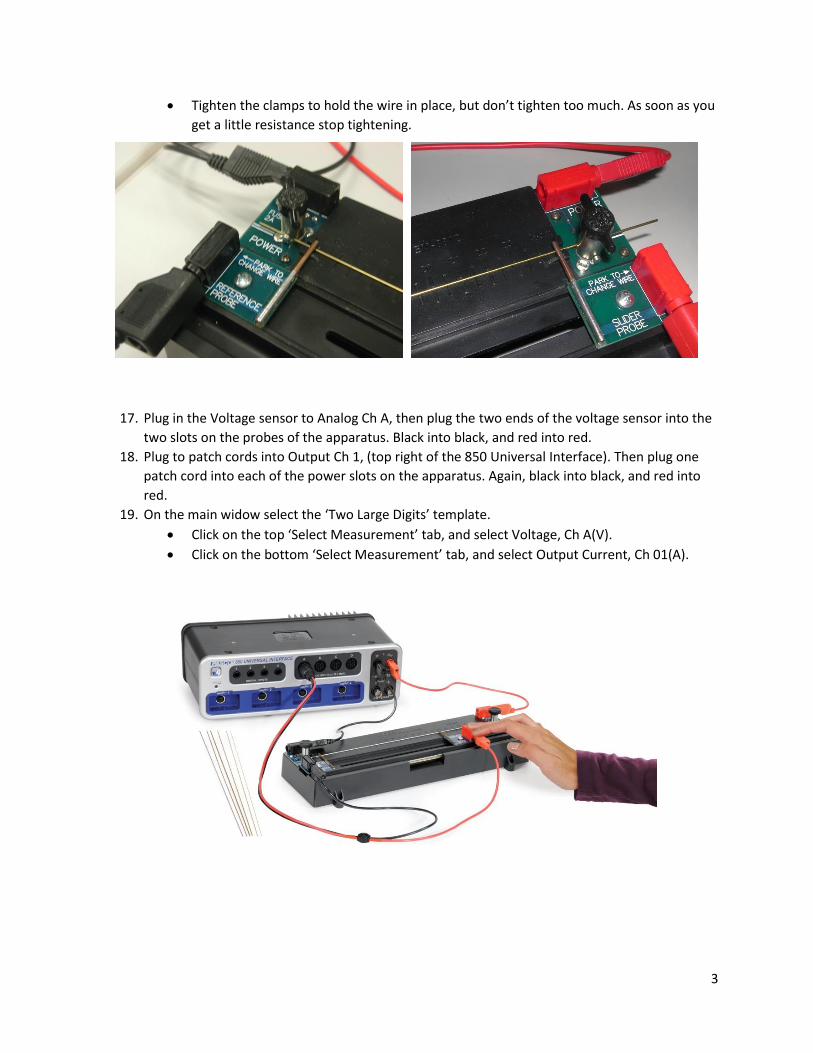
17. Plug in the Voltage sensor to Analog Ch A, then plug the two ends of the voltage sensor into the
two slots on the probes of the apparatus. Black into black, and red into red.
18. Plug to patch cords into Output Ch 1, (top right of the 850 Universal Interface). Then plug one
patch cord into each of the power slots on the apparatus. Again, black into black, and red into
red.
19. On the main widow select the ‘Two Large Digits’ template.
Click on the top ‘Select Measurement’ tab, and select Voltage, Ch A(V).
Click on the bottom ‘Select Measurement’ tab, and select Output Current, Ch 01(A).
4
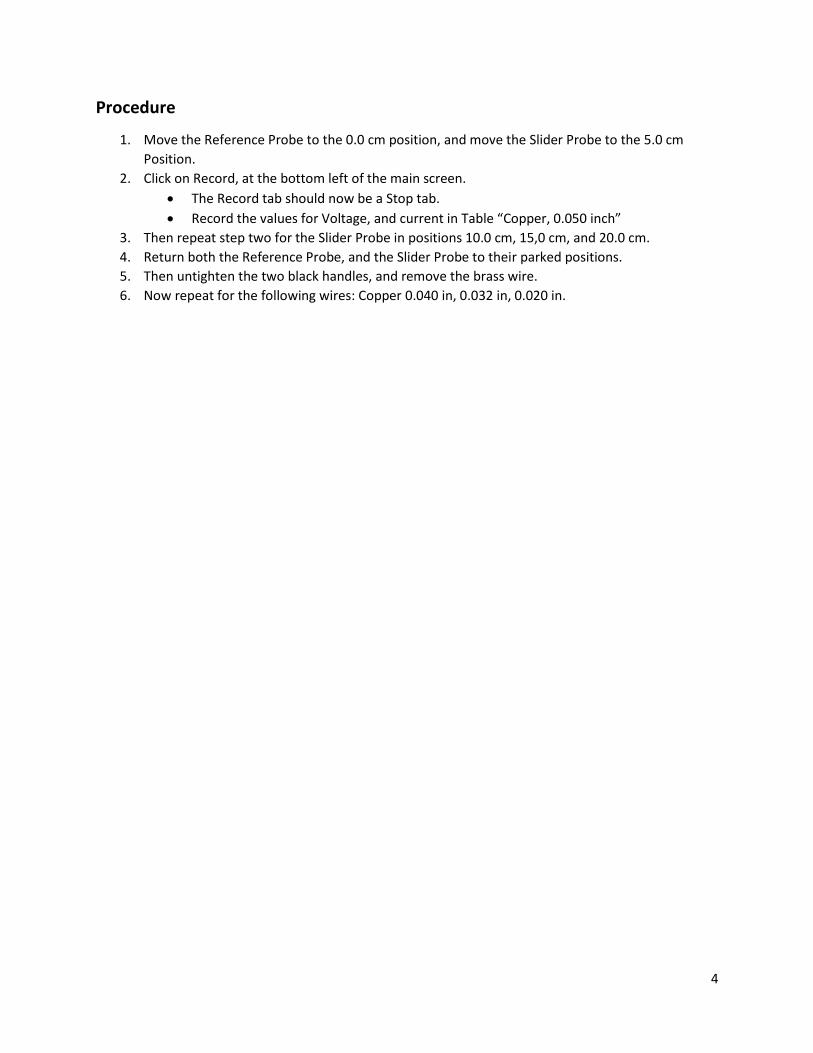
Procedure
1. Move the Reference Probe to the 0.0 cm position, and move the Slider Probe to the 5.0 cm
Position.
2. Click on Record, at the bottom left of the main screen.
The Record tab should now be a Stop tab.
Record the values for Voltage, and current in Table “Copper, 0.050 inch”
3. Then repeat step two for the Slider Probe in positions 10.0 cm, 15,0 cm, and 20.0 cm.
4. Return both the Reference Probe, and the Slider Probe to their parked positions.
5. Then untighten the two black handles, and remove the brass wire.
6. Now repeat for the following wires: Copper 0.040 in, 0.032 in, 0.020 in.
5
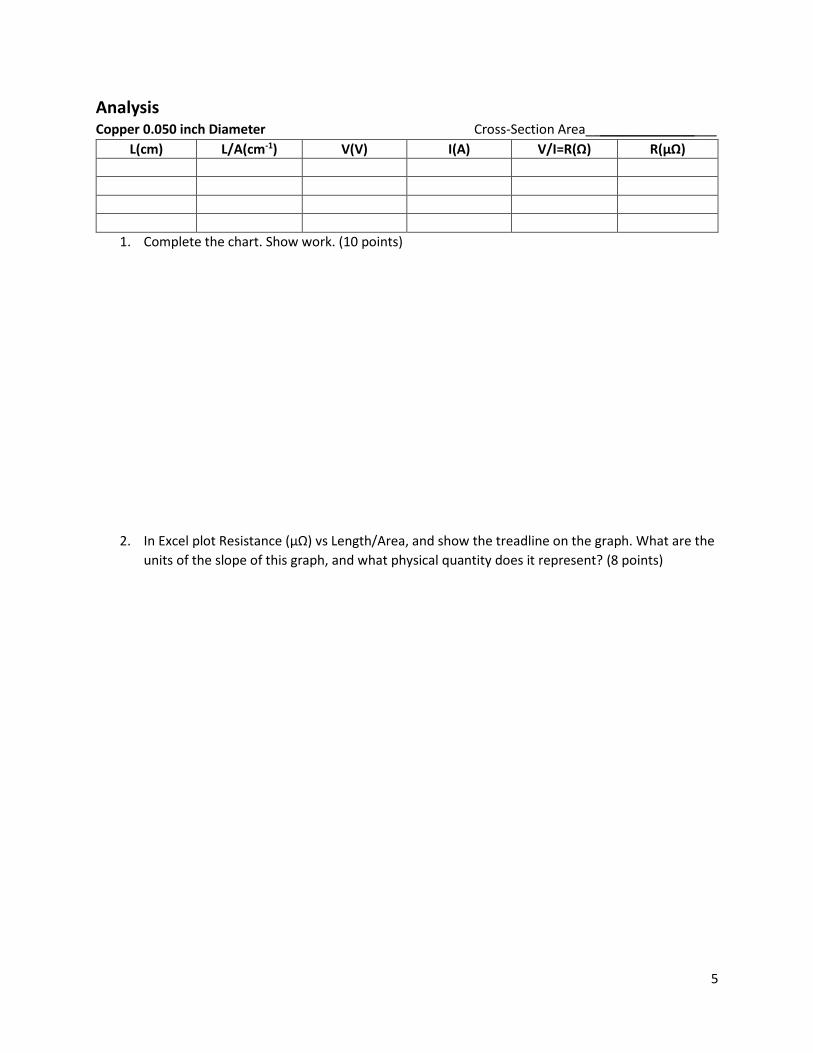
Analysis
Copper 0.050 inch Diameter Cross-Section Area__________________
L(cm) L/A(cm-1) V(V) I(A) V/I=R(Ω) R(µΩ)
1. Complete the chart. Show work. (10 points)
2. In Excel plot Resistance (µΩ) vs Length/Area, and show the treadline on the graph. What are the
units of the slope of this graph, and what physical quantity does it represent? (8 points)
6
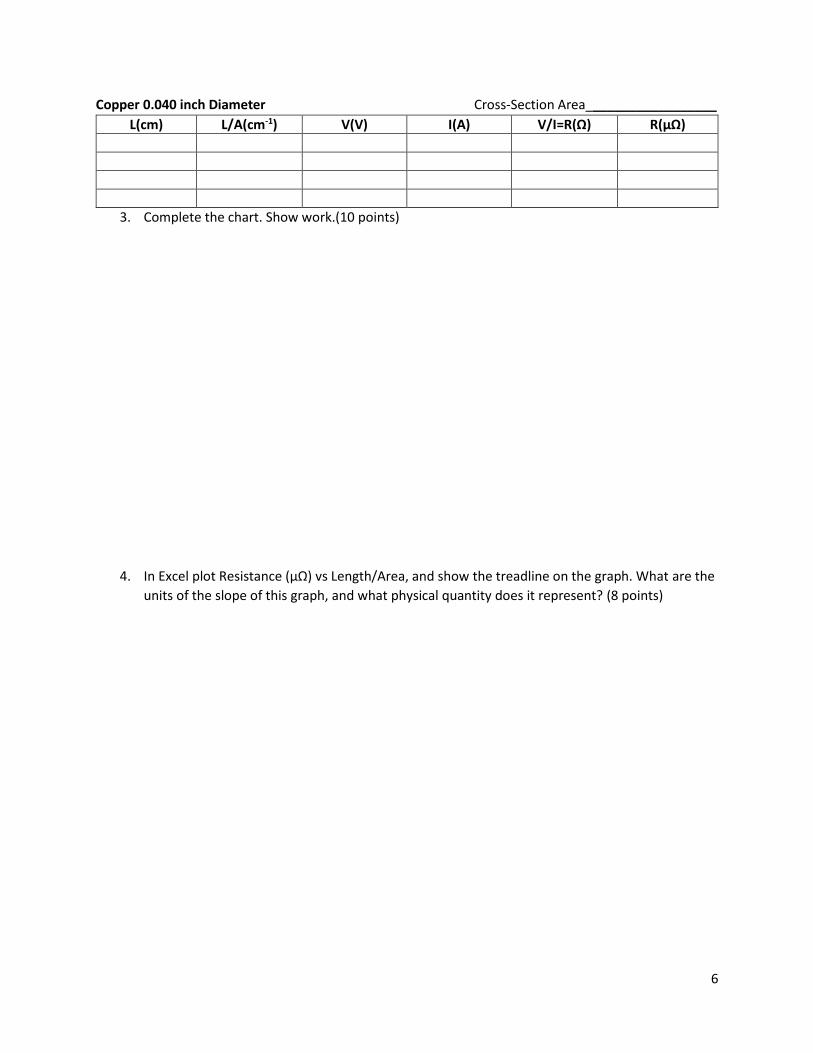
Copper 0.040 inch Diameter Cross-Section Area__________________
L(cm) L/A(cm-1) V(V) I(A) V/I=R(Ω) R(µΩ)
3. Complete the chart. Show work.(10 points)
4. In Excel plot Resistance (µΩ) vs Length/Area, and show the treadline on the graph. What are the
units of the slope of this graph, and what physical quantity does it represent? (8 points)

7
Copper 0.032 inch Diameter Cross-Section Area__________________
L(cm) L/A(cm-1) V(V) I(A) V/I=R(Ω) R(µΩ)
5. Complete the chart. Show work. (10 points)
6. In Excel plot Resistance (µΩ) vs Length/Area, and show the treadline on the graph. What are the
units of the slope of this graph, and what physical quantity does it represent? (8 points)
8
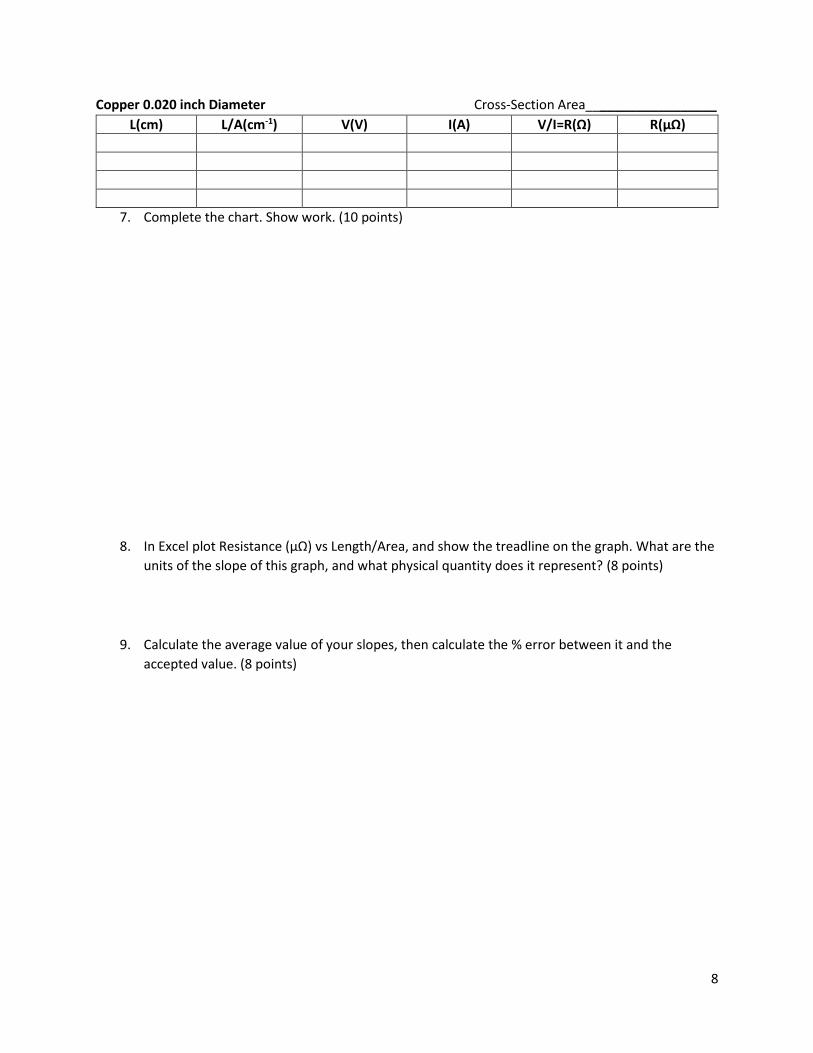
Copper 0.020 inch Diameter Cross-Section Area__________________
L(cm) L/A(cm-1) V(V) I(A) V/I=R(Ω) R(µΩ)
7. Complete the chart. Show work. (10 points)
8. In Excel plot Resistance (µΩ) vs Length/Area, and show the treadline on the graph. What are the
units of the slope of this graph, and what physical quantity does it represent? (8 points)
9. Calculate the average value of your slopes, then calculate the % error between it and the
accepted value. (8 points)