RECOMMENDATION ITU-R P.837-6 - Characteristics of ... · Characteristics of precipitation for...
14
Recommendation ITU-R P.837-6 (02/2012) Characteristics of precipitation for propagation modelling P Series Radiowave propagation
Transcript of RECOMMENDATION ITU-R P.837-6 - Characteristics of ... · Characteristics of precipitation for...
Recommendation ITU-R P.837-6(02/2012)
Characteristics of precipitationfor propagation modelling
P SeriesRadiowave propagation
ii Rec. ITU-R P.837-6
Foreword
The role of the Radiocommunication Sector is to ensure the rational, equitable, efficient and economical use of the radio-frequency spectrum by all radiocommunication services, including satellite services, and carry out studies without limit of frequency range on the basis of which Recommendations are adopted.
The regulatory and policy functions of the Radiocommunication Sector are performed by World and Regional Radiocommunication Conferences and Radiocommunication Assemblies supported by Study Groups.
Policy on Intellectual Property Right (IPR)
ITU-R policy on IPR is described in the Common Patent Policy for ITU-T/ITU-R/ISO/IEC referenced in Annex 1 of Resolution ITU-R 1. Forms to be used for the submission of patent statements and licensing declarations by patent holders are available from http://www.itu.int/ITU-R/go/patents/en where the Guidelines for Implementation of the Common Patent Policy for ITU-T/ITU-R/ISO/IEC and the ITU-R patent information database can also be found.
Series of ITU-R Recommendations
(Also available online at http://www.itu.int/publ/R-REC/en)
Series Title
BO Satellite delivery
BR Recording for production, archival and play-out; film for television
BS Broadcasting service (sound)
BT Broadcasting service (television)
F Fixed service
M Mobile, radiodetermination, amateur and related satellite services
P Radiowave propagation
RA Radio astronomy
RS Remote sensing systems
S Fixed-satellite service
SA Space applications and meteorology
SF Frequency sharing and coordination between fixed-satellite and fixed service systems
SM Spectrum management
SNG Satellite news gathering
TF Time signals and frequency standards emissions
V Vocabulary and related subjects
Note: This ITU-R Recommendation was approved in English under the procedure detailed in Resolution ITU-R 1.
Electronic Publication Geneva, 2013
ITU 2013
All rights reserved. No part of this publication may be reproduced, by any means whatsoever, without written permission of ITU.
Rec. ITU-R P.837-6 1
RECOMMENDATION ITU-R P.837-6
Characteristics of precipitation for propagation modelling
(Question ITU-R 201/3)
(1992-1994-1999-2001-2003-2007-2012)
Scope Recommendation ITU-R P.837 contains maps of meteorological parameters that have been obtained using the European Centre for Medium-Range Weather Forecast (ECMWF) ERA-40 re-analysis database, which are recommended for the prediction of rainfall rate statistics with a 1-min integration time, when local measurements are missing. Rainfall rate statistics with a 1-min integration time are required for the prediction of rain attenuation in terrestrial and satellite links. Data of long-term measurements of rainfall rate may be available from local sources, but only with higher integration times. This Recommendation provides a method for the conversion of rainfall rate statistics with a higher integration time to rainfall rate statistics with a 1-min integration time.
The ITU Radiocommunication Assembly,
considering
a) that information on the statistics of precipitation intensity is needed for the prediction of attenuation and scattering caused by precipitation;
b) that the information is needed for all locations on the globe and a wide range of probabilities;
c) that rainfall rate statistics with a 1-min integration time are required for the prediction of rain attenuation and scattering in terrestrial and satellite links;
d) that long-term measurements of rainfall rate may be available from local sources with a 1-min integration time and also, with integration times of longer than 1-min,
e) that using a model to convert local measurements with integration times up to 1 hour has been observed to provide higher accuracy than the use of the global digital maps in Annex 1 of this Recommendation,
recommends
1 that the model in Annex 1 should be used to obtain the rainfall rate, Rp, exceeded for any given percentage of the average year, p, and for any location (with an integration time of 1 min). This model is to be applied to the data supplied in the digital files ESARAIN_xxx_v5.TXT (the data files may be obtained from that part of the ITU-R website dealing with Radiocommunication Study Group 3);
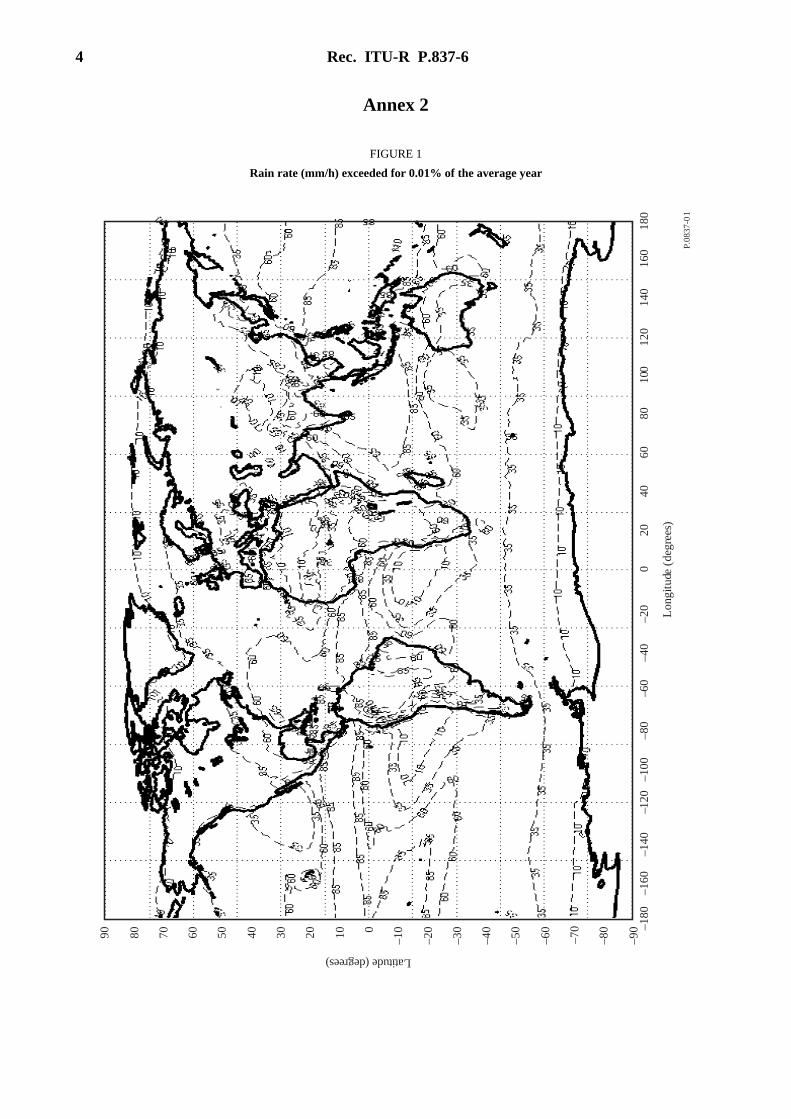
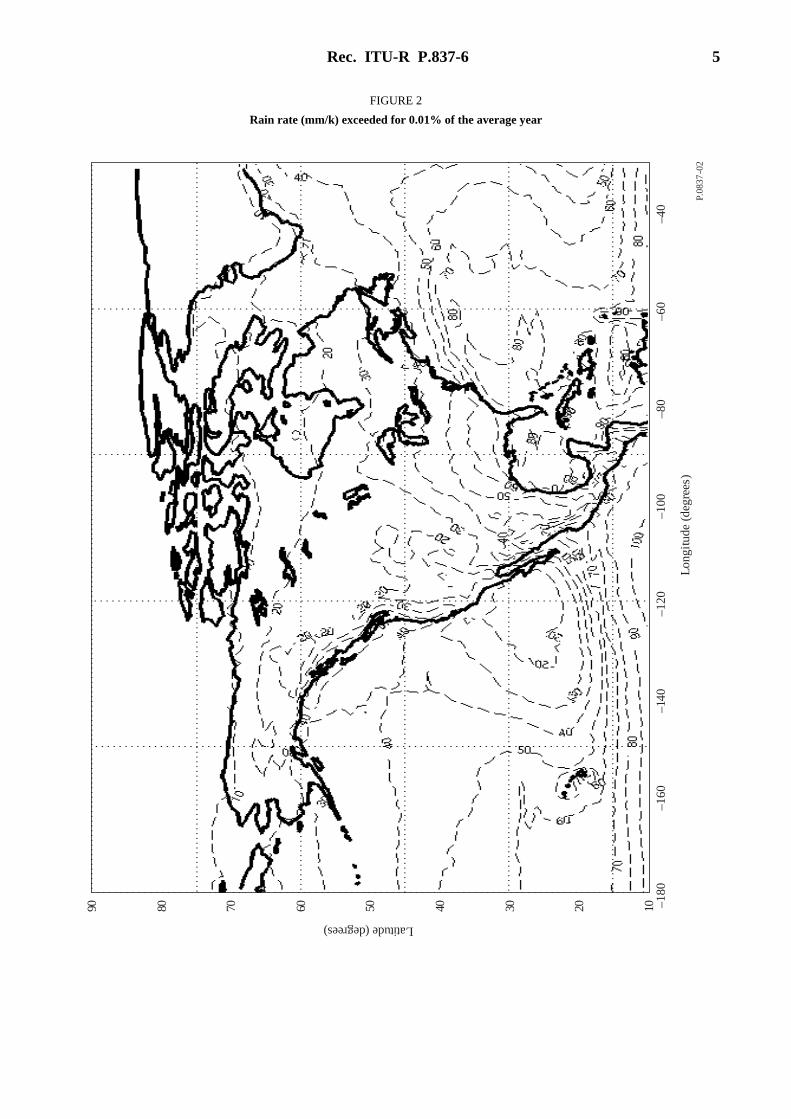
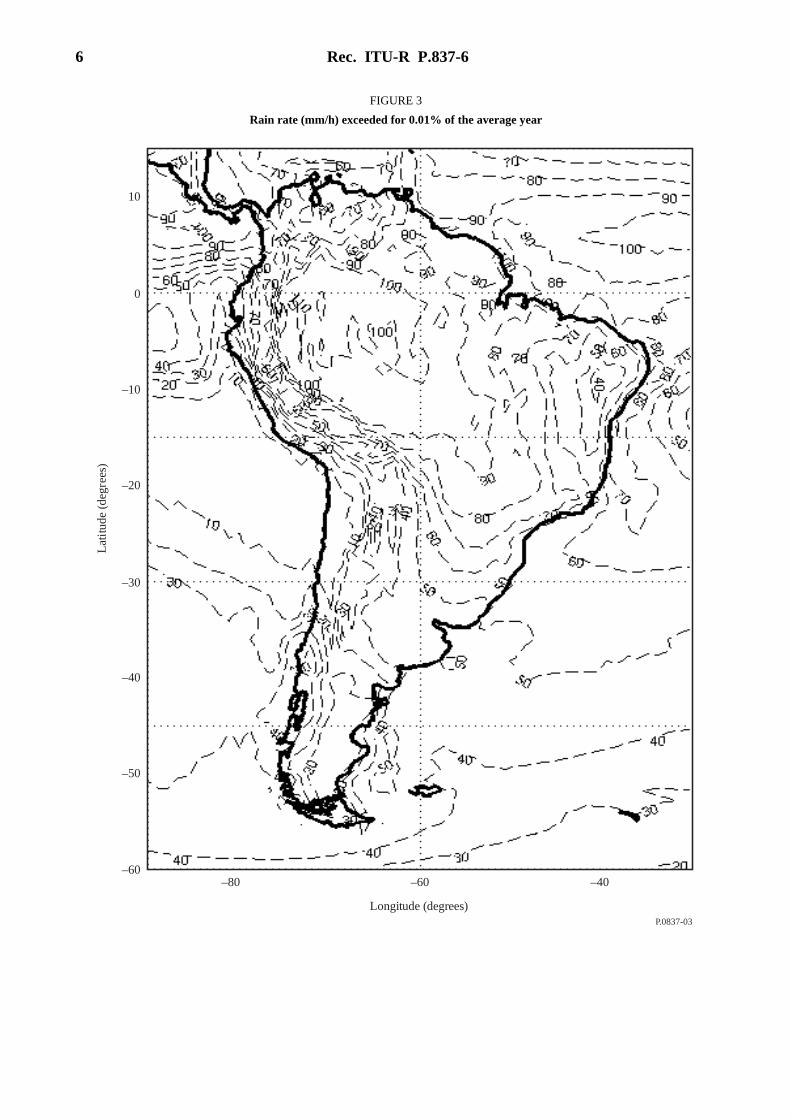
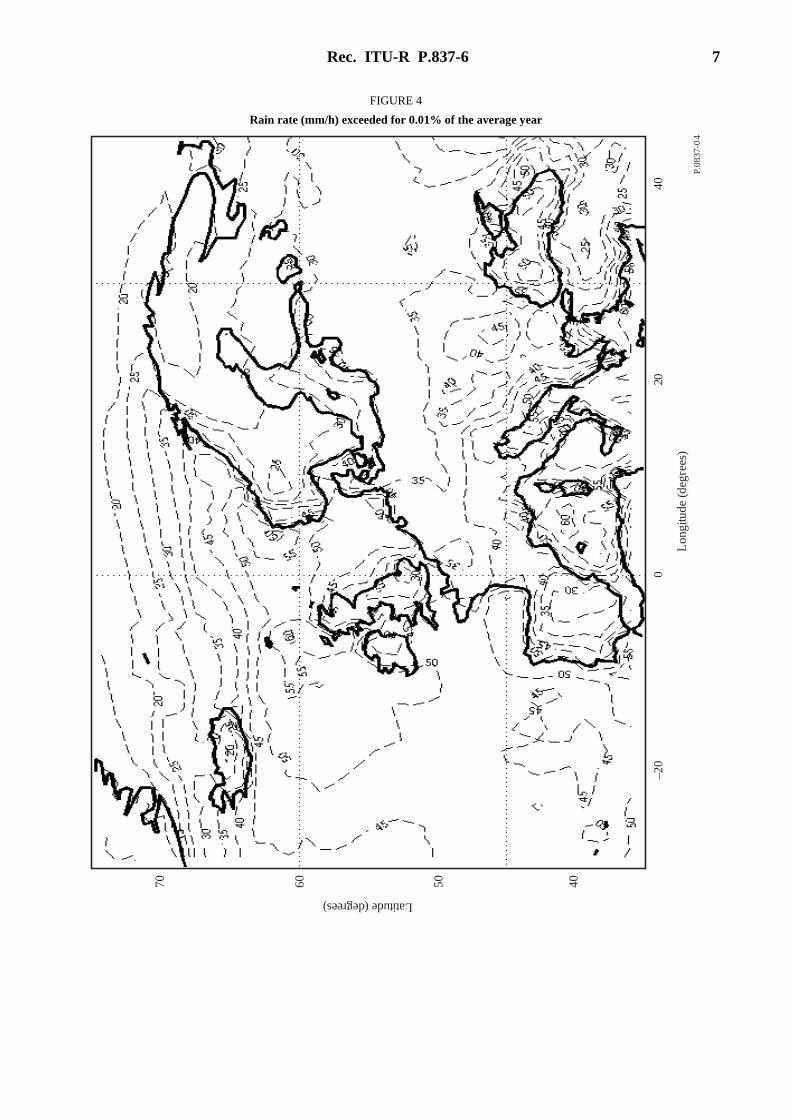
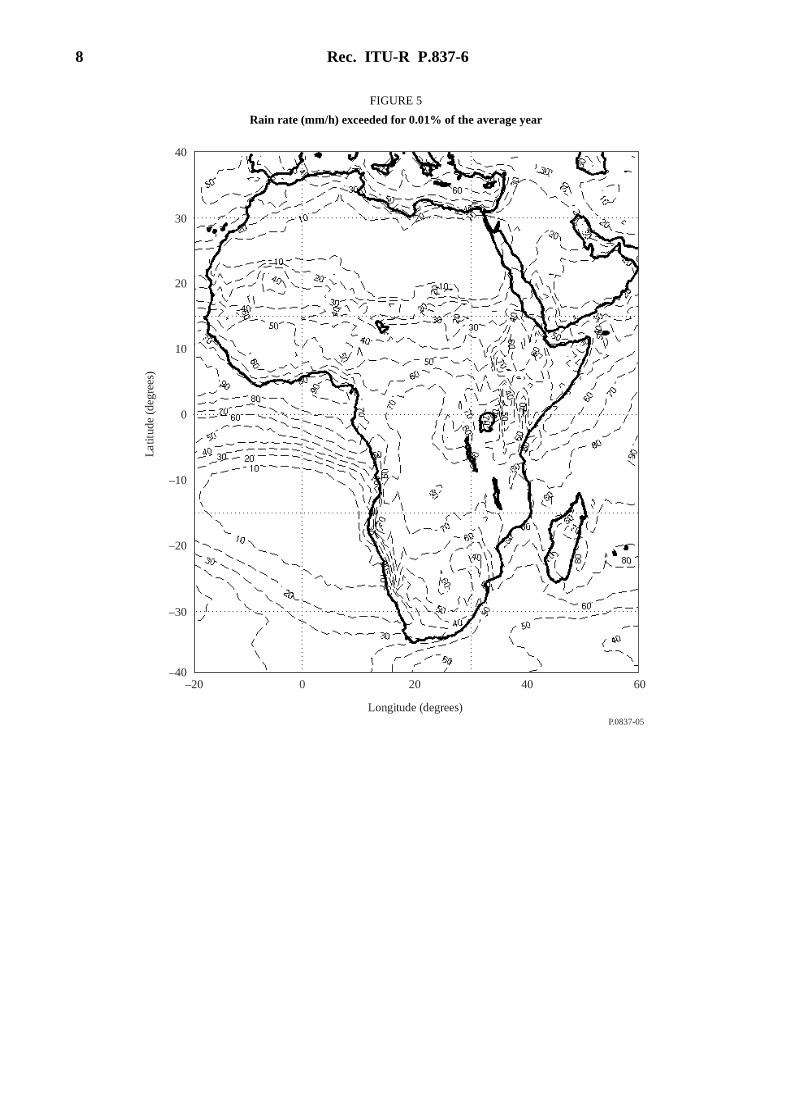
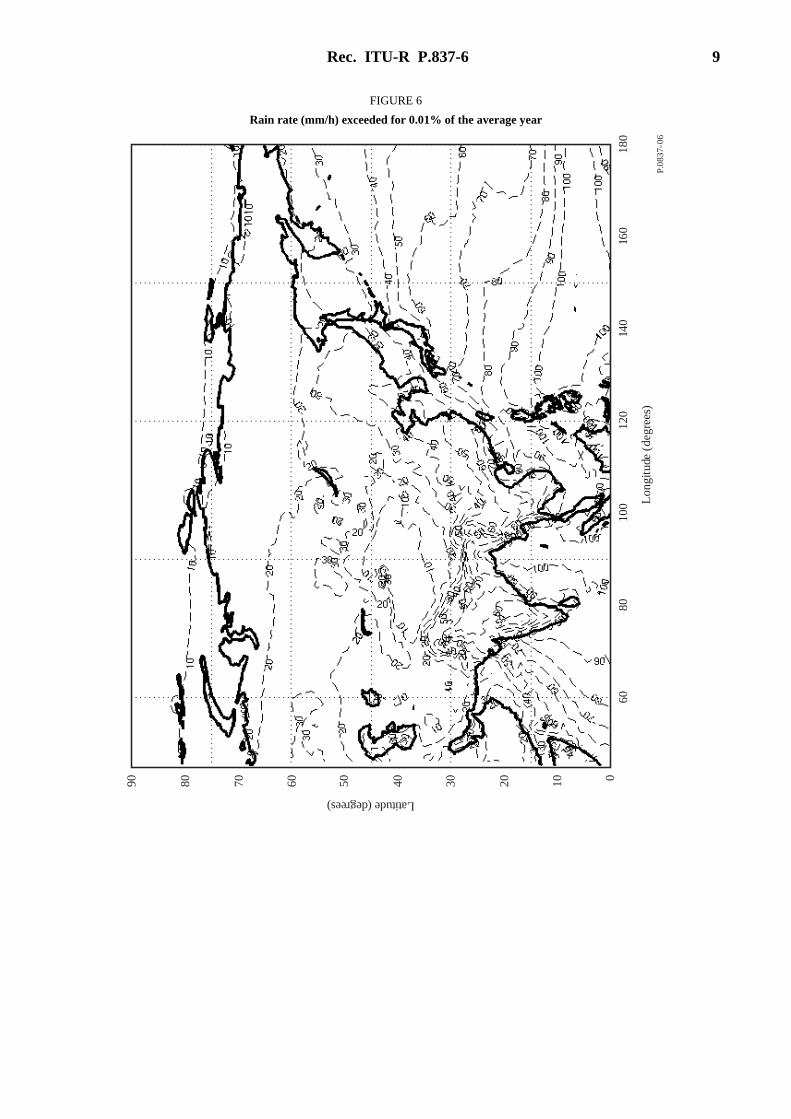
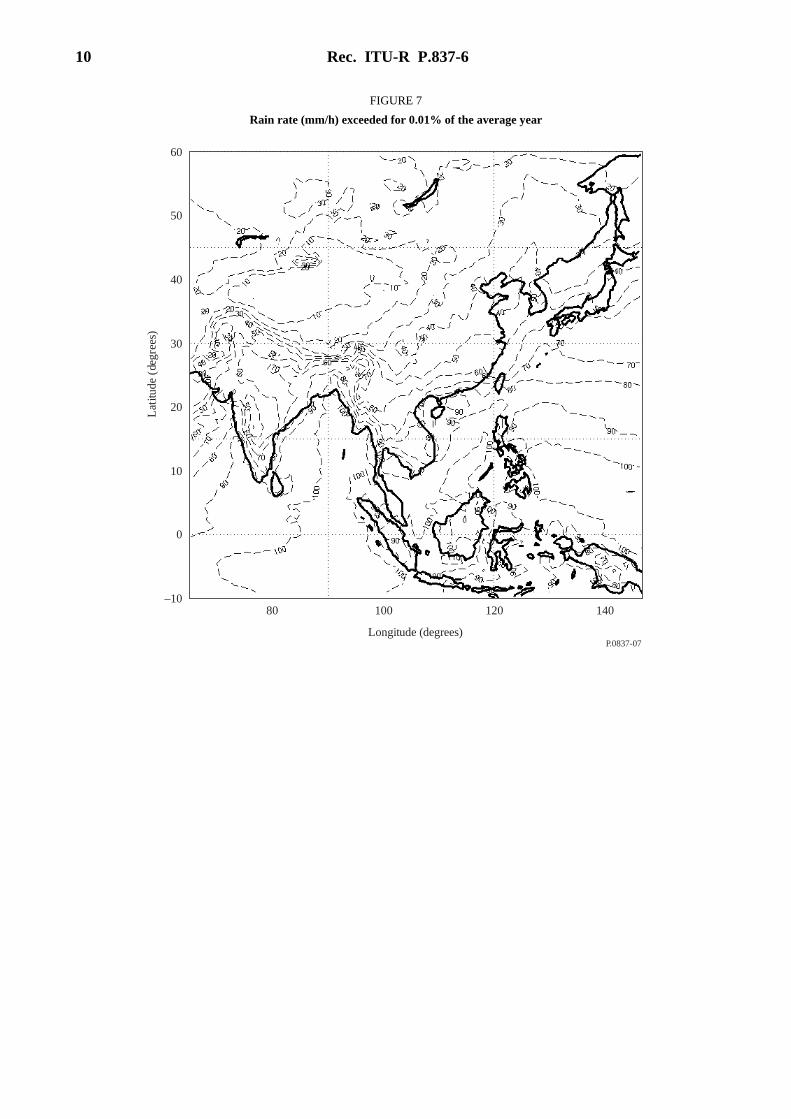
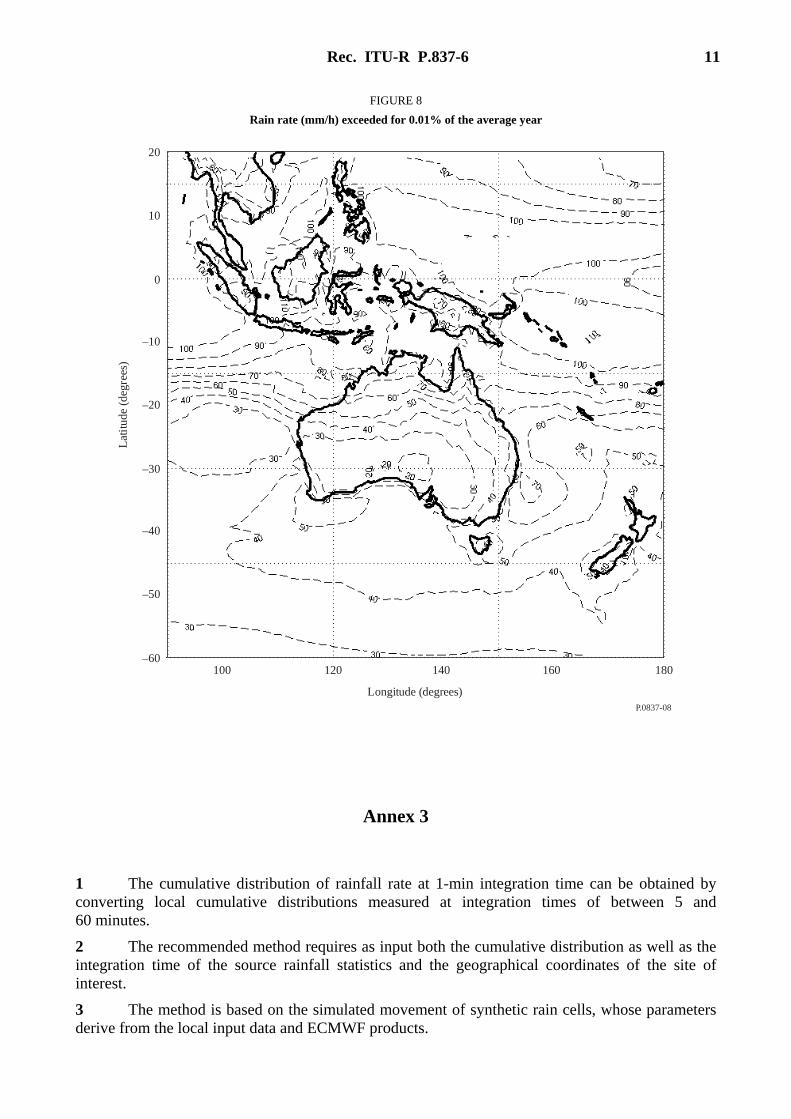
2 that, for easy reference, Figs 1 to 6 in Annex 2 should be used to select the rainfall rate exceeded for 0.01% of the average year. These figures were also derived from the model and data described in Annex 1;
3 that local long-term measurements of rainfall rate with a 1-min integration time should be used if available;
2 Rec. ITU-R P.837-6
4 that long-term measurements of rainfall rate with longer integration times should be used if available and the model in Annex 3 be used to convert to rainfall rate with a 1-min integration time;
5 that local measurements, if used, are collected over a sufficient period (typically longer than 3 years), to ensure statistical stability.
Annex 1
Model to derive the rainfall rate exceeded for a given probability of the average year and a given location
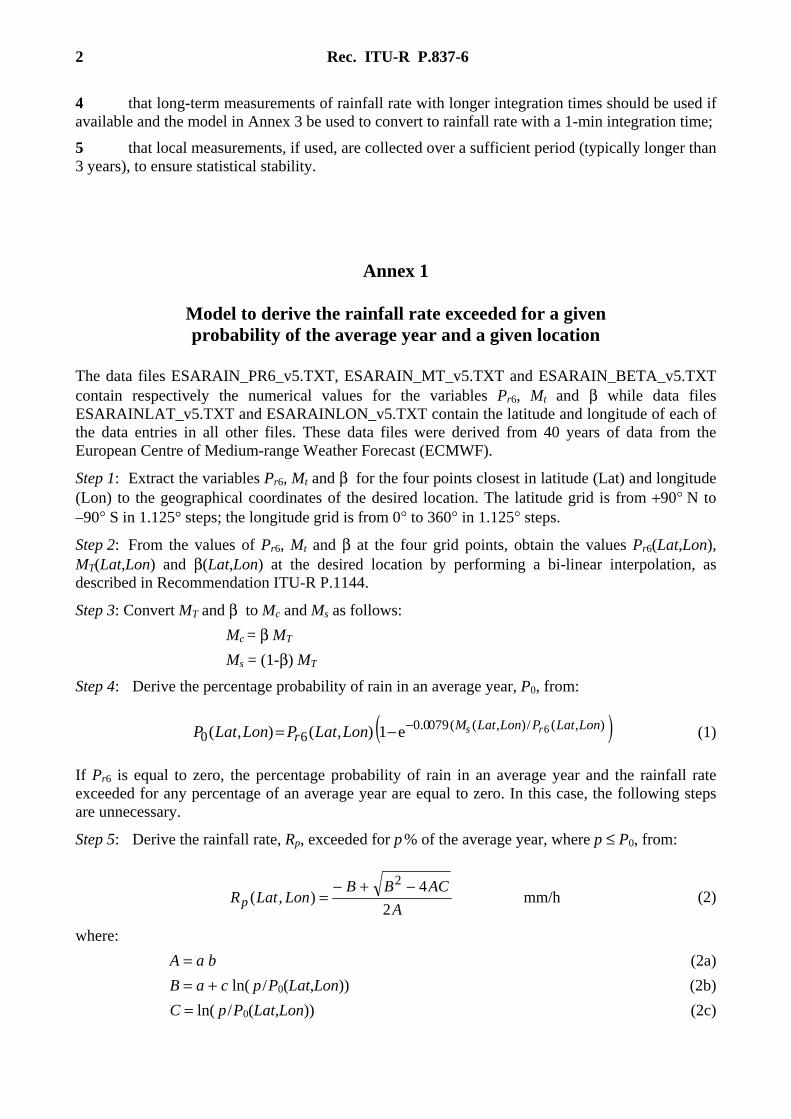
The data files ESARAIN_PR6_v5.TXT, ESARAIN_MT_v5.TXT and ESARAIN_BETA_v5.TXT contain respectively the numerical values for the variables Pr6, Mt and β while data files ESARAINLAT_v5.TXT and ESARAINLON_v5.TXT contain the latitude and longitude of each of the data entries in all other files. These data files were derived from 40 years of data from the European Centre of Medium-range Weather Forecast (ECMWF).
Step 1: Extract the variables Pr6, Mt and β for the four points closest in latitude (Lat) and longitude (Lon) to the geographical coordinates of the desired location. The latitude grid is from +90° N to –90° S in 1.125° steps; the longitude grid is from 0° to 360° in 1.125° steps.
Step 2: From the values of Pr6, Mt and β at the four grid points, obtain the values Pr6(Lat,Lon), MT(Lat,Lon) and β(Lat,Lon) at the desired location by performing a bi-linear interpolation, as described in Recommendation ITU-R P.1144.
Step 3: Convert MT and β to Mc and Ms as follows:
Mc = β MT
Ms = (1-β) MT
Step 4: Derive the percentage probability of rain in an average year, P0, from:
( )),(/),((0790.060
6e1),(),( LonLatPLonLatMr
rsLonLatPLonLatP −−= (1)
If Pr6 is equal to zero, the percentage probability of rain in an average year and the rainfall rate exceeded for any percentage of an average year are equal to zero. In this case, the following steps are unnecessary.
Step 5: Derive the rainfall rate, Rp, exceeded for p % of the average year, where p ≤ P0, from:
mm/h2
4),(
2
A
ACBBLonLatRp
−+−= (2)
where:
A = a b (2a)
B = a + c ln( p / P0(Lat,Lon)) (2b)
C = ln( p / P0(Lat,Lon)) (2c)
Rec. ITU-R P.837-6 3
and
a = 1.09 (2d)
b = 021797
)),(),((
P
LonLatMLonLatM sc + (2e)
c = 26.02b (2f)
NOTE 1 – An implementation of this model and the associated data in MATLAB is also available from the ITU-R website dealing with Radiocommunication Study Group 3.
4 Rec. ITU-R P.837-6
Annex 2
FIGURE 1
Rain rate (mm/h) exceeded for 0.01% of the average year
P.08
37-0
1
90 60
–180
–120
Lon
gitu
de (
degr
ees)
Latitude (degrees)
80 70 3050 40 020 10 –30
–10
–20
–60
–40
–50
–90
–70
–80
–160
–140
–60
–100
–80
0–4
0–2
020
4060
8010
012
014
016
018
0
Rec. ITU-R P.837-6 5
FIGURE 2
Rain rate (mm/k) exceeded for 0.01% of the average year
P.08
37-0
2
90 80 70 60 –180
Lon
gitu
de (
degr
ees)
Latitude (degrees)
50 40 30 20 10–1
60–1
40–1
20–1
00–8
0–6
0–4
0
6 Rec. ITU-R P.837-6
FIGURE 3
Rain rate (mm/h) exceeded for 0.01% of the average year
P.0837-03
0
–10
–20
–30
–80 –60 –40
Longitude (degrees)
Lat
itud
e (d
egre
es)
–40
–50
–60
10
Rec. ITU-R P.837-6 7
FIGURE 4
Rain rate (mm/h) exceeded for 0.01% of the average year
P.08
37-0
4
70 60 50
–20
020
40
Lon
gitu
de (
degr
ees)
Latitude (degrees)
40
8 Rec. ITU-R P.837-6
FIGURE 5
Rain rate (mm/h) exceeded for 0.01% of the average year
P.0837-05
0
–40–20 0 40
Lat
itud
e (d
egre
es)
Longitude (degrees)
6020
–30
–20
–10
10
20
30
40
Rec. ITU-R P.837-6 9
FIGURE 6
Rain rate (mm/h) exceeded for 0.01% of the average year
P.08
37-0
6
060
Latitude (degrees)
Lon
gitu
de (
degr
ees)
120
8010
014
016
018
0
10204050 3060708090
10 Rec. ITU-R P.837-6
FIGURE 7
Rain rate (mm/h) exceeded for 0.01% of the average year
P.0837-07
120
Longitude (degrees)
Lat
itude
(de
gree
s)
30
80 100 140
60
0
50
40
20
10
–10
Rec. ITU-R P.837-6 11
FIGURE 8
Rain rate (mm/h) exceeded for 0.01% of the average year
P.0837-08
120
Longitude (degrees)
Lat
itud
e (d
egre
es)
–30
140 180
–20
–60
–50
–40
0
10
–10
20
160100
Annex 3
1 The cumulative distribution of rainfall rate at 1-min integration time can be obtained by converting local cumulative distributions measured at integration times of between 5 and 60 minutes.
2 The recommended method requires as input both the cumulative distribution as well as the integration time of the source rainfall statistics and the geographical coordinates of the site of interest.
3 The method is based on the simulated movement of synthetic rain cells, whose parameters derive from the local input data and ECMWF products.

12 Rec. ITU-R P.837-6
4 The recommended method is incorporated in a computer program available from the ITU-R website dealing with Radiocommunication Study Group 3. The name of the software package implementing this part of the recommendation is CONVRRSTAT_ANNEX3_P837-6.ZIP.