Stable Isotope (δ18O and δ H) Data for Precipitation ... · Stable Isotope (δ18O and δ2H) Data...
35
Stable Isotope (δ 18 O and δ 2 H) Data for Precipitation, Stream Water, and Groundwater in Puerto Rico By Martha A. Scholl, Angel Torres-Sanchez, and Manuel Rosario-Torres Open-File Report 2014–1101 U.S. Department of the Interior U.S. Geological Survey
Transcript of Stable Isotope (δ18O and δ H) Data for Precipitation ... · Stable Isotope (δ18O and δ2H) Data...
Stable Isotope (δ18O and δ2H) Data for Precipitation, Stream Water, and Groundwater in Puerto Rico
By Martha A. Scholl, Angel Torres-Sanchez, and Manuel Rosario-Torres
Open-File Report 2014–1101
U.S. Department of the Interior U.S. Geological Survey
U.S. Department of the Interior SALLY JEWELL, Secretary
U.S. Geological Survey Suzette M. Kimball, Acting Director
U.S. Geological Survey, Reston, Virginia: 2014
For more information on the USGS—the Federal source for science about the Earth, its natural and living resources, natural hazards, and the environment—visit http://www.usgs.gov or call 1–888–ASK–USGS (1–888–275–8747)
For an overview of USGS information products, including maps, imagery, and publications, visit http://www.usgs.gov/pubprod
To order this and other USGS information products, visit http://store.usgs.gov
Any use of trade, firm, or product names is for descriptive purposes only and does not imply endorsement by the U.S. Government.
Although this information product, for the most part, is in the public domain, it also may contain copyrighted materials as noted in the text. Permission to reproduce copyrighted items must be secured from the copyright owner.
Suggested citation: Scholl, M.A., Torres-Sanchez, A., and Rosario-Torres, M., 2014, Stable isotope (δ18O and δ2H) data for precipitation, stream water, and groundwater in Puerto Rico: U.S. Geological Survey Open-File Report 2014–1101, 29 p., http://dx.doi.org/10.3133/ofr20141101.
ISSN 2331 1258 (online)
iii
Contents Introduction ................................................................................................................................................................. 1
Description of Study Area ....................................................................................................................................... 1 Purpose and Scope ................................................................................................................................................. 3
Methods ...................................................................................................................................................................... 3 Field Sample Collection .......................................................................................................................................... 3
Monthly Rain-Water Isotope Samples ................................................................................................................. 3 Cloud-Water Isotope Samples ............................................................................................................................. 4 Stream-Water Isotope Samples .......................................................................................................................... 4 Groundwater Isotope Samples ............................................................................................................................ 4
Laboratory Analysis Methods .................................................................................................................................. 6 Stable Isotope Data .................................................................................................................................................... 7
Monthly Rain-Water Isotope Data ........................................................................................................................... 7 Cloud-Water Isotope Data ..................................................................................................................................... 18 Stream-Water Isotope Data .................................................................................................................................. 18 Groundwater Isotope Data .................................................................................................................................... 26
Acknowledgments ..................................................................................................................................................... 28 References Cited ...................................................................................................................................................... 28
Figures 1. Map of the Luquillo Mountains and San Agustin study areas in Puerto Rico, showing geology, streams,
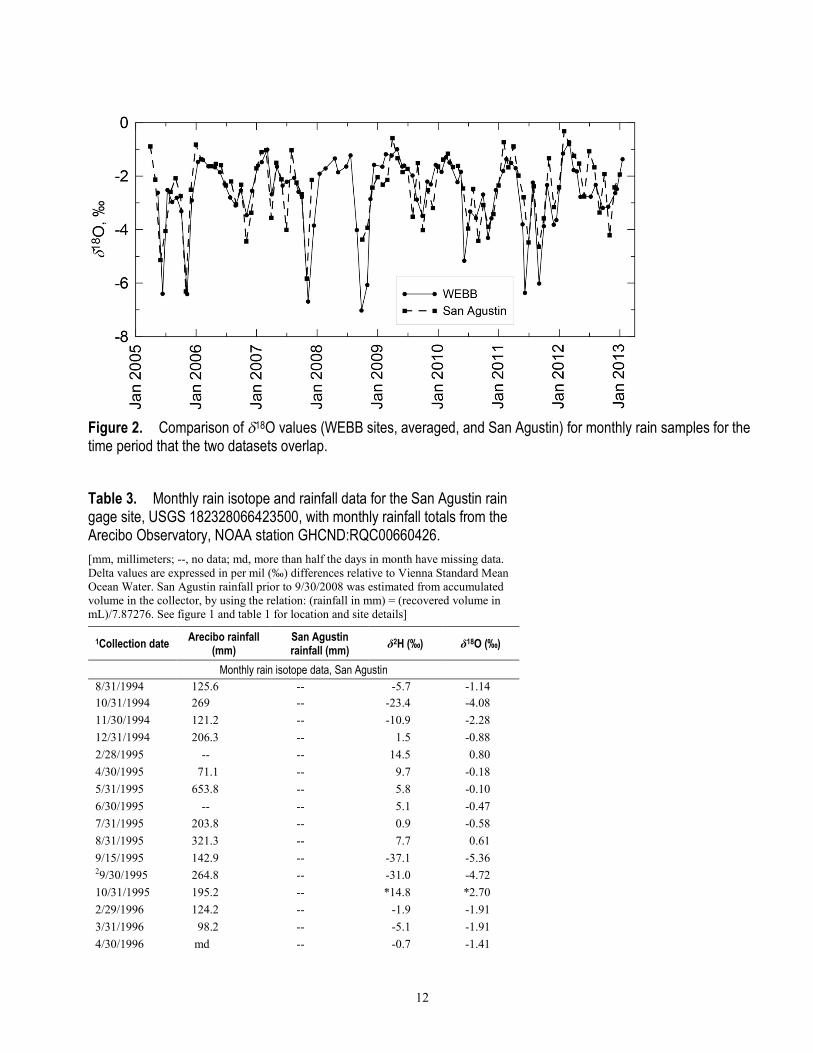
and sample-collection sites ............................................................................................................................ 2 2. Comparison of 18O values (WEBB sites, averaged, and San Agustin) for monthly rain samples for the
time period that the two datasets overlap. ................................................................................................... 12
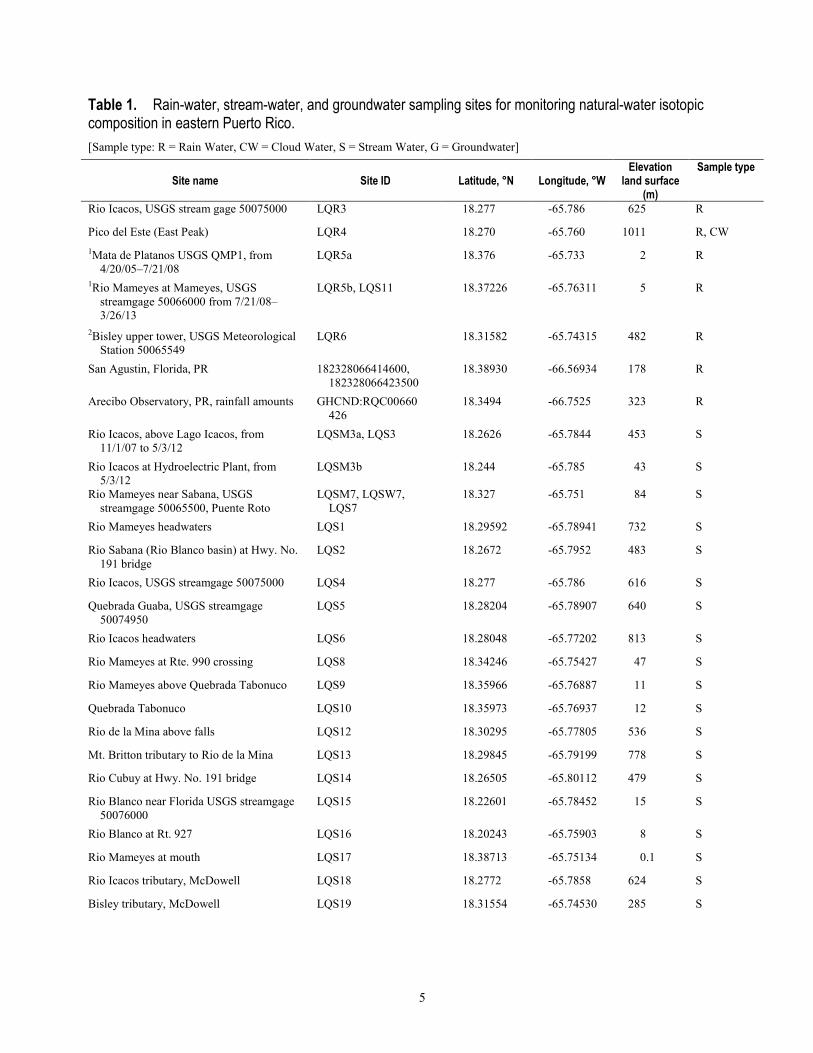
Tables 1. Rain-water, stream-water, and groundwater sampling sites for monitoring natural-water isotopic
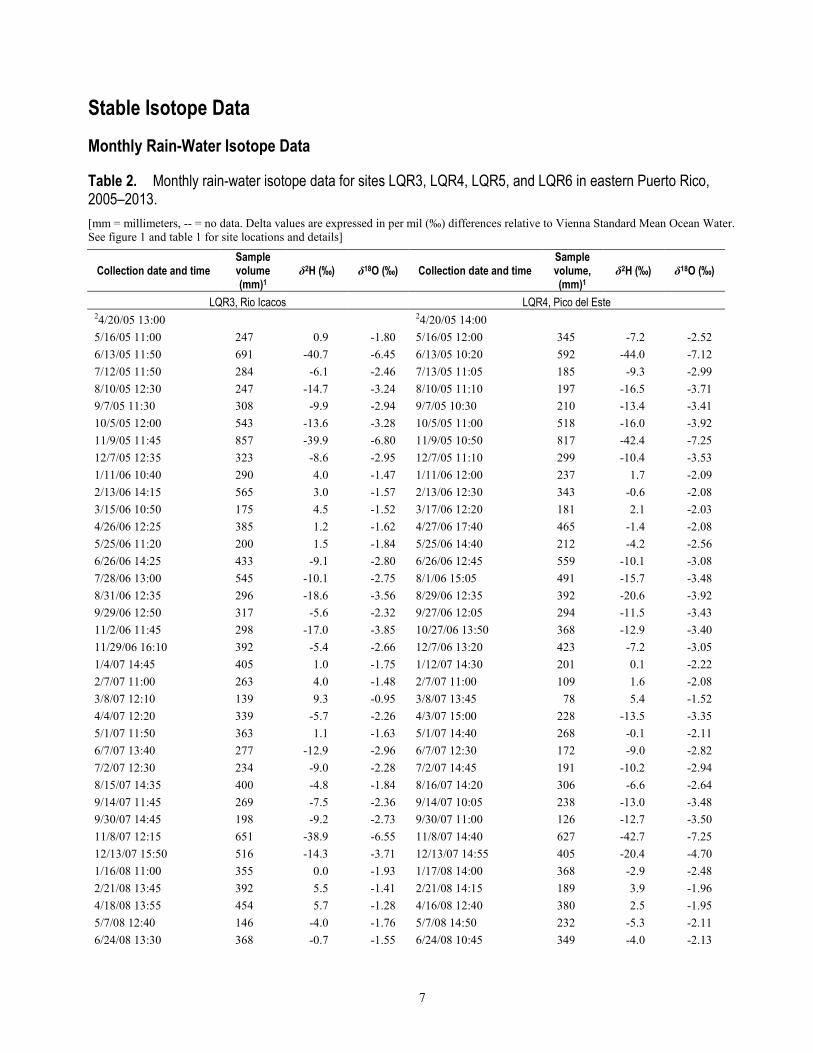
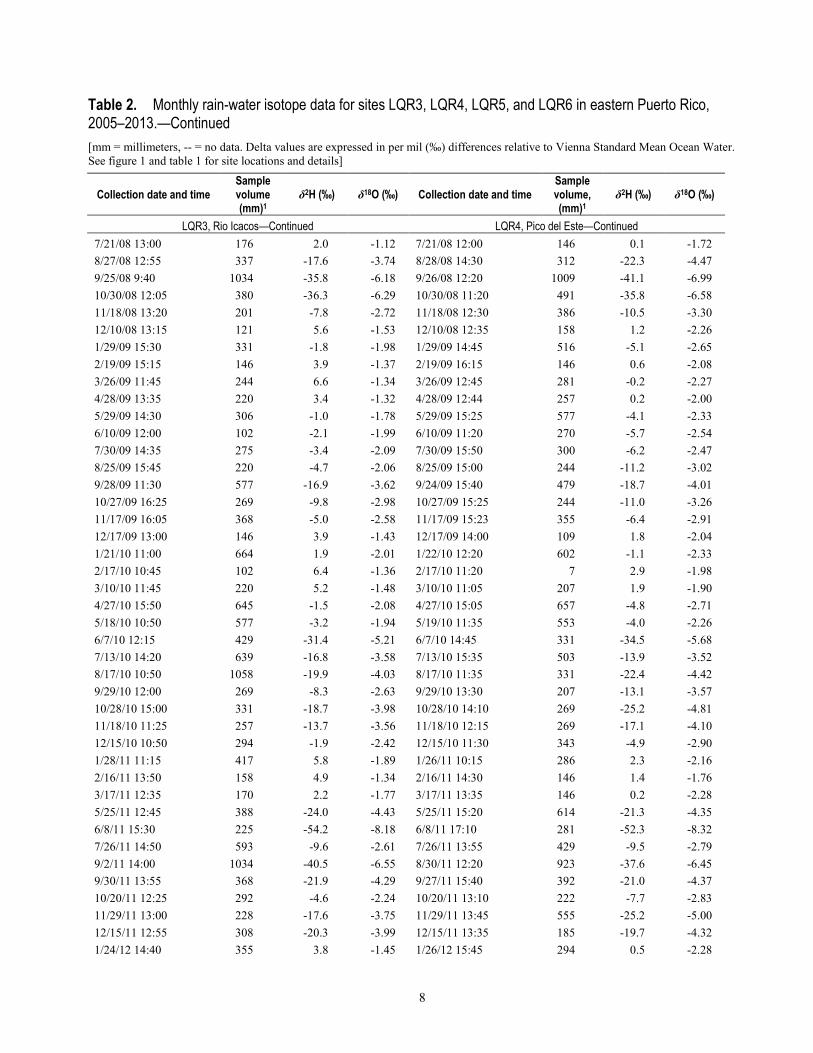
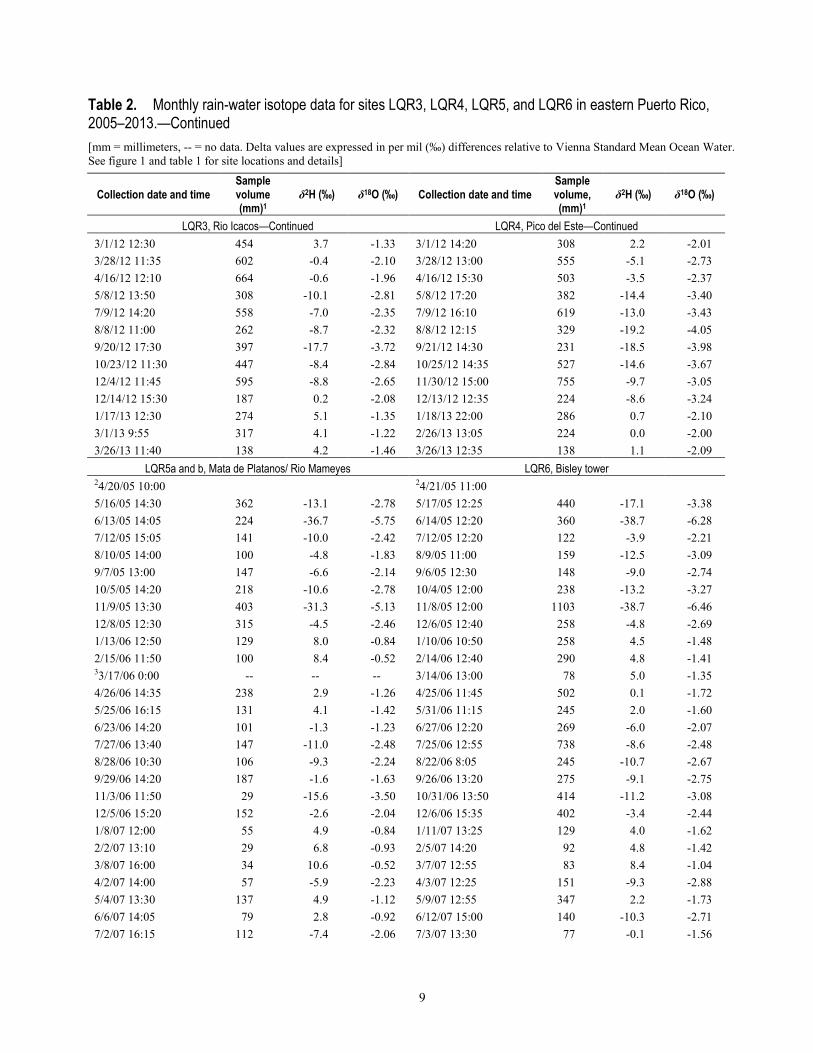
composition in eastern Puerto Rico. .............................................................................................................. 5 2. Monthly rain-water isotope data for sites LQR3, LQR4, LQR5, and LQR6 in eastern Puerto Rico,
2005–2013. .................................................................................................................................................... 7 3. Monthly rain isotope and rainfall data for the San Agustin rain gage site, USGS 182328066423500,
with monthly rainfall totals from the Arecibo Observatory, NOAA station GHCND:RQC00660426. ............. 12 4. Cloud-water isotope data collected at Pico del Este in eastern Puerto Rico in September 2007,
May 2010, and March 2013. ........................................................................................................................ 18 5. Stream-water isotope data for Rio Mameyes near Sabana USGS 50065500 and Rio Icacos above
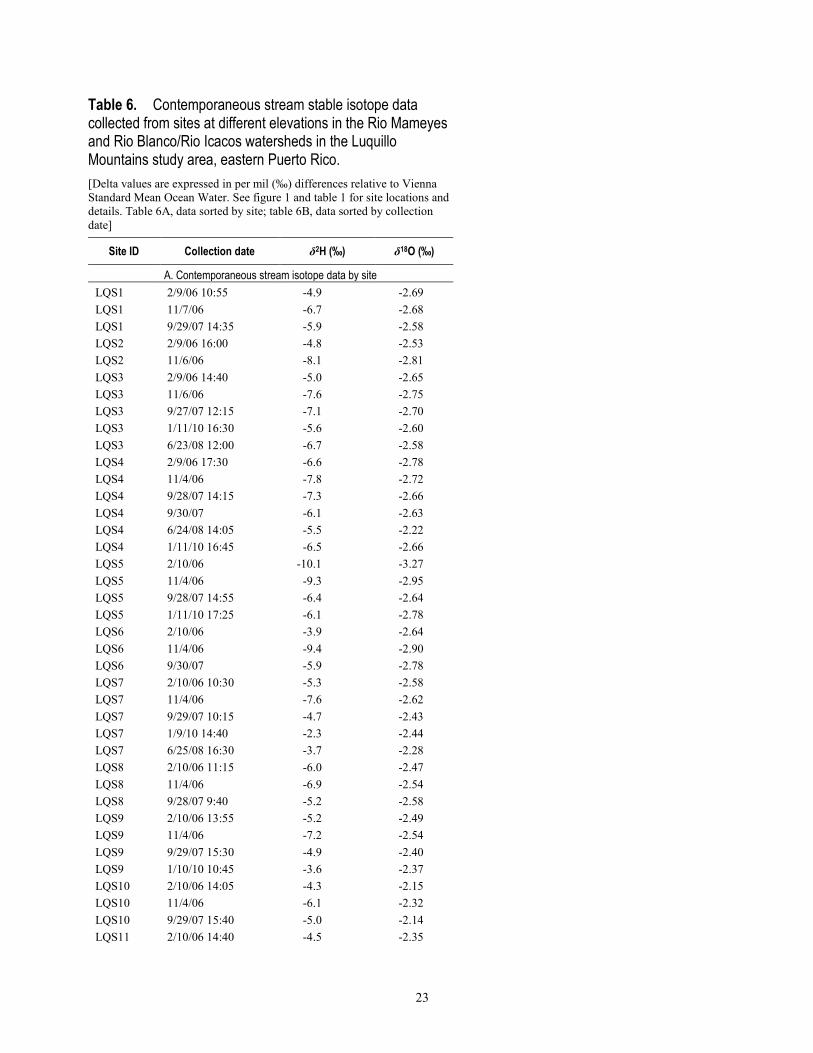
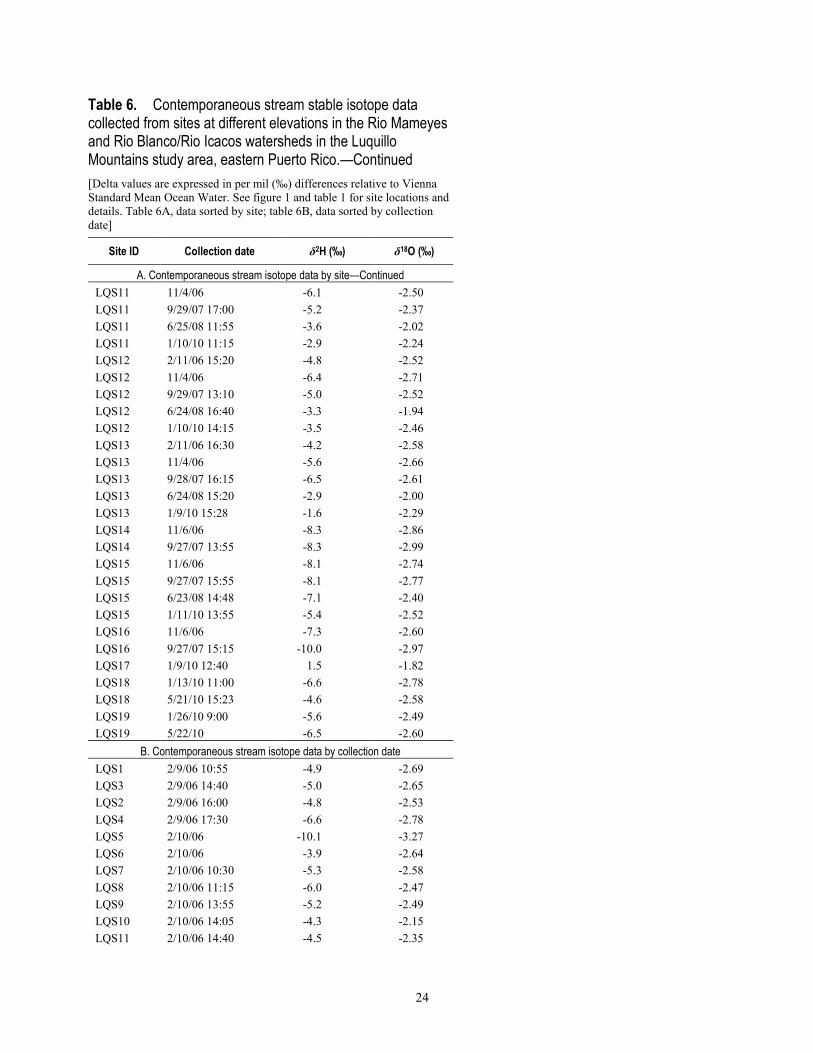
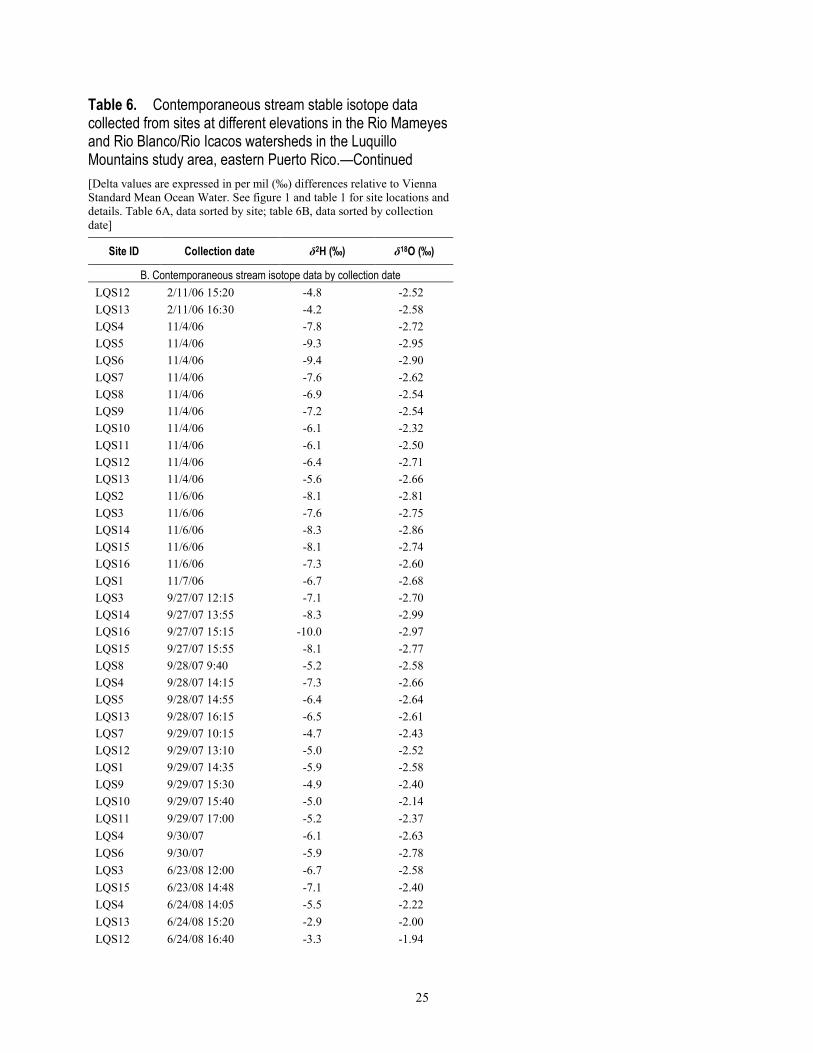
Lago Icacos in eastern Puerto Rico, 2007–2013. ........................................................................................ 18 6. Contemporaneous stream stable isotope data collected from sites at different elevations in the
Rio Mameyes and Rio Blanco/Rio Icacos watersheds in the Luquillo Mountains study area, eastern Puerto Rico. ................................................................................................................................................. 23
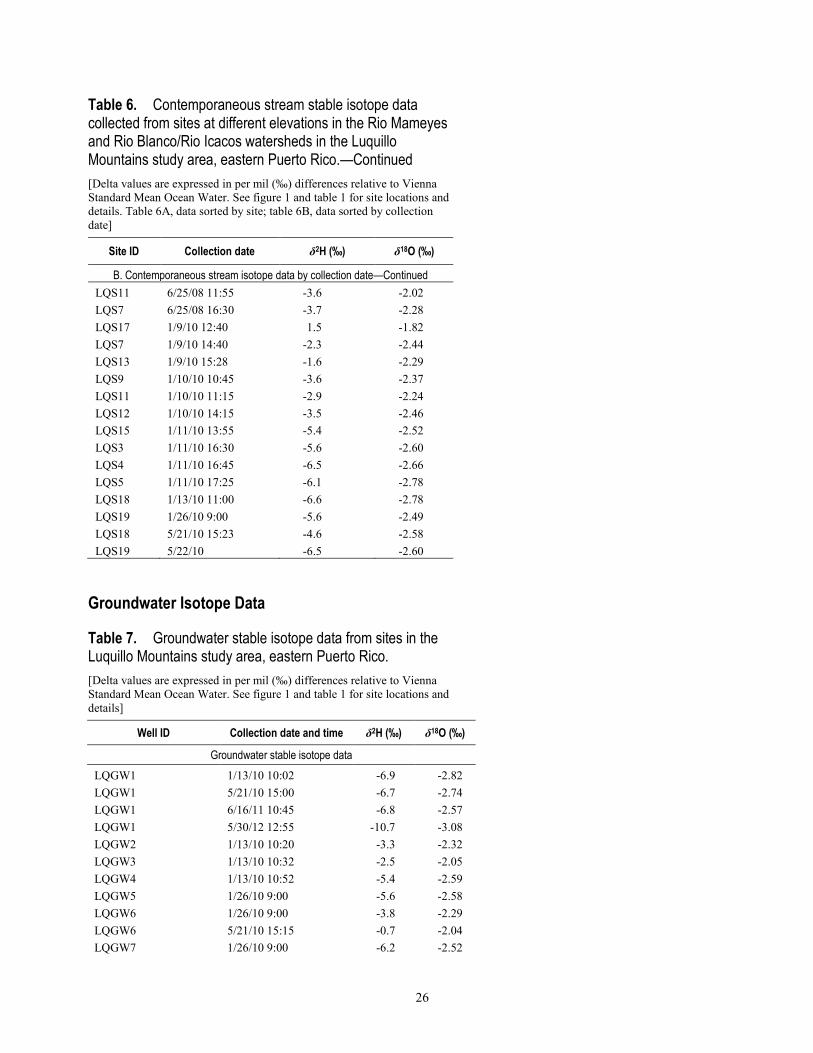
7. Groundwater stable isotope data from sites in the Luquillo Mountains study area, eastern Puerto Rico. .... 26
iv
Conversion Factors SI to Inch/Pound
Multiply By To obtain
Length
centimeter (cm) 0.3937 inch (in.)
millimeter (mm) 0.03937 inch (in.)
meter (m) 3.281 foot (ft)
kilometer (km) 0.6214 mile (mi)
meter (m) 1.094 yard (yd)
Area
square meter (m2) 0.0002471 acre
hectare (ha) 2.471 acre
square kilometer (km2) 247.1 acre
square meter (m2) 10.76 square foot (ft2)
hectare (ha) 0.003861 square mile (mi2)
square kilometer (km2) 0.3861 square mile (mi2)
Volume
liter (L) 0.2642 gallon (gal)
cubic meter (m3) 35.31 cubic foot (ft3)
Flow rate
meter per second (m/s) 3.281 foot per second (ft/s)
millimeter per year (mm/yr) 0.03937 inch per year (in/yr)
Mass
gram (g) 0.03527 ounce, avoirdupois (oz)
kilogram (kg) 2.205 pound avoirdupois (lb)
Pressure
hectopascal (hPa) 1 millibar (mb)
Hydraulic conductivity
meter per day (m/d) 3.281 foot per day (ft/d)
Temperature in degrees Celsius (°C) may be converted to degrees Fahrenheit (°F) as °F = (1.8 × °C) + 32.
Temperature in degrees Fahrenheit (°F) may be converted to degrees Celsius (°C) as °C = (°F – 32) / 1.8.
Datum Vertical coordinate information is referenced to the North American Vertical Datum of 1988 (NAVD 88).
Horizontal coordinate information is referenced to the North American Datum of 1983 (NAD 83)
Altitude, as used in this report, refers to distance above the vertical datum.
v
Supplemental Information Note to USGS users: Use of hectare (ha) as an alternative name for square hectometer (hm2) is restricted to the measurement of small land or water areas. Use of liter (L) as a special name for cubic decimeter (dm3) is restricted to the measurement of liquids and gases. No prefix other than milli should be used with liter. Metric ton (t) as a name for megagram (Mg) should be restricted to commercial usage, and no prefixes should be used with it.
1
Stable Isotope (δ18O and δ2H) Data for Precipitation, Stream Water, and Groundwater in Puerto Rico
By Martha A. Scholl, Angel Torres-Sanchez, and Manuel Rosario-Torres
Introduction Description of Study Area
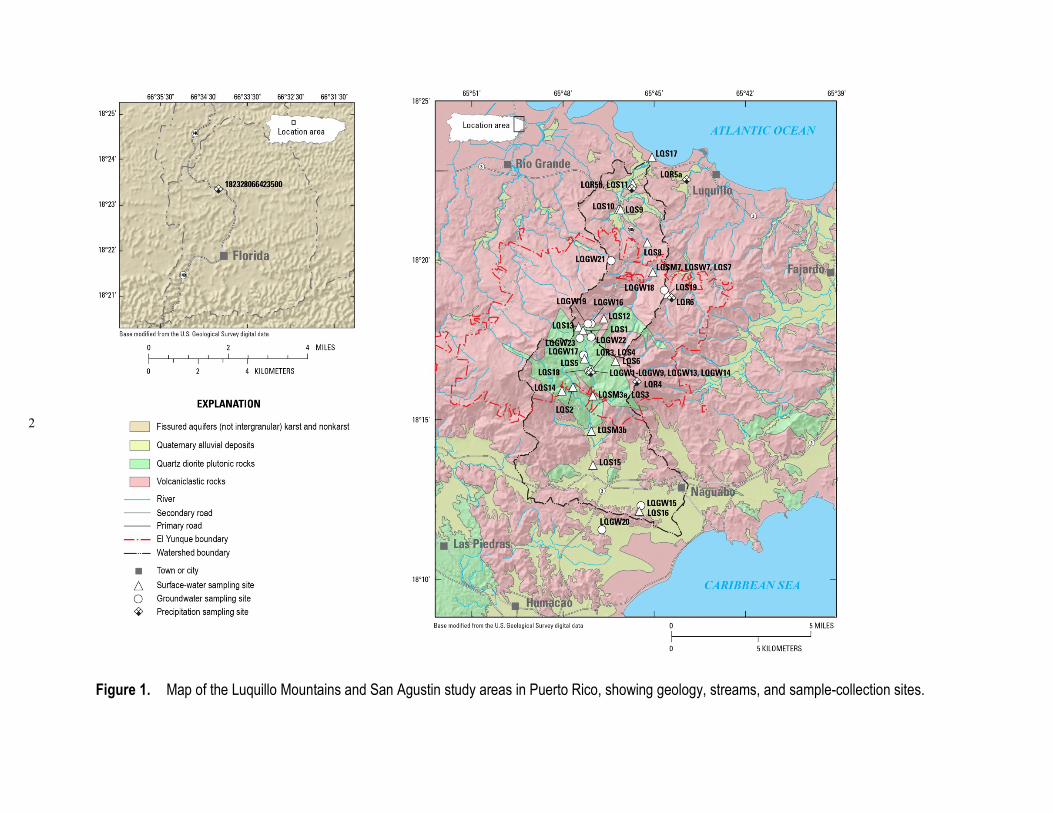
Puerto Rico is located in the northeastern Caribbean Sea (18.2 °N, 66.3 °W), with the Atlantic Ocean on its northern coast. The U.S. Geological Survey’s Water, Energy, and Biogeochemical Budgets (WEBB) program study area in which most of these data were collected comprises the El Yunque National Forest and surrounding area of eastern Puerto Rico. Samples were collected in two forested watersheds, the Rio Mameyes and the Rio Icacos/Rio Blanco, on opposite sides of a ridge in the Luquillo Mountains on the eastern end of the island (fig. 1). Elevation in both watersheds ranges from sea level to approximately 1,000 meters (m). Near sea level, land use is mixed pasture, moist forest, and residential, grading to completely forested within the boundaries of El Yunque National Forest. Forest type changes with elevation from tabonuco to palo colorado to sierra palm to cloud forest above approximately 950 m (Murphy and others, 2012). The Rio Mameyes watershed is oriented north-northeast, and the basin is underlain by volcaniclastic bedrock (basaltic to andesitic volcanic sandstone/mudstone/conglomerate/breccia). The Rio Icacos/Rio Blanco watershed is oriented south-southeast. The Rio Icacos is one of the headwaters of the Rio Blanco and is underlain by quartz diorite. The lower Rio Blanco basin is underlain by andesitic volcaniclastic bedrock. This report also contains a long-term rain isotope dataset from the San Agustin site, in north-central Puerto Rico (fig. 1).
Puerto Rico has a tropical climate dominated by easterly trade winds, and seasonal climate patterns affect the hydrology of the study area. The summer wet season is characterized by convective precipitation from tropical easterly waves, troughs, and cyclonic low-pressure systems, including tropical storms and hurricanes; in contrast, the drier winter season is characterized by trade-wind showers and frontal systems. The highest single-event rainfall totals tend to be associated with tropical storms, hurricanes, and cold fronts, although frequent low-intensity orographic showers occur throughout the year in the mountains. The stable isotope signatures of rainfall (2H and 18O) are broadly correlated with the weather type that produced the rainfall (Scholl and others, 2009; Scholl and Murphy, 2014).
2
Figure 1. Map of the Luquillo Mountains and San Agustin study areas in Puerto Rico, showing geology, streams, and sample-collection sites.
3
Purpose and Scope
Stable isotope data can be used to determine interactions between climate, streamflow, and groundwater resources, and to characterize watershed residence times and streamflow generation processes. This report contains stable isotope datasets for rain water, cloud water, stream water, and groundwater, and is intended to supplement interpretive research publications from the Luquillo WEBB program, as well as other research efforts within the study area.
Methods Field Sample Collection
Monthly Rain-Water Isotope Samples
Cumulative monthly rain-water isotope samples (2H and 18O) were collected from nine sites across the Luquillo Mountains for 3 years beginning in April 2005, and sampling has continued at four of those sites to the present (2014). The 3-year dataset collected at the nine sites from April 2005 to April 2008 is published in Scholl and others, 2009, and is not repeated herein. Stable isotope data from the four long-term monthly rain-water collection sites from 2005–2013 are presented in this report. These sites are Pico del Este, Rio Mameyes gage, Rio Icacos gage, and Bisley tower; locations are shown in figure 1 and table 1, and the data are provided in table 2. Rain samples for isotopic analysis were collected in 20-liter high-density polyethylene (HDPE) rectangular carboys. An HDPE funnel was glued into the cap; funnel diameter varied depending on rainfall amount expected at each site. The funnel contained a small amount of polyester fiber to filter debris. Mineral oil was added to the carboy to make a 1-cm-thick layer over the water sample to prevent evaporation and subsequent isotopic fractionation (Scholl and others, 2009). Samples were collected by replacing the funnel cap with a spigot cap, positioning the carboy horizontally with the oil layer above the outlet, and dispensing the sample through a coarse, qualitative paper filter into a 60-mL glass bottle with a conical-insert cap. The filter paper served to remove residual oil from the sample. The volume of the entire monthly sample was then measured so that volume-weighted averages could be calculated, and to correlate with rainfall amounts measured in nearby tipping-bucket rain gages.
Monthly rain samples were collected for isotopic analysis from 1993 through 2013 at the San Agustin rain gage site (USGS 182328066423500) in the Florida municipality of north-central Puerto Rico (fig. 1; table 1). Rainfall samples were collected daily by using a cylindrical clear-plastic rain gage with a 10-cm-diameter funnel. The daily samples were accumulated in 1-liter plastic bottles during each month and combined at the end of the month to produce a composite sample. The composite rainfall samples were kept closed and protected from sunlight to avoid evaporation and contamination. Monthly composite samples were filtered through a nonreactive silicon-based 0.45-micron pore-size capsule filter to remove particles and debris, and the aliquot for isotope analysis was stored in a 60-mL glass bottle with a conical-insert cap.
The International Atomic Energy Agency–Global Network of Isotopes in Precipitation (IAEA–GNIP) published cumulative monthly 18O values for rainfall at the San Juan, Puerto Rico airport for the period from 8/1/1968 to 4/30/1973 (IAEA–GNIP, 2014). The rainfall isotope data from San Agustin from May 1993 through December 1995 were published in Rodriguez-Martinez (1997). These data and subsequent analyses continuing to 2013 are provided in table 3 of this report. These represent the only stable isotope data for rain water that we are aware of from Puerto Rico during the 1994–2005 period,
4
and the full dataset has not previously been published. Volumes of the monthly samples were not available for the dataset from 1994–2003, so monthly rainfall totals from the nearby station at Arecibo Observatory (NCDC–NOAA, 2014), 20 km to the west-southwest and approximately 140 m higher in elevation, were calculated and are provided in table 3. In figure 2, the San Agustin data are compared with the average value of the Luquillo WEBB samples for the approximately 8-year period that the two datasets overlap.
Cloud-Water Isotope Samples
Cloud-water samples for stable isotope analysis were collected with an active-strand cloud-water collector, similar to the design of those described in Daube and others, 1987. The fan-driven cloud-water collector draws air across a set of cartridges strung with Teflon monofilament, and the impacting cloud droplets coalesce and fall into a collection trough and then into sample bottles. Rain, if present, is excluded from the sample. Samples were collected on Pico del Este while the site was immersed in clouds in September 2007, May 2010, and March 2013.
Stream-Water Isotope Samples
Stream-water isotope samples from the Rio Mameyes at USGS gage 50065500 (the site is also called Puente Roto) were collected monthly from 11/1/2007 until 3/9/2010, then weekly thereafter. Samples were also collected sporadically from the Rio Icacos upstream from USGS gage 50075550. Grab samples were collected from the bank of the flowing stream in 60-mL bottles with conical-insert caps. Site locations are provided in table 1, and stable isotope data are presented in table 4.
Five sets of contemporaneous (collected during a 2- to 3-day period) stream-water samples from multiple sites along the length of the Rio Mameyes and the Rio Blanco/Rio Icacos and their tributaries were taken during different seasons in February 2006, November 2006, September 2007, June 2008, and January 2010. The samples were collected at different elevations in the watershed from near sea level to the headwaters, and sampling times generally represented baseflow conditions. Site locations are provided in table 1, and stable isotope data are presented in table 5.
Groundwater Isotope Samples
Groundwater samples were collected from available wells in eastern Puerto Rico, by using either a peristaltic pump or an installed pump. The larger wells were pumped until the specific conductance stabilized, then the sample was taken. The smaller, shallow wells were pumped until empty, then sampled between 12 and 24 hours later, after they refilled. Samples were taken in January 2010, May 2010, June 2011, and May 2012. Site locations are provided in table 1, and stable isotope data are presented in table 6.
5
Table 1. Rain-water, stream-water, and groundwater sampling sites for monitoring natural-water isotopic composition in eastern Puerto Rico. [Sample type: R = Rain Water, CW = Cloud Water, S = Stream Water, G = Groundwater]
Site name Site ID Latitude, °N Longitude, °W Elevation
land surface (m)
Sample type
Rio Icacos, USGS stream gage 50075000 LQR3 18.277 -65.786 625 R
Pico del Este (East Peak) LQR4 18.270 -65.760 1011 R, CW 1Mata de Platanos USGS QMP1, from
4/20/05–7/21/08 LQR5a 18.376 -65.733 2 R
1Rio Mameyes at Mameyes, USGS streamgage 50066000 from 7/21/08–3/26/13
LQR5b, LQS11 18.37226 -65.76311 5 R
2Bisley upper tower, USGS Meteorological Station 50065549
LQR6 18.31582 -65.74315 482 R
San Agustin, Florida, PR 182328066414600, 182328066423500
18.38930 -66.56934 178 R
Arecibo Observatory, PR, rainfall amounts GHCND:RQC00660 426
18.3494 -66.7525 323 R
Rio Icacos, above Lago Icacos, from 11/1/07 to 5/3/12
LQSM3a, LQS3 18.2626 -65.7844 453 S
Rio Icacos at Hydroelectric Plant, from 5/3/12
LQSM3b 18.244 -65.785 43 S
Rio Mameyes near Sabana, USGS streamgage 50065500, Puente Roto
LQSM7, LQSW7, LQS7
18.327 -65.751 84 S
Rio Mameyes headwaters LQS1 18.29592 -65.78941 732 S
Rio Sabana (Rio Blanco basin) at Hwy. No. 191 bridge
LQS2 18.2672 -65.7952 483 S
Rio Icacos, USGS streamgage 50075000 LQS4 18.277 -65.786 616 S
Quebrada Guaba, USGS streamgage 50074950
LQS5 18.28204 -65.78907 640 S
Rio Icacos headwaters LQS6 18.28048 -65.77202 813 S
Rio Mameyes at Rte. 990 crossing LQS8 18.34246 -65.75427 47 S
Rio Mameyes above Quebrada Tabonuco LQS9 18.35966 -65.76887 11 S
Quebrada Tabonuco LQS10 18.35973 -65.76937 12 S
Rio de la Mina above falls LQS12 18.30295 -65.77805 536 S
Mt. Britton tributary to Rio de la Mina LQS13 18.29845 -65.79199 778 S
Rio Cubuy at Hwy. No. 191 bridge LQS14 18.26505 -65.80112 479 S
Rio Blanco near Florida USGS streamgage 50076000
LQS15 18.22601 -65.78452 15 S
Rio Blanco at Rt. 927 LQS16 18.20243 -65.75903 8 S
Rio Mameyes at mouth LQS17 18.38713 -65.75134 0.1 S
Rio Icacos tributary, McDowell LQS18 18.2772 -65.7858 624 S
Bisley tributary, McDowell LQS19 18.31554 -65.74530 285 S

6
Table 1. Rain-water, stream-water, and groundwater sampling sites for monitoring natural-water isotopic composition in eastern Puerto Rico.—Continued [Sample type: R = Rain Water, CW = Cloud Water, S = Stream Water, G = Groundwater]
Site name Site ID Latitude, °N Longitude, °W Elevation
land surface (m)
Sample type
3McDowell well field, near Rio Icacos streamgage (McDowell and others, 1992)
LQGW1-LQGW9, LQGW13, LQGW14
18.2772 -65.7858 625 G
CA-1 well, Naguabo 181217065453000 LQGW15 18.2047 -65.7583 5 G
Caimitillo well, ElYunque NF LQGW16 18.3008 -65.7856 645 G
LGW1 Icacos deep well LQGW17 18.28245 -65.78873 648 G
BIW2 Bisley deep well LQGW18 18.318 -65.7458 239 G
Palo Colorado well, El Yunque NF LQGW19 18.3006 -65.7875 694 G
Pennock Gramas well 181134065464400 LQGW20 18.1928 -65.7789 10 G
Aviary well, El Yunque NF LQGW21 18.3335 -65.7742 461 G
CD3 East Peak Well ( approximately 5-m depth)
LQGW22 18.2947 -65.785 775 G
LGW2B (bailed from drilled well top of Hwy. No. 191)
LQGW23 18.2941 -65.7911 740 G
1Site changed to a safer location (Rio Mameyes gage) 3 km to the west in July 2008. 2Land surface is 482 m; elevation of rain collector at top of tower is 502 m. 3Wells all within an area about 15 by 20 meters; no individual latitude-longitude coordinates. See McDowell and others, 1992, for a detailed location map.
Laboratory Analysis Methods
Hydrogen-isotope-ratio (2H) analyses were performed by using a hydrogen equilibration technique (Coplen and others, 1991; Révész and Coplen, 2008a). Water samples were measured for delta O-18 (18O) by using the CO2 equilibration technique of Epstein and Mayeda (1953), which has been automated (Révész and Coplen, 2008b). Oxygen and hydrogen isotopic results are reported in per mil (‰) relative to Vienna Standard Mean Ocean Water (VSMOW), and normalized (Coplen, 1994) on scales such that the oxygen and hydrogen isotopic values of Standard Light Antarctic Precipitation (SLAP) are -55.5 ‰ and -428 ‰, respectively.
7
Stable Isotope Data Monthly Rain-Water Isotope Data
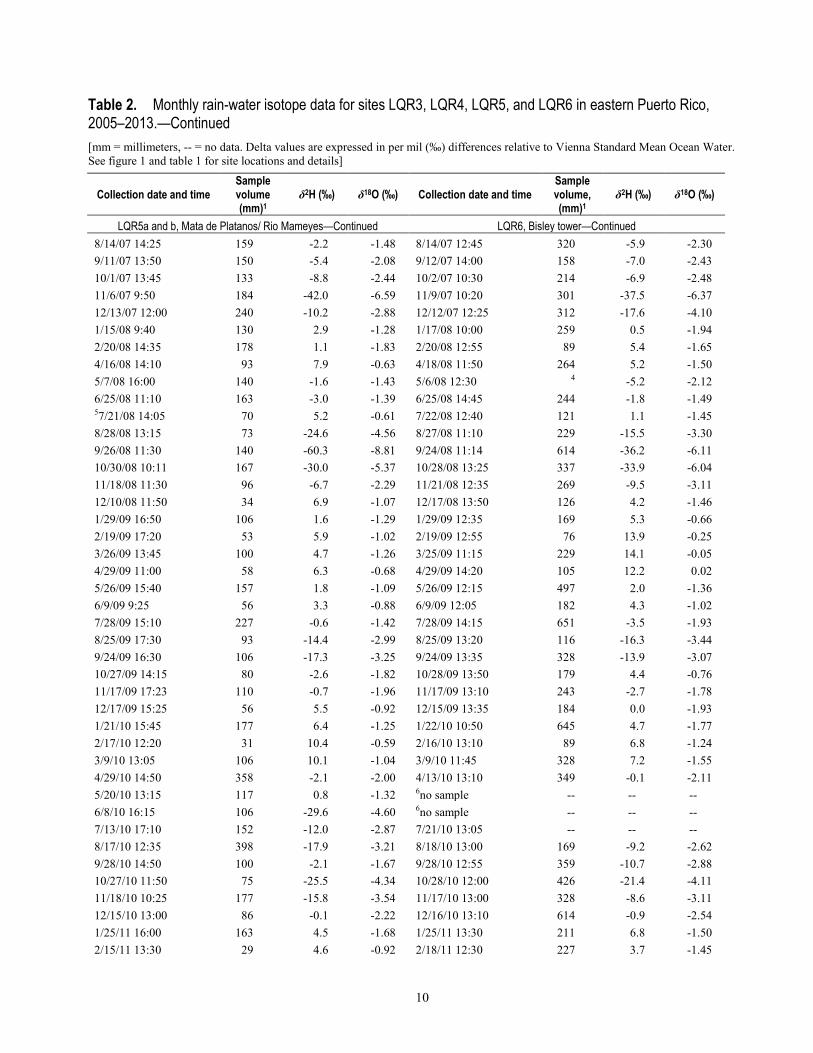
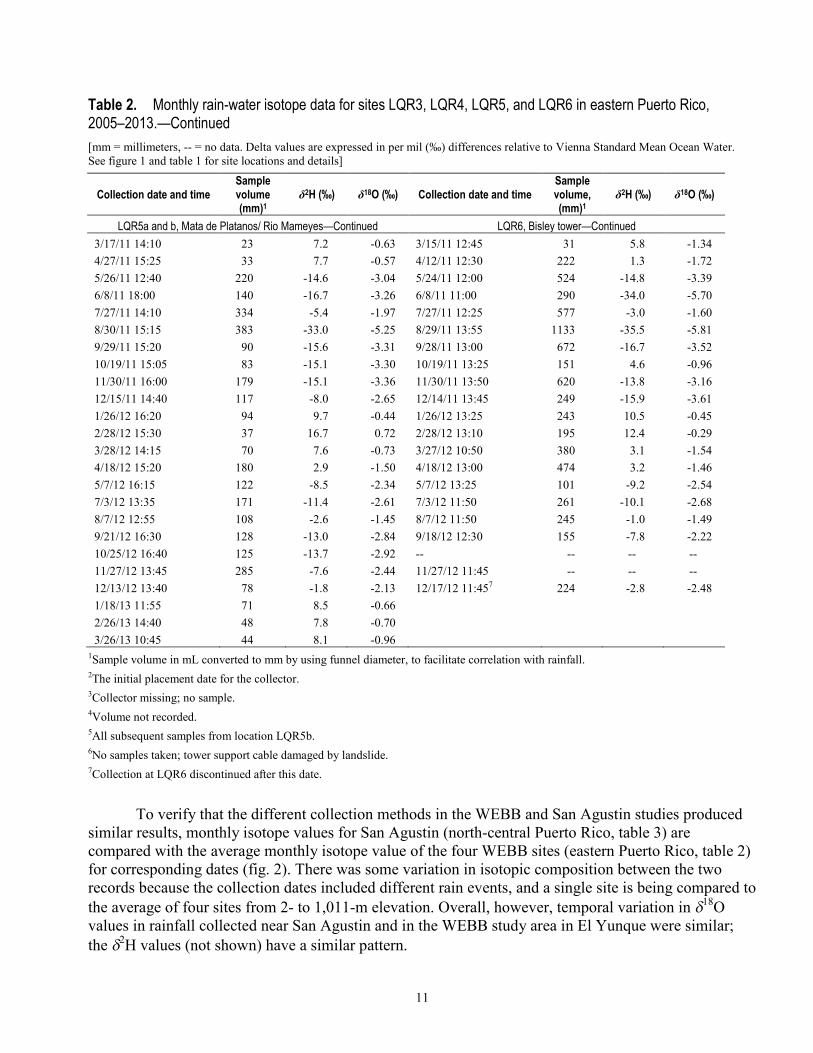
Table 2. Monthly rain-water isotope data for sites LQR3, LQR4, LQR5, and LQR6 in eastern Puerto Rico, 2005–2013. [mm = millimeters, -- = no data. Delta values are expressed in per mil (‰) differences relative to Vienna Standard Mean Ocean Water. See figure 1 and table 1 for site locations and details]
Collection date and time Sample volume (mm)1
δ2H (‰) δ18O (‰) Collection date and time Sample volume, (mm)1
δ2H (‰) δ18O (‰)
LQR3, Rio Icacos LQR4, Pico del Este 24/20/05 13:00
24/20/05 14:00
5/16/05 11:00 247 0.9 -1.80 5/16/05 12:00 345 -7.2 -2.52 6/13/05 11:50 691 -40.7 -6.45 6/13/05 10:20 592 -44.0 -7.12 7/12/05 11:50 284 -6.1 -2.46 7/13/05 11:05 185 -9.3 -2.99 8/10/05 12:30 247 -14.7 -3.24 8/10/05 11:10 197 -16.5 -3.71 9/7/05 11:30 308 -9.9 -2.94 9/7/05 10:30 210 -13.4 -3.41 10/5/05 12:00 543 -13.6 -3.28 10/5/05 11:00 518 -16.0 -3.92 11/9/05 11:45 857 -39.9 -6.80 11/9/05 10:50 817 -42.4 -7.25 12/7/05 12:35 323 -8.6 -2.95 12/7/05 11:10 299 -10.4 -3.53 1/11/06 10:40 290 4.0 -1.47 1/11/06 12:00 237 1.7 -2.09 2/13/06 14:15 565 3.0 -1.57 2/13/06 12:30 343 -0.6 -2.08 3/15/06 10:50 175 4.5 -1.52 3/17/06 12:20 181 2.1 -2.03 4/26/06 12:25 385 1.2 -1.62 4/27/06 17:40 465 -1.4 -2.08 5/25/06 11:20 200 1.5 -1.84 5/25/06 14:40 212 -4.2 -2.56 6/26/06 14:25 433 -9.1 -2.80 6/26/06 12:45 559 -10.1 -3.08 7/28/06 13:00 545 -10.1 -2.75 8/1/06 15:05 491 -15.7 -3.48 8/31/06 12:35 296 -18.6 -3.56 8/29/06 12:35 392 -20.6 -3.92 9/29/06 12:50 317 -5.6 -2.32 9/27/06 12:05 294 -11.5 -3.43 11/2/06 11:45 298 -17.0 -3.85 10/27/06 13:50 368 -12.9 -3.40 11/29/06 16:10 392 -5.4 -2.66 12/7/06 13:20 423 -7.2 -3.05 1/4/07 14:45 405 1.0 -1.75 1/12/07 14:30 201 0.1 -2.22 2/7/07 11:00 263 4.0 -1.48 2/7/07 11:00 109 1.6 -2.08 3/8/07 12:10 139 9.3 -0.95 3/8/07 13:45 78 5.4 -1.52 4/4/07 12:20 339 -5.7 -2.26 4/3/07 15:00 228 -13.5 -3.35 5/1/07 11:50 363 1.1 -1.63 5/1/07 14:40 268 -0.1 -2.11 6/7/07 13:40 277 -12.9 -2.96 6/7/07 12:30 172 -9.0 -2.82 7/2/07 12:30 234 -9.0 -2.28 7/2/07 14:45 191 -10.2 -2.94 8/15/07 14:35 400 -4.8 -1.84 8/16/07 14:20 306 -6.6 -2.64 9/14/07 11:45 269 -7.5 -2.36 9/14/07 10:05 238 -13.0 -3.48 9/30/07 14:45 198 -9.2 -2.73 9/30/07 11:00 126 -12.7 -3.50 11/8/07 12:15 651 -38.9 -6.55 11/8/07 14:40 627 -42.7 -7.25 12/13/07 15:50 516 -14.3 -3.71 12/13/07 14:55 405 -20.4 -4.70 1/16/08 11:00 355 0.0 -1.93 1/17/08 14:00 368 -2.9 -2.48 2/21/08 13:45 392 5.5 -1.41 2/21/08 14:15 189 3.9 -1.96 4/18/08 13:55 454 5.7 -1.28 4/16/08 12:40 380 2.5 -1.95 5/7/08 12:40 146 -4.0 -1.76 5/7/08 14:50 232 -5.3 -2.11 6/24/08 13:30 368 -0.7 -1.55 6/24/08 10:45 349 -4.0 -2.13
8
Table 2. Monthly rain-water isotope data for sites LQR3, LQR4, LQR5, and LQR6 in eastern Puerto Rico, 2005–2013.—Continued [mm = millimeters, -- = no data. Delta values are expressed in per mil (‰) differences relative to Vienna Standard Mean Ocean Water. See figure 1 and table 1 for site locations and details]
Collection date and time Sample volume (mm)1
δ2H (‰) δ18O (‰) Collection date and time Sample volume, (mm)1
δ2H (‰) δ18O (‰)
LQR3, Rio Icacos—Continued LQR4, Pico del Este—Continued 7/21/08 13:00 176 2.0 -1.12 7/21/08 12:00 146 0.1 -1.72 8/27/08 12:55 337 -17.6 -3.74 8/28/08 14:30 312 -22.3 -4.47 9/25/08 9:40 1034 -35.8 -6.18 9/26/08 12:20 1009 -41.1 -6.99 10/30/08 12:05 380 -36.3 -6.29 10/30/08 11:20 491 -35.8 -6.58 11/18/08 13:20 201 -7.8 -2.72 11/18/08 12:30 386 -10.5 -3.30 12/10/08 13:15 121 5.6 -1.53 12/10/08 12:35 158 1.2 -2.26 1/29/09 15:30 331 -1.8 -1.98 1/29/09 14:45 516 -5.1 -2.65 2/19/09 15:15 146 3.9 -1.37 2/19/09 16:15 146 0.6 -2.08 3/26/09 11:45 244 6.6 -1.34 3/26/09 12:45 281 -0.2 -2.27 4/28/09 13:35 220 3.4 -1.32 4/28/09 12:44 257 0.2 -2.00 5/29/09 14:30 306 -1.0 -1.78 5/29/09 15:25 577 -4.1 -2.33 6/10/09 12:00 102 -2.1 -1.99 6/10/09 11:20 270 -5.7 -2.54 7/30/09 14:35 275 -3.4 -2.09 7/30/09 15:50 300 -6.2 -2.47 8/25/09 15:45 220 -4.7 -2.06 8/25/09 15:00 244 -11.2 -3.02 9/28/09 11:30 577 -16.9 -3.62 9/24/09 15:40 479 -18.7 -4.01 10/27/09 16:25 269 -9.8 -2.98 10/27/09 15:25 244 -11.0 -3.26 11/17/09 16:05 368 -5.0 -2.58 11/17/09 15:23 355 -6.4 -2.91 12/17/09 13:00 146 3.9 -1.43 12/17/09 14:00 109 1.8 -2.04 1/21/10 11:00 664 1.9 -2.01 1/22/10 12:20 602 -1.1 -2.33 2/17/10 10:45 102 6.4 -1.36 2/17/10 11:20 7 2.9 -1.98 3/10/10 11:45 220 5.2 -1.48 3/10/10 11:05 207 1.9 -1.90 4/27/10 15:50 645 -1.5 -2.08 4/27/10 15:05 657 -4.8 -2.71 5/18/10 10:50 577 -3.2 -1.94 5/19/10 11:35 553 -4.0 -2.26 6/7/10 12:15 429 -31.4 -5.21 6/7/10 14:45 331 -34.5 -5.68 7/13/10 14:20 639 -16.8 -3.58 7/13/10 15:35 503 -13.9 -3.52 8/17/10 10:50 1058 -19.9 -4.03 8/17/10 11:35 331 -22.4 -4.42 9/29/10 12:00 269 -8.3 -2.63 9/29/10 13:30 207 -13.1 -3.57 10/28/10 15:00 331 -18.7 -3.98 10/28/10 14:10 269 -25.2 -4.81 11/18/10 11:25 257 -13.7 -3.56 11/18/10 12:15 269 -17.1 -4.10 12/15/10 10:50 294 -1.9 -2.42 12/15/10 11:30 343 -4.9 -2.90 1/28/11 11:15 417 5.8 -1.89 1/26/11 10:15 286 2.3 -2.16 2/16/11 13:50 158 4.9 -1.34 2/16/11 14:30 146 1.4 -1.76 3/17/11 12:35 170 2.2 -1.77 3/17/11 13:35 146 0.2 -2.28 5/25/11 12:45 388 -24.0 -4.43 5/25/11 15:20 614 -21.3 -4.35 6/8/11 15:30 225 -54.2 -8.18 6/8/11 17:10 281 -52.3 -8.32 7/26/11 14:50 593 -9.6 -2.61 7/26/11 13:55 429 -9.5 -2.79 9/2/11 14:00 1034 -40.5 -6.55 8/30/11 12:20 923 -37.6 -6.45 9/30/11 13:55 368 -21.9 -4.29 9/27/11 15:40 392 -21.0 -4.37 10/20/11 12:25 292 -4.6 -2.24 10/20/11 13:10 222 -7.7 -2.83 11/29/11 13:00 228 -17.6 -3.75 11/29/11 13:45 555 -25.2 -5.00 12/15/11 12:55 308 -20.3 -3.99 12/15/11 13:35 185 -19.7 -4.32 1/24/12 14:40 355 3.8 -1.45 1/26/12 15:45 294 0.5 -2.28
9
Table 2. Monthly rain-water isotope data for sites LQR3, LQR4, LQR5, and LQR6 in eastern Puerto Rico, 2005–2013.—Continued [mm = millimeters, -- = no data. Delta values are expressed in per mil (‰) differences relative to Vienna Standard Mean Ocean Water. See figure 1 and table 1 for site locations and details]
Collection date and time Sample volume (mm)1
δ2H (‰) δ18O (‰) Collection date and time Sample volume, (mm)1
δ2H (‰) δ18O (‰)
LQR3, Rio Icacos—Continued LQR4, Pico del Este—Continued 3/1/12 12:30 454 3.7 -1.33 3/1/12 14:20 308 2.2 -2.01 3/28/12 11:35 602 -0.4 -2.10 3/28/12 13:00 555 -5.1 -2.73 4/16/12 12:10 664 -0.6 -1.96 4/16/12 15:30 503 -3.5 -2.37 5/8/12 13:50 308 -10.1 -2.81 5/8/12 17:20 382 -14.4 -3.40 7/9/12 14:20 558 -7.0 -2.35 7/9/12 16:10 619 -13.0 -3.43 8/8/12 11:00 262 -8.7 -2.32 8/8/12 12:15 329 -19.2 -4.05 9/20/12 17:30 397 -17.7 -3.72 9/21/12 14:30 231 -18.5 -3.98 10/23/12 11:30 447 -8.4 -2.84 10/25/12 14:35 527 -14.6 -3.67 12/4/12 11:45 595 -8.8 -2.65 11/30/12 15:00 755 -9.7 -3.05 12/14/12 15:30 187 0.2 -2.08 12/13/12 12:35 224 -8.6 -3.24 1/17/13 12:30 274 5.1 -1.35 1/18/13 22:00 286 0.7 -2.10 3/1/13 9:55 317 4.1 -1.22 2/26/13 13:05 224 0.0 -2.00 3/26/13 11:40 138 4.2 -1.46 3/26/13 12:35 138 1.1 -2.09
LQR5a and b, Mata de Platanos/ Rio Mameyes LQR6, Bisley tower 24/20/05 10:00
24/21/05 11:00
5/16/05 14:30 362 -13.1 -2.78 5/17/05 12:25 440 -17.1 -3.38 6/13/05 14:05 224 -36.7 -5.75 6/14/05 12:20 360 -38.7 -6.28 7/12/05 15:05 141 -10.0 -2.42 7/12/05 12:20 122 -3.9 -2.21 8/10/05 14:00 100 -4.8 -1.83 8/9/05 11:00 159 -12.5 -3.09 9/7/05 13:00 147 -6.6 -2.14 9/6/05 12:30 148 -9.0 -2.74 10/5/05 14:20 218 -10.6 -2.78 10/4/05 12:00 238 -13.2 -3.27 11/9/05 13:30 403 -31.3 -5.13 11/8/05 12:00 1103 -38.7 -6.46 12/8/05 12:30 315 -4.5 -2.46 12/6/05 12:40 258 -4.8 -2.69 1/13/06 12:50 129 8.0 -0.84 1/10/06 10:50 258 4.5 -1.48 2/15/06 11:50 100 8.4 -0.52 2/14/06 12:40 290 4.8 -1.41 33/17/06 0:00 -- -- -- 3/14/06 13:00 78 5.0 -1.35 4/26/06 14:35 238 2.9 -1.26 4/25/06 11:45 502 0.1 -1.72 5/25/06 16:15 131 4.1 -1.42 5/31/06 11:15 245 2.0 -1.60 6/23/06 14:20 101 -1.3 -1.23 6/27/06 12:20 269 -6.0 -2.07 7/27/06 13:40 147 -11.0 -2.48 7/25/06 12:55 738 -8.6 -2.48 8/28/06 10:30 106 -9.3 -2.24 8/22/06 8:05 245 -10.7 -2.67 9/29/06 14:20 187 -1.6 -1.63 9/26/06 13:20 275 -9.1 -2.75 11/3/06 11:50 29 -15.6 -3.50 10/31/06 13:50 414 -11.2 -3.08 12/5/06 15:20 152 -2.6 -2.04 12/6/06 15:35 402 -3.4 -2.44 1/8/07 12:00 55 4.9 -0.84 1/11/07 13:25 129 4.0 -1.62 2/2/07 13:10 29 6.8 -0.93 2/5/07 14:20 92 4.8 -1.42 3/8/07 16:00 34 10.6 -0.52 3/7/07 12:55 83 8.4 -1.04 4/2/07 14:00 57 -5.9 -2.23 4/3/07 12:25 151 -9.3 -2.88 5/4/07 13:30 137 4.9 -1.12 5/9/07 12:55 347 2.2 -1.73 6/6/07 14:05 79 2.8 -0.92 6/12/07 15:00 140 -10.3 -2.71 7/2/07 16:15 112 -7.4 -2.06 7/3/07 13:30 77 -0.1 -1.56
10
Table 2. Monthly rain-water isotope data for sites LQR3, LQR4, LQR5, and LQR6 in eastern Puerto Rico, 2005–2013.—Continued [mm = millimeters, -- = no data. Delta values are expressed in per mil (‰) differences relative to Vienna Standard Mean Ocean Water. See figure 1 and table 1 for site locations and details]
Collection date and time Sample volume (mm)1
δ2H (‰) δ18O (‰) Collection date and time Sample volume, (mm)1
δ2H (‰) δ18O (‰)
LQR5a and b, Mata de Platanos/ Rio Mameyes—Continued LQR6, Bisley tower—Continued 8/14/07 14:25 159 -2.2 -1.48 8/14/07 12:45 320 -5.9 -2.30 9/11/07 13:50 150 -5.4 -2.08 9/12/07 14:00 158 -7.0 -2.43 10/1/07 13:45 133 -8.8 -2.44 10/2/07 10:30 214 -6.9 -2.48 11/6/07 9:50 184 -42.0 -6.59 11/9/07 10:20 301 -37.5 -6.37 12/13/07 12:00 240 -10.2 -2.88 12/12/07 12:25 312 -17.6 -4.10 1/15/08 9:40 130 2.9 -1.28 1/17/08 10:00 259 0.5 -1.94 2/20/08 14:35 178 1.1 -1.83 2/20/08 12:55 89 5.4 -1.65 4/16/08 14:10 93 7.9 -0.63 4/18/08 11:50 264 5.2 -1.50 5/7/08 16:00 140 -1.6 -1.43 5/6/08 12:30 4 -5.2 -2.12 6/25/08 11:10 163 -3.0 -1.39 6/25/08 14:45 244 -1.8 -1.49 57/21/08 14:05 70 5.2 -0.61 7/22/08 12:40 121 1.1 -1.45 8/28/08 13:15 73 -24.6 -4.56 8/27/08 11:10 229 -15.5 -3.30 9/26/08 11:30 140 -60.3 -8.81 9/24/08 11:14 614 -36.2 -6.11 10/30/08 10:11 167 -30.0 -5.37 10/28/08 13:25 337 -33.9 -6.04 11/18/08 11:30 96 -6.7 -2.29 11/21/08 12:35 269 -9.5 -3.11 12/10/08 11:50 34 6.9 -1.07 12/17/08 13:50 126 4.2 -1.46 1/29/09 16:50 106 1.6 -1.29 1/29/09 12:35 169 5.3 -0.66 2/19/09 17:20 53 5.9 -1.02 2/19/09 12:55 76 13.9 -0.25 3/26/09 13:45 100 4.7 -1.26 3/25/09 11:15 229 14.1 -0.05 4/29/09 11:00 58 6.3 -0.68 4/29/09 14:20 105 12.2 0.02 5/26/09 15:40 157 1.8 -1.09 5/26/09 12:15 497 2.0 -1.36 6/9/09 9:25 56 3.3 -0.88 6/9/09 12:05 182 4.3 -1.02 7/28/09 15:10 227 -0.6 -1.42 7/28/09 14:15 651 -3.5 -1.93 8/25/09 17:30 93 -14.4 -2.99 8/25/09 13:20 116 -16.3 -3.44 9/24/09 16:30 106 -17.3 -3.25 9/24/09 13:35 328 -13.9 -3.07 10/27/09 14:15 80 -2.6 -1.82 10/28/09 13:50 179 4.4 -0.76 11/17/09 17:23 110 -0.7 -1.96 11/17/09 13:10 243 -2.7 -1.78 12/17/09 15:25 56 5.5 -0.92 12/15/09 13:35 184 0.0 -1.93 1/21/10 15:45 177 6.4 -1.25 1/22/10 10:50 645 4.7 -1.77 2/17/10 12:20 31 10.4 -0.59 2/16/10 13:10 89 6.8 -1.24 3/9/10 13:05 106 10.1 -1.04 3/9/10 11:45 328 7.2 -1.55 4/29/10 14:50 358 -2.1 -2.00 4/13/10 13:10 349 -0.1 -2.11 5/20/10 13:15 117 0.8 -1.32 6no sample -- -- -- 6/8/10 16:15 106 -29.6 -4.60 6no sample -- -- -- 7/13/10 17:10 152 -12.0 -2.87 7/21/10 13:05 -- -- -- 8/17/10 12:35 398 -17.9 -3.21 8/18/10 13:00 169 -9.2 -2.62 9/28/10 14:50 100 -2.1 -1.67 9/28/10 12:55 359 -10.7 -2.88 10/27/10 11:50 75 -25.5 -4.34 10/28/10 12:00 426 -21.4 -4.11 11/18/10 10:25 177 -15.8 -3.54 11/17/10 13:00 328 -8.6 -3.11 12/15/10 13:00 86 -0.1 -2.22 12/16/10 13:10 614 -0.9 -2.54 1/25/11 16:00 163 4.5 -1.68 1/25/11 13:30 211 6.8 -1.50 2/15/11 13:30 29 4.6 -0.92 2/18/11 12:30 227 3.7 -1.45
11
Table 2. Monthly rain-water isotope data for sites LQR3, LQR4, LQR5, and LQR6 in eastern Puerto Rico, 2005–2013.—Continued [mm = millimeters, -- = no data. Delta values are expressed in per mil (‰) differences relative to Vienna Standard Mean Ocean Water. See figure 1 and table 1 for site locations and details]
Collection date and time Sample volume (mm)1
δ2H (‰) δ18O (‰) Collection date and time Sample volume, (mm)1
δ2H (‰) δ18O (‰)
LQR5a and b, Mata de Platanos/ Rio Mameyes—Continued LQR6, Bisley tower—Continued 3/17/11 14:10 23 7.2 -0.63 3/15/11 12:45 31 5.8 -1.34 4/27/11 15:25 33 7.7 -0.57 4/12/11 12:30 222 1.3 -1.72 5/26/11 12:40 220 -14.6 -3.04 5/24/11 12:00 524 -14.8 -3.39 6/8/11 18:00 140 -16.7 -3.26 6/8/11 11:00 290 -34.0 -5.70 7/27/11 14:10 334 -5.4 -1.97 7/27/11 12:25 577 -3.0 -1.60 8/30/11 15:15 383 -33.0 -5.25 8/29/11 13:55 1133 -35.5 -5.81 9/29/11 15:20 90 -15.6 -3.31 9/28/11 13:00 672 -16.7 -3.52 10/19/11 15:05 83 -15.1 -3.30 10/19/11 13:25 151 4.6 -0.96 11/30/11 16:00 179 -15.1 -3.36 11/30/11 13:50 620 -13.8 -3.16 12/15/11 14:40 117 -8.0 -2.65 12/14/11 13:45 249 -15.9 -3.61 1/26/12 16:20 94 9.7 -0.44 1/26/12 13:25 243 10.5 -0.45 2/28/12 15:30 37 16.7 0.72 2/28/12 13:10 195 12.4 -0.29 3/28/12 14:15 70 7.6 -0.73 3/27/12 10:50 380 3.1 -1.54 4/18/12 15:20 180 2.9 -1.50 4/18/12 13:00 474 3.2 -1.46 5/7/12 16:15 122 -8.5 -2.34 5/7/12 13:25 101 -9.2 -2.54 7/3/12 13:35 171 -11.4 -2.61 7/3/12 11:50 261 -10.1 -2.68 8/7/12 12:55 108 -2.6 -1.45 8/7/12 11:50 245 -1.0 -1.49 9/21/12 16:30 128 -13.0 -2.84 9/18/12 12:30 155 -7.8 -2.22 10/25/12 16:40 125 -13.7 -2.92 -- -- -- -- 11/27/12 13:45 285 -7.6 -2.44 11/27/12 11:45 -- -- -- 12/13/12 13:40 78 -1.8 -2.13 12/17/12 11:457 224 -2.8 -2.48 1/18/13 11:55 71 8.5 -0.66 2/26/13 14:40 48 7.8 -0.70 3/26/13 10:45 44 8.1 -0.96
1Sample volume in mL converted to mm by using funnel diameter, to facilitate correlation with rainfall. 2The initial placement date for the collector. 3Collector missing; no sample. 4Volume not recorded. 5All subsequent samples from location LQR5b. 6No samples taken; tower support cable damaged by landslide. 7Collection at LQR6 discontinued after this date.
To verify that the different collection methods in the WEBB and San Agustin studies produced similar results, monthly isotope values for San Agustin (north-central Puerto Rico, table 3) are compared with the average monthly isotope value of the four WEBB sites (eastern Puerto Rico, table 2) for corresponding dates (fig. 2). There was some variation in isotopic composition between the two records because the collection dates included different rain events, and a single site is being compared to the average of four sites from 2- to 1,011-m elevation. Overall, however, temporal variation in 18O values in rainfall collected near San Agustin and in the WEBB study area in El Yunque were similar; the 2H values (not shown) have a similar pattern.
12
Figure 2. Comparison of 18O values (WEBB sites, averaged, and San Agustin) for monthly rain samples for the time period that the two datasets overlap.
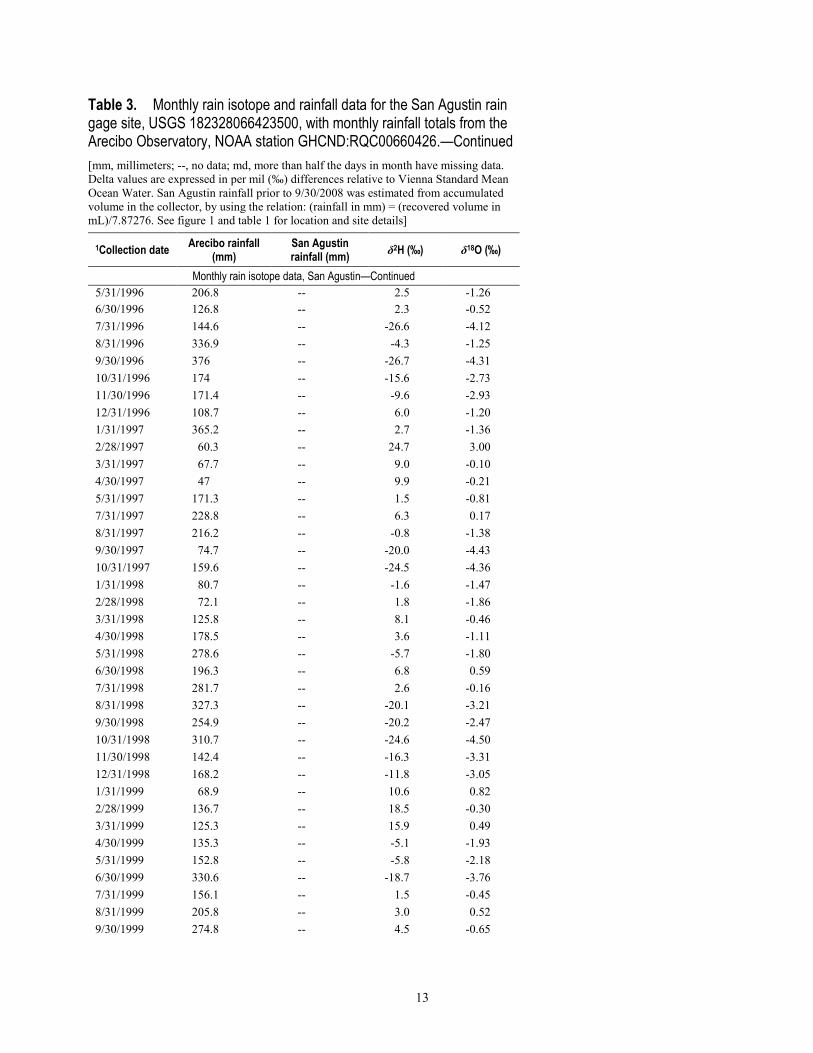
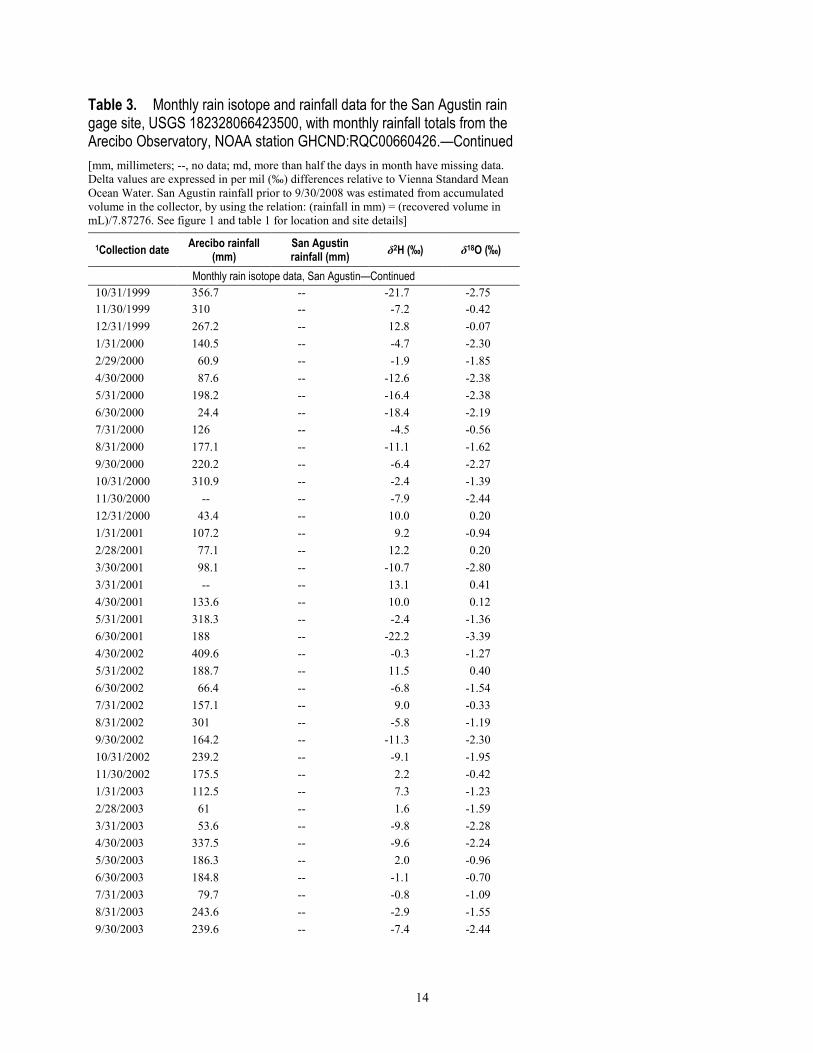
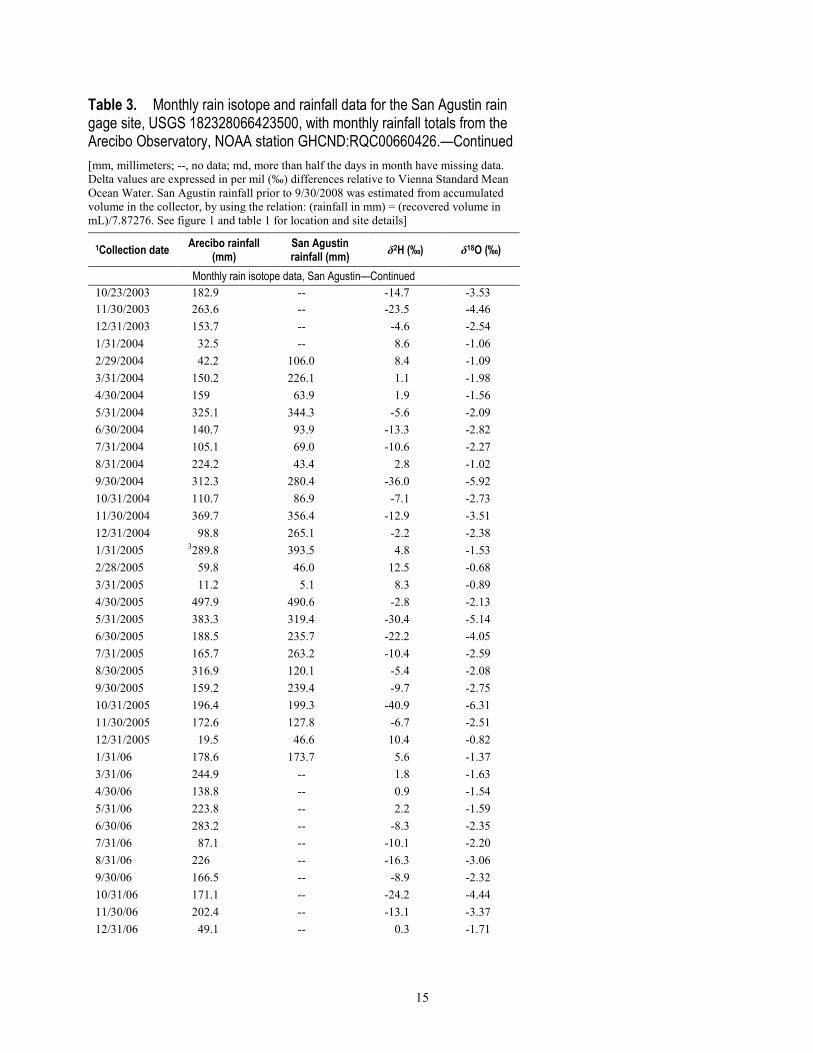
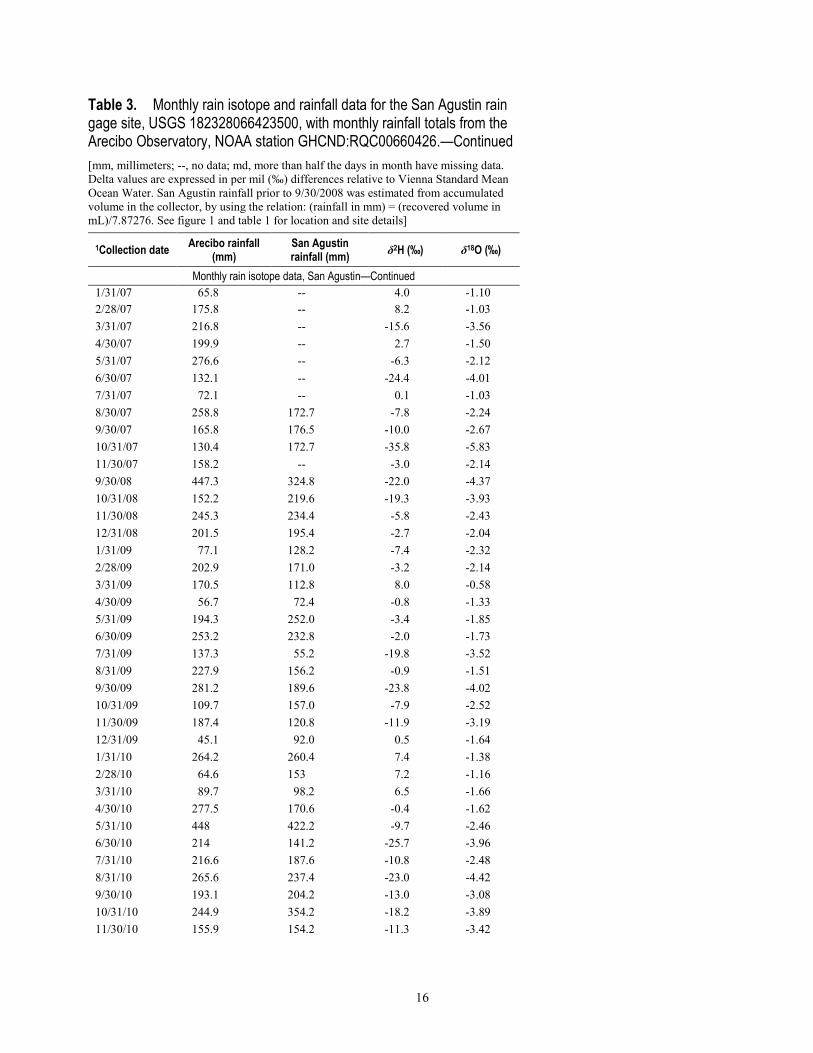
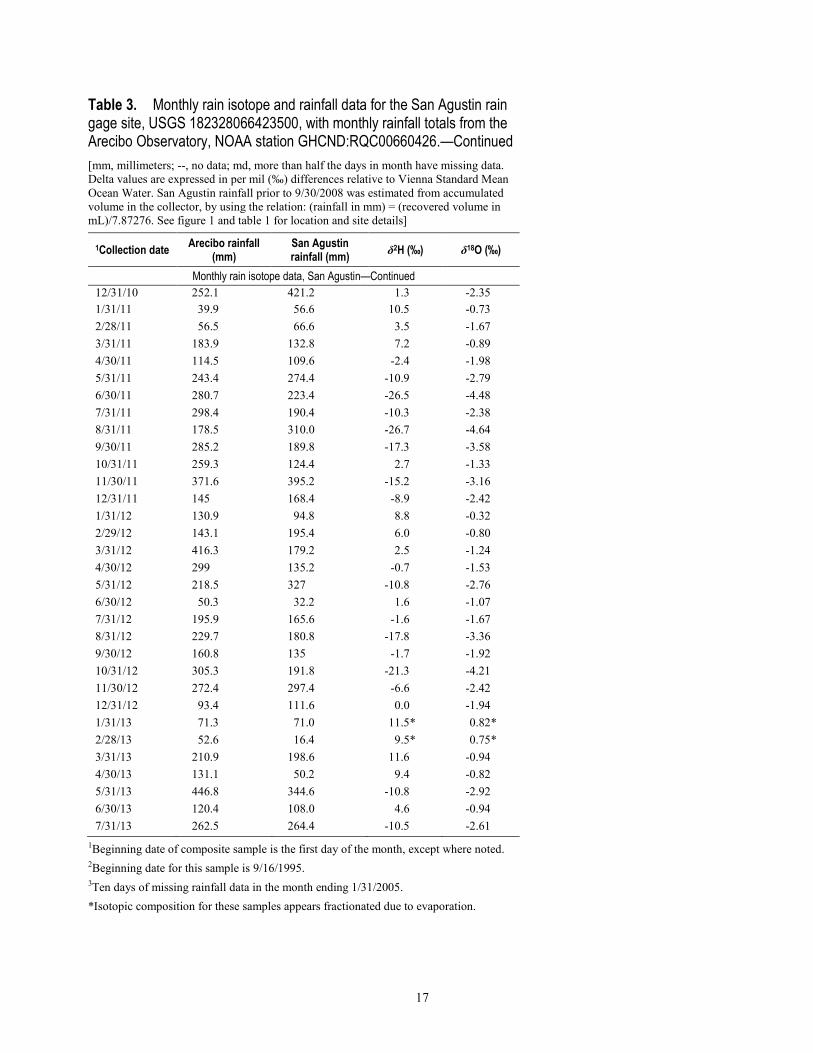
Table 3. Monthly rain isotope and rainfall data for the San Agustin rain gage site, USGS 182328066423500, with monthly rainfall totals from the Arecibo Observatory, NOAA station GHCND:RQC00660426. [mm, millimeters; --, no data; md, more than half the days in month have missing data. Delta values are expressed in per mil (‰) differences relative to Vienna Standard Mean Ocean Water. San Agustin rainfall prior to 9/30/2008 was estimated from accumulated volume in the collector, by using the relation: (rainfall in mm) = (recovered volume in mL)/7.87276. See figure 1 and table 1 for location and site details]
1Collection date Arecibo rainfall (mm)
San Agustin rainfall (mm) δ2H (‰) δ18O (‰)
Monthly rain isotope data, San Agustin 8/31/1994 125.6 -- -5.7 -1.14 10/31/1994 269 -- -23.4 -4.08 11/30/1994 121.2 -- -10.9 -2.28 12/31/1994 206.3 -- 1.5 -0.88 2/28/1995 -- -- 14.5 0.80 4/30/1995 71.1 -- 9.7 -0.18 5/31/1995 653.8 -- 5.8 -0.10 6/30/1995 -- -- 5.1 -0.47 7/31/1995 203.8 -- 0.9 -0.58 8/31/1995 321.3 -- 7.7 0.61 9/15/1995 142.9 -- -37.1 -5.36 29/30/1995 264.8 -- -31.0 -4.72 10/31/1995 195.2 -- *14.8 *2.70 2/29/1996 124.2 -- -1.9 -1.91 3/31/1996 98.2 -- -5.1 -1.91 4/30/1996 md -- -0.7 -1.41
13
Table 3. Monthly rain isotope and rainfall data for the San Agustin rain gage site, USGS 182328066423500, with monthly rainfall totals from the Arecibo Observatory, NOAA station GHCND:RQC00660426.—Continued
[mm, millimeters; --, no data; md, more than half the days in month have missing data. Delta values are expressed in per mil (‰) differences relative to Vienna Standard Mean Ocean Water. San Agustin rainfall prior to 9/30/2008 was estimated from accumulated volume in the collector, by using the relation: (rainfall in mm) = (recovered volume in mL)/7.87276. See figure 1 and table 1 for location and site details]
1Collection date Arecibo rainfall (mm)
San Agustin rainfall (mm) δ2H (‰) δ18O (‰)
Monthly rain isotope data, San Agustin—Continued 5/31/1996 206.8 -- 2.5 -1.26 6/30/1996 126.8 -- 2.3 -0.52 7/31/1996 144.6 -- -26.6 -4.12 8/31/1996 336.9 -- -4.3 -1.25 9/30/1996 376 -- -26.7 -4.31 10/31/1996 174 -- -15.6 -2.73 11/30/1996 171.4 -- -9.6 -2.93 12/31/1996 108.7 -- 6.0 -1.20 1/31/1997 365.2 -- 2.7 -1.36 2/28/1997 60.3 -- 24.7 3.00 3/31/1997 67.7 -- 9.0 -0.10 4/30/1997 47 -- 9.9 -0.21 5/31/1997 171.3 -- 1.5 -0.81 7/31/1997 228.8 -- 6.3 0.17 8/31/1997 216.2 -- -0.8 -1.38 9/30/1997 74.7 -- -20.0 -4.43 10/31/1997 159.6 -- -24.5 -4.36 1/31/1998 80.7 -- -1.6 -1.47 2/28/1998 72.1 -- 1.8 -1.86 3/31/1998 125.8 -- 8.1 -0.46 4/30/1998 178.5 -- 3.6 -1.11 5/31/1998 278.6 -- -5.7 -1.80 6/30/1998 196.3 -- 6.8 0.59 7/31/1998 281.7 -- 2.6 -0.16 8/31/1998 327.3 -- -20.1 -3.21 9/30/1998 254.9 -- -20.2 -2.47 10/31/1998 310.7 -- -24.6 -4.50 11/30/1998 142.4 -- -16.3 -3.31 12/31/1998 168.2 -- -11.8 -3.05 1/31/1999 68.9 -- 10.6 0.82 2/28/1999 136.7 -- 18.5 -0.30 3/31/1999 125.3 -- 15.9 0.49 4/30/1999 135.3 -- -5.1 -1.93 5/31/1999 152.8 -- -5.8 -2.18 6/30/1999 330.6 -- -18.7 -3.76 7/31/1999 156.1 -- 1.5 -0.45 8/31/1999 205.8 -- 3.0 0.52 9/30/1999 274.8 -- 4.5 -0.65
14
Table 3. Monthly rain isotope and rainfall data for the San Agustin rain gage site, USGS 182328066423500, with monthly rainfall totals from the Arecibo Observatory, NOAA station GHCND:RQC00660426.—Continued
[mm, millimeters; --, no data; md, more than half the days in month have missing data. Delta values are expressed in per mil (‰) differences relative to Vienna Standard Mean Ocean Water. San Agustin rainfall prior to 9/30/2008 was estimated from accumulated volume in the collector, by using the relation: (rainfall in mm) = (recovered volume in mL)/7.87276. See figure 1 and table 1 for location and site details]
1Collection date Arecibo rainfall (mm)
San Agustin rainfall (mm) δ2H (‰) δ18O (‰)
Monthly rain isotope data, San Agustin—Continued 10/31/1999 356.7 -- -21.7 -2.75 11/30/1999 310 -- -7.2 -0.42 12/31/1999 267.2 -- 12.8 -0.07 1/31/2000 140.5 -- -4.7 -2.30 2/29/2000 60.9 -- -1.9 -1.85 4/30/2000 87.6 -- -12.6 -2.38 5/31/2000 198.2 -- -16.4 -2.38 6/30/2000 24.4 -- -18.4 -2.19 7/31/2000 126 -- -4.5 -0.56 8/31/2000 177.1 -- -11.1 -1.62 9/30/2000 220.2 -- -6.4 -2.27 10/31/2000 310.9 -- -2.4 -1.39 11/30/2000 -- -- -7.9 -2.44 12/31/2000 43.4 -- 10.0 0.20 1/31/2001 107.2 -- 9.2 -0.94 2/28/2001 77.1 -- 12.2 0.20 3/30/2001 98.1 -- -10.7 -2.80 3/31/2001 -- -- 13.1 0.41 4/30/2001 133.6 -- 10.0 0.12 5/31/2001 318.3 -- -2.4 -1.36 6/30/2001 188 -- -22.2 -3.39 4/30/2002 409.6 -- -0.3 -1.27 5/31/2002 188.7 -- 11.5 0.40 6/30/2002 66.4 -- -6.8 -1.54 7/31/2002 157.1 -- 9.0 -0.33 8/31/2002 301 -- -5.8 -1.19 9/30/2002 164.2 -- -11.3 -2.30 10/31/2002 239.2 -- -9.1 -1.95 11/30/2002 175.5 -- 2.2 -0.42 1/31/2003 112.5 -- 7.3 -1.23 2/28/2003 61 -- 1.6 -1.59 3/31/2003 53.6 -- -9.8 -2.28 4/30/2003 337.5 -- -9.6 -2.24 5/30/2003 186.3 -- 2.0 -0.96 6/30/2003 184.8 -- -1.1 -0.70 7/31/2003 79.7 -- -0.8 -1.09 8/31/2003 243.6 -- -2.9 -1.55 9/30/2003 239.6 -- -7.4 -2.44
15
Table 3. Monthly rain isotope and rainfall data for the San Agustin rain gage site, USGS 182328066423500, with monthly rainfall totals from the Arecibo Observatory, NOAA station GHCND:RQC00660426.—Continued
[mm, millimeters; --, no data; md, more than half the days in month have missing data. Delta values are expressed in per mil (‰) differences relative to Vienna Standard Mean Ocean Water. San Agustin rainfall prior to 9/30/2008 was estimated from accumulated volume in the collector, by using the relation: (rainfall in mm) = (recovered volume in mL)/7.87276. See figure 1 and table 1 for location and site details]
1Collection date Arecibo rainfall (mm)
San Agustin rainfall (mm) δ2H (‰) δ18O (‰)
Monthly rain isotope data, San Agustin—Continued 10/23/2003 182.9 -- -14.7 -3.53 11/30/2003 263.6 -- -23.5 -4.46 12/31/2003 153.7 -- -4.6 -2.54 1/31/2004 32.5 -- 8.6 -1.06 2/29/2004 42.2 106.0 8.4 -1.09 3/31/2004 150.2 226.1 1.1 -1.98 4/30/2004 159 63.9 1.9 -1.56 5/31/2004 325.1 344.3 -5.6 -2.09 6/30/2004 140.7 93.9 -13.3 -2.82 7/31/2004 105.1 69.0 -10.6 -2.27 8/31/2004 224.2 43.4 2.8 -1.02 9/30/2004 312.3 280.4 -36.0 -5.92 10/31/2004 110.7 86.9 -7.1 -2.73 11/30/2004 369.7 356.4 -12.9 -3.51 12/31/2004 98.8 265.1 -2.2 -2.38 1/31/2005 3289.8 393.5 4.8 -1.53 2/28/2005 59.8 46.0 12.5 -0.68 3/31/2005 11.2 5.1 8.3 -0.89 4/30/2005 497.9 490.6 -2.8 -2.13 5/31/2005 383.3 319.4 -30.4 -5.14 6/30/2005 188.5 235.7 -22.2 -4.05 7/31/2005 165.7 263.2 -10.4 -2.59 8/30/2005 316.9 120.1 -5.4 -2.08 9/30/2005 159.2 239.4 -9.7 -2.75 10/31/2005 196.4 199.3 -40.9 -6.31 11/30/2005 172.6 127.8 -6.7 -2.51 12/31/2005 19.5 46.6 10.4 -0.82 1/31/06 178.6 173.7 5.6 -1.37 3/31/06 244.9 -- 1.8 -1.63 4/30/06 138.8 -- 0.9 -1.54 5/31/06 223.8 -- 2.2 -1.59 6/30/06 283.2 -- -8.3 -2.35 7/31/06 87.1 -- -10.1 -2.20 8/31/06 226 -- -16.3 -3.06 9/30/06 166.5 -- -8.9 -2.32 10/31/06 171.1 -- -24.2 -4.44 11/30/06 202.4 -- -13.1 -3.37 12/31/06 49.1 -- 0.3 -1.71
16
Table 3. Monthly rain isotope and rainfall data for the San Agustin rain gage site, USGS 182328066423500, with monthly rainfall totals from the Arecibo Observatory, NOAA station GHCND:RQC00660426.—Continued
[mm, millimeters; --, no data; md, more than half the days in month have missing data. Delta values are expressed in per mil (‰) differences relative to Vienna Standard Mean Ocean Water. San Agustin rainfall prior to 9/30/2008 was estimated from accumulated volume in the collector, by using the relation: (rainfall in mm) = (recovered volume in mL)/7.87276. See figure 1 and table 1 for location and site details]
1Collection date Arecibo rainfall (mm)
San Agustin rainfall (mm) δ2H (‰) δ18O (‰)
Monthly rain isotope data, San Agustin—Continued 1/31/07 65.8 -- 4.0 -1.10 2/28/07 175.8 -- 8.2 -1.03 3/31/07 216.8 -- -15.6 -3.56 4/30/07 199.9 -- 2.7 -1.50 5/31/07 276.6 -- -6.3 -2.12 6/30/07 132.1 -- -24.4 -4.01 7/31/07 72.1 -- 0.1 -1.03 8/30/07 258.8 172.7 -7.8 -2.24 9/30/07 165.8 176.5 -10.0 -2.67 10/31/07 130.4 172.7 -35.8 -5.83 11/30/07 158.2 -- -3.0 -2.14 9/30/08 447.3 324.8 -22.0 -4.37 10/31/08 152.2 219.6 -19.3 -3.93 11/30/08 245.3 234.4 -5.8 -2.43 12/31/08 201.5 195.4 -2.7 -2.04 1/31/09 77.1 128.2 -7.4 -2.32 2/28/09 202.9 171.0 -3.2 -2.14 3/31/09 170.5 112.8 8.0 -0.58 4/30/09 56.7 72.4 -0.8 -1.33 5/31/09 194.3 252.0 -3.4 -1.85 6/30/09 253.2 232.8 -2.0 -1.73 7/31/09 137.3 55.2 -19.8 -3.52 8/31/09 227.9 156.2 -0.9 -1.51 9/30/09 281.2 189.6 -23.8 -4.02 10/31/09 109.7 157.0 -7.9 -2.52 11/30/09 187.4 120.8 -11.9 -3.19 12/31/09 45.1 92.0 0.5 -1.64 1/31/10 264.2 260.4 7.4 -1.38 2/28/10 64.6 153 7.2 -1.16 3/31/10 89.7 98.2 6.5 -1.66 4/30/10 277.5 170.6 -0.4 -1.62 5/31/10 448 422.2 -9.7 -2.46 6/30/10 214 141.2 -25.7 -3.96 7/31/10 216.6 187.6 -10.8 -2.48 8/31/10 265.6 237.4 -23.0 -4.42 9/30/10 193.1 204.2 -13.0 -3.08 10/31/10 244.9 354.2 -18.2 -3.89 11/30/10 155.9 154.2 -11.3 -3.42
17
Table 3. Monthly rain isotope and rainfall data for the San Agustin rain gage site, USGS 182328066423500, with monthly rainfall totals from the Arecibo Observatory, NOAA station GHCND:RQC00660426.—Continued
[mm, millimeters; --, no data; md, more than half the days in month have missing data. Delta values are expressed in per mil (‰) differences relative to Vienna Standard Mean Ocean Water. San Agustin rainfall prior to 9/30/2008 was estimated from accumulated volume in the collector, by using the relation: (rainfall in mm) = (recovered volume in mL)/7.87276. See figure 1 and table 1 for location and site details]
1Collection date Arecibo rainfall (mm)
San Agustin rainfall (mm) δ2H (‰) δ18O (‰)
Monthly rain isotope data, San Agustin—Continued 12/31/10 252.1 421.2 1.3 -2.35 1/31/11 39.9 56.6 10.5 -0.73 2/28/11 56.5 66.6 3.5 -1.67 3/31/11 183.9 132.8 7.2 -0.89 4/30/11 114.5 109.6 -2.4 -1.98 5/31/11 243.4 274.4 -10.9 -2.79 6/30/11 280.7 223.4 -26.5 -4.48 7/31/11 298.4 190.4 -10.3 -2.38 8/31/11 178.5 310.0 -26.7 -4.64 9/30/11 285.2 189.8 -17.3 -3.58 10/31/11 259.3 124.4 2.7 -1.33 11/30/11 371.6 395.2 -15.2 -3.16 12/31/11 145 168.4 -8.9 -2.42 1/31/12 130.9 94.8 8.8 -0.32 2/29/12 143.1 195.4 6.0 -0.80 3/31/12 416.3 179.2 2.5 -1.24 4/30/12 299 135.2 -0.7 -1.53 5/31/12 218.5 327 -10.8 -2.76 6/30/12 50.3 32.2 1.6 -1.07 7/31/12 195.9 165.6 -1.6 -1.67 8/31/12 229.7 180.8 -17.8 -3.36 9/30/12 160.8 135 -1.7 -1.92 10/31/12 305.3 191.8 -21.3 -4.21 11/30/12 272.4 297.4 -6.6 -2.42 12/31/12 93.4 111.6 0.0 -1.94 1/31/13 71.3 71.0 11.5* 0.82* 2/28/13 52.6 16.4 9.5* 0.75* 3/31/13 210.9 198.6 11.6 -0.94 4/30/13 131.1 50.2 9.4 -0.82 5/31/13 446.8 344.6 -10.8 -2.92 6/30/13 120.4 108.0 4.6 -0.94 7/31/13 262.5 264.4 -10.5 -2.61
1Beginning date of composite sample is the first day of the month, except where noted. 2Beginning date for this sample is 9/16/1995. 3Ten days of missing rainfall data in the month ending 1/31/2005. *Isotopic composition for these samples appears fractionated due to evaporation.
18
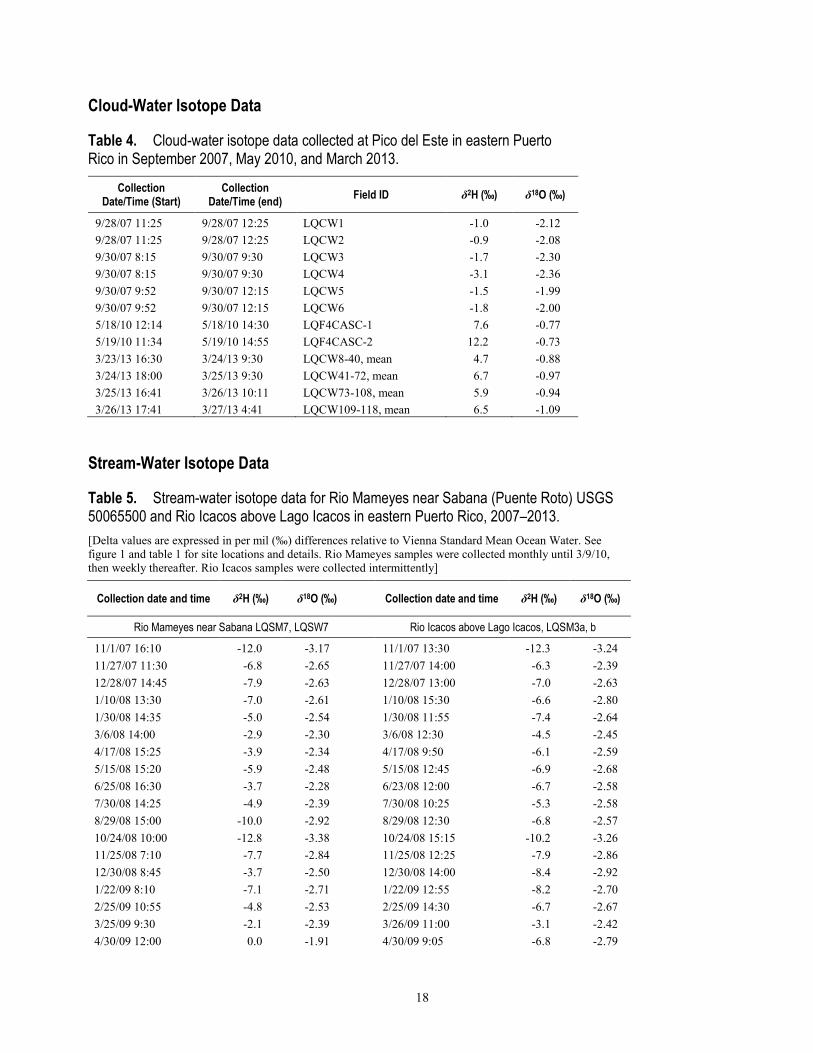
Cloud-Water Isotope Data
Table 4. Cloud-water isotope data collected at Pico del Este in eastern Puerto Rico in September 2007, May 2010, and March 2013.
Collection Date/Time (Start)
Collection Date/Time (end) Field ID δ2H (‰) δ18O (‰)
9/28/07 11:25 9/28/07 12:25 LQCW1 -1.0 -2.12 9/28/07 11:25 9/28/07 12:25 LQCW2 -0.9 -2.08 9/30/07 8:15 9/30/07 9:30 LQCW3 -1.7 -2.30 9/30/07 8:15 9/30/07 9:30 LQCW4 -3.1 -2.36 9/30/07 9:52 9/30/07 12:15 LQCW5 -1.5 -1.99 9/30/07 9:52 9/30/07 12:15 LQCW6 -1.8 -2.00 5/18/10 12:14 5/18/10 14:30 LQF4CASC-1 7.6 -0.77 5/19/10 11:34 5/19/10 14:55 LQF4CASC-2 12.2 -0.73 3/23/13 16:30 3/24/13 9:30 LQCW8-40, mean 4.7 -0.88 3/24/13 18:00 3/25/13 9:30 LQCW41-72, mean 6.7 -0.97 3/25/13 16:41 3/26/13 10:11 LQCW73-108, mean 5.9 -0.94 3/26/13 17:41 3/27/13 4:41 LQCW109-118, mean 6.5 -1.09
Stream-Water Isotope Data
Table 5. Stream-water isotope data for Rio Mameyes near Sabana (Puente Roto) USGS 50065500 and Rio Icacos above Lago Icacos in eastern Puerto Rico, 2007–2013. [Delta values are expressed in per mil (‰) differences relative to Vienna Standard Mean Ocean Water. See figure 1 and table 1 for site locations and details. Rio Mameyes samples were collected monthly until 3/9/10, then weekly thereafter. Rio Icacos samples were collected intermittently]
Collection date and time δ2H (‰) δ18O (‰) Collection date and time δ2H (‰) δ18O (‰)
Rio Mameyes near Sabana LQSM7, LQSW7 Rio Icacos above Lago Icacos, LQSM3a, b
11/1/07 16:10 -12.0 -3.17 11/1/07 13:30 -12.3 -3.24 11/27/07 11:30 -6.8 -2.65 11/27/07 14:00 -6.3 -2.39 12/28/07 14:45 -7.9 -2.63 12/28/07 13:00 -7.0 -2.63 1/10/08 13:30 -7.0 -2.61 1/10/08 15:30 -6.6 -2.80 1/30/08 14:35 -5.0 -2.54 1/30/08 11:55 -7.4 -2.64 3/6/08 14:00 -2.9 -2.30 3/6/08 12:30 -4.5 -2.45 4/17/08 15:25 -3.9 -2.34 4/17/08 9:50 -6.1 -2.59 5/15/08 15:20 -5.9 -2.48 5/15/08 12:45 -6.9 -2.68 6/25/08 16:30 -3.7 -2.28 6/23/08 12:00 -6.7 -2.58 7/30/08 14:25 -4.9 -2.39 7/30/08 10:25 -5.3 -2.58 8/29/08 15:00 -10.0 -2.92 8/29/08 12:30 -6.8 -2.57 10/24/08 10:00 -12.8 -3.38 10/24/08 15:15 -10.2 -3.26 11/25/08 7:10 -7.7 -2.84 11/25/08 12:25 -7.9 -2.86 12/30/08 8:45 -3.7 -2.50 12/30/08 14:00 -8.4 -2.92 1/22/09 8:10 -7.1 -2.71 1/22/09 12:55 -8.2 -2.70 2/25/09 10:55 -4.8 -2.53 2/25/09 14:30 -6.7 -2.67 3/25/09 9:30 -2.1 -2.39 3/26/09 11:00 -3.1 -2.42 4/30/09 12:00 0.0 -1.91 4/30/09 9:05 -6.8 -2.79
19
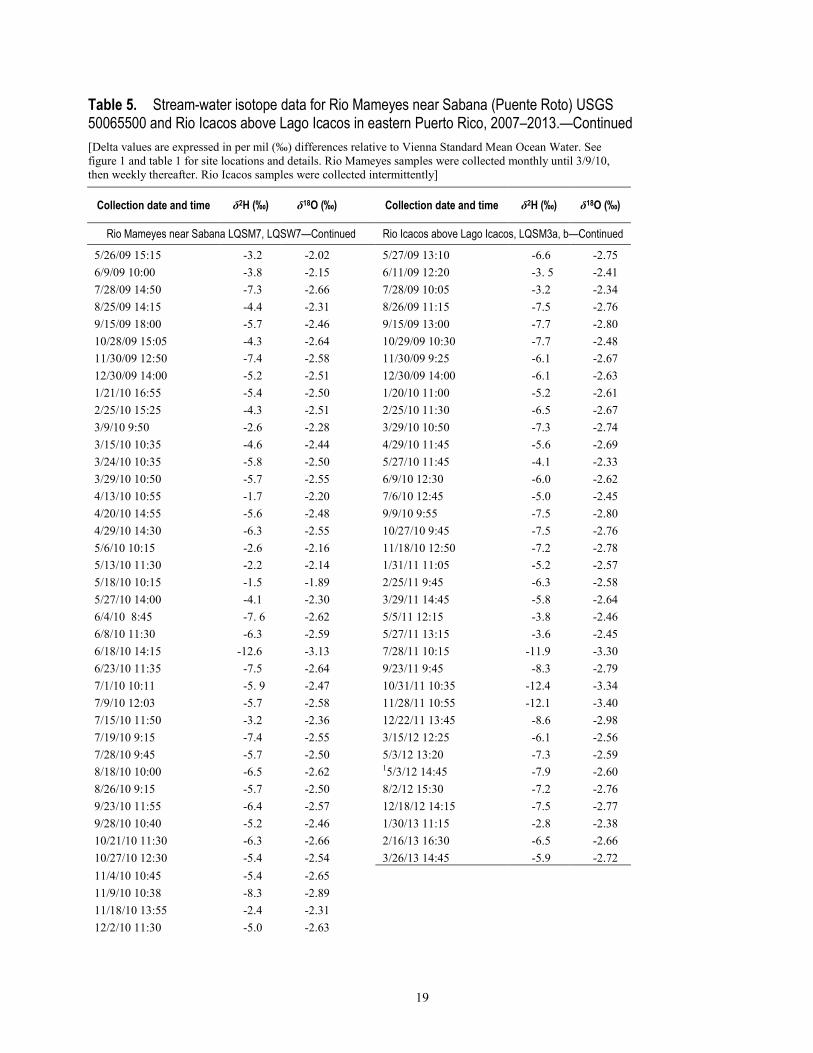
Table 5. Stream-water isotope data for Rio Mameyes near Sabana (Puente Roto) USGS 50065500 and Rio Icacos above Lago Icacos in eastern Puerto Rico, 2007–2013.—Continued [Delta values are expressed in per mil (‰) differences relative to Vienna Standard Mean Ocean Water. See figure 1 and table 1 for site locations and details. Rio Mameyes samples were collected monthly until 3/9/10, then weekly thereafter. Rio Icacos samples were collected intermittently]
Collection date and time δ2H (‰) δ18O (‰) Collection date and time δ2H (‰) δ18O (‰)
Rio Mameyes near Sabana LQSM7, LQSW7—Continued Rio Icacos above Lago Icacos, LQSM3a, b—Continued
5/26/09 15:15 -3.2 -2.02 5/27/09 13:10 -6.6 -2.75 6/9/09 10:00 -3.8 -2.15 6/11/09 12:20 -3. 5 -2.41 7/28/09 14:50 -7.3 -2.66 7/28/09 10:05 -3.2 -2.34 8/25/09 14:15 -4.4 -2.31 8/26/09 11:15 -7.5 -2.76 9/15/09 18:00 -5.7 -2.46 9/15/09 13:00 -7.7 -2.80 10/28/09 15:05 -4.3 -2.64 10/29/09 10:30 -7.7 -2.48 11/30/09 12:50 -7.4 -2.58 11/30/09 9:25 -6.1 -2.67 12/30/09 14:00 -5.2 -2.51 12/30/09 14:00 -6.1 -2.63 1/21/10 16:55 -5.4 -2.50 1/20/10 11:00 -5.2 -2.61 2/25/10 15:25 -4.3 -2.51 2/25/10 11:30 -6.5 -2.67 3/9/10 9:50 -2.6 -2.28 3/29/10 10:50 -7.3 -2.74 3/15/10 10:35 -4.6 -2.44 4/29/10 11:45 -5.6 -2.69 3/24/10 10:35 -5.8 -2.50 5/27/10 11:45 -4.1 -2.33 3/29/10 10:50 -5.7 -2.55 6/9/10 12:30 -6.0 -2.62 4/13/10 10:55 -1.7 -2.20 7/6/10 12:45 -5.0 -2.45 4/20/10 14:55 -5.6 -2.48 9/9/10 9:55 -7.5 -2.80 4/29/10 14:30 -6.3 -2.55 10/27/10 9:45 -7.5 -2.76 5/6/10 10:15 -2.6 -2.16 11/18/10 12:50 -7.2 -2.78 5/13/10 11:30 -2.2 -2.14 1/31/11 11:05 -5.2 -2.57 5/18/10 10:15 -1.5 -1.89 2/25/11 9:45 -6.3 -2.58 5/27/10 14:00 -4.1 -2.30 3/29/11 14:45 -5.8 -2.64 6/4/10 8:45 -7. 6 -2.62 5/5/11 12:15 -3.8 -2.46 6/8/10 11:30 -6.3 -2.59 5/27/11 13:15 -3.6 -2.45 6/18/10 14:15 -12.6 -3.13 7/28/11 10:15 -11.9 -3.30 6/23/10 11:35 -7.5 -2.64 9/23/11 9:45 -8.3 -2.79 7/1/10 10:11 -5. 9 -2.47 10/31/11 10:35 -12.4 -3.34 7/9/10 12:03 -5.7 -2.58 11/28/11 10:55 -12.1 -3.40 7/15/10 11:50 -3.2 -2.36 12/22/11 13:45 -8.6 -2.98 7/19/10 9:15 -7.4 -2.55 3/15/12 12:25 -6.1 -2.56 7/28/10 9:45 -5.7 -2.50 5/3/12 13:20 -7.3 -2.59 8/18/10 10:00 -6.5 -2.62 15/3/12 14:45 -7.9 -2.60 8/26/10 9:15 -5.7 -2.50 8/2/12 15:30 -7.2 -2.76 9/23/10 11:55 -6.4 -2.57 12/18/12 14:15 -7.5 -2.77 9/28/10 10:40 -5.2 -2.46 1/30/13 11:15 -2.8 -2.38 10/21/10 11:30 -6.3 -2.66 2/16/13 16:30 -6.5 -2.66 10/27/10 12:30 -5.4 -2.54 3/26/13 14:45 -5.9 -2.72 11/4/10 10:45 -5.4 -2.65 11/9/10 10:38 -8.3 -2.89 11/18/10 13:55 -2.4 -2.31 12/2/10 11:30 -5.0 -2.63
20
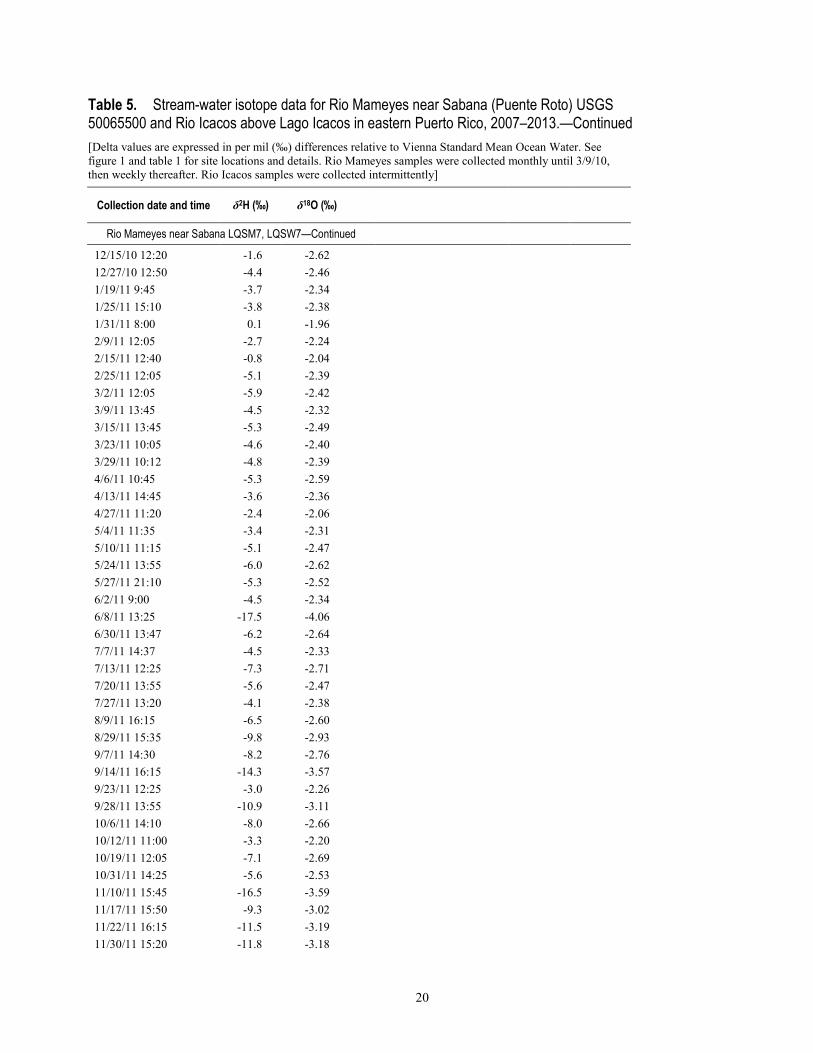
Table 5. Stream-water isotope data for Rio Mameyes near Sabana (Puente Roto) USGS 50065500 and Rio Icacos above Lago Icacos in eastern Puerto Rico, 2007–2013.—Continued [Delta values are expressed in per mil (‰) differences relative to Vienna Standard Mean Ocean Water. See figure 1 and table 1 for site locations and details. Rio Mameyes samples were collected monthly until 3/9/10, then weekly thereafter. Rio Icacos samples were collected intermittently]
Collection date and time δ2H (‰) δ18O (‰)
Rio Mameyes near Sabana LQSM7, LQSW7—Continued
12/15/10 12:20 -1.6 -2.62 12/27/10 12:50 -4.4 -2.46 1/19/11 9:45 -3.7 -2.34 1/25/11 15:10 -3.8 -2.38 1/31/11 8:00 0.1 -1.96 2/9/11 12:05 -2.7 -2.24 2/15/11 12:40 -0.8 -2.04 2/25/11 12:05 -5.1 -2.39 3/2/11 12:05 -5.9 -2.42 3/9/11 13:45 -4.5 -2.32 3/15/11 13:45 -5.3 -2.49 3/23/11 10:05 -4.6 -2.40 3/29/11 10:12 -4.8 -2.39 4/6/11 10:45 -5.3 -2.59 4/13/11 14:45 -3.6 -2.36 4/27/11 11:20 -2.4 -2.06 5/4/11 11:35 -3.4 -2.31 5/10/11 11:15 -5.1 -2.47 5/24/11 13:55 -6.0 -2.62 5/27/11 21:10 -5.3 -2.52 6/2/11 9:00 -4.5 -2.34 6/8/11 13:25 -17.5 -4.06 6/30/11 13:47 -6.2 -2.64 7/7/11 14:37 -4.5 -2.33 7/13/11 12:25 -7.3 -2.71 7/20/11 13:55 -5.6 -2.47 7/27/11 13:20 -4.1 -2.38 8/9/11 16:15 -6.5 -2.60 8/29/11 15:35 -9.8 -2.93 9/7/11 14:30 -8.2 -2.76 9/14/11 16:15 -14.3 -3.57 9/23/11 12:25 -3.0 -2.26 9/28/11 13:55 -10.9 -3.11 10/6/11 14:10 -8.0 -2.66 10/12/11 11:00 -3.3 -2.20 10/19/11 12:05 -7.1 -2.69 10/31/11 14:25 -5.6 -2.53 11/10/11 15:45 -16.5 -3.59 11/17/11 15:50 -9.3 -3.02 11/22/11 16:15 -11.5 -3.19 11/30/11 15:20 -11.8 -3.18

21
Table 5. Stream-water isotope data for Rio Mameyes near Sabana (Puente Roto) USGS 50065500 and Rio Icacos above Lago Icacos in eastern Puerto Rico, 2007–2013.—Continued [Delta values are expressed in per mil (‰) differences relative to Vienna Standard Mean Ocean Water. See figure 1 and table 1 for site locations and details. Rio Mameyes samples were collected monthly until 3/9/10, then weekly thereafter. Rio Icacos samples were collected intermittently]
Collection date and time δ2H (‰) δ18O (‰)
Rio Mameyes near Sabana LQSM7, LQSW7—Continued
12/7/11 15:25 -6.2 -2.60 12/14/11 14:50 -9.7 -2.95 12/21/11 14:35 -7.3 -2.72 12/29/11 14:05 -5.9 -2.60 1/11/12 15:10 -4.2 -2.46 1/19/12 14:00 -4.3 -2.51 1/26/12 14:20 -5.7 -2.62 2/1/12 15:15 -4.4 -2.49 2/8/12 14:55 -4.4 -2.36 2/17/12 14:45 -5.0 -2.61 2/21/12 12:40 -3.1 -2.34 2/28/12 14:00 -4.7 -2.56 3/6/12 15:40 -5.8 -2.54 3/15/12 14:35 -4.5 -2.41 3/28/12 10:20 -6.2 -2.56 4/3/12 13:10 -8.3 -2.72 4/11/12 14:10 -3.1 -2.34 4/18/12 14:05 -7.6 -2.64 4/25/12 14:40 -7.7 -2.58 5/1/12 13:10 -6.3 -2.56 5/3/12 15:55 -6.3 -2.51 5/7/12 15:55 -5.7 -2.67 5/15/12 14:15 -7.9 -2.80 5/22/12 12:05 -3.9 -2.26 5/30/12 17:30 -5.9 -2.57 6/6/12 10:35 -6.8 -2.70 6/13/12 14:55 -7.4 -2.68 6/20/12 18:00 -7.3 -2.45 6/28/12 11:05 -7.6 -2.55 7/3/12 12:45 -6.1 -2.49 7/5/12 13:05 -8.5 -2.74 7/17/12 07:30 -4.4 -2.36 7/31/12 14:00 -8.9 -2.68 8/2/12 13:30 -7.2 -2.65 8/7/12 10:45 -7.6 -2.66 8/15/12 11:45 -5.9 -2.48 8/28/12 15:15 -10.2 -3.09 9/6/12 13:40 -7.5 -2.67 9/13/12 13:45 -6.7 -2.61 9/18/12 13:30 -7.1 -2.66 9/27/12 16:15 -8.3 -2.85
22
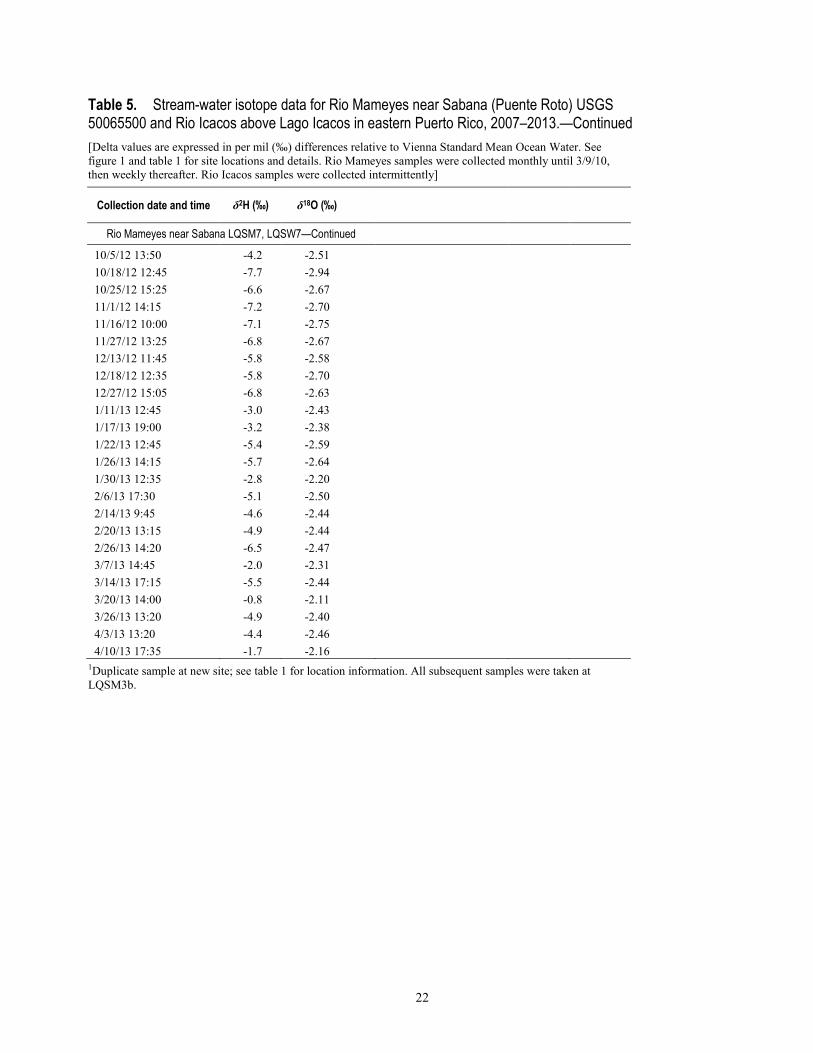
Table 5. Stream-water isotope data for Rio Mameyes near Sabana (Puente Roto) USGS 50065500 and Rio Icacos above Lago Icacos in eastern Puerto Rico, 2007–2013.—Continued [Delta values are expressed in per mil (‰) differences relative to Vienna Standard Mean Ocean Water. See figure 1 and table 1 for site locations and details. Rio Mameyes samples were collected monthly until 3/9/10, then weekly thereafter. Rio Icacos samples were collected intermittently]
Collection date and time δ2H (‰) δ18O (‰)
Rio Mameyes near Sabana LQSM7, LQSW7—Continued
10/5/12 13:50 -4.2 -2.51 10/18/12 12:45 -7.7 -2.94 10/25/12 15:25 -6.6 -2.67 11/1/12 14:15 -7.2 -2.70 11/16/12 10:00 -7.1 -2.75 11/27/12 13:25 -6.8 -2.67 12/13/12 11:45 -5.8 -2.58 12/18/12 12:35 -5.8 -2.70 12/27/12 15:05 -6.8 -2.63 1/11/13 12:45 -3.0 -2.43 1/17/13 19:00 -3.2 -2.38 1/22/13 12:45 -5.4 -2.59 1/26/13 14:15 -5.7 -2.64 1/30/13 12:35 -2.8 -2.20 2/6/13 17:30 -5.1 -2.50 2/14/13 9:45 -4.6 -2.44 2/20/13 13:15 -4.9 -2.44 2/26/13 14:20 -6.5 -2.47 3/7/13 14:45 -2.0 -2.31 3/14/13 17:15 -5.5 -2.44 3/20/13 14:00 -0.8 -2.11 3/26/13 13:20 -4.9 -2.40 4/3/13 13:20 -4.4 -2.46 4/10/13 17:35 -1.7 -2.16
1Duplicate sample at new site; see table 1 for location information. All subsequent samples were taken at LQSM3b.
23
Table 6. Contemporaneous stream stable isotope data collected from sites at different elevations in the Rio Mameyes and Rio Blanco/Rio Icacos watersheds in the Luquillo Mountains study area, eastern Puerto Rico. [Delta values are expressed in per mil (‰) differences relative to Vienna Standard Mean Ocean Water. See figure 1 and table 1 for site locations and details. Table 6A, data sorted by site; table 6B, data sorted by collection date]
Site ID Collection date δ2H (‰) δ18O (‰)
A. Contemporaneous stream isotope data by site LQS1 2/9/06 10:55 -4.9 -2.69 LQS1 11/7/06 -6.7 -2.68 LQS1 9/29/07 14:35 -5.9 -2.58 LQS2 2/9/06 16:00 -4.8 -2.53 LQS2 11/6/06 -8.1 -2.81 LQS3 2/9/06 14:40 -5.0 -2.65 LQS3 11/6/06 -7.6 -2.75 LQS3 9/27/07 12:15 -7.1 -2.70 LQS3 1/11/10 16:30 -5.6 -2.60 LQS3 6/23/08 12:00 -6.7 -2.58 LQS4 2/9/06 17:30 -6.6 -2.78 LQS4 11/4/06 -7.8 -2.72 LQS4 9/28/07 14:15 -7.3 -2.66 LQS4 9/30/07 -6.1 -2.63 LQS4 6/24/08 14:05 -5.5 -2.22 LQS4 1/11/10 16:45 -6.5 -2.66 LQS5 2/10/06 -10.1 -3.27 LQS5 11/4/06 -9.3 -2.95 LQS5 9/28/07 14:55 -6.4 -2.64 LQS5 1/11/10 17:25 -6.1 -2.78 LQS6 2/10/06 -3.9 -2.64 LQS6 11/4/06 -9.4 -2.90 LQS6 9/30/07 -5.9 -2.78 LQS7 2/10/06 10:30 -5.3 -2.58 LQS7 11/4/06 -7.6 -2.62 LQS7 9/29/07 10:15 -4.7 -2.43 LQS7 1/9/10 14:40 -2.3 -2.44 LQS7 6/25/08 16:30 -3.7 -2.28 LQS8 2/10/06 11:15 -6.0 -2.47 LQS8 11/4/06 -6.9 -2.54 LQS8 9/28/07 9:40 -5.2 -2.58 LQS9 2/10/06 13:55 -5.2 -2.49 LQS9 11/4/06 -7.2 -2.54 LQS9 9/29/07 15:30 -4.9 -2.40 LQS9 1/10/10 10:45 -3.6 -2.37 LQS10 2/10/06 14:05 -4.3 -2.15 LQS10 11/4/06 -6.1 -2.32 LQS10 9/29/07 15:40 -5.0 -2.14 LQS11 2/10/06 14:40 -4.5 -2.35
24
Table 6. Contemporaneous stream stable isotope data collected from sites at different elevations in the Rio Mameyes and Rio Blanco/Rio Icacos watersheds in the Luquillo Mountains study area, eastern Puerto Rico.—Continued [Delta values are expressed in per mil (‰) differences relative to Vienna Standard Mean Ocean Water. See figure 1 and table 1 for site locations and details. Table 6A, data sorted by site; table 6B, data sorted by collection date]
Site ID Collection date δ2H (‰) δ18O (‰)
A. Contemporaneous stream isotope data by site—Continued LQS11 11/4/06 -6.1 -2.50 LQS11 9/29/07 17:00 -5.2 -2.37 LQS11 6/25/08 11:55 -3.6 -2.02 LQS11 1/10/10 11:15 -2.9 -2.24 LQS12 2/11/06 15:20 -4.8 -2.52 LQS12 11/4/06 -6.4 -2.71 LQS12 9/29/07 13:10 -5.0 -2.52 LQS12 6/24/08 16:40 -3.3 -1.94 LQS12 1/10/10 14:15 -3.5 -2.46 LQS13 2/11/06 16:30 -4.2 -2.58 LQS13 11/4/06 -5.6 -2.66 LQS13 9/28/07 16:15 -6.5 -2.61 LQS13 6/24/08 15:20 -2.9 -2.00 LQS13 1/9/10 15:28 -1.6 -2.29 LQS14 11/6/06 -8.3 -2.86 LQS14 9/27/07 13:55 -8.3 -2.99 LQS15 11/6/06 -8.1 -2.74 LQS15 9/27/07 15:55 -8.1 -2.77 LQS15 6/23/08 14:48 -7.1 -2.40 LQS15 1/11/10 13:55 -5.4 -2.52 LQS16 11/6/06 -7.3 -2.60 LQS16 9/27/07 15:15 -10.0 -2.97 LQS17 1/9/10 12:40 1.5 -1.82 LQS18 1/13/10 11:00 -6.6 -2.78 LQS18 5/21/10 15:23 -4.6 -2.58 LQS19 1/26/10 9:00 -5.6 -2.49 LQS19 5/22/10 -6.5 -2.60
B. Contemporaneous stream isotope data by collection date LQS1 2/9/06 10:55 -4.9 -2.69 LQS3 2/9/06 14:40 -5.0 -2.65 LQS2 2/9/06 16:00 -4.8 -2.53 LQS4 2/9/06 17:30 -6.6 -2.78 LQS5 2/10/06 -10.1 -3.27 LQS6 2/10/06 -3.9 -2.64 LQS7 2/10/06 10:30 -5.3 -2.58 LQS8 2/10/06 11:15 -6.0 -2.47 LQS9 2/10/06 13:55 -5.2 -2.49 LQS10 2/10/06 14:05 -4.3 -2.15 LQS11 2/10/06 14:40 -4.5 -2.35
25
Table 6. Contemporaneous stream stable isotope data collected from sites at different elevations in the Rio Mameyes and Rio Blanco/Rio Icacos watersheds in the Luquillo Mountains study area, eastern Puerto Rico.—Continued [Delta values are expressed in per mil (‰) differences relative to Vienna Standard Mean Ocean Water. See figure 1 and table 1 for site locations and details. Table 6A, data sorted by site; table 6B, data sorted by collection date]
Site ID Collection date δ2H (‰) δ18O (‰)
B. Contemporaneous stream isotope data by collection date LQS12 2/11/06 15:20 -4.8 -2.52 LQS13 2/11/06 16:30 -4.2 -2.58 LQS4 11/4/06 -7.8 -2.72 LQS5 11/4/06 -9.3 -2.95 LQS6 11/4/06 -9.4 -2.90 LQS7 11/4/06 -7.6 -2.62 LQS8 11/4/06 -6.9 -2.54 LQS9 11/4/06 -7.2 -2.54 LQS10 11/4/06 -6.1 -2.32 LQS11 11/4/06 -6.1 -2.50 LQS12 11/4/06 -6.4 -2.71 LQS13 11/4/06 -5.6 -2.66 LQS2 11/6/06 -8.1 -2.81 LQS3 11/6/06 -7.6 -2.75 LQS14 11/6/06 -8.3 -2.86 LQS15 11/6/06 -8.1 -2.74 LQS16 11/6/06 -7.3 -2.60 LQS1 11/7/06 -6.7 -2.68 LQS3 9/27/07 12:15 -7.1 -2.70 LQS14 9/27/07 13:55 -8.3 -2.99 LQS16 9/27/07 15:15 -10.0 -2.97 LQS15 9/27/07 15:55 -8.1 -2.77 LQS8 9/28/07 9:40 -5.2 -2.58 LQS4 9/28/07 14:15 -7.3 -2.66 LQS5 9/28/07 14:55 -6.4 -2.64 LQS13 9/28/07 16:15 -6.5 -2.61 LQS7 9/29/07 10:15 -4.7 -2.43 LQS12 9/29/07 13:10 -5.0 -2.52 LQS1 9/29/07 14:35 -5.9 -2.58 LQS9 9/29/07 15:30 -4.9 -2.40 LQS10 9/29/07 15:40 -5.0 -2.14 LQS11 9/29/07 17:00 -5.2 -2.37 LQS4 9/30/07 -6.1 -2.63 LQS6 9/30/07 -5.9 -2.78 LQS3 6/23/08 12:00 -6.7 -2.58 LQS15 6/23/08 14:48 -7.1 -2.40 LQS4 6/24/08 14:05 -5.5 -2.22 LQS13 6/24/08 15:20 -2.9 -2.00 LQS12 6/24/08 16:40 -3.3 -1.94
26
Table 6. Contemporaneous stream stable isotope data collected from sites at different elevations in the Rio Mameyes and Rio Blanco/Rio Icacos watersheds in the Luquillo Mountains study area, eastern Puerto Rico.—Continued [Delta values are expressed in per mil (‰) differences relative to Vienna Standard Mean Ocean Water. See figure 1 and table 1 for site locations and details. Table 6A, data sorted by site; table 6B, data sorted by collection date]
Site ID Collection date δ2H (‰) δ18O (‰)
B. Contemporaneous stream isotope data by collection date—Continued LQS11 6/25/08 11:55 -3.6 -2.02 LQS7 6/25/08 16:30 -3.7 -2.28 LQS17 1/9/10 12:40 1.5 -1.82 LQS7 1/9/10 14:40 -2.3 -2.44 LQS13 1/9/10 15:28 -1.6 -2.29 LQS9 1/10/10 10:45 -3.6 -2.37 LQS11 1/10/10 11:15 -2.9 -2.24 LQS12 1/10/10 14:15 -3.5 -2.46 LQS15 1/11/10 13:55 -5.4 -2.52 LQS3 1/11/10 16:30 -5.6 -2.60 LQS4 1/11/10 16:45 -6.5 -2.66 LQS5 1/11/10 17:25 -6.1 -2.78 LQS18 1/13/10 11:00 -6.6 -2.78 LQS19 1/26/10 9:00 -5.6 -2.49 LQS18 5/21/10 15:23 -4.6 -2.58 LQS19 5/22/10 -6.5 -2.60
Groundwater Isotope Data
Table 7. Groundwater stable isotope data from sites in the Luquillo Mountains study area, eastern Puerto Rico. [Delta values are expressed in per mil (‰) differences relative to Vienna Standard Mean Ocean Water. See figure 1 and table 1 for site locations and details]
Well ID Collection date and time δ2H (‰) δ18O (‰)
Groundwater stable isotope data LQGW1 1/13/10 10:02 -6.9 -2.82 LQGW1 5/21/10 15:00 -6.7 -2.74 LQGW1 6/16/11 10:45 -6.8 -2.57 LQGW1 5/30/12 12:55 -10.7 -3.08 LQGW2 1/13/10 10:20 -3.3 -2.32 LQGW3 1/13/10 10:32 -2.5 -2.05 LQGW4 1/13/10 10:52 -5.4 -2.59 LQGW5 1/26/10 9:00 -5.6 -2.58 LQGW6 1/26/10 9:00 -3.8 -2.29 LQGW6 5/21/10 15:15 -0.7 -2.04 LQGW7 1/26/10 9:00 -6.2 -2.52

27
Table 7. Groundwater stable isotope data from sites in the Luquillo Mountains study area, eastern Puerto Rico.—Continued [Delta values are expressed in per mil (‰) differences relative to Vienna Standard Mean Ocean Water. See figure 1 and table 1 for site locations and details]
Well ID Collection date and time δ2H (‰) δ18O (‰)
Groundwater stable isotope data—Continued LQGW7 5/21/10 14:45 -4.5 -2.52 LQGW8 1/26/10 9:00 -2.2 -2.06 LQGW8 5/21/10 14:55 -1.5 -2.08 LQGW9 1/26/10 9:00 -3.9 -2.46 LQGW9 5/21/10 15:40 -3.4 -2.36 LQGW10 1/26/10 2.0 -1.63 LQGW11 1/26/10 -6.0 -2.49 LQGW12 1/26/10 5.7 -1.40 LQGW13 5/21/10 15:35 -6.8 -2.63 LQGW14 5/22/10 2.3 -1.52 LQGW15 6/15/11 10:45 -6.9 -2.25 LQGW15 5/25/12 12:30 -6.7 -2.27 LQGW16 6/21/11 14:35 -10.1 -2.90 LQGW16 5/29/12 10:15 -6.0 -2.70 LQGW17 6/16/11 10:00 -5.5 -2.61 LQGW17 6/1/12 12:05 -10.3 -2.97 LQGW17 6/11/12 10:30 -8.8 -3.06 LQGW17 6/13/12 9:50 -9.6 -2.88 LQGW17 6/17/12 14:00 -9.6 -3.02 LQGW17 6/18/12 15:00 -9.2 -2.97 LQGW17 6/20/12 10:25 -8.8 -2.93 LQGW17 6/27/12 11:07 -8.5 -2.98 LQGW17 7/2/12 13:41 -9.0 -3.06 LQGW17 7/7/12 11:30 -9.0 -2.61 LQGW17 7/9/12 16:50 -9.2 -2.67 LQGW17 7/11/12 10:19 -9.4 -3.03 LQGW17 7/15/12 13:00 -8.4 -2.73 LQGW17 7/18/12 16:00 -9.4 -3.10 LQGW17 8/16/12 12:30 -10.0 -3.14 LQGW17 8/18/12 12:30 -11.3 -3.11 LQGW17 8/22/12 15:00 -11.4 -3.15 LQGW18 6/16/11 9:00 -2.2 -1.96 LQGW19 6/21/11 14:59 -6.5 -2.80 LQGW19 5/29/12 11:10 -6.5 -2.72 LQGW20 6/21/11 11:04 -9.3 -2.61 LQGW20 5/25/12 13:45 -9.0 -2.63 LQGW21 5/29/12 12:00 -4.5 -2.33 LQGW22 6/5/12 10:00 -2.8 -1.75 LQGW23 7/15/12 11:30 -5.2 -2.50
28
Acknowledgments For the San Agustin dataset, Fernando Gomez-Gomez, USGS Caribbean Water Science Center
(CWSC; retired), collected the samples for the period of August 1994 to October 2007, and Sigfredo Torres-González (CWSC) collected the samples November 2007 to July 2013. Joe Orlando (Pennsylvania State University) collected samples from wells LGW17, LGW22, and LGW23. Haiping Qi, Jennifer Lorenz, and Lauren Tarbox of the Reston Stable Isotope Laboratory analyzed the samples. We thank Francisco Maldonado for drafting figure 1, and reviews by Jeanne Jaeschke, Dorothy Tepper, and Sigfredo Torres-González improved the manuscript substantially.
References Cited Coplen, T.B., 1994, Reporting of stable hydrogen, carbon, and oxygen isotopic abundances: Pure and
Applied Chemistry, v. 66, p. 273–276.
Coplen, T.B., Wildman, J.D. and Chen, J., 1991, Improvements in the gaseous hydrogen-water equilibration technique for hydrogen isotope ratio analysis: Analytical Chemistry, v. 63, p. 910–912.
Daube, Jr., B., Kimball, K.D., Lamar, P.A., and Weathers, K.C., 1987, Two new ground-level cloud water sampler designs which reduce rain contamination: Atmospheric Environment, v. 21, p. 893–900.
Epstein, S., and Mayeda, T., 1953, Variation of O-18 content of water from natural sources: Geochimica Cosmochimica Acta, v. 4, p. 213–224.
International Atomic Energy Agency–Global Network of Isotopes in Precipitation (IAEA–GNIP), 2014, IAEA–GNIP database, http://www-naweb.iaea.org/napc/ih/IHS_resources_gnip.html, accessed January 2014.
McDowell, W.H., Bowden, W.B., and Asbury, C.E., 1992, Riparian nitrogen dynamics in two geomorphologically distinct tropical rain forest watersheds; Subsurface solute patterns: Biogeochemistry, v. 18, p. 53–75.
Murphy, S.F., Stallard, R.F., Larsen, M.C., and Gould, W.A., 2012, Physiography, geology, and land cover of four watersheds in Eastern Puerto Rico, in Murphy, S.F., and Stallard, R.F., eds., Chapter A of Water Quality and Landscape Processes of Four Watersheds in Eastern Puerto Rico: U.S. Geological Survey Professional Paper 1789, p. 1–24, http://pubs.usgs.gov/pp/1789/.
NCDC–NOAA, 2014, National Climatic Data Center, National Oceanic and Atmospheric Administration, http://www.ncdc.noaa.gov/cdo-web/datasets/GHCND/stations/ GHCND:RQC00660426/detail, accessed January 2014.
Révész, Kinga, and Coplen, T.B., 2008a, eds., Determination of the delta (2H/1H) of water; RSIL lab code 1574: U.S. Geological Survey Techniques and Methods, book 10, chap. C1, 27 p., http://pubs.usgs.gov/tm/2007/tm10c1/.
Révész, Kinga, and Coplen, Tyler B., 2008b, eds., Determination of the delta (18O/16O) of water; RSIL lab code 489: U.S. Geological Survey Techniques and Methods, book 10, chap. C2, 28 p., http://pubs.usgs.gov/tm/2007/tm10c2/.
29
Rodriguez-Martinez, J., 1997, Characterization of springflow in the North Coast limestone of Puerto Rico using physical, chemical, and stable isotopic methods: U.S. Geological Survey Water-Resources Investigations Report 97–4122, 53 p., http://pubs.usgs.gov/wri/1997/4122/report.pdf.
Scholl, M.A., Shanley, J.B., Zegarra, J.P., and Coplen, T.B., 2009, The stable isotope amount effect: New insights from NEXRAD echo tops, Luquillo Mountains, Puerto Rico: Water Resources Research, v. 45, W12407, doi:10.1029/2008WR007515, http://water.usgs.gov/nrp/proj.bib/ Publications/2009/scholl_shanley_etal_2009.pdf.
Scholl, M.A., and Murphy, S.F., 2014, Precipitation isotopes link regional climate patterns to water supply in a tropical mountain forest, eastern Puerto Rico: Water Resources Research, 50, doi: 10.1002/2013WR014413.

ISSN (online) http://dx.doi.org/10.3133/ofr20141101