Quantum Models: Free-Electron in a 1D Boxfaculty.ung.edu/altomlinson/Physical Chemistry...
3
Quantum Models: Free-Electron in a 1D Box CAUTION: These reagents are toxic and as such gloves should be worn throughout this experiment. Dispose of solutions in the labeled container. Introduction In this experiment, we will obtain the visible spectrum of several polymethine dyes. As the figure below indicates these molecules possess a great deal of conjugation such that the π electrons are delocalized across the chain. The visible bands in the spectra occur as a result of π→π * electronic transitions and we can therefore treat these systems with the particle in the box model. Below are the dyes which we will study where the first figure delineates the resonance structure of these molecules. Figure 1: Structure of our Cyanine Dyes These two resonance structures will contribute equally to the wavefunction of the ion. Since this system is highly delocalized the π-electrons are free to move along the backbone. As previously mentioned, such a system can be treated with the Particle in the Box model (recall our polyene example in quantum). If we assume that the potential energy for any state is confined to a box of length a, the eigenvalue is given by 2 2 2 8 n hn E ma = (1) where m is the mass of electron and h is Planck’s constant. According to molecular orbital theory, the 2p atomic orbitals (AOs) will combine together to generate * * 2 2 2 2 , , , p p p p σ σ π π molecular orbitals (MOs). For cyanine dyes or materials which possess a great deal of conjugation, the spectroscopically active states arise from electronic transitions between π and π * MOs. Furthermore, as the conjugation is increased in such systems bands begin to form. The π-band is often referred to as the
Transcript of Quantum Models: Free-Electron in a 1D Boxfaculty.ung.edu/altomlinson/Physical Chemistry...
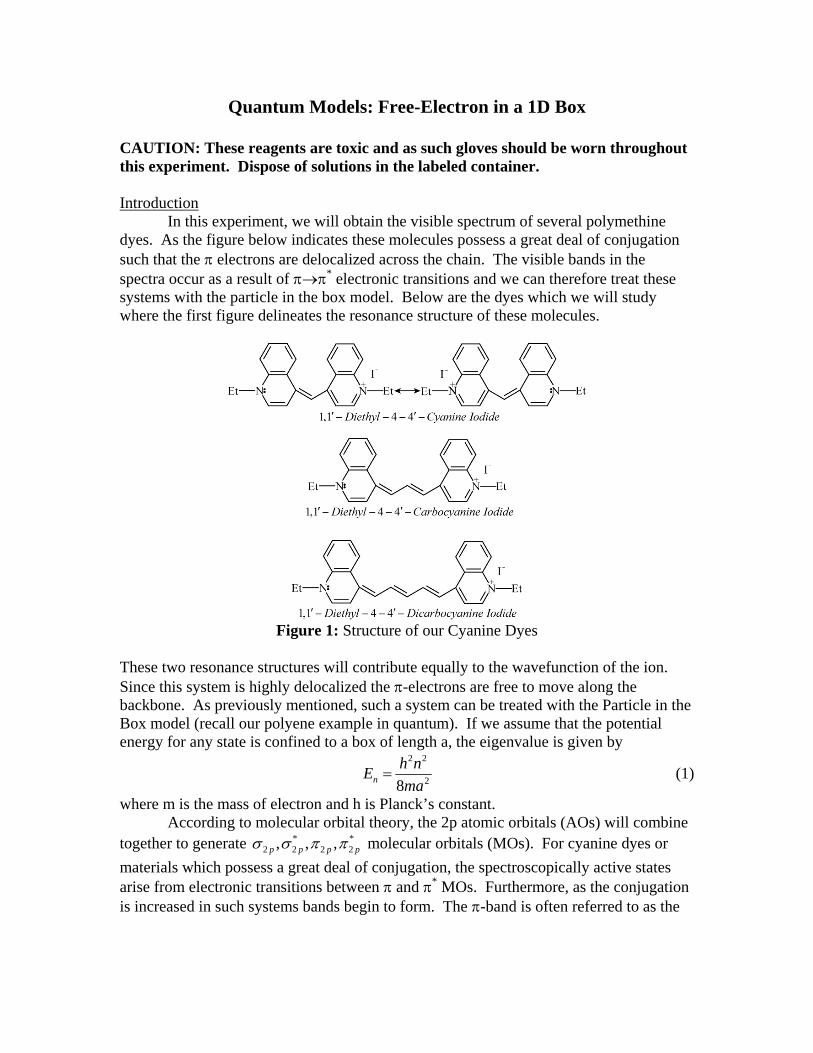
Quantum Models: Free-Electron in a 1D Box CAUTION: These reagents are toxic and as such gloves should be worn throughout this experiment. Dispose of solutions in the labeled container. Introduction In this experiment, we will obtain the visible spectrum of several polymethine dyes. As the figure below indicates these molecules possess a great deal of conjugation such that the π electrons are delocalized across the chain. The visible bands in the spectra occur as a result of π→π* electronic transitions and we can therefore treat these systems with the particle in the box model. Below are the dyes which we will study where the first figure delineates the resonance structure of these molecules.
Figure 1: Structure of our Cyanine Dyes
These two resonance structures will contribute equally to the wavefunction of the ion. Since this system is highly delocalized the π-electrons are free to move along the backbone. As previously mentioned, such a system can be treated with the Particle in the Box model (recall our polyene example in quantum). If we assume that the potential energy for any state is confined to a box of length a, the eigenvalue is given by
2 2
28nh nEma
= (1)
where m is the mass of electron and h is Planck’s constant. According to molecular orbital theory, the 2p atomic orbitals (AOs) will combine together to generate * *
2 2 2 2, , ,p p p pσ σ π π molecular orbitals (MOs). For cyanine dyes or materials which possess a great deal of conjugation, the spectroscopically active states arise from electronic transitions between π and π* MOs. Furthermore, as the conjugation is increased in such systems bands begin to form. The π-band is often referred to as the
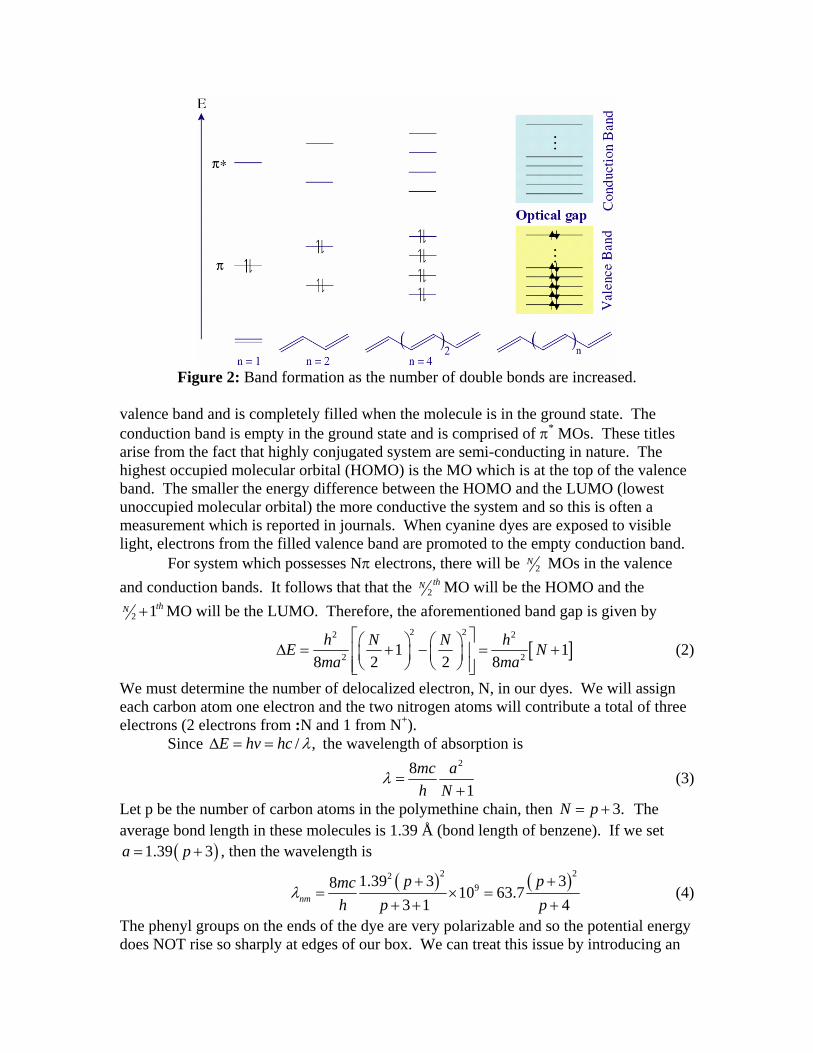
Figure 2: Band formation as the number of double bonds are increased.
valence band and is completely filled when the molecule is in the ground state. The conduction band is empty in the ground state and is comprised of π* MOs. These titles arise from the fact that highly conjugated system are semi-conducting in nature. The highest occupied molecular orbital (HOMO) is the MO which is at the top of the valence band. The smaller the energy difference between the HOMO and the LUMO (lowest unoccupied molecular orbital) the more conductive the system and so this is often a measurement which is reported in journals. When cyanine dyes are exposed to visible light, electrons from the filled valence band are promoted to the empty conduction band. For system which possesses Nπ electrons, there will be 2
N MOs in the valence and conduction bands. It follows that that the 2
thN MO will be the HOMO and the
2 1thN + MO will be the LUMO. Therefore, the aforementioned band gap is given by
[ ]2 22 2
2 21 18 2 2 8
h N N hE Nma ma
⎡ ⎤⎛ ⎞ ⎛ ⎞Δ = + − = +⎢ ⎥⎜ ⎟ ⎜ ⎟⎝ ⎠ ⎝ ⎠⎢ ⎥⎣ ⎦
(2)
We must determine the number of delocalized electron, N, in our dyes. We will assign each carbon atom one electron and the two nitrogen atoms will contribute a total of three electrons (2 electrons from :N and 1 from N+). Since / ,E hv hc λΔ = = the wavelength of absorption is
281
mc ah N
λ =+
(3)
Let p be the number of carbon atoms in the polymethine chain, then 3.N p= + The average bond length in these molecules is 1.39 Å (bond length of benzene). If we set
( )1.39 3a p= + , then the wavelength is
( ) ( )2 2291.39 3 38 10 63.7
3 1 4nm
p pmch p p
λ+ +
= × =+ + +
(4)
The phenyl groups on the ends of the dye are very polarizable and so the potential energy does NOT rise so sharply at edges of our box. We can treat this issue by introducing an
adjustable parameter α such that 0 1.α< < Incorporation of this variable will lead to our complete equation
( )2363.7
4nm
pp
αλ
+ +=
+ (5)
Experimental For this experiment, you will use the adorable HP 8452A diode array spectrometer to study our three dyes. You must USE gloves to prepare ∼ 10-6M solutions using spectroscopic grade methanol. Make sure you cover these solutions with aluminum foil in order to prevent decomposition from light. Obtain the spectrum of these initial solutions from 350 to 950 nm. You should fill two cuvets with pure methanol, one for the reference beam and the other for the baseline. From this spectrum, you may reassign the wavelength range. In accordance with Beer’s Law ( )A bCε= , the absorbance may not exceed 1. Therefore, you may need to dilute your solutions in order to meet this criteria. Data Analysis
Present all of the spectra obtained in which each plot is labeled clearly with the name of the compound and the concentration used. Determine the maximum wavelength for each dye and calculate the length of the box, a ( ( )1.39 3a p= + ). Using the free-electron model (Eq. 5), compute α for the series. What value for your wavelength do you get if you use the calculated length of your box? What assumptions/simplifications have been introduced in this experiment (think about the PIB model)? Make sure to include a table for all these values in your report.
Notebook and Report Make sure to record all of your data, etc. in your notebook which need to be dated and signed by me before you leave the lab. Your report should be written (as we discussed) in the form of a Communication/Letter publishable by J. Phys. Chem. References 1H. Kuhn, J. Chem. Phys. 1949, 17, 1198. 2D. A. Bahnick, J. Chem. Ed., 1994, 71, 171. 3D. P. Shoemaker, C. W. Garland, J. W. Nibler, “Experiments in Physical Chemistry,” 1996, McGraw Hill, p. 378. 4J. P. Lowe, “Quantum Chemistry,” Academic Press, 1993. 5M. Johal, New College of Florida – This lab was adapted from him.