
Synergistic solvent extraction of Thorium(IV) and Uranium(VI
Upload
clement-coleCategory
view
218download
0
PURE ROTATIONAL SPECTRA OF THE REACTION PRODUCTS OF LASER ABLATED THORIUM METAL AND OXYGEN MOLECULES ENTRAINED WITHIN SUPERSONIC EXPANSIONS OF NOBLE GASES.
*Brittany E. Long and ǂStephen A. Cooke RC02 June 20, 2013
* ǂ
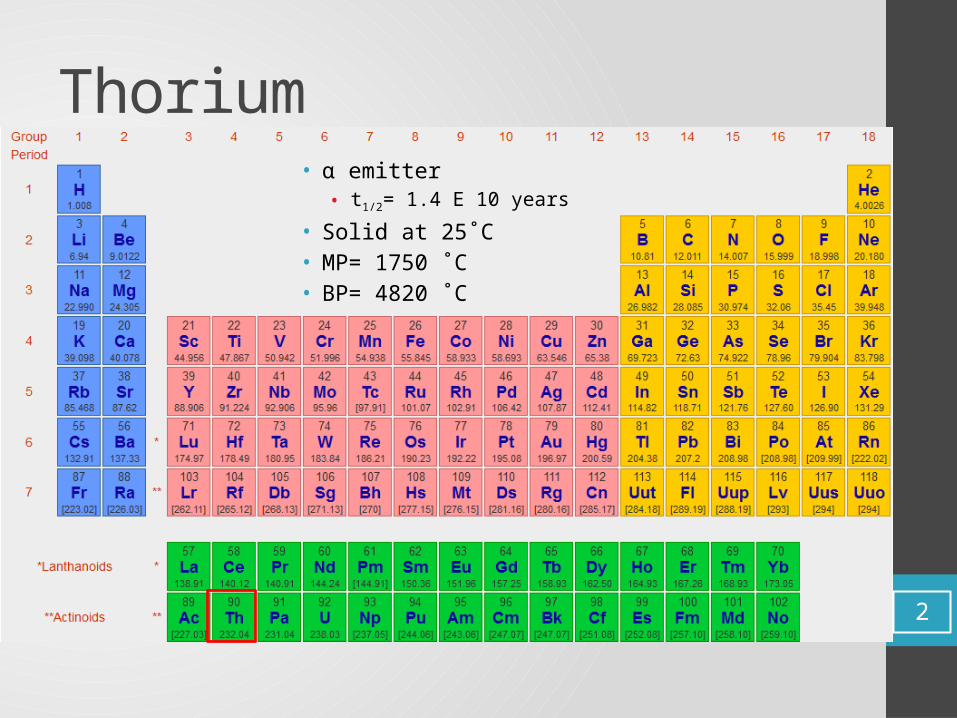
Thorium• α emitter • t1/2= 1.4 E 10 years
• Solid at 25˚C• MP= 1750 ˚C• BP= 4820 ˚C
2
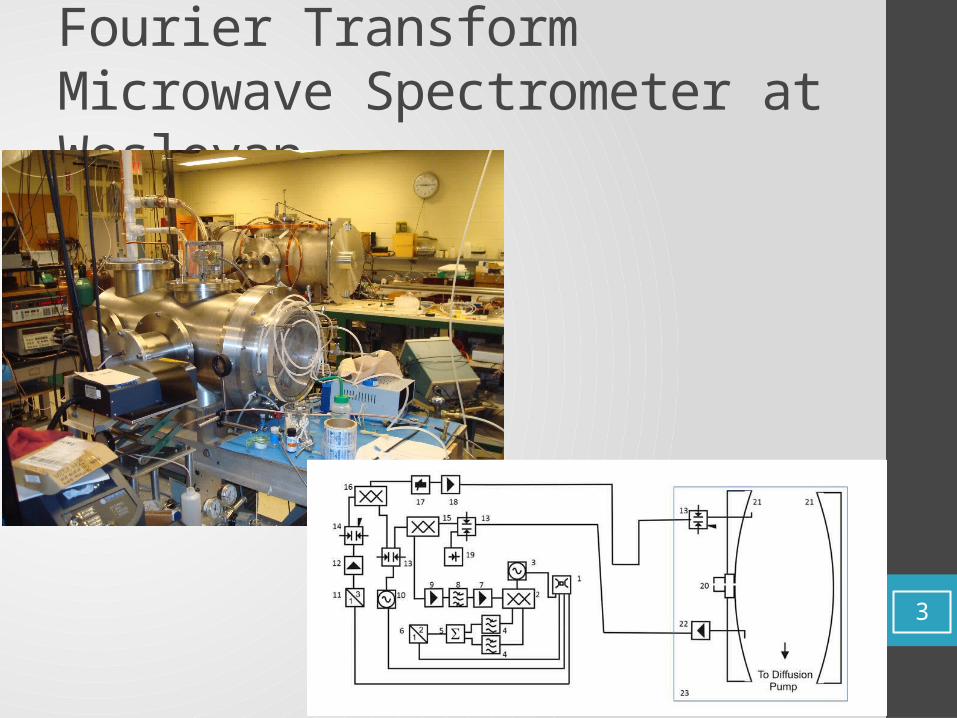
Fourier Transform Microwave Spectrometer at Wesleyan
3
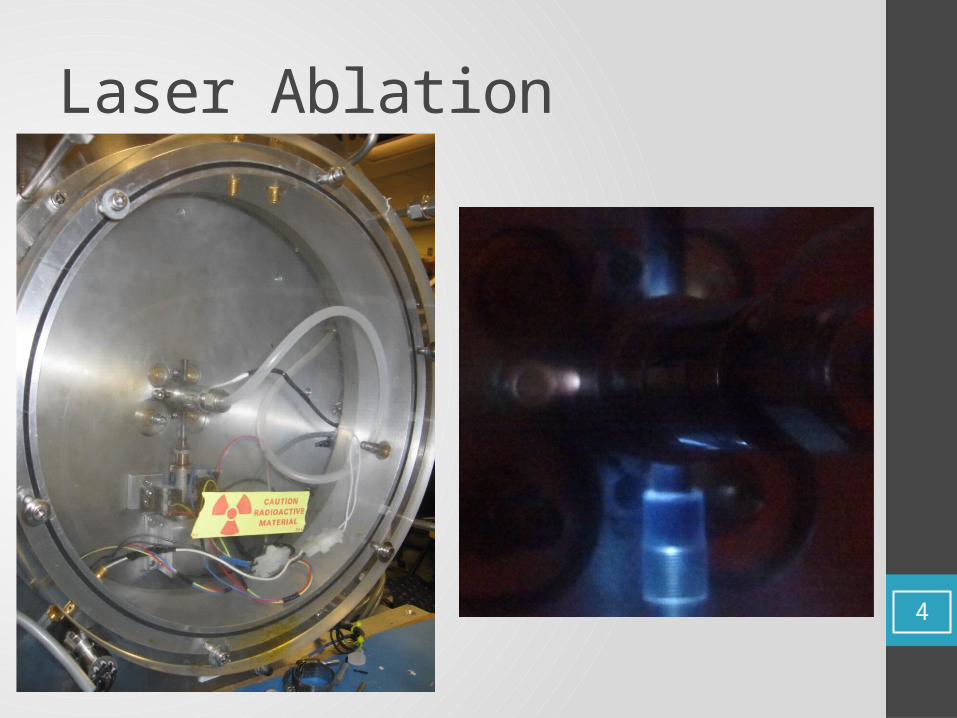
Laser Ablation
4
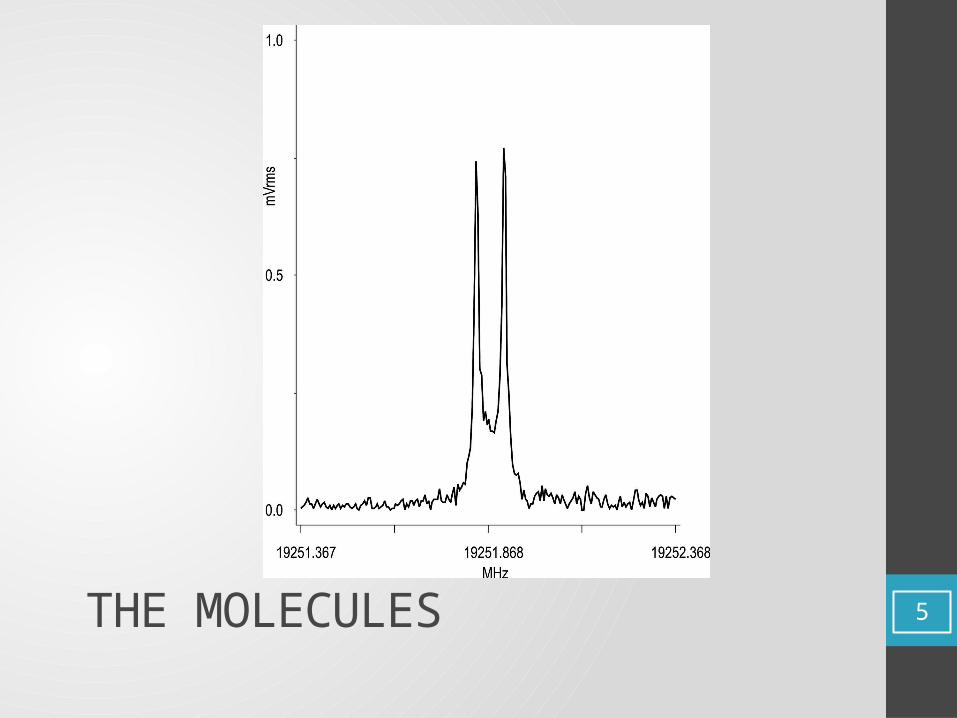
THE MOLECULES 5
Calculations• MP2 calculations with aug-cc-pVQZ for main group elements
and a multi-electron, quasi-relativistic, effective core potential, ECP60MWB for thorium• ThS, ThS2, ThOC, ThOS, ThCS,
• For comparison reasons with HfO2, ThO2 was calculated with a B3LYP with aug-cc-pVQZ for O and an ECP60MWB for thorium for ThO2
6
ThS• Obtained B value from Professor Michael Heaven.• B= 0.111(2) cm-1 or 3328(60) MHz1,2
• Using ν=2B(J+1)• Transitions should be as follows:
• J 1 0 at 6656(120) MHz• J 2 1 at 13312(240) MHz• J 3 2 at 19968(480) MHz
• No ThS signal found on either the chirp or cavity with OCS or H2S as sulfur source.• Searched 6 GHz with the chirp• Searched 200 MHz twice with the cavity
1. Bartlett, J. H.; Antonov, I. O.; Heaven, M.C. Spectroscopic and Theoretical Investigations of ThS and ThS +. Manuscript in progress.2. Bartlett, J. H.; Heaven, M. C. Ionization Measurement and Spectroscopy of ThS and ThS+. WK15
7
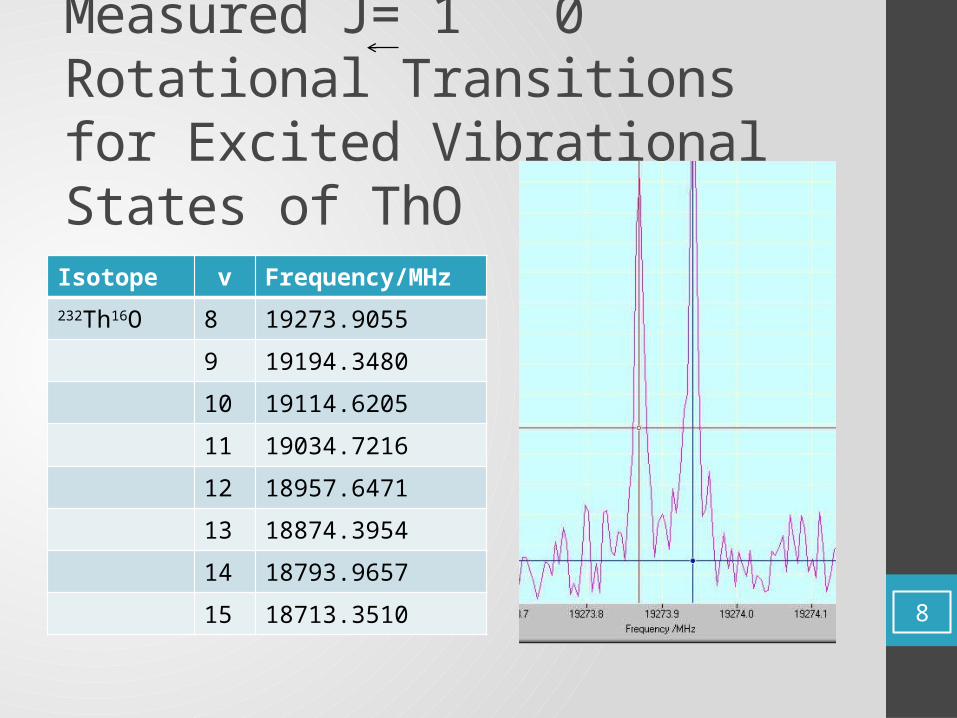
Measured J= 1 0 Rotational Transitions for Excited Vibrational States of ThO
Isotope v Frequency/MHz232Th16O 8 19273.9055
9 19194.3480
10 19114.6205
11 19034.7216
12 18957.6471
13 18874.3954
14 18793.9657
15 18713.35108
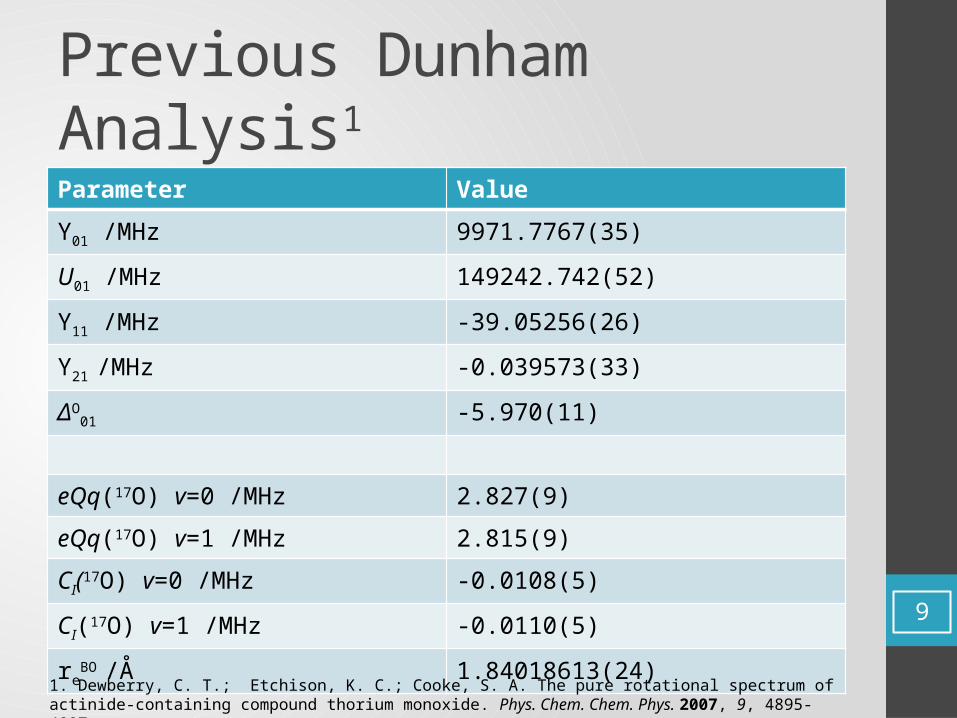
Previous Dunham Analysis1
Parameter Value
Y01 /MHz 9971.7767(35)
U01 /MHz 149242.742(52)
Y11 /MHz -39.05256(26)
Y21 /MHz -0.039573(33)
ΔO01 -5.970(11)
eQq(17O) v=0 /MHz 2.827(9)
eQq(17O) v=1 /MHz 2.815(9)
CI(17O) v=0 /MHz -0.0108(5)
CI(17O) v=1 /MHz -0.0110(5)
reBO /Å 1.84018613(24)
1. Dewberry, C. T.; Etchison, K. C.; Cooke, S. A. The pure rotational spectrum of actinide-containing compound thorium monoxide. Phys. Chem. Chem. Phys. 2007, 9, 4895-4897.
9
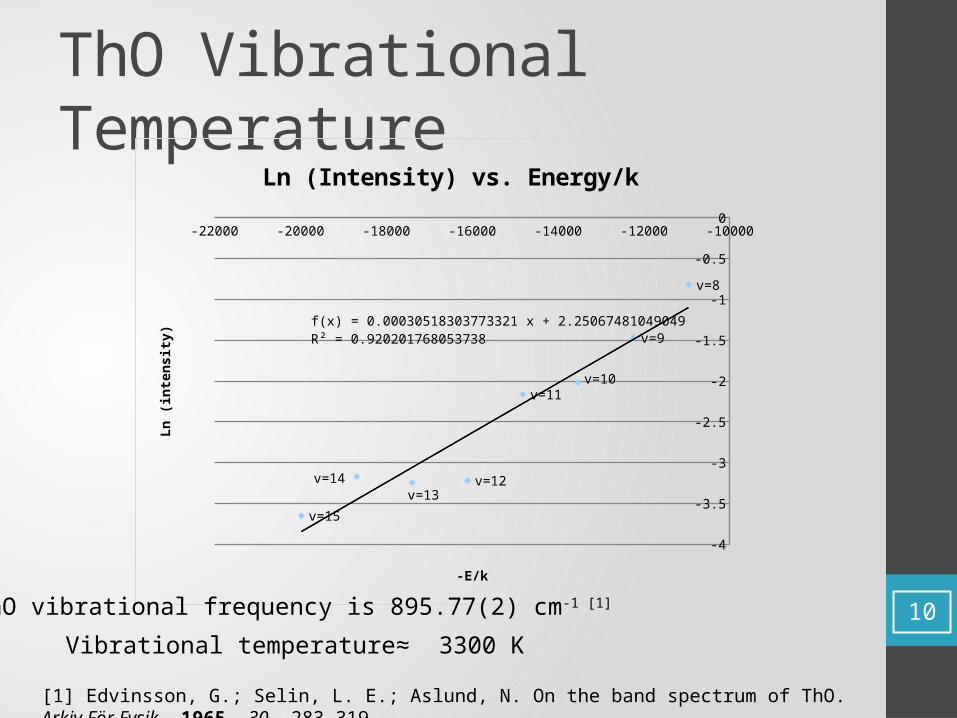
ThO Vibrational Temperature
-22000 -20000 -18000 -16000 -14000 -12000 -10000
-4
-3.5
-3
-2.5
-2
-1.5
-1
-0.5
0
v=8
v=9
v=10v=11
v=12v=13
v=14
v=15
f(x) = 0.00030518303773321 x + 2.25067481049049R² = 0.920201768053738
Ln (Intensity) vs. Energy/k
-E/k
Ln (i
nten
sity)
Vibrational temperature≈ 3300 K
ThO vibrational frequency is 895.77(2) cm-1 [1]
[1] Edvinsson, G.; Selin, L. E.; Aslund, N. On the band spectrum of ThO. Arkiv Fӧr Fysik. 1965, 30, 283-319.
10
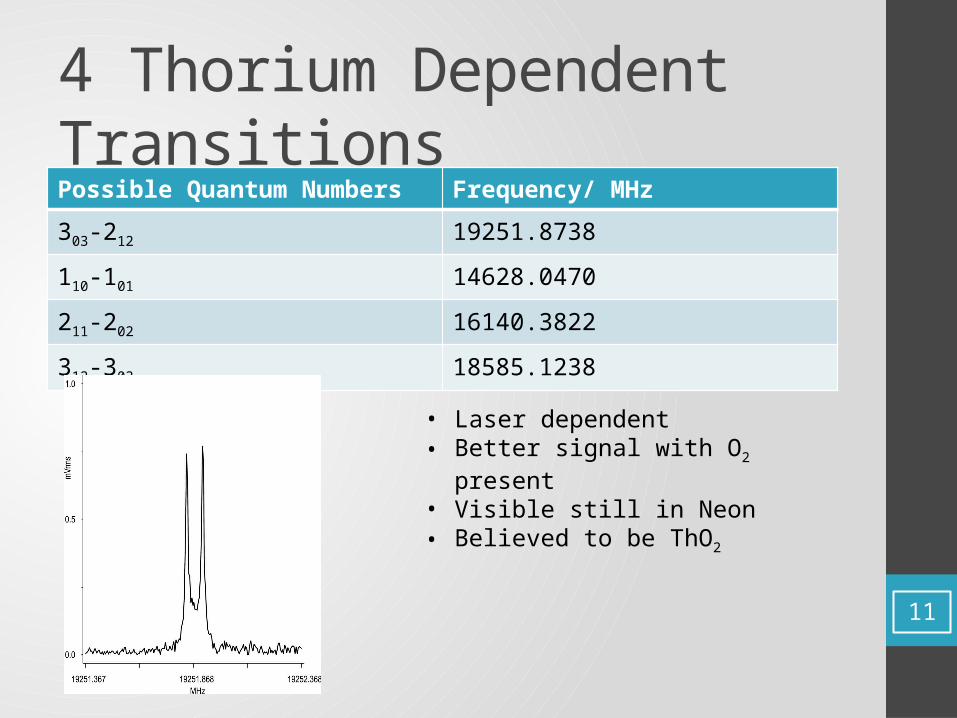
4 Thorium Dependent TransitionsPossible Quantum Numbers Frequency/ MHz
303-212 19251.8738
110-101 14628.0470
211-202 16140.3822
312-303 18585.1238
• Laser dependent• Better signal with O2 present• Visible still in Neon • Believed to be ThO2
11
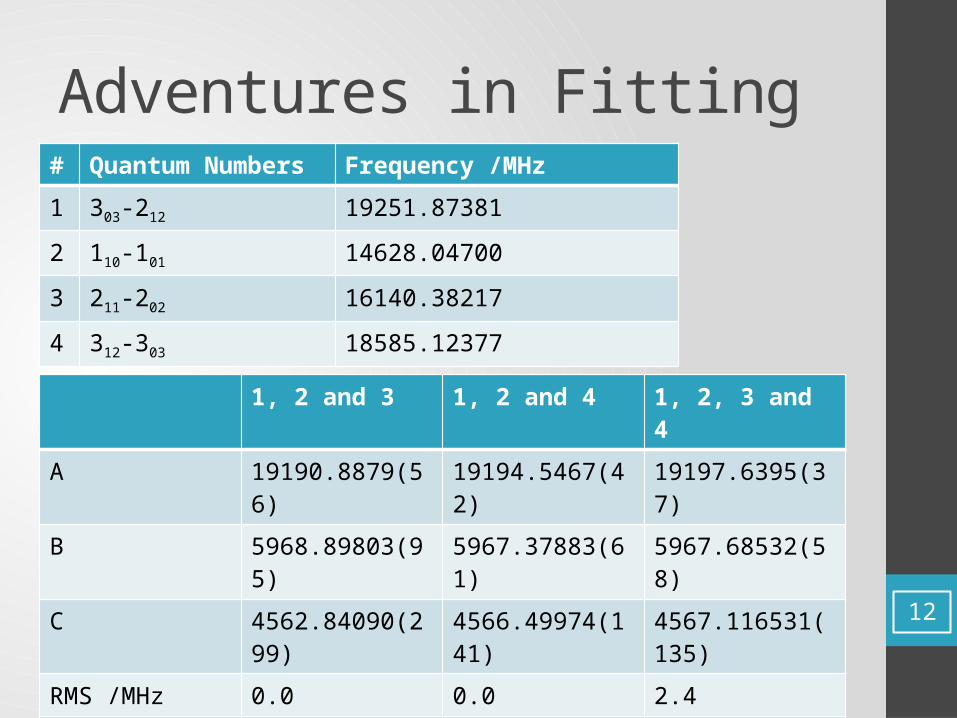
Adventures in Fitting
12
# Quantum Numbers Frequency /MHz
1 303-212 19251.87381
2 110-101 14628.04700
3 211-202 16140.38217
4 312-303 18585.12377
1, 2 and 3 1, 2 and 4 1, 2, 3 and 4
A 19190.8879(56) 19194.5467(42) 19197.6395(37)
B 5968.89803(95) 5967.37883(61) 5967.68532(58)
C 4562.84090(299) 4566.49974(141) 4567.116531(135)
RMS /MHz 0.0 0.0 2.4
PCC /amu Å2 0.121662 0.174302 0.177479
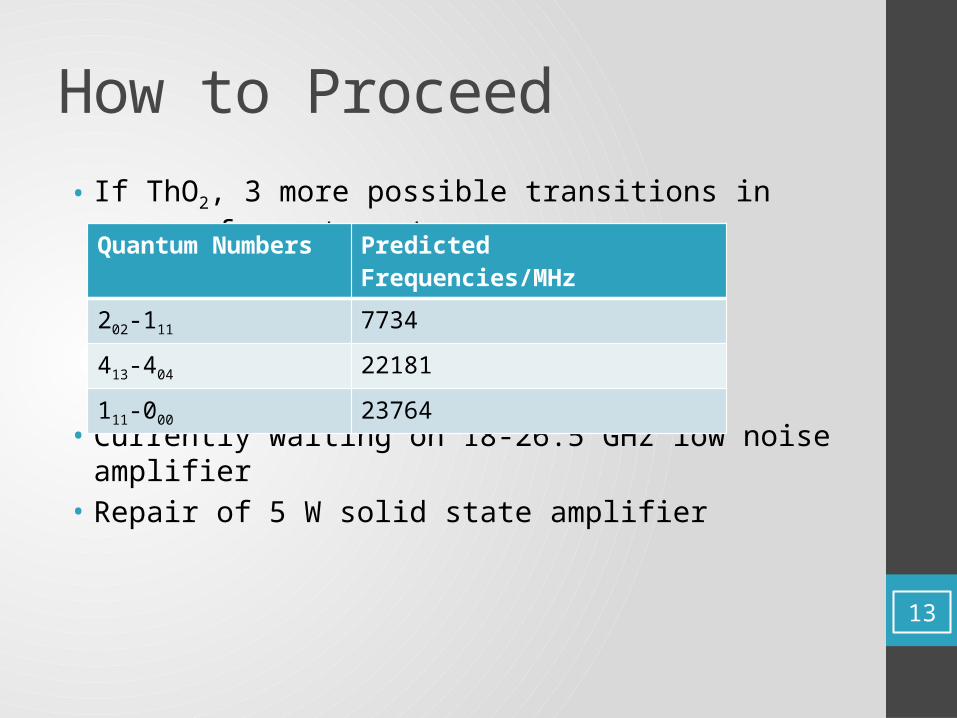
How to Proceed
• If ThO2, 3 more possible transitions in range of spectrometer
• Currently waiting on 18-26.5 GHz low noise amplifier• Repair of 5 W solid state amplifier
Quantum Numbers Predicted Frequencies/MHz202-111 7734
413-404 22181
111-000 23764
13
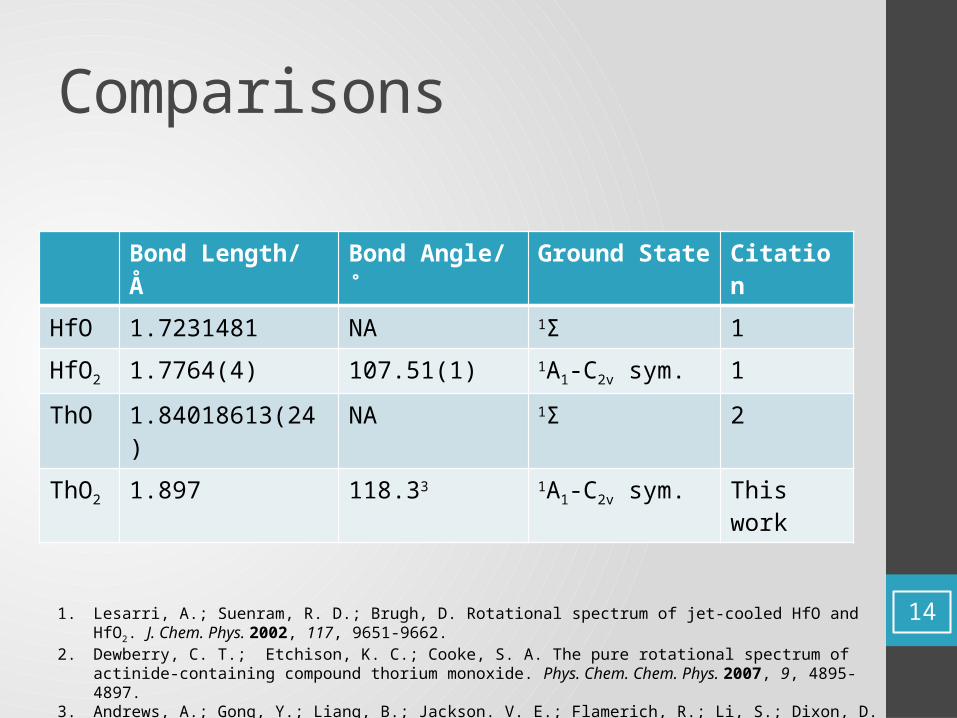
Comparisons
Bond Length/ Å Bond Angle/ ˚ Ground State Citation
HfO 1.7231481 NA 1Σ 1
HfO2 1.7764(4) 107.51(1) 1A1-C2v sym. 1
ThO 1.84018613(24) NA 1Σ 2
ThO2 1.897 118.33 1A1-C2v sym. This work
1. Lesarri, A.; Suenram, R. D.; Brugh, D. Rotational spectrum of jet-cooled HfO and HfO 2. J. Chem. Phys. 2002, 117, 9651-9662.2. Dewberry, C. T.; Etchison, K. C.; Cooke, S. A. The pure rotational spectrum of actinide-containing compound thorium
monoxide. Phys. Chem. Chem. Phys. 2007, 9, 4895-4897.3. Andrews, A.; Gong, Y.; Liang, B.; Jackson. V. E.; Flamerich, R.; Li, S.; Dixon, D. A. Matrix Infrared Spectra and Theoretical
Studies of Thorium Oxide Species: ThOx and Th2Oy. J. Phys. Chem. A. 2011, 115, 14407-14416. (116.47˚)
14
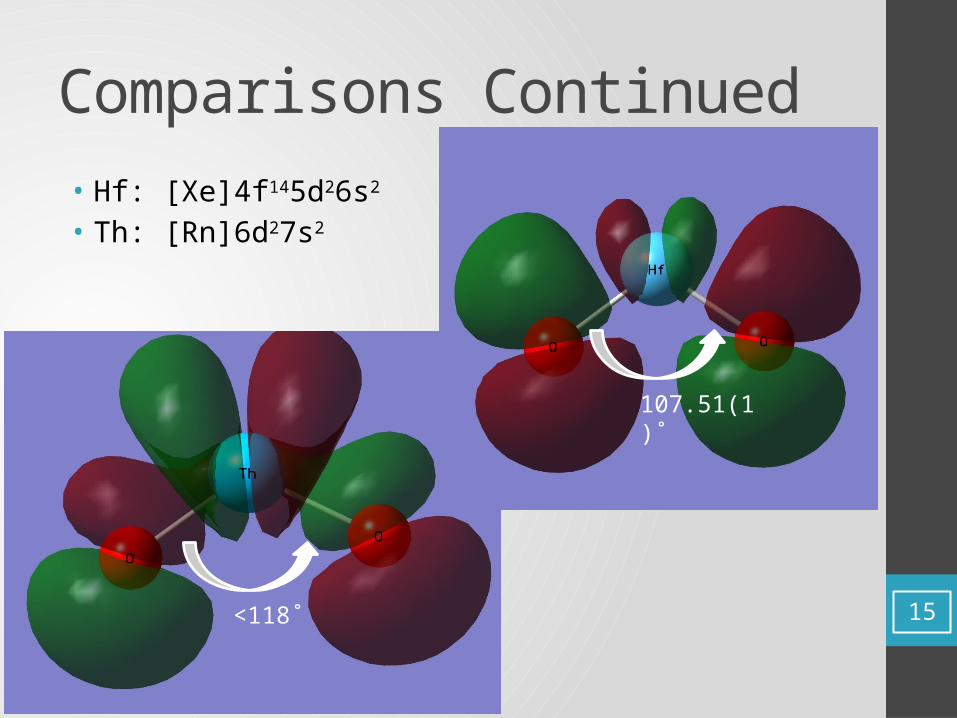
Comparisons Continued• Hf: [Xe]4f145d26s2
• Th: [Rn]6d27s2
<118˚
107.51(1)˚
15
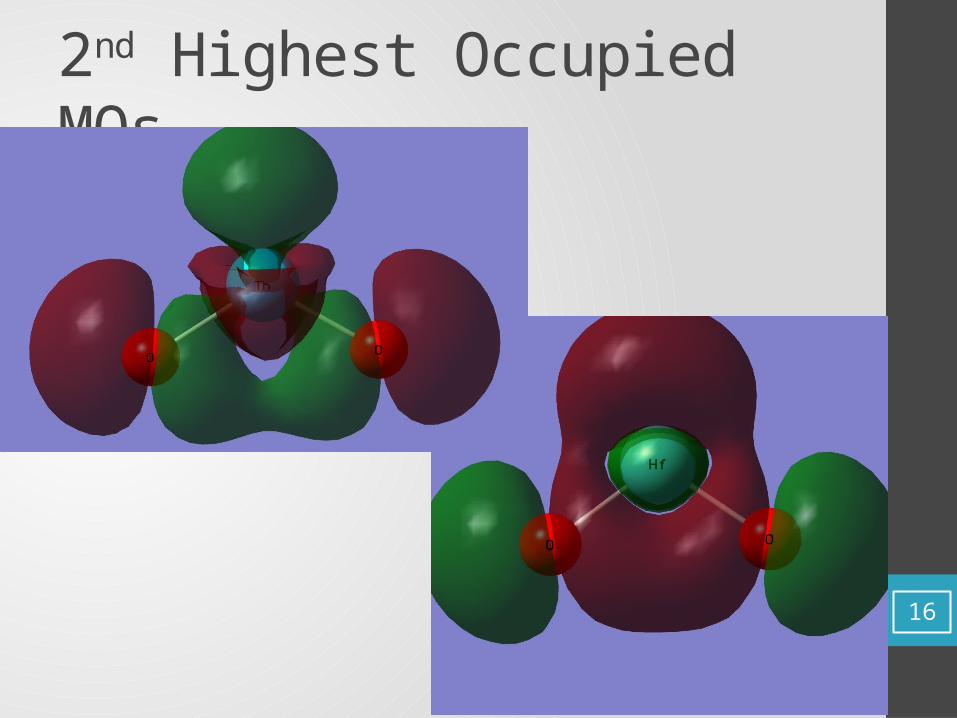
2nd Highest Occupied MOs
16
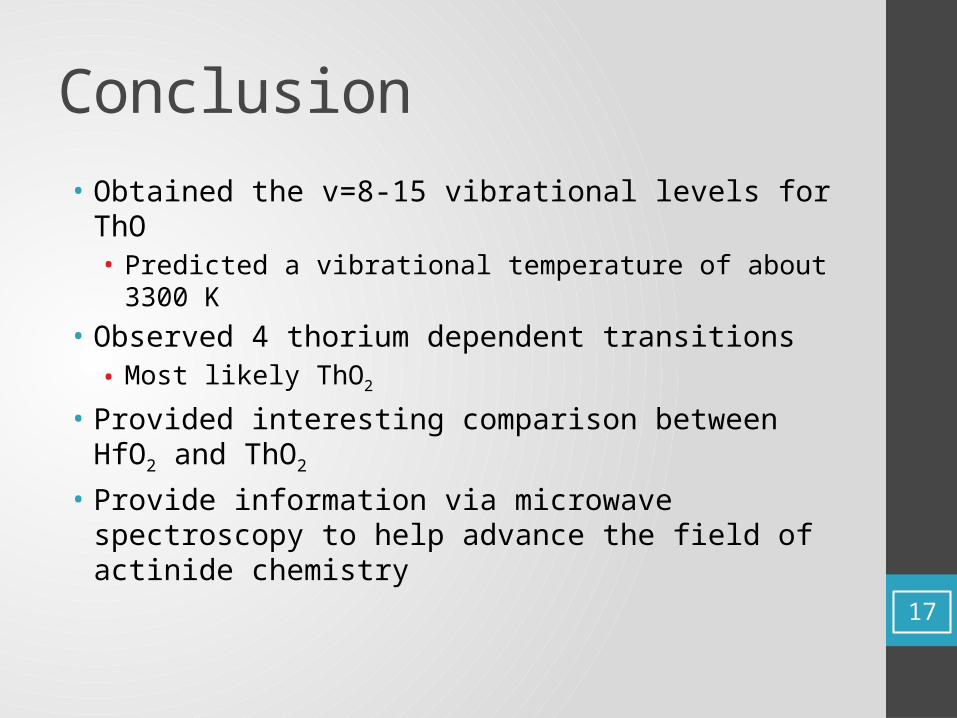
Conclusion• Obtained the v=8-15 vibrational levels for ThO• Predicted a vibrational temperature of about 3300 K
• Observed 4 thorium dependent transitions• Most likely ThO2
• Provided interesting comparison between HfO2 and ThO2
• Provide information via microwave spectroscopy to help advance the field of actinide chemistry
17
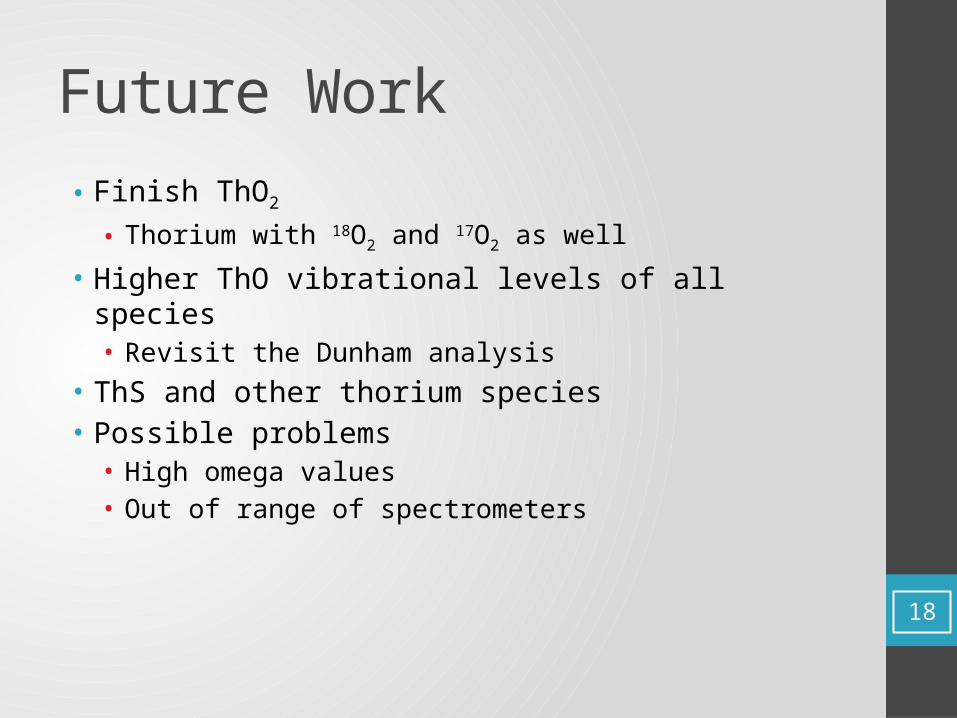
Future Work
• Finish ThO2
• Thorium with 18O2 and 17O2 as well
• Higher ThO vibrational levels of all species• Revisit the Dunham analysis
• ThS and other thorium species• Possible problems • High omega values• Out of range of spectrometers
18

Acknowledgements• Novick, Pringle and Cooke Group• Laboratory Funding from the DOE
19
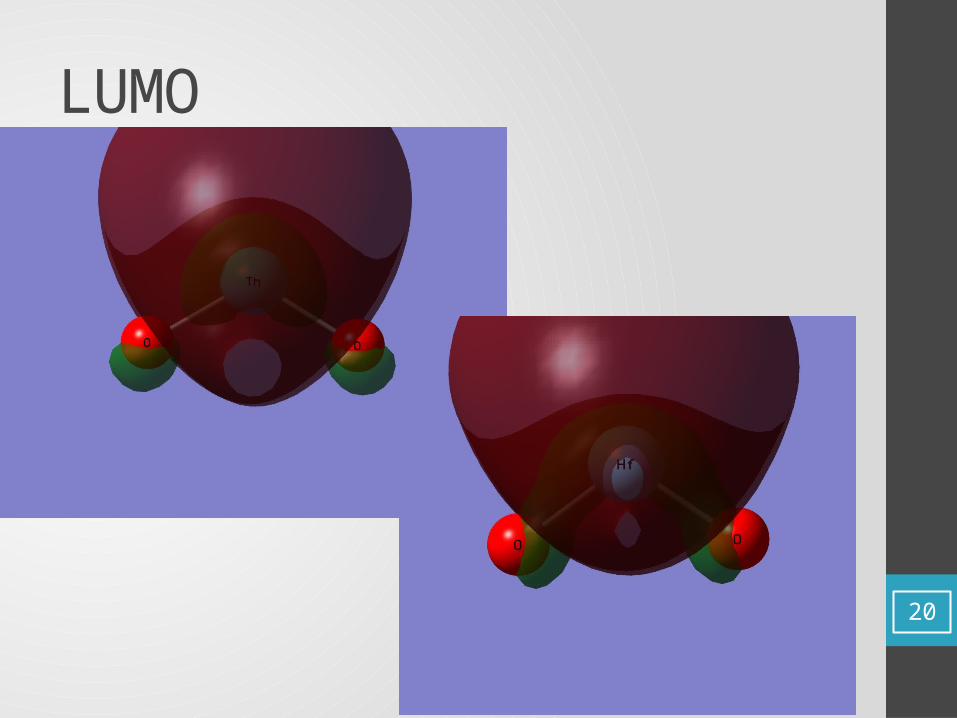
LUMO
20
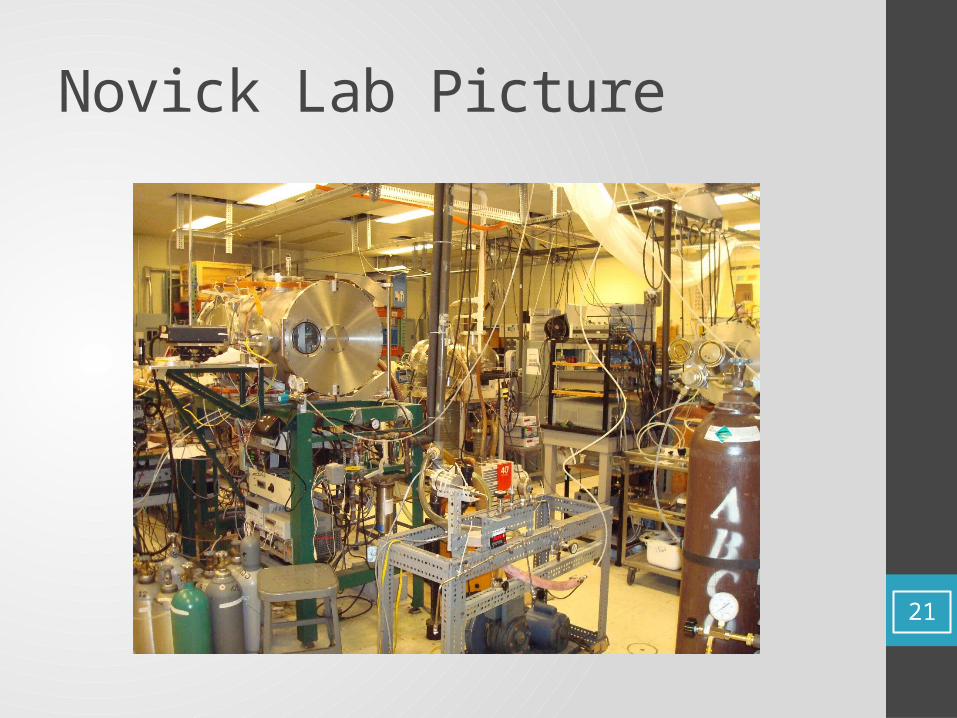
Novick Lab Picture
21


![Instructional workshop on OpenFOAM programming LECTURE # 8€¦ · localDt[ myCell ] += lambda * face_area;}} Hands on - Supersonic ow over wedge I Compile the solver I Setup inputs](https://static.fdocument.org/doc/165x107/606261e2a9a908738c306e77/instructional-workshop-on-openfoam-programming-lecture-8-localdt-mycell-.jpg)