Protein Kinase C δ Regulates the Depletion of Actin at the ...
19
ORIGINAL RESEARCH published: 26 April 2019 doi: 10.3389/fimmu.2019.00851 Frontiers in Immunology | www.frontiersin.org 1 April 2019 | Volume 10 | Article 851 Edited by: Jorge Bernardino De La Serna, Imperial College London, United Kingdom Reviewed by: Christian Martin Gawden-Bone, University of Cambridge, United Kingdom Ricardo A. Fernandes, Stanford University, United States *Correspondence: Manuel Izquierdo [email protected] † These authors share senior authorship Specialty section: This article was submitted to T Cell Biology, a section of the journal Frontiers in Immunology Received: 11 October 2018 Accepted: 02 April 2019 Published: 26 April 2019 Citation: Herranz G, Aguilera P, Dávila S, Sánchez A, Stancu B, Gómez J, Fernández-Moreno D, de Martín R, Quintanilla M, Fernández T, Rodríguez-Silvestre P, Márquez-Expósito L, Bello-Gamboa A, Fraile-Ramos A, Calvo V and Izquierdo M (2019) Protein Kinase C δ Regulates the Depletion of Actin at the Immunological Synapse Required for Polarized Exosome Secretion by T Cells. Front. Immunol. 10:851. doi: 10.3389/fimmu.2019.00851 Protein Kinase C δ Regulates the Depletion of Actin at the Immunological Synapse Required for Polarized Exosome Secretion by T Cells Gonzalo Herranz 1 , Pablo Aguilera 1 , Sergio Dávila 1 , Alicia Sánchez 1 , Bianca Stancu 1 , Jesús Gómez 1 , David Fernández-Moreno 1 , Raúl de Martín 1 , Mario Quintanilla 1 , Teresa Fernández 1 , Pablo Rodríguez-Silvestre 1 , Laura Márquez-Expósito 1 , Ana Bello-Gamboa 1 , Alberto Fraile-Ramos 2 , Víctor Calvo 1† and Manuel Izquierdo 1 * † 1 Departamento de Bioquímica, Instituto de Investigaciones Biomédicas Alberto Sols CSIC-UAM, Madrid, Spain, 2 Departamento de Biología Celular, Facultad de Medicina, Universidad Complutense de Madrid, Madrid, Spain Multivesicular bodies (MVB) are endocytic compartments that enclose intraluminal vesicles (ILVs) formed by inward budding from the limiting membrane of endosomes. In T lymphocytes, ILVs are secreted as Fas ligand-bearing, pro-apoptotic exosomes following T cell receptor (TCR)-induced fusion of MVB with the plasma membrane at the immune synapse (IS). In this study we show that protein kinase C δ (PKCδ), a novel PKC isotype activated by diacylglycerol (DAG), regulates TCR-controlled MVB polarization toward the IS and exosome secretion. Concomitantly, we demonstrate that PKCδ-interfered T lymphocytes are defective in activation-induced cell death. Using a DAG sensor based on the C1 DAG-binding domain of PKCδ and a GFP-PKCδ chimera, we reveal that T lymphocyte activation enhances DAG levels at the MVB endomembranes which mediates the association of PKCδ to MVB. Spatiotemporal reorganization of F-actin at the IS is inhibited in PKCδ-interfered T lymphocytes. Therefore, we propose PKCδ as a DAG effector that regulates the actin reorganization necessary for MVB traffic and exosome secretion. Keywords: T lymphocytes, immune synapse, protein kinase C δ, multivesicular bodies, exosomes, cytotoxic activity, cell death INTRODUCTION T cell receptor (TCR) stimulation by antigen presented by major histocompatibility complex (MHC) molecules on an antigen-presenting cell (APC) induces the formation of the immunological synapse (IS), the convergence of the secretory granules of T lymphocytes toward the microtubule-organizing center (MTOC) and, almost simultaneously, the polarization of the MTOC to the IS (1, 2). This ensures the specificity of T cell effector responses by enabling polarized secretory traffic toward the APC (1, 2), spatially and temporally focusing secretion at the synaptic cleft (3). The polarization of the MTOC toward the IS is conducted by a transient increase in cortical actin at the IS, followed by a decrease in cortical actin density at the central region of the immune
Transcript of Protein Kinase C δ Regulates the Depletion of Actin at the ...
ORIGINAL RESEARCHpublished: 26 April 2019
doi: 10.3389/fimmu.2019.00851
Frontiers in Immunology | www.frontiersin.org 1 April 2019 | Volume 10 | Article 851
Edited by:
Jorge Bernardino De La Serna,
Imperial College London,
United Kingdom
Reviewed by:
Christian Martin Gawden-Bone,
University of Cambridge,
United Kingdom
Ricardo A. Fernandes,
Stanford University, United States
*Correspondence:
Manuel Izquierdo
†These authors share senior
authorship
Specialty section:
This article was submitted to
T Cell Biology,
a section of the journal
Frontiers in Immunology
Received: 11 October 2018
Accepted: 02 April 2019
Published: 26 April 2019
Citation:
Herranz G, Aguilera P, Dávila S,
Sánchez A, Stancu B, Gómez J,
Fernández-Moreno D, de Martín R,
Quintanilla M, Fernández T,
Rodríguez-Silvestre P,
Márquez-Expósito L, Bello-Gamboa A,
Fraile-Ramos A, Calvo V and
Izquierdo M (2019) Protein Kinase C δ
Regulates the Depletion of Actin at the
Immunological Synapse Required for
Polarized Exosome Secretion by T
Cells. Front. Immunol. 10:851.
doi: 10.3389/fimmu.2019.00851
Protein Kinase C δ Regulates theDepletion of Actin at theImmunological Synapse Required forPolarized Exosome Secretion by TCellsGonzalo Herranz 1, Pablo Aguilera 1, Sergio Dávila 1, Alicia Sánchez 1, Bianca Stancu 1,
Jesús Gómez 1, David Fernández-Moreno 1, Raúl de Martín 1, Mario Quintanilla 1,
Teresa Fernández 1, Pablo Rodríguez-Silvestre 1, Laura Márquez-Expósito 1,
Ana Bello-Gamboa 1, Alberto Fraile-Ramos 2, Víctor Calvo 1† and Manuel Izquierdo 1*†
1Departamento de Bioquímica, Instituto de Investigaciones Biomédicas Alberto Sols CSIC-UAM, Madrid, Spain,2Departamento de Biología Celular, Facultad de Medicina, Universidad Complutense de Madrid, Madrid, Spain
Multivesicular bodies (MVB) are endocytic compartments that enclose
intraluminal vesicles (ILVs) formed by inward budding from the limiting membrane
of endosomes. In T lymphocytes, ILVs are secreted as Fas ligand-bearing, pro-apoptotic
exosomes following T cell receptor (TCR)-induced fusion of MVB with the plasma
membrane at the immune synapse (IS). In this study we show that protein kinase C δ
(PKCδ), a novel PKC isotype activated by diacylglycerol (DAG), regulates TCR-controlled
MVB polarization toward the IS and exosome secretion. Concomitantly, we demonstrate
that PKCδ-interfered T lymphocytes are defective in activation-induced cell death.
Using a DAG sensor based on the C1 DAG-binding domain of PKCδ and a GFP-PKCδ
chimera, we reveal that T lymphocyte activation enhances DAG levels at the MVB
endomembranes which mediates the association of PKCδ to MVB. Spatiotemporal
reorganization of F-actin at the IS is inhibited in PKCδ-interfered T lymphocytes.
Therefore, we propose PKCδ as a DAG effector that regulates the actin reorganization
necessary for MVB traffic and exosome secretion.
Keywords: T lymphocytes, immune synapse, protein kinase C δ, multivesicular bodies, exosomes, cytotoxic
activity, cell death
INTRODUCTION
T cell receptor (TCR) stimulation by antigen presented by major histocompatibility complex(MHC)molecules on an antigen-presenting cell (APC) induces the formation of the immunologicalsynapse (IS), the convergence of the secretory granules of T lymphocytes toward themicrotubule-organizing center (MTOC) and, almost simultaneously, the polarization of theMTOCto the IS (1, 2). This ensures the specificity of T cell effector responses by enabling polarizedsecretory traffic toward the APC (1, 2), spatially and temporally focusing secretion at the synapticcleft (3). The polarization of theMTOC toward the IS is conducted by a transient increase in corticalactin at the IS, followed by a decrease in cortical actin density at the central region of the immune
Herranz et al. Protein Kinase C δ Regulates Exosome Secretion
synapse (cIS) that contains the secretory domain. The centralsupramolecular activation cluster (cSMAC) next to this secretorydomain is also located within the F-actin-low region at cIS (Fact-low cIS) (2, 4, 5). In parallel, F-actin accumulation occurs at theedge of the T lymphocyte/APC interface, which constitutes thedistal SMAC (dSMAC) and delimits the synaptic contact region(6, 7). The secretory granules from cytotoxic T lymphocytes(CTL) (also called “lytic” or “cytotoxic” granules) contain diverseapoptosis-inducing molecules (8), including Fas ligand (FasL).Among several pro-apoptotic mechanisms, CTL kill Fas+ targetcells by rapidly exposing intact, pre-formed FasL on the plasmamembrane at the IS (9). FasL induces cross-linking of the Fasdeath receptor on the target cell and subsequent apoptosis (10).In resting CTL, FasL is located at the limiting membrane ofsecretory multivesicular bodies (MVB) (9). In addition, FasLcan be sorted from the limiting membrane of the MVB to theintraluminal vesicles (ILV) via inward budding, which occursduring maturation of MVB in CTL, CD4+ T lymphoblasts andJurkat, a CD4+ T helper (Th) type cell line (11–13). UponTCR activation of CTL and MTOC reorientation, lytic granulesundergo fusion with the plasma membrane at the IS (5). As aconsequence, two mechanisms for the transport of pro-apoptoticFasL to the extracellular milieu may coexist: relocalization ofFasL to the cell surface (9), and secretion of FasL-containingILV as lethal extracellular nanovesicles (50–100 nm size) calledexosomes (13–15). While exosomes are constitutively secretedby a variety of cell lineages and tumor cells, in T and Blymphocytes exosome secretion is triggered upon activation ofcell surface receptors, which in turn regulates antigen-specificimmune responses (16). Exosomes are involved in importantprocesses related to TCR-triggered immune responses, includingT lymphocyte-mediated cytotoxicity, activation-induced celldeath (AICD) of CD4+ lymphocytes, antigen presentation,intercellular miRNA exchange (11–13, 17, 18) and thymicdevelopment (19). However, the mechanisms underlying MVBtraffic and exosome secretion are poorly understood. In thiscontext, it is known that MTOC reorientation in CTL is initiallyguided by a diacylglycerol (DAG) gradient centered at the IS (20),
Abbreviations: Ab, antibody; AICD, activation-induced cell death; APC, antigen-
presenting cell; C, center of mass; CCH, carbachol; cIS, central region
of the immune synapse; Fact-low cIS, F-actin-low region at the center
of the immune synapse, CMAC, cell tracker blue-CellTrackerTM (7-amino-
4-chloromethylcoumarin); cSMAC, central supramolecular activation cluster;
CTL, cytotoxic T lymphocytes; DAG, diacylglycerol; DGKα, diacylglycerol
kinase α; dSMAC, distal supramolecular activation cluster; ECL, enhanced
chemiluminescence; ESCRT, endosomal sorting complex required for traffic; F-
actin, filamentous actin; FasL, Fas ligand; FI, fluorescence intensity; fps, frames per
second; GFP, green fluorescent protein; HBSS, Hank’s balanced salt solution; HRP,
horseradish peroxidase; ILV, intraluminal vesicles; IS, immune synapse; MHC,
major histocompatibility complex; MIP, maximal intensity projection; MVB,
multivesicular bodies; MTOC, microtubule-organizing center; NS, not significant;
NTA, nanoparticle tracking analysis; PA, phosphatidic acid; PBL, peripheral blood
lymphocytes; PKC, protein kinase C; PKCδ, protein kinase C δ isotype; PKD,
protein kinase D; PLC, phospholipase C; PMA, phorbol myristate acetate; Pol.
Index, polarization index; pSMAC, peripheral supramolecular activation cluster;
PSF, point spread function; ROI, region of interest; SD, standard deviation; shRNA,
short hairpin RNA; SEE, Staphylococcus enterotoxin E; SMAC, supramolecular
activation cluster; TCR, T-cell receptor for antigen; Th, helper T lymphocyte;
TRANS, Transmittance; U.DAG2, Upward DAG2; WB, western blot.
which is de novo produced by TCR-stimulated phospholipase C(PLC) activation. DAG activates, among others, several membersof the protein kinase C (PKC) and the protein kinase D (PKD)families (21). Phosphorylation of DAG by diacylglycerol kinaseα (DGKα) to produce phosphatidic acid (PA) (22) is one ofthe mechanisms involved in the spatiotemporal control of theDAG gradient (23) and MTOC reorientation to the IS (20).Furthermore, several authors have described DGKα as a crucialfactor in the polarization of late endosomes/MVB (24). We haveshown that DGKα controls the polarized secretion of exosomescontaining FasL in Th lymphocytes (13, 25) and that the kinaseactivity of DGKα inhibits ILV formation duringMVBmaturation(25). In addition, we have identified a DAG-activated enzyme,PKD1/2, as a key component of this DGKα-controlled pathwayinvolved inMVBmaturation and exosome secretion (26). Besidesthis early regulation, DGKα also controls MTOC and MVBpolarization toward the IS both in CTL and CD4+ T lymphocytes(20, 25, 27), although the molecular basis underlying this secondcheckpoint remains unclear. The fact that the novel PKC familymember PKCδ, a DAG-activated PKC isotype, is necessary for thepolarization of lytic granules and cytotoxicity in mouse CTL (28,29) prompted us to study the function of PKCδ in MVB polarizedtrafficking and exosome secretion in human T lymphocytes.
MATERIALS AND METHODS
CellsJ-HM1-2.2 Jurkat cells expressing human muscarinic type 1receptor (HM1R) and high levels of PKCδ have been used as amodel system to trigger phosphatidylinositol turnover and DAGproduction at the plasma membrane upon carbachol (CCH)stimulation (30). Raji B and Jurkat T (clone JE6.1) cell lineswere obtained from the ATCC. Cell lines were cultured inRPMI 1640 medium containing L-glutamine (Invitrogen) with10% heat-inactivated FCS (Gibco) and penicillin/streptomycin(Gibco). Jurkat cells (clone JE6.1) transfected with control andPKCδ shRNA-encoding plasmids were selected with puromycin(1µg/ml) and clones isolated by limiting dilution. Humanprimary T lymphoblasts from healthy volunteers were obtainedand cultured as described previously (31).
ShRNA Plasmids, Expression Vectors,Transfection Assays, and Isolation ofClonesPlasmids used in this study were as follows: pEFbos-GFP wasdescribed previously (13, 23); pEFGFP-C1bosCD63 and pECFP-C1CD63 were provided by G. Griffiths; mouse pEGFP-PKCδwt(GFP-PKCδWT), pEGFP-PKCδDR144/145A constitutivelyactive mutant (GFP-PKCδCA) (32) and pEGFP-PKCδK376Akinase-dead mutant (GFP-PKCδKD) (33, 34) were obtainedfrom A. Zweifach and D. M. Reyland. GFP-C1bPKCθ expressionplasmid was kindly provided by I. Mérida; UpwardDAG2(U.DAG2) (35) was generously provided by A.M. Quinn(Montana Molecular Inc.). In some experiments, humanDGKα was silenced using the pSUPER RNAi System (pSR-GFPbicistronic or pSuperplasmids; Oligoengine, Seattle, WA, USA)
Frontiers in Immunology | www.frontiersin.org 2 April 2019 | Volume 10 | Article 851
Herranz et al. Protein Kinase C δ Regulates Exosome Secretion
with the appropriate hairpin as described (25). pDsRed2-PKD1wt plasmid was previously described (26). U.DAG2 is agenetically encoded, fluorescent protein-containing DAG sensorbased on the insertion of the circularly permuted (cp) EGFP intoa PKCδ coding sequence that was modified by deleting only theN-terminal region containing the C2 domain (35). The U.DAG2sensor maintains the C1, DAG-binding domain and the catalyticdomain of PKCδ and, upon DAG production, is recruited tocellular membranes following DAG binding and undergoesconformational changes, leading to a rapid fluorescence increase(35, 36). This sensor was demonstrated to produce rapid, robustand reversible changes in green fluorescence in a live-cellassay (35).
Control short-hairpin RNA (Cont shRNA) plasmid-A (SantaCruz Biotechnology), PKCδ shRNA plasmid (h) (Santa CruzBiotechnology) or a mixture of three pSIREN-RetroQ retroviralvectors (Clontech) encoding shRNAs against human PKCδ (37)were used to generate stable JE6.1 Jurkat clones. All theseplasmids expressed a puromycin resistance gene for the selectionof stably transfected clones. The plasmids were verified bysequencing. For characterization of control and PKCδ-interferedJurkat stable clones, PKCδ levels were analyzed by WB andcell surface levels of CD3/TCR, CD2, CD4, LFA-1, CD28,CD45, and CD95 (Fas) were analyzed by flow cytometry afterexpansion of the cell clones obtained by limiting dilution. Fortransient transfection experiments, J-HM1-2.2 and Jurkat cloneswere transiently transfected with 20–30 µg of the plasmidsas described (13). For exosome secretion experiments, mousePKCδ expression constructs were transiently co-transfectedwith exosome reporter GFP-CD63 expression plasmid in a 3:1molecular ratio (26). Human primary T lymphoblasts werecultured in the presence of IL-2 as previously described (31) andwere transfected, between 3 and 7 days after the addition of IL-2,with 2 µg of the indicated expression and interference plasmids,by using an appropriate nucleofector kit (Amaxa R© Human TCellNucleofector R© Kit, Program T-20 or T-23 for Nucleofector R© I).
Antibodies and ReagentsAntibodies used in this study were obtained from the indicatedsources: rabbit monoclonal anti-human PKCδ EP1486Y (Abcam)for WB (this antibody does not recognize mouse PKCδ); rabbitpolyclonal anti-rat PKCδ C-17 (Santa Cruz Biotechnology) forWB (recognizes both human and mouse PKCδ); anti-humanCD3 UCHT1 (BD Biosciences and Santa Cruz Biotechnology)for cell stimulation and immunofluorescence; rabbit polyclonalanti-phospho-PKCδThr505 (Cell Signaling Technology) for WB;mouse monoclonal anti-CD63 clone NKI-C-3 (Oncogene) forWB; mouse monoclonal anti-CD63 clone TA3/18 (Immunostep)for immunofluorescence; and mouse monoclonal anti-γ-tubulin(SIGMA) for immunofluorescence. Fluorochrome-coupledsecondary antibodies (goat-anti-mouse IgG AF488 A-11029,goat-anti-rabbit IgG AF488 A-11034, goat-anti-mouse IgGAF546 A-11030, goat-anti-mouse IgG AF647 A-21236) forimmunofluorescence were from ThermoFisher. All horseradishperoxidase (HRP)-coupled secondary Abs (goat anti-mouseIgG-HRP, sc-2005 and goat anti-rabbit IgG-HRP, sc-2004)were obtained from Santa Cruz Biotechnology. Cell tracker
blue (CMAC) and phalloidin were from ThermoFisher.Annexin V-PE was from Immunostep. Carbachol (CCH)and staphylococcal enterotoxin E (SEE) were from SIGMAand Toxin Technology, Inc (USA), respectively. Blockingantibody directed against CD95 (Fas), clone DX2, wasfrom BDBiosciences.
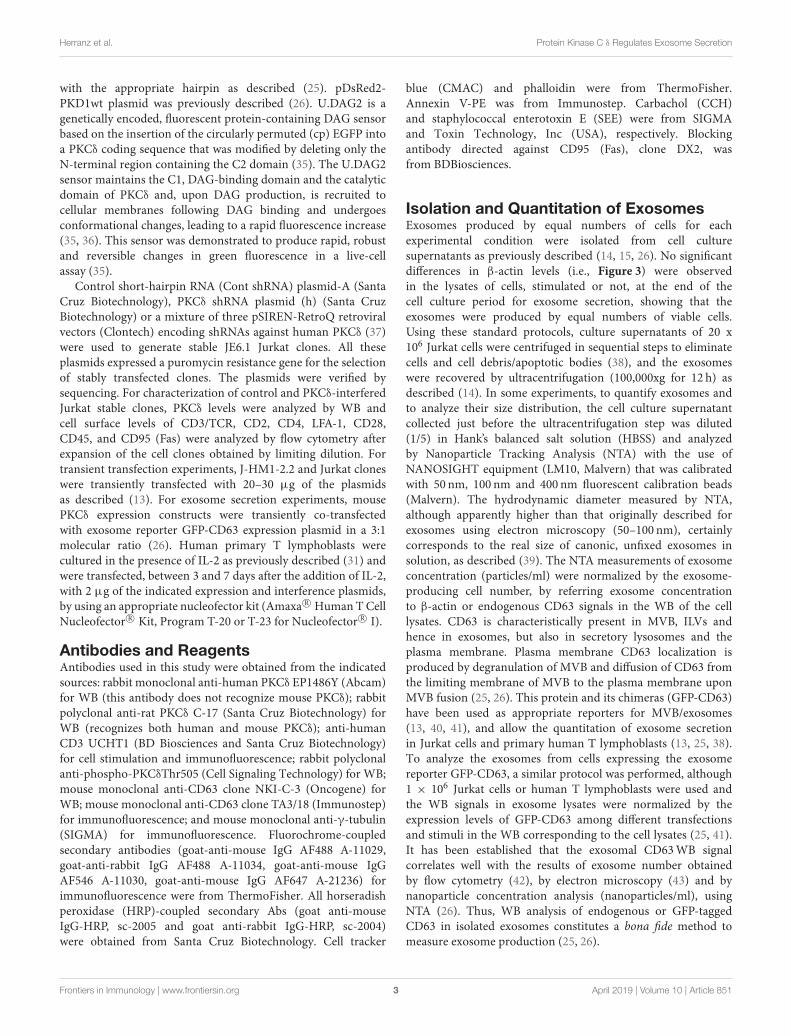
Isolation and Quantitation of ExosomesExosomes produced by equal numbers of cells for eachexperimental condition were isolated from cell culturesupernatants as previously described (14, 15, 26). No significantdifferences in β-actin levels (i.e., Figure 3) were observedin the lysates of cells, stimulated or not, at the end of thecell culture period for exosome secretion, showing that theexosomes were produced by equal numbers of viable cells.Using these standard protocols, culture supernatants of 20 x106 Jurkat cells were centrifuged in sequential steps to eliminatecells and cell debris/apoptotic bodies (38), and the exosomeswere recovered by ultracentrifugation (100,000xg for 12 h) asdescribed (14). In some experiments, to quantify exosomes andto analyze their size distribution, the cell culture supernatantcollected just before the ultracentrifugation step was diluted(1/5) in Hank’s balanced salt solution (HBSS) and analyzedby Nanoparticle Tracking Analysis (NTA) with the use ofNANOSIGHT equipment (LM10, Malvern) that was calibratedwith 50 nm, 100 nm and 400 nm fluorescent calibration beads(Malvern). The hydrodynamic diameter measured by NTA,although apparently higher than that originally described forexosomes using electron microscopy (50–100 nm), certainlycorresponds to the real size of canonic, unfixed exosomes insolution, as described (39). The NTA measurements of exosomeconcentration (particles/ml) were normalized by the exosome-producing cell number, by referring exosome concentrationto β-actin or endogenous CD63 signals in the WB of the celllysates. CD63 is characteristically present in MVB, ILVs andhence in exosomes, but also in secretory lysosomes and theplasma membrane. Plasma membrane CD63 localization isproduced by degranulation of MVB and diffusion of CD63 fromthe limiting membrane of MVB to the plasma membrane uponMVB fusion (25, 26). This protein and its chimeras (GFP-CD63)have been used as appropriate reporters for MVB/exosomes(13, 40, 41), and allow the quantitation of exosome secretionin Jurkat cells and primary human T lymphoblasts (13, 25, 38).To analyze the exosomes from cells expressing the exosomereporter GFP-CD63, a similar protocol was performed, although1 × 106 Jurkat cells or human T lymphoblasts were used andthe WB signals in exosome lysates were normalized by theexpression levels of GFP-CD63 among different transfectionsand stimuli in the WB corresponding to the cell lysates (25, 41).It has been established that the exosomal CD63WB signalcorrelates well with the results of exosome number obtainedby flow cytometry (42), by electron microscopy (43) and bynanoparticle concentration analysis (nanoparticles/ml), usingNTA (26). Thus, WB analysis of endogenous or GFP-taggedCD63 in isolated exosomes constitutes a bona fide method tomeasure exosome production (25, 26).
Frontiers in Immunology | www.frontiersin.org 3 April 2019 | Volume 10 | Article 851
Herranz et al. Protein Kinase C δ Regulates Exosome Secretion
Western Blot Analysis of Cell and ExosomeLysatesCells and isolated exosomes were lysed in RIPA lysis buffercontaining protease inhibitors. Approximately 50µg of exosomalproteins was recovered in the 100,000xg pellet from 20 × 106
cells. Exosomes were resuspended in 60 µl of RIPA lysis bufferand 20 µl of exosomal or cell lysates were separated on SDS-PAGE under reducing conditions and transferred to HybondTM
ECLTM membranes (GE Healthcare). For CD63 detection,proteins were separated under non-reducing conditions asdescribed (13). For WB analysis of exosomes, each lanecontained the total exosomal protein that was recovered inthe culture medium from the same number of cells, untreatedor treated with stimuli. Blots were incubated with mouseanti-CD63 (clone NKI-C-3, Oncogene) and developed withthe appropriate HRP-conjugated secondary antibody usingenhanced chemiluminescence (ECL). Autoradiography filmswere scanned and the bands were quantified with the useof Quantity One 4.4.0 (Bio-Rad) and ImageJ (Rasband, W.S.,ImageJ, National Institutes of Health, Bethesda, Maryland, USA,http://rsb.info.nih.gov/ij/, 1997-2004) software.
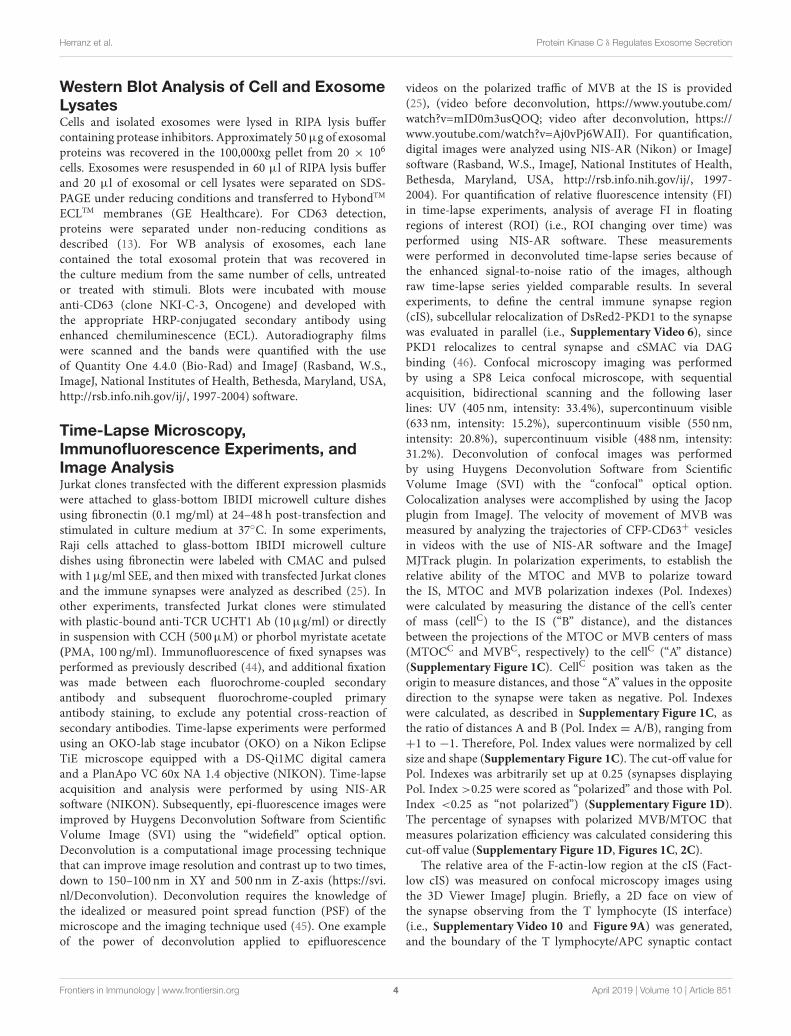
Time-Lapse Microscopy,Immunofluorescence Experiments, andImage AnalysisJurkat clones transfected with the different expression plasmidswere attached to glass-bottom IBIDI microwell culture dishesusing fibronectin (0.1 mg/ml) at 24–48 h post-transfection andstimulated in culture medium at 37◦C. In some experiments,Raji cells attached to glass-bottom IBIDI microwell culturedishes using fibronectin were labeled with CMAC and pulsedwith 1µg/ml SEE, and then mixed with transfected Jurkat clonesand the immune synapses were analyzed as described (25). Inother experiments, transfected Jurkat clones were stimulatedwith plastic-bound anti-TCR UCHT1 Ab (10µg/ml) or directlyin suspension with CCH (500µM) or phorbol myristate acetate(PMA, 100 ng/ml). Immunofluorescence of fixed synapses wasperformed as previously described (44), and additional fixationwas made between each fluorochrome-coupled secondaryantibody and subsequent fluorochrome-coupled primaryantibody staining, to exclude any potential cross-reaction ofsecondary antibodies. Time-lapse experiments were performedusing an OKO-lab stage incubator (OKO) on a Nikon EclipseTiE microscope equipped with a DS-Qi1MC digital cameraand a PlanApo VC 60x NA 1.4 objective (NIKON). Time-lapseacquisition and analysis were performed by using NIS-ARsoftware (NIKON). Subsequently, epi-fluorescence images wereimproved by Huygens Deconvolution Software from ScientificVolume Image (SVI) using the “widefield” optical option.Deconvolution is a computational image processing techniquethat can improve image resolution and contrast up to two times,down to 150–100 nm in XY and 500 nm in Z-axis (https://svi.nl/Deconvolution). Deconvolution requires the knowledge ofthe idealized or measured point spread function (PSF) of themicroscope and the imaging technique used (45). One exampleof the power of deconvolution applied to epifluorescence
videos on the polarized traffic of MVB at the IS is provided(25), (video before deconvolution, https://www.youtube.com/watch?v=mID0m3usQOQ; video after deconvolution, https://www.youtube.com/watch?v=Aj0vPj6WAII). For quantification,digital images were analyzed using NIS-AR (Nikon) or ImageJsoftware (Rasband, W.S., ImageJ, National Institutes of Health,Bethesda, Maryland, USA, http://rsb.info.nih.gov/ij/, 1997-2004). For quantification of relative fluorescence intensity (FI)in time-lapse experiments, analysis of average FI in floatingregions of interest (ROI) (i.e., ROI changing over time) wasperformed using NIS-AR software. These measurementswere performed in deconvoluted time-lapse series because ofthe enhanced signal-to-noise ratio of the images, althoughraw time-lapse series yielded comparable results. In severalexperiments, to define the central immune synapse region(cIS), subcellular relocalization of DsRed2-PKD1 to the synapsewas evaluated in parallel (i.e., Supplementary Video 6), sincePKD1 relocalizes to central synapse and cSMAC via DAGbinding (46). Confocal microscopy imaging was performedby using a SP8 Leica confocal microscope, with sequentialacquisition, bidirectional scanning and the following laserlines: UV (405 nm, intensity: 33.4%), supercontinuum visible(633 nm, intensity: 15.2%), supercontinuum visible (550 nm,intensity: 20.8%), supercontinuum visible (488 nm, intensity:31.2%). Deconvolution of confocal images was performedby using Huygens Deconvolution Software from ScientificVolume Image (SVI) with the “confocal” optical option.Colocalization analyses were accomplished by using the Jacopplugin from ImageJ. The velocity of movement of MVB wasmeasured by analyzing the trajectories of CFP-CD63+ vesiclesin videos with the use of NIS-AR software and the ImageJMJTrack plugin. In polarization experiments, to establish therelative ability of the MTOC and MVB to polarize towardthe IS, MTOC and MVB polarization indexes (Pol. Indexes)were calculated by measuring the distance of the cell’s centerof mass (cellC) to the IS (“B” distance), and the distancesbetween the projections of the MTOC or MVB centers of mass(MTOCC and MVBC, respectively) to the cellC (“A” distance)(Supplementary Figure 1C). CellC position was taken as theorigin to measure distances, and those “A” values in the oppositedirection to the synapse were taken as negative. Pol. Indexeswere calculated, as described in Supplementary Figure 1C, asthe ratio of distances A and B (Pol. Index = A/B), ranging from+1 to −1. Therefore, Pol. Index values were normalized by cellsize and shape (Supplementary Figure 1C). The cut-off value forPol. Indexes was arbitrarily set up at 0.25 (synapses displayingPol. Index >0.25 were scored as “polarized” and those with Pol.Index <0.25 as “not polarized”) (Supplementary Figure 1D).The percentage of synapses with polarized MVB/MTOC thatmeasures polarization efficiency was calculated considering thiscut-off value (Supplementary Figure 1D, Figures 1C, 2C).
The relative area of the F-actin-low region at the cIS (Fact-low cIS) was measured on confocal microscopy images usingthe 3D Viewer ImageJ plugin. Briefly, a 2D face on view ofthe synapse observing from the T lymphocyte (IS interface)(i.e., Supplementary Video 10 and Figure 9A) was generated,and the boundary of the T lymphocyte/APC synaptic contact
Frontiers in Immunology | www.frontiersin.org 4 April 2019 | Volume 10 | Article 851
Herranz et al. Protein Kinase C δ Regulates Exosome Secretion
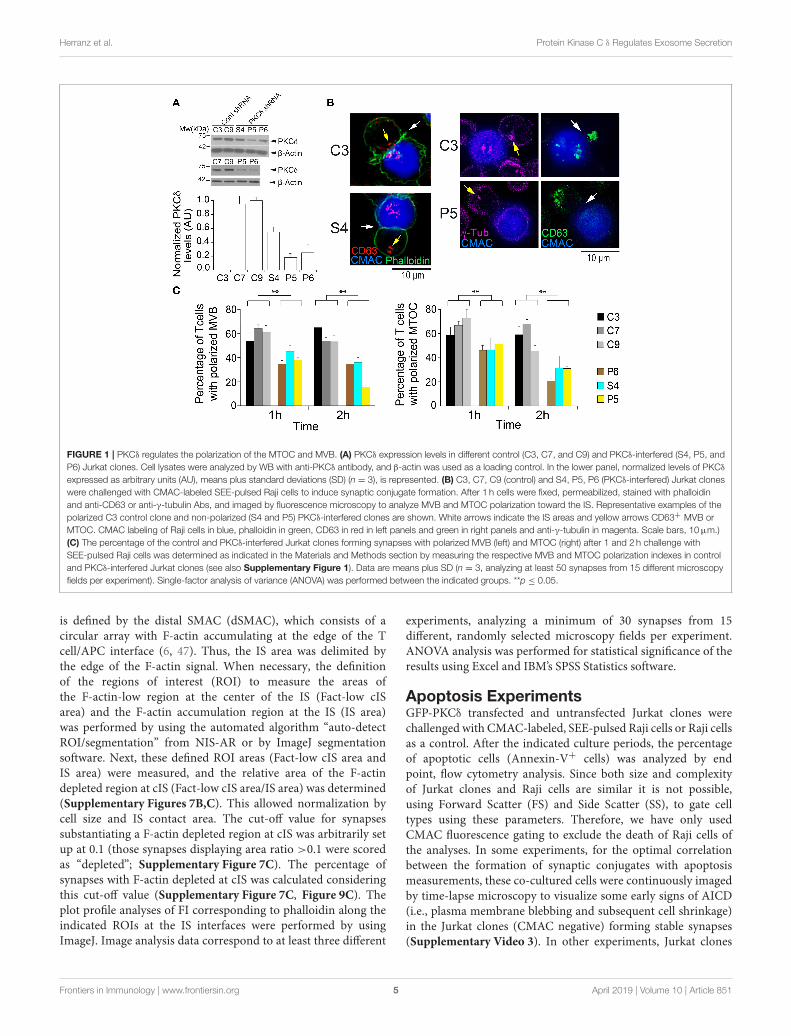
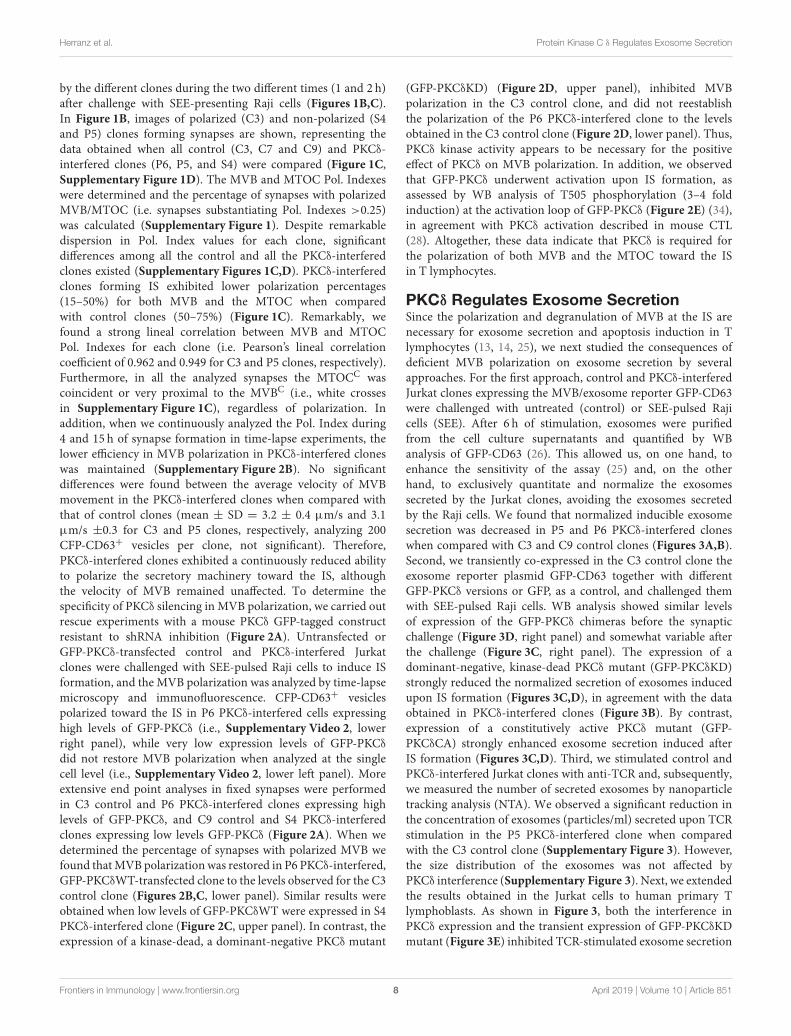
FIGURE 1 | PKCδ regulates the polarization of the MTOC and MVB. (A) PKCδ expression levels in different control (C3, C7, and C9) and PKCδ-interfered (S4, P5, and
P6) Jurkat clones. Cell lysates were analyzed by WB with anti-PKCδ antibody, and β-actin was used as a loading control. In the lower panel, normalized levels of PKCδ
expressed as arbitrary units (AU), means plus standard deviations (SD) (n = 3), is represented. (B) C3, C7, C9 (control) and S4, P5, P6 (PKCδ-interfered) Jurkat clones
were challenged with CMAC-labeled SEE-pulsed Raji cells to induce synaptic conjugate formation. After 1 h cells were fixed, permeabilized, stained with phalloidin
and anti-CD63 or anti-γ-tubulin Abs, and imaged by fluorescence microscopy to analyze MVB and MTOC polarization toward the IS. Representative examples of the
polarized C3 control clone and non-polarized (S4 and P5) PKCδ-interfered clones are shown. White arrows indicate the IS areas and yellow arrows CD63+ MVB or
MTOC. CMAC labeling of Raji cells in blue, phalloidin in green, CD63 in red in left panels and green in right panels and anti-γ-tubulin in magenta. Scale bars, 10µm.)
(C) The percentage of the control and PKCδ-interfered Jurkat clones forming synapses with polarized MVB (left) and MTOC (right) after 1 and 2 h challenge with
SEE-pulsed Raji cells was determined as indicated in the Materials and Methods section by measuring the respective MVB and MTOC polarization indexes in control
and PKCδ-interfered Jurkat clones (see also Supplementary Figure 1). Data are means plus SD (n = 3, analyzing at least 50 synapses from 15 different microscopy
fields per experiment). Single-factor analysis of variance (ANOVA) was performed between the indicated groups. **p ≤ 0.05.
is defined by the distal SMAC (dSMAC), which consists of acircular array with F-actin accumulating at the edge of the Tcell/APC interface (6, 47). Thus, the IS area was delimited bythe edge of the F-actin signal. When necessary, the definitionof the regions of interest (ROI) to measure the areas ofthe F-actin-low region at the center of the IS (Fact-low cISarea) and the F-actin accumulation region at the IS (IS area)was performed by using the automated algorithm “auto-detectROI/segmentation” from NIS-AR or by ImageJ segmentationsoftware. Next, these defined ROI areas (Fact-low cIS area andIS area) were measured, and the relative area of the F-actindepleted region at cIS (Fact-low cIS area/IS area) was determined(Supplementary Figures 7B,C). This allowed normalization bycell size and IS contact area. The cut-off value for synapsessubstantiating a F-actin depleted region at cIS was arbitrarily setup at 0.1 (those synapses displaying area ratio >0.1 were scoredas “depleted”; Supplementary Figure 7C). The percentage ofsynapses with F-actin depleted at cIS was calculated consideringthis cut-off value (Supplementary Figure 7C, Figure 9C). Theplot profile analyses of FI corresponding to phalloidin along theindicated ROIs at the IS interfaces were performed by usingImageJ. Image analysis data correspond to at least three different
experiments, analyzing a minimum of 30 synapses from 15different, randomly selected microscopy fields per experiment.ANOVA analysis was performed for statistical significance of theresults using Excel and IBM’s SPSS Statistics software.
Apoptosis ExperimentsGFP-PKCδ transfected and untransfected Jurkat clones werechallenged with CMAC-labeled, SEE-pulsed Raji cells or Raji cellsas a control. After the indicated culture periods, the percentageof apoptotic cells (Annexin-V+ cells) was analyzed by endpoint, flow cytometry analysis. Since both size and complexityof Jurkat clones and Raji cells are similar it is not possible,using Forward Scatter (FS) and Side Scatter (SS), to gate celltypes using these parameters. Therefore, we have only usedCMAC fluorescence gating to exclude the death of Raji cells ofthe analyses. In some experiments, for the optimal correlationbetween the formation of synaptic conjugates with apoptosismeasurements, these co-cultured cells were continuously imagedby time-lapse microscopy to visualize some early signs of AICD(i.e., plasma membrane blebbing and subsequent cell shrinkage)in the Jurkat clones (CMAC negative) forming stable synapses(Supplementary Video 3). In other experiments, Jurkat clones
Frontiers in Immunology | www.frontiersin.org 5 April 2019 | Volume 10 | Article 851
Herranz et al. Protein Kinase C δ Regulates Exosome Secretion
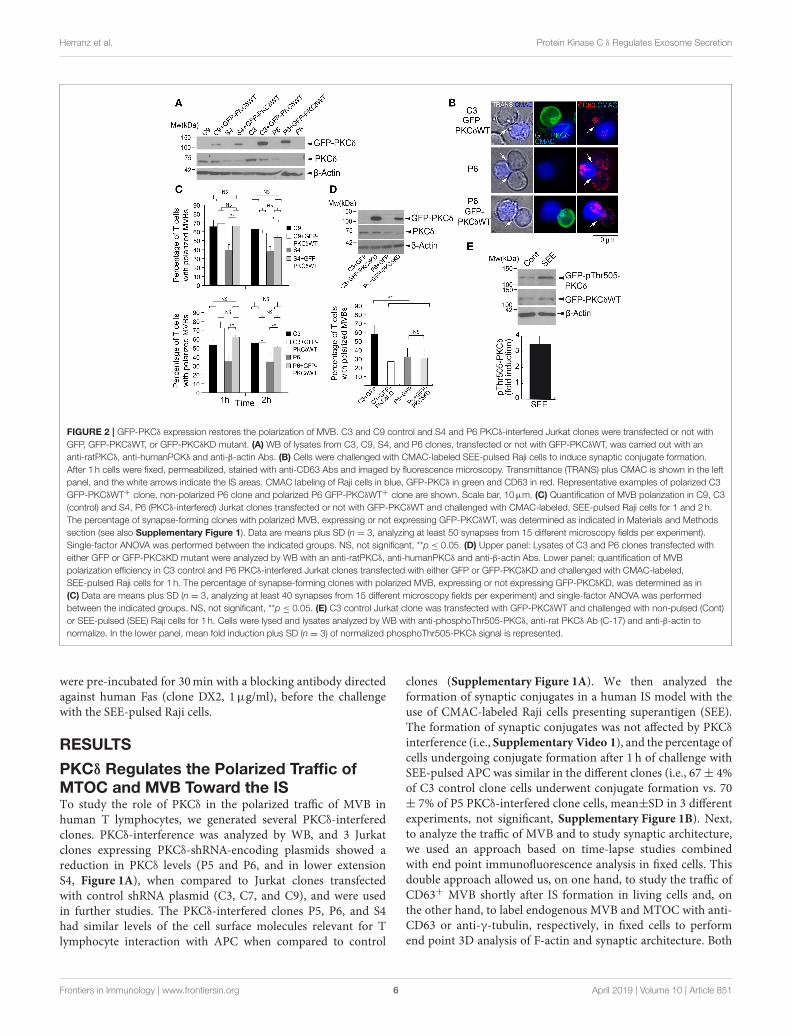
FIGURE 2 | GFP-PKCδ expression restores the polarization of MVB. C3 and C9 control and S4 and P6 PKCδ-interfered Jurkat clones were transfected or not with
GFP, GFP-PKCδWT, or GFP-PKCδKD mutant. (A) WB of lysates from C3, C9, S4, and P6 clones, transfected or not with GFP-PKCδWT, was carried out with an
anti-ratPKCδ, anti-humanPCKδ and anti-β-actin Abs. (B) Cells were challenged with CMAC-labeled SEE-pulsed Raji cells to induce synaptic conjugate formation.
After 1 h cells were fixed, permeabilized, stained with anti-CD63 Abs and imaged by fluorescence microscopy. Transmittance (TRANS) plus CMAC is shown in the left
panel, and the white arrows indicate the IS areas. CMAC labeling of Raji cells in blue, GFP-PKCδ in green and CD63 in red. Representative examples of polarized C3
GFP-PKCδWT+ clone, non-polarized P6 clone and polarized P6 GFP-PKCδWT+ clone are shown. Scale bar, 10µm. (C) Quantification of MVB polarization in C9, C3
(control) and S4, P6 (PKCδ-interfered) Jurkat clones transfected or not with GFP-PKCδWT and challenged with CMAC-labeled, SEE-pulsed Raji cells for 1 and 2 h.
The percentage of synapse-forming clones with polarized MVB, expressing or not expressing GFP-PKCδWT, was determined as indicated in Materials and Methods
section (see also Supplementary Figure 1). Data are means plus SD (n = 3, analyzing at least 50 synapses from 15 different microscopy fields per experiment).
Single-factor ANOVA was performed between the indicated groups. NS, not significant, **p ≤ 0.05. (D) Upper panel: Lysates of C3 and P6 clones transfected with
either GFP or GFP-PKCδKD mutant were analyzed by WB with an anti-ratPKCδ, anti-humanPKCδ and anti-β-actin Abs. Lower panel: quantification of MVB
polarization efficiency in C3 control and P6 PKCδ-interfered Jurkat clones transfected with either GFP or GFP-PKCδKD and challenged with CMAC-labeled,
SEE-pulsed Raji cells for 1 h. The percentage of synapse-forming clones with polarized MVB, expressing or not expressing GFP-PKCδKD, was determined as in
(C) Data are means plus SD (n = 3, analyzing at least 40 synapses from 15 different microscopy fields per experiment) and single-factor ANOVA was performed
between the indicated groups. NS, not significant, **p ≤ 0.05. (E) C3 control Jurkat clone was transfected with GFP-PKCδWT and challenged with non-pulsed (Cont)
or SEE-pulsed (SEE) Raji cells for 1 h. Cells were lysed and lysates analyzed by WB with anti-phosphoThr505-PKCδ, anti-rat PKCδ Ab (C-17) and anti-β-actin to
normalize. In the lower panel, mean fold induction plus SD (n = 3) of normalized phosphoThr505-PKCδ signal is represented.
were pre-incubated for 30min with a blocking antibody directedagainst human Fas (clone DX2, 1µg/ml), before the challengewith the SEE-pulsed Raji cells.
RESULTS
PKCδ Regulates the Polarized Traffic ofMTOC and MVB Toward the ISTo study the role of PKCδ in the polarized traffic of MVB inhuman T lymphocytes, we generated several PKCδ-interferedclones. PKCδ-interference was analyzed by WB, and 3 Jurkatclones expressing PKCδ-shRNA-encoding plasmids showed areduction in PKCδ levels (P5 and P6, and in lower extensionS4, Figure 1A), when compared to Jurkat clones transfectedwith control shRNA plasmid (C3, C7, and C9), and were usedin further studies. The PKCδ-interfered clones P5, P6, and S4had similar levels of the cell surface molecules relevant for Tlymphocyte interaction with APC when compared to control
clones (Supplementary Figure 1A). We then analyzed theformation of synaptic conjugates in a human IS model with theuse of CMAC-labeled Raji cells presenting superantigen (SEE).The formation of synaptic conjugates was not affected by PKCδ
interference (i.e., Supplementary Video 1), and the percentage ofcells undergoing conjugate formation after 1 h of challenge withSEE-pulsed APC was similar in the different clones (i.e., 67± 4%of C3 control clone cells underwent conjugate formation vs. 70± 7% of P5 PKCδ-interfered clone cells, mean±SD in 3 differentexperiments, not significant, Supplementary Figure 1B). Next,to analyze the traffic of MVB and to study synaptic architecture,we used an approach based on time-lapse studies combinedwith end point immunofluorescence analysis in fixed cells. Thisdouble approach allowed us, on one hand, to study the traffic ofCD63+ MVB shortly after IS formation in living cells and, onthe other hand, to label endogenous MVB and MTOC with anti-CD63 or anti-γ-tubulin, respectively, in fixed cells to performend point 3D analysis of F-actin and synaptic architecture. Both
Frontiers in Immunology | www.frontiersin.org 6 April 2019 | Volume 10 | Article 851
Herranz et al. Protein Kinase C δ Regulates Exosome Secretion
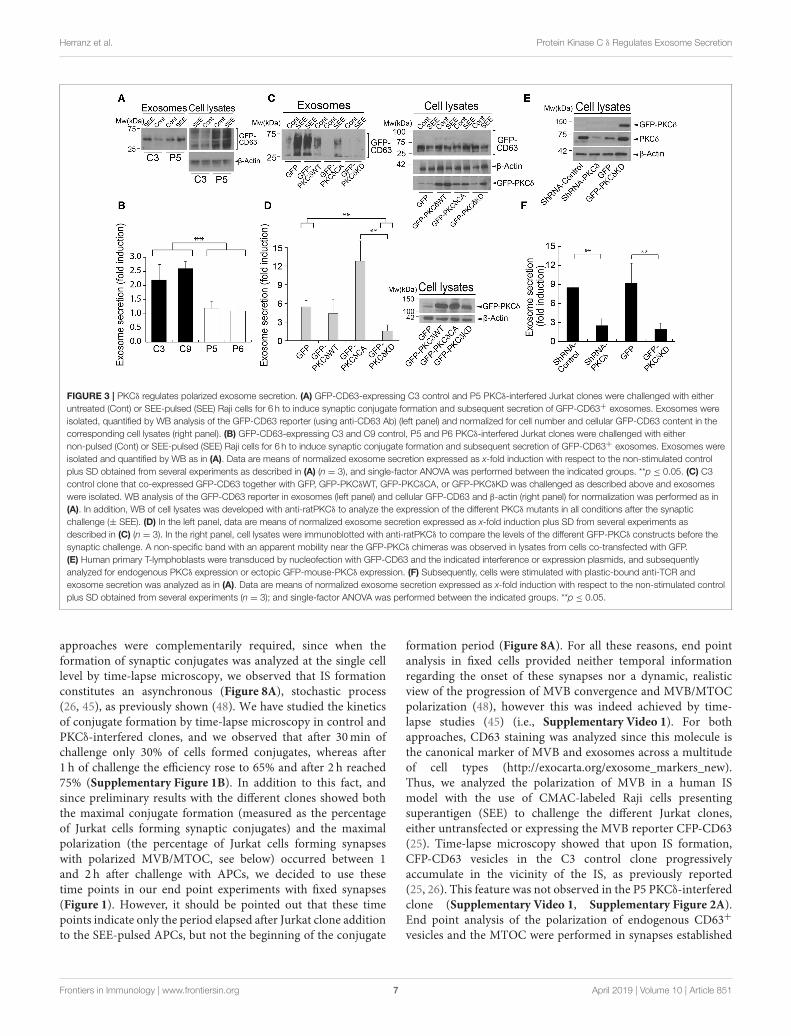
FIGURE 3 | PKCδ regulates polarized exosome secretion. (A) GFP-CD63-expressing C3 control and P5 PKCδ-interfered Jurkat clones were challenged with either
untreated (Cont) or SEE-pulsed (SEE) Raji cells for 6 h to induce synaptic conjugate formation and subsequent secretion of GFP-CD63+ exosomes. Exosomes were
isolated, quantified by WB analysis of the GFP-CD63 reporter (using anti-CD63 Ab) (left panel) and normalized for cell number and cellular GFP-CD63 content in the
corresponding cell lysates (right panel). (B) GFP-CD63-expressing C3 and C9 control, P5 and P6 PKCδ-interfered Jurkat clones were challenged with either
non-pulsed (Cont) or SEE-pulsed (SEE) Raji cells for 6 h to induce synaptic conjugate formation and subsequent secretion of GFP-CD63+ exosomes. Exosomes were
isolated and quantified by WB as in (A). Data are means of normalized exosome secretion expressed as x-fold induction with respect to the non-stimulated control
plus SD obtained from several experiments as described in (A) (n = 3), and single-factor ANOVA was performed between the indicated groups. **p ≤ 0.05. (C) C3
control clone that co-expressed GFP-CD63 together with GFP, GFP-PKCδWT, GFP-PKCδCA, or GFP-PKCδKD was challenged as described above and exosomes
were isolated. WB analysis of the GFP-CD63 reporter in exosomes (left panel) and cellular GFP-CD63 and β-actin (right panel) for normalization was performed as in
(A). In addition, WB of cell lysates was developed with anti-ratPKCδ to analyze the expression of the different PKCδ mutants in all conditions after the synaptic
challenge (± SEE). (D) In the left panel, data are means of normalized exosome secretion expressed as x-fold induction plus SD from several experiments as
described in (C) (n = 3). In the right panel, cell lysates were immunoblotted with anti-ratPKCδ to compare the levels of the different GFP-PKCδ constructs before the
synaptic challenge. A non-specific band with an apparent mobility near the GFP-PKCδ chimeras was observed in lysates from cells co-transfected with GFP.
(E) Human primary T-lymphoblasts were transduced by nucleofection with GFP-CD63 and the indicated interference or expression plasmids, and subsequently
analyzed for endogenous PKCδ expression or ectopic GFP-mouse-PKCδ expression. (F) Subsequently, cells were stimulated with plastic-bound anti-TCR and
exosome secretion was analyzed as in (A). Data are means of normalized exosome secretion expressed as x-fold induction with respect to the non-stimulated control
plus SD obtained from several experiments (n = 3); and single-factor ANOVA was performed between the indicated groups. **p ≤ 0.05.
approaches were complementarily required, since when theformation of synaptic conjugates was analyzed at the single celllevel by time-lapse microscopy, we observed that IS formationconstitutes an asynchronous (Figure 8A), stochastic process(26, 45), as previously shown (48). We have studied the kineticsof conjugate formation by time-lapse microscopy in control andPKCδ-interfered clones, and we observed that after 30min ofchallenge only 30% of cells formed conjugates, whereas after1 h of challenge the efficiency rose to 65% and after 2 h reached75% (Supplementary Figure 1B). In addition to this fact, andsince preliminary results with the different clones showed boththe maximal conjugate formation (measured as the percentageof Jurkat cells forming synaptic conjugates) and the maximalpolarization (the percentage of Jurkat cells forming synapseswith polarized MVB/MTOC, see below) occurred between 1and 2 h after challenge with APCs, we decided to use thesetime points in our end point experiments with fixed synapses(Figure 1). However, it should be pointed out that these timepoints indicate only the period elapsed after Jurkat clone additionto the SEE-pulsed APCs, but not the beginning of the conjugate
formation period (Figure 8A). For all these reasons, end pointanalysis in fixed cells provided neither temporal informationregarding the onset of these synapses nor a dynamic, realisticview of the progression of MVB convergence and MVB/MTOCpolarization (48), however this was indeed achieved by time-lapse studies (45) (i.e., Supplementary Video 1). For bothapproaches, CD63 staining was analyzed since this molecule isthe canonical marker of MVB and exosomes across a multitudeof cell types (http://exocarta.org/exosome_markers_new).Thus, we analyzed the polarization of MVB in a human ISmodel with the use of CMAC-labeled Raji cells presentingsuperantigen (SEE) to challenge the different Jurkat clones,either untransfected or expressing the MVB reporter CFP-CD63(25). Time-lapse microscopy showed that upon IS formation,CFP-CD63 vesicles in the C3 control clone progressivelyaccumulate in the vicinity of the IS, as previously reported(25, 26). This feature was not observed in the P5 PKCδ-interferedclone (Supplementary Video 1, Supplementary Figure 2A).End point analysis of the polarization of endogenous CD63+
vesicles and the MTOC were performed in synapses established
Frontiers in Immunology | www.frontiersin.org 7 April 2019 | Volume 10 | Article 851
Herranz et al. Protein Kinase C δ Regulates Exosome Secretion
by the different clones during the two different times (1 and 2 h)after challenge with SEE-presenting Raji cells (Figures 1B,C).In Figure 1B, images of polarized (C3) and non-polarized (S4and P5) clones forming synapses are shown, representing thedata obtained when all control (C3, C7 and C9) and PKCδ-interfered clones (P6, P5, and S4) were compared (Figure 1C,Supplementary Figure 1D). The MVB and MTOC Pol. Indexeswere determined and the percentage of synapses with polarizedMVB/MTOC (i.e. synapses substantiating Pol. Indexes >0.25)was calculated (Supplementary Figure 1). Despite remarkabledispersion in Pol. Index values for each clone, significantdifferences among all the control and all the PKCδ-interferedclones existed (Supplementary Figures 1C,D). PKCδ-interferedclones forming IS exhibited lower polarization percentages(15–50%) for both MVB and the MTOC when comparedwith control clones (50–75%) (Figure 1C). Remarkably, wefound a strong lineal correlation between MVB and MTOCPol. Indexes for each clone (i.e. Pearson’s lineal correlationcoefficient of 0.962 and 0.949 for C3 and P5 clones, respectively).Furthermore, in all the analyzed synapses the MTOCC wascoincident or very proximal to the MVBC (i.e., white crossesin Supplementary Figure 1C), regardless of polarization. Inaddition, when we continuously analyzed the Pol. Index during4 and 15 h of synapse formation in time-lapse experiments, thelower efficiency in MVB polarization in PKCδ-interfered cloneswas maintained (Supplementary Figure 2B). No significantdifferences were found between the average velocity of MVBmovement in the PKCδ-interfered clones when compared withthat of control clones (mean ± SD = 3.2 ± 0.4 µm/s and 3.1µm/s ±0.3 for C3 and P5 clones, respectively, analyzing 200CFP-CD63+ vesicles per clone, not significant). Therefore,PKCδ-interfered clones exhibited a continuously reduced abilityto polarize the secretory machinery toward the IS, althoughthe velocity of MVB remained unaffected. To determine thespecificity of PKCδ silencing in MVB polarization, we carried outrescue experiments with a mouse PKCδ GFP-tagged constructresistant to shRNA inhibition (Figure 2A). Untransfected orGFP-PKCδ-transfected control and PKCδ-interfered Jurkatclones were challenged with SEE-pulsed Raji cells to induce ISformation, and the MVB polarization was analyzed by time-lapsemicroscopy and immunofluorescence. CFP-CD63+ vesiclespolarized toward the IS in P6 PKCδ-interfered cells expressinghigh levels of GFP-PKCδ (i.e., Supplementary Video 2, lowerright panel), while very low expression levels of GFP-PKCδ
did not restore MVB polarization when analyzed at the singlecell level (i.e., Supplementary Video 2, lower left panel). Moreextensive end point analyses in fixed synapses were performedin C3 control and P6 PKCδ-interfered clones expressing highlevels of GFP-PKCδ, and C9 control and S4 PKCδ-interferedclones expressing low levels GFP-PKCδ (Figure 2A). When wedetermined the percentage of synapses with polarized MVB wefound thatMVB polarizationwas restored in P6 PKCδ-interfered,GFP-PKCδWT-transfected clone to the levels observed for the C3control clone (Figures 2B,C, lower panel). Similar results wereobtained when low levels of GFP-PKCδWT were expressed in S4PKCδ-interfered clone (Figure 2C, upper panel). In contrast, theexpression of a kinase-dead, a dominant-negative PKCδ mutant
(GFP-PKCδKD) (Figure 2D, upper panel), inhibited MVBpolarization in the C3 control clone, and did not reestablishthe polarization of the P6 PKCδ-interfered clone to the levelsobtained in the C3 control clone (Figure 2D, lower panel). Thus,PKCδ kinase activity appears to be necessary for the positiveeffect of PKCδ on MVB polarization. In addition, we observedthat GFP-PKCδ underwent activation upon IS formation, asassessed by WB analysis of T505 phosphorylation (3–4 foldinduction) at the activation loop of GFP-PKCδ (Figure 2E) (34),in agreement with PKCδ activation described in mouse CTL(28). Altogether, these data indicate that PKCδ is required forthe polarization of both MVB and the MTOC toward the ISin T lymphocytes.
PKCδ Regulates Exosome SecretionSince the polarization and degranulation of MVB at the IS arenecessary for exosome secretion and apoptosis induction in Tlymphocytes (13, 14, 25), we next studied the consequences ofdeficient MVB polarization on exosome secretion by severalapproaches. For the first approach, control and PKCδ-interferedJurkat clones expressing the MVB/exosome reporter GFP-CD63were challenged with untreated (control) or SEE-pulsed Rajicells (SEE). After 6 h of stimulation, exosomes were purifiedfrom the cell culture supernatants and quantified by WBanalysis of GFP-CD63 (26). This allowed us, on one hand, toenhance the sensitivity of the assay (25) and, on the otherhand, to exclusively quantitate and normalize the exosomessecreted by the Jurkat clones, avoiding the exosomes secretedby the Raji cells. We found that normalized inducible exosomesecretion was decreased in P5 and P6 PKCδ-interfered cloneswhen compared with C3 and C9 control clones (Figures 3A,B).Second, we transiently co-expressed in the C3 control clone theexosome reporter plasmid GFP-CD63 together with differentGFP-PKCδ versions or GFP, as a control, and challenged themwith SEE-pulsed Raji cells. WB analysis showed similar levelsof expression of the GFP-PKCδ chimeras before the synapticchallenge (Figure 3D, right panel) and somewhat variable afterthe challenge (Figure 3C, right panel). The expression of adominant-negative, kinase-dead PKCδ mutant (GFP-PKCδKD)strongly reduced the normalized secretion of exosomes inducedupon IS formation (Figures 3C,D), in agreement with the dataobtained in PKCδ-interfered clones (Figure 3B). By contrast,expression of a constitutively active PKCδ mutant (GFP-PKCδCA) strongly enhanced exosome secretion induced afterIS formation (Figures 3C,D). Third, we stimulated control andPKCδ-interfered Jurkat clones with anti-TCR and, subsequently,we measured the number of secreted exosomes by nanoparticletracking analysis (NTA). We observed a significant reduction inthe concentration of exosomes (particles/ml) secreted upon TCRstimulation in the P5 PKCδ-interfered clone when comparedwith the C3 control clone (Supplementary Figure 3). However,the size distribution of the exosomes was not affected byPKCδ interference (Supplementary Figure 3). Next, we extendedthe results obtained in the Jurkat cells to human primary Tlymphoblasts. As shown in Figure 3, both the interference inPKCδ expression and the transient expression of GFP-PKCδKDmutant (Figure 3E) inhibited TCR-stimulated exosome secretion
Frontiers in Immunology | www.frontiersin.org 8 April 2019 | Volume 10 | Article 851
Herranz et al. Protein Kinase C δ Regulates Exosome Secretion
(Figure 3F). Together, these results demonstrate that PKCδ isnecessary for inducible exosome secretion in T lymphocytes.
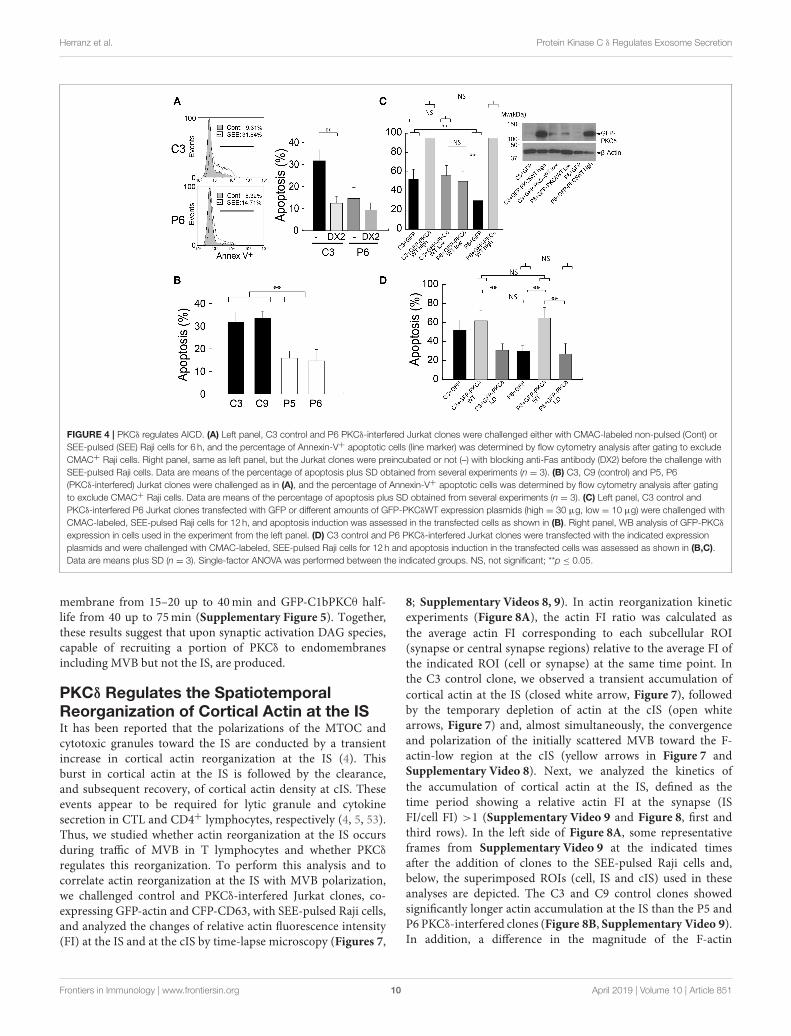
PKCδ Regulates AICDFasL-containing exosomes secreted upon IS formation areinvolved in autocrine T lymphocyte AICD (13, 14). Thus, it isconceivable that the decreased exosome secretion observed inPKCδ-interfered clones may affect AICD. To test this hypothesis,control and PKCδ-interfered Jurkat clones were challengedwith non-pulsed or SEE-pulsed Raji cells for 6 h and endpoint apoptosis was measured by Annexin-V binding and flowcytometry analysis. We observed a 3.4-fold increase in apoptosisin the C3 control clone (9% apoptotic cells without SEE vs. 32%apoptotic cells with SEE). However, the apoptosis induction inP6 PKCδ-interfered clone was lower, with a 1.8-fold increase(8% apoptotic cells without SEE vs. 15% apoptotic cells withSEE) (Figure 4A, left panel). Comparable results were obtainedwhen other control and PKCδ-interfered clones were challengedin parallel (C9 and P5, Figure 4B). The AICD produced uponsynaptic challenge was dependent of Fas ligand/Fas interaction,since apoptosis was inhibited when C3 and P6 clones were pre-incubated with a blocking antibody directed against human Fas(clone DX2) (13) before the challenge with SEE-pulsed Raji cells(Figure 4A, right panel). In addition, time-lapse imaging of GFP-PKCδ-expressing clones showed evidence for early apoptosis(i.e. plasma membrane blebs and cell shrinkage) between 2 and5 h after IS formation (Supplementary Video 3, red arrows),in agreement with our previous results (25). Furthermore,expression of both high and low levels of GFP-PKCδ in theC3 control and P6 PKCδ-interfered clones (Figure 4C, rightpanel) showed a similar percentage of apoptotic cells uponstable IS formation (Supplementary Video 3), as assessed by flowcytometry (Figure 4C). Thus, deficient apoptosis was rescuedwhen GFP-PKCδWT was expressed in P6 PKCδ-interferedJurkat clone, in accordance with the observed increase in MVBpolarization toward the IS (Figure 2C). However, the expressionof a kinase-dead PKCδ mutant (GFP-PKCδKD) in the P6 PKCδ-interfered clone did not restore the AICD to the levels obtainedin the C3 control clone (Figure 4D). Thus, PKCδ kinase activityseems to be required for the positive effect of PKCδ on AICD asit was for MVB polarization and exosome secretion. Togetherthese data indicate that PKCδ is required for the secretion ofFasL-containing exosomes and subsequently AICD.
DAG Recruits PKCδ to Polarized MVB butNot to the ISTo improve our understanding of the molecular basis underlyingthe PKCδ effect on MVB polarization, we first analyzed thedynamics of PKCδ subcellular localization upon IS formation.Imaging of control Jurkat clones expressing GFP-PKCδ showedthat IS formation induced a partial redistribution of GFP-PKCδ from cytosol to a ring-shaped area nearby the MVBand proximal to the IS that was concomitant to its activation(Supplementary Video 2 -top right panel-, Figures 2B, 5). Ithas been described that DAG recruits PKCδ to membranesthrough its C1 DAG-binding domains, and this leads to PKCδ
activation (49). Thus, in order to optimally detect subcellular
changes in the PKCδ activator DAG, we used U.DAG2, whichupon DAG binding increases its fluorescence (35, 36). We firstvalidated the sensor transfecting J-HM1-2.2 cells with U.DAG2and stimulated them with either CCH or PMA. We used GFP-C1bPKCθ, another DAG sensor based on the C1b domain ofPKCθ, as a control since it does not enhance its fluorescencewhen it binds DAG (50). The FI ratio along time for eachconstruction was calculated as the average FI correspondingto the cell ROI at different time points relative to the averageFI of the same cell ROI at the initial time point. CCH andPMA induced recruitment of both DAG sensors to the plasmamembrane (although the effect with PMA was stronger thanCCH), and a concomitant increase in relative U.DAG2 FI, asopposed to relative GFP-C1bPKCθ FI (Supplementary Figure 4
and Supplementary Video 4, first concatenated video). Wethen co-expressed CFP-CD63 and U.DAG2 in J-HM1-2.2cells and stimulated them with either plastic-bound anti-TCR (51) or with CMAC-labeled SEE-pulsed Raji cells totest whether DAG was generated during MVB polarization.Time-lapse imaging showed an increase in the U.DAG2 FIratio (Figure 5B) upon TCR stimulation, concomitant with thecentripetal convergence of MVB toward the center of the cellin contact with the coverslip surface, that corresponded to thesecretory domain next to cSMAC (52) (Supplementary Video 4,2nd concatenated video, Figure 5B). Furthermore, during ISformation, accumulations of U.DAG2 co-migrating with MVBand a simultaneous enhancement of U.DAG2 FI, were alsoobserved (yellow arrows in Figure 5C, Supplementary Video 5
and Supplementary Figure 6). Interestingly, when we co-expressed CFP-CD63 and GFP-PKCδ, we observed GFP-PKCδ
accumulations that may co-migrate with MVB toward theIS (yellow arrows in J-HM1-2.2 and P6 panels, Figure 5C
and Supplementary Video 2), although temporal segregationbetween these subcellular structures was also evident (yellowarrows in C3 panel, Figure 5C and Supplementary Video 2).To further study this potential association and to analyze thesubcellular localization of U.DAG2 and GFP-PKCδ with respectto the MVB, we carried out confocal microscopy. We foundthat the accumulation of U.DAG2 observed in living cellsupon IS formation colocalized with the MVB marker CD63(Figure 6A). Furthermore, GFP-PKCδ also partially colocalizedwith CD63+ structures (Figure 6B). These partial colocalizationsof U.DAG2 andGFP-PKCδwith CD63were indeed specific, sincePearson’s correlation coefficients of scatter plot fluorograms weresignificantly different from those corresponding to the analysisof U.DAG2 or GFP-PKCδ vs. cytosolic CMAC, (Figure 6C).Remarkably, we could not detect any recruitment of GFP-PKCδ
to the synaptic membrane (Supplementary Video 6) whereas,in parallel, relocalization of PKD1 or C1bPKCθ domain tothis membrane was evident (Supplementary Videos 6, 7). Therelocalization of both PKD1 and C1bPKCθ was dependent ontransient DAG production at the IS, since interference in DGKα
that enhances both DAG levels (24) and PKD1 activation (26),increased PKD1 and C1bPKCθ residence half-life at the synapseas assessed by time-lapse video analysis (Supplementary Video 7
and Supplementary Figure 5). DGKα attenuation significantlyenhanced mean DsRed2-PKD1 residence half-life at the synaptic
Frontiers in Immunology | www.frontiersin.org 9 April 2019 | Volume 10 | Article 851
Herranz et al. Protein Kinase C δ Regulates Exosome Secretion
FIGURE 4 | PKCδ regulates AICD. (A) Left panel, C3 control and P6 PKCδ-interfered Jurkat clones were challenged either with CMAC-labeled non-pulsed (Cont) or
SEE-pulsed (SEE) Raji cells for 6 h, and the percentage of Annexin-V+ apoptotic cells (line marker) was determined by flow cytometry analysis after gating to exclude
CMAC+ Raji cells. Right panel, same as left panel, but the Jurkat clones were preincubated or not (–) with blocking anti-Fas antibody (DX2) before the challenge with
SEE-pulsed Raji cells. Data are means of the percentage of apoptosis plus SD obtained from several experiments (n = 3). (B) C3, C9 (control) and P5, P6
(PKCδ-interfered) Jurkat clones were challenged as in (A), and the percentage of Annexin-V+ apoptotic cells was determined by flow cytometry analysis after gating
to exclude CMAC+ Raji cells. Data are means of the percentage of apoptosis plus SD obtained from several experiments (n = 3). (C) Left panel, C3 control and
PKCδ-interfered P6 Jurkat clones transfected with GFP or different amounts of GFP-PKCδWT expression plasmids (high = 30 µg, low = 10 µg) were challenged with
CMAC-labeled, SEE-pulsed Raji cells for 12 h, and apoptosis induction was assessed in the transfected cells as shown in (B). Right panel, WB analysis of GFP-PKCδ
expression in cells used in the experiment from the left panel. (D) C3 control and P6 PKCδ-interfered Jurkat clones were transfected with the indicated expression
plasmids and were challenged with CMAC-labeled, SEE-pulsed Raji cells for 12 h and apoptosis induction in the transfected cells was assessed as shown in (B,C).
Data are means plus SD (n = 3). Single-factor ANOVA was performed between the indicated groups. NS, not significant; **p ≤ 0.05.
membrane from 15–20 up to 40min and GFP-C1bPKCθ half-life from 40 up to 75min (Supplementary Figure 5). Together,these results suggest that upon synaptic activation DAG species,capable of recruiting a portion of PKCδ to endomembranesincluding MVB but not the IS, are produced.
PKCδ Regulates the SpatiotemporalReorganization of Cortical Actin at the ISIt has been reported that the polarizations of the MTOC andcytotoxic granules toward the IS are conducted by a transientincrease in cortical actin reorganization at the IS (4). Thisburst in cortical actin at the IS is followed by the clearance,and subsequent recovery, of cortical actin density at cIS. Theseevents appear to be required for lytic granule and cytokinesecretion in CTL and CD4+ lymphocytes, respectively (4, 5, 53).Thus, we studied whether actin reorganization at the IS occursduring traffic of MVB in T lymphocytes and whether PKCδ
regulates this reorganization. To perform this analysis and tocorrelate actin reorganization at the IS with MVB polarization,we challenged control and PKCδ-interfered Jurkat clones, co-expressing GFP-actin and CFP-CD63, with SEE-pulsed Raji cells,and analyzed the changes of relative actin fluorescence intensity(FI) at the IS and at the cIS by time-lapse microscopy (Figures 7,
8; Supplementary Videos 8, 9). In actin reorganization kineticexperiments (Figure 8A), the actin FI ratio was calculated as
the average actin FI corresponding to each subcellular ROI(synapse or central synapse regions) relative to the average FI ofthe indicated ROI (cell or synapse) at the same time point. Inthe C3 control clone, we observed a transient accumulation of
cortical actin at the IS (closed white arrow, Figure 7), followedby the temporary depletion of actin at the cIS (open whitearrows, Figure 7) and, almost simultaneously, the convergenceand polarization of the initially scattered MVB toward the F-actin-low region at the cIS (yellow arrows in Figure 7 andSupplementary Video 8). Next, we analyzed the kinetics of
the accumulation of cortical actin at the IS, defined as thetime period showing a relative actin FI at the synapse (ISFI/cell FI) >1 (Supplementary Video 9 and Figure 8, first andthird rows). In the left side of Figure 8A, some representativeframes from Supplementary Video 9 at the indicated timesafter the addition of clones to the SEE-pulsed Raji cells and,below, the superimposed ROIs (cell, IS and cIS) used in theseanalyses are depicted. The C3 and C9 control clones showedsignificantly longer actin accumulation at the IS than the P5 andP6 PKCδ-interfered clones (Figure 8B, Supplementary Video 9).In addition, a difference in the magnitude of the F-actin
Frontiers in Immunology | www.frontiersin.org 10 April 2019 | Volume 10 | Article 851
Herranz et al. Protein Kinase C δ Regulates Exosome Secretion
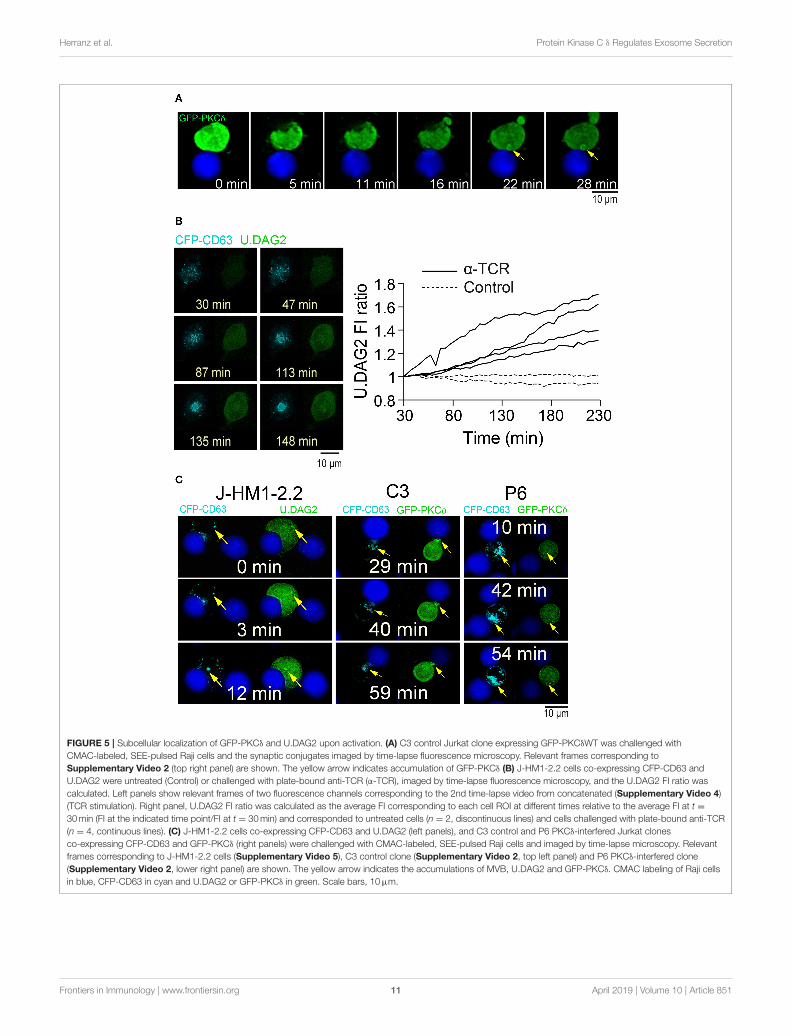
FIGURE 5 | Subcellular localization of GFP-PKCδ and U.DAG2 upon activation. (A) C3 control Jurkat clone expressing GFP-PKCδWT was challenged with
CMAC-labeled, SEE-pulsed Raji cells and the synaptic conjugates imaged by time-lapse fluorescence microscopy. Relevant frames corresponding to
Supplementary Video 2 (top right panel) are shown. The yellow arrow indicates accumulation of GFP-PKCδ (B) J-HM1-2.2 cells co-expressing CFP-CD63 and
U.DAG2 were untreated (Control) or challenged with plate-bound anti-TCR (α-TCR), imaged by time-lapse fluorescence microscopy, and the U.DAG2 FI ratio was
calculated. Left panels show relevant frames of two fluorescence channels corresponding to the 2nd time-lapse video from concatenated (Supplementary Video 4)
(TCR stimulation). Right panel, U.DAG2 FI ratio was calculated as the average FI corresponding to each cell ROI at different times relative to the average FI at t =
30min (FI at the indicated time point/FI at t = 30min) and corresponded to untreated cells (n = 2, discontinuous lines) and cells challenged with plate-bound anti-TCR
(n = 4, continuous lines). (C) J-HM1-2.2 cells co-expressing CFP-CD63 and U.DAG2 (left panels), and C3 control and P6 PKCδ-interfered Jurkat clones
co-expressing CFP-CD63 and GFP-PKCδ (right panels) were challenged with CMAC-labeled, SEE-pulsed Raji cells and imaged by time-lapse microscopy. Relevant
frames corresponding to J-HM1-2.2 cells (Supplementary Video 5), C3 control clone (Supplementary Video 2, top left panel) and P6 PKCδ-interfered clone
(Supplementary Video 2, lower right panel) are shown. The yellow arrow indicates the accumulations of MVB, U.DAG2 and GFP-PKCδ. CMAC labeling of Raji cells
in blue, CFP-CD63 in cyan and U.DAG2 or GFP-PKCδ in green. Scale bars, 10µm.
Frontiers in Immunology | www.frontiersin.org 11 April 2019 | Volume 10 | Article 851
Herranz et al. Protein Kinase C δ Regulates Exosome Secretion
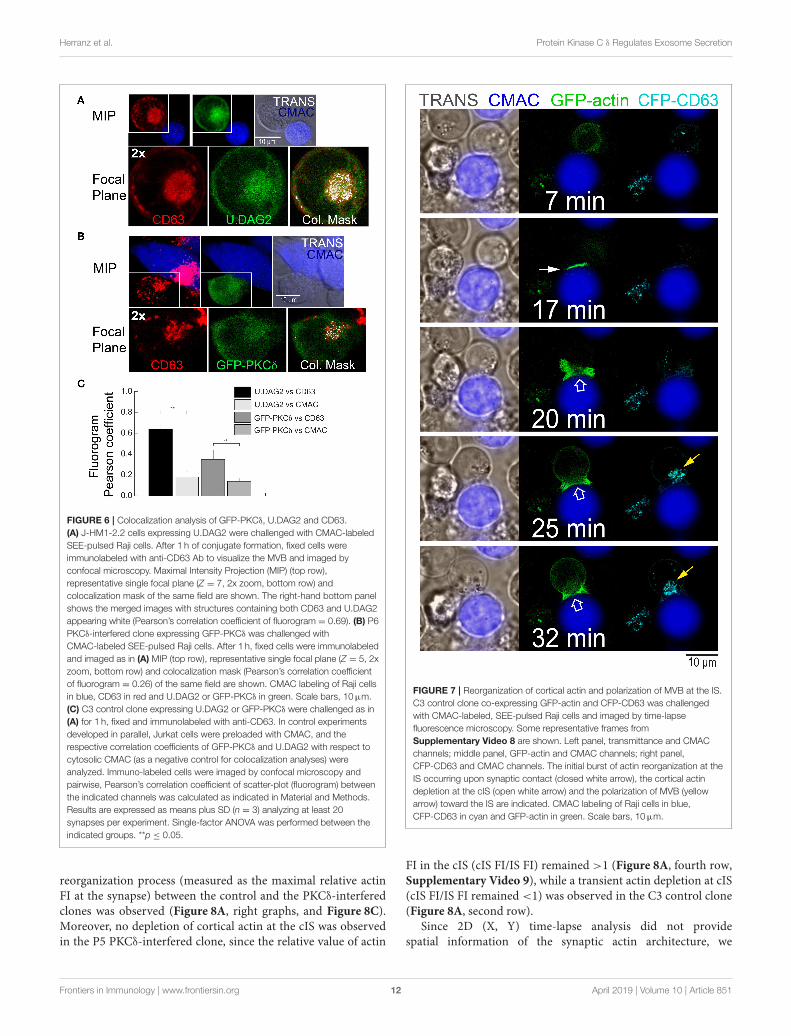
FIGURE 6 | Colocalization analysis of GFP-PKCδ, U.DAG2 and CD63.
(A) J-HM1-2.2 cells expressing U.DAG2 were challenged with CMAC-labeled
SEE-pulsed Raji cells. After 1 h of conjugate formation, fixed cells were
immunolabeled with anti-CD63 Ab to visualize the MVB and imaged by
confocal microscopy. Maximal Intensity Projection (MIP) (top row),
representative single focal plane (Z = 7, 2x zoom, bottom row) and
colocalization mask of the same field are shown. The right-hand bottom panel
shows the merged images with structures containing both CD63 and U.DAG2
appearing white (Pearson’s correlation coefficient of fluorogram = 0.69). (B) P6
PKCδ-interfered clone expressing GFP-PKCδ was challenged with
CMAC-labeled SEE-pulsed Raji cells. After 1 h, fixed cells were immunolabeled
and imaged as in (A) MIP (top row), representative single focal plane (Z = 5, 2x
zoom, bottom row) and colocalization mask (Pearson’s correlation coefficient
of fluorogram = 0.26) of the same field are shown. CMAC labeling of Raji cells
in blue, CD63 in red and U.DAG2 or GFP-PKCδ in green. Scale bars, 10µm.
(C) C3 control clone expressing U.DAG2 or GFP-PKCδ were challenged as in
(A) for 1 h, fixed and immunolabeled with anti-CD63. In control experiments
developed in parallel, Jurkat cells were preloaded with CMAC, and the
respective correlation coefficients of GFP-PKCδ and U.DAG2 with respect to
cytosolic CMAC (as a negative control for colocalization analyses) were
analyzed. Immuno-labeled cells were imaged by confocal microscopy and
pairwise, Pearson’s correlation coefficient of scatter-plot (fluorogram) between
the indicated channels was calculated as indicated in Material and Methods.
Results are expressed as means plus SD (n = 3) analyzing at least 20
synapses per experiment. Single-factor ANOVA was performed between the
indicated groups. **p ≤ 0.05.
reorganization process (measured as the maximal relative actinFI at the synapse) between the control and the PKCδ-interferedclones was observed (Figure 8A, right graphs, and Figure 8C).Moreover, no depletion of cortical actin at the cIS was observedin the P5 PKCδ-interfered clone, since the relative value of actin
FIGURE 7 | Reorganization of cortical actin and polarization of MVB at the IS.
C3 control clone co-expressing GFP-actin and CFP-CD63 was challenged
with CMAC-labeled, SEE-pulsed Raji cells and imaged by time-lapse
fluorescence microscopy. Some representative frames from
Supplementary Video 8 are shown. Left panel, transmittance and CMAC
channels; middle panel, GFP-actin and CMAC channels; right panel,
CFP-CD63 and CMAC channels. The initial burst of actin reorganization at the
IS occurring upon synaptic contact (closed white arrow), the cortical actin
depletion at the cIS (open white arrow) and the polarization of MVB (yellow
arrow) toward the IS are indicated. CMAC labeling of Raji cells in blue,
CFP-CD63 in cyan and GFP-actin in green. Scale bars, 10µm.
FI in the cIS (cIS FI/IS FI) remained >1 (Figure 8A, fourth row,Supplementary Video 9), while a transient actin depletion at cIS(cIS FI/IS FI remained <1) was observed in the C3 control clone(Figure 8A, second row).
Since 2D (X, Y) time-lapse analysis did not providespatial information of the synaptic actin architecture, we
Frontiers in Immunology | www.frontiersin.org 12 April 2019 | Volume 10 | Article 851
Herranz et al. Protein Kinase C δ Regulates Exosome Secretion
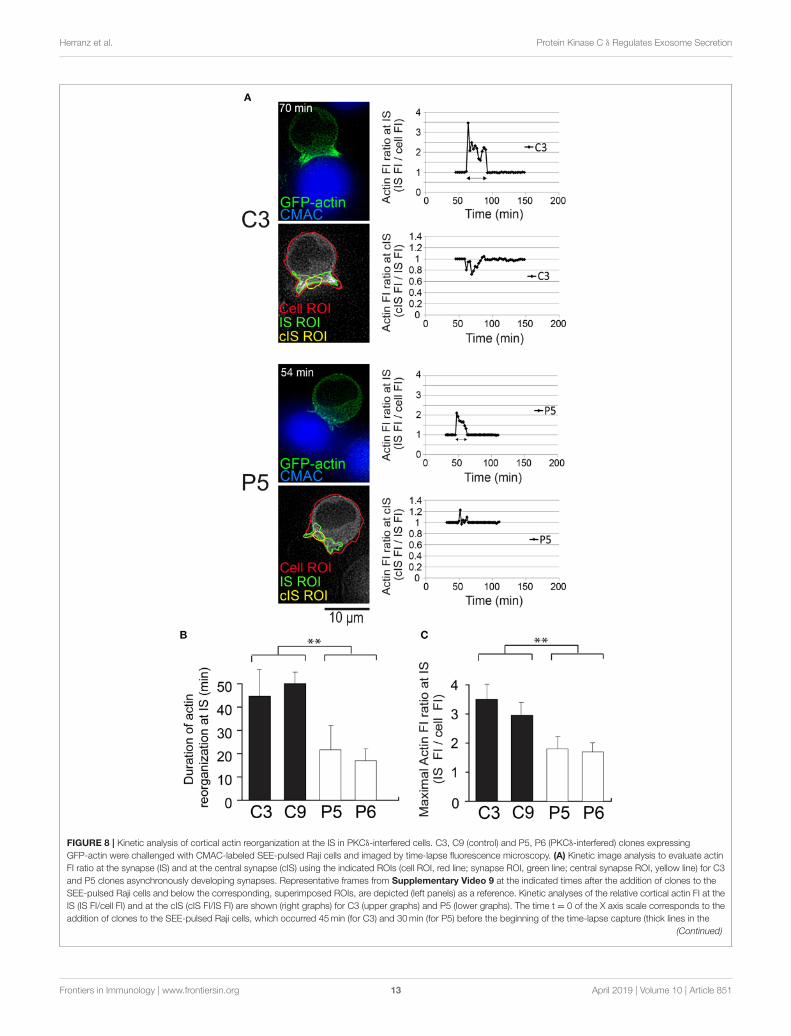
FIGURE 8 | Kinetic analysis of cortical actin reorganization at the IS in PKCδ-interfered cells. C3, C9 (control) and P5, P6 (PKCδ-interfered) clones expressing
GFP-actin were challenged with CMAC-labeled SEE-pulsed Raji cells and imaged by time-lapse fluorescence microscopy. (A) Kinetic image analysis to evaluate actin
FI ratio at the synapse (IS) and at the central synapse (cIS) using the indicated ROIs (cell ROI, red line; synapse ROI, green line; central synapse ROI, yellow line) for C3
and P5 clones asynchronously developing synapses. Representative frames from Supplementary Video 9 at the indicated times after the addition of clones to the
SEE-pulsed Raji cells and below the corresponding, superimposed ROIs, are depicted (left panels) as a reference. Kinetic analyses of the relative cortical actin FI at the
IS (IS FI/cell FI) and at the cIS (cIS FI/IS FI) are shown (right graphs) for C3 (upper graphs) and P5 (lower graphs). The time t = 0 of the X axis scale corresponds to the
addition of clones to the SEE-pulsed Raji cells, which occurred 45min (for C3) and 30min (for P5) before the beginning of the time-lapse capture (thick lines in the
(Continued)
Frontiers in Immunology | www.frontiersin.org 13 April 2019 | Volume 10 | Article 851
Herranz et al. Protein Kinase C δ Regulates Exosome Secretion
FIGURE 8 | graphs) of Supplementary Video 9. The beginning of conjugate formation, which corresponds to the peak of actin FI ratio at the IS, occurred at 62min
(17 plus 45min) for the C3 clone and 46min (16 plus 30min) for the P5 clone after the addition of clones to the SEE-pulsed Raji cells. Double-headed dark arrows
correspond to the time intervals during which actin ratio values were different to 1 (i.e., length of the actin reorganization period). CMAC labeling of Raji cells in blue
and GFP-actin in green. Scale bars, 10µm. (B) Results are expressed as average duration of the interval of actin reorganization for C3, C9 (control) and P5, P6
(PKCδ-interfered) clones. (C) Same as (B) but results are expressed as average maximal actin FI ratio at the IS. Data are means plus SD (n = 3, analyzing at least 12
synapses from several different microscopy fields per experiment). Single-factor ANOVA was performed between the indicated groups. **p ≤ 0.05. This figure is
related to Supplementary Video 9.
analyzed 3D distribution of F-actin at the IS in confocalmicroscopy image stacks. To perform these measurements,we generated 2D projections of the IS interface of bothcontrol and PKCδ-interfered clones, labeled with phalloidin(Supplementary Video 10 and Figure 9). The boundary of theT lymphocyte/APC synaptic contact was defined by the distalSMAC (dSMAC), which consists of a circular array of F-actin accumulation at the edge of the T cell/APC interface(6) (47) (Supplementary Figure 7B). Thus, the IS area wasdelimited by the edge of the F-actin signal. When necessary,the definition of the regions of interest (ROI) to measure theF-actin-low (Fact-low) cIS area and the IS area was performedby using automated algorithms as described in the Materialsand Methods section. Next, these defined ROI areas (Fact-lowcIS area and IS area) were measured, and the relative area ofthe F-actin depleted region at cIS (Fact-low cIS area/IS area)was determined (Supplementary Figures 7B,C). In addition,the intensity of F-actin along the IS interface was analyzed(Supplementary Video 10 and Figures 9A,B). We found asignificant reduction in the percentage of synapses substantiatinga F-actin-low region at cIS, with relative area > 0.1 in theP5 PKCδ-interfered cells when compared with C3 control cells(80%±6 F-actin depleted synapses in C3 clone vs. 48%±4 in P5clone; Supplementary Figure 7C and Figure 9C). Similar resultswere obtained when C9 control and P6 (PKCδ-interfered) cloneswere compared (Figure 9C). In addition, the expression of GFP-PKCδWT both in the P5 and P6 PKCδ-interfered clones restoredthe percentage of synapses exhibiting the depletion of F-actin atcIS to the levels observed for the C3 and C9 control clones (i.e.,48% ± 4 in P5 clone vs. 85% ± 9 in P5 clone expressing GFP-PKCδ (Figure 9C). In contrast, the expression of a kinase-deadPKCδ mutant (GFP-PKCδKD) in P5, PKCδ-interfered clone, didnot recover the depletion of F-actin at cIS to the levels obtained inC3 control clone (Figure 9C). Together these data indicate thatPKCδ participates in the spatiotemporal reorganization of actinat the IS and the subsequent polarization of MVB toward theF-actin-low region at the cIS and exosome secretion.
DISCUSSION
In this work we have established that activation of TCR atthe IS induces PKCδ activation, which is necessary for thepolarization of MTOC and the polarized secretory traffic ofMVB toward the IS and exosome secretion. Concomitantly, wedemonstrate that PKCδ-interfered T lymphocytes are defectivein Fas-FasL dependent AICD. Since exosomes containing FasLhave been shown to be involved in AICD (13, 14), a keyprocess in regulating T lymphocyte homeostasis (10), our data
support a new role of PKCδ in exosome-controlled immuneregulatory processes. Both FasL and Fas deficiencies are involvedin the development of several autoimmune lymphoproliferativesyndromes (ALPS) both in humans and mice (10, 54). In thiscontext, human patients were identified with a homozygousloss-of-function mutation of PKCδ resulting in deficient PKCδ
expression. These patients developed ALPS resembling thephenotype of PKCδ KO mice (55). Thus, PKCδ is importantfor the maintenance of T lymphocyte homeostasis as well asthe FasL/Fas system. Regarding the functional consequencesof defective exosome secretion occurring in PKCδ-interferedcells, it has been reported that exosomes contribute to thymicdevelopment (19). Negative selection in thymocytes, which isinduced via TCR-controlled apoptosis (AICD), is consideredan important mechanism regulating thymocyte developmentand immune tolerance (56). In addition, immature thymocytesfrom PKCδ KO mice were protected from apoptosis, indicatinga clear pro-apoptotic role of PKCδ (57). It remains to beestablished whether the systemic autoimmune phenotype andlack of tolerance observed in PKCδ KOmice and human patientswith autosomal recessive mutations in PKCδ (58) might be dueto defective exosome secretion and subsequent AICD occurringduring thymic development.
T and B lymphocytes are the only cells in which triggeringof cell surface receptors such as TCR and BCR controls induceexosome secretion (16). Following their secretion, exosomesparticipate in several antigen-dependent, important immunefunctions (59). We have described how exosome secretion in Thlymphocytes follows TCR stimulation and IS formation (13, 25).Regarding the TCR-regulated secretory traffic of MVB, severalreports have previously established the essential role of DAG andits negative regulator DGKα in the polarized traffic of MVB/lateendosomes and lytic granule secretion (13, 20, 24, 25), but themolecular basis by which DAG regulates this traffic remainedlargely unknown. To address this important point, we haveanalyzed Jurkat-Raji synapses because of the closeness of thisexperimental system to the biological reality (T cell-APC synapticconjugates). This analysis has used scanning confocal microscopyand time-lapse fluorescence microscopy combined with post-acquisition deconvolution, due to the enhanced signal-to-noiseratio of the images, high temporal resolution, and adaptabilityto the simultaneous acquisition of multiple fluorochromes indeveloping synapses (45). As a drawback, only those APC-T cellinterfaces that were perpendicular to the plane of focus along theZ-axis could be properly analyzed (45). Since other experimentalmodels that may facilitate image capture and analyses do notmimic the complex, irregular surface of an APC or a targetcell, and may raise to non-physiological interactions in the
Frontiers in Immunology | www.frontiersin.org 14 April 2019 | Volume 10 | Article 851
Herranz et al. Protein Kinase C δ Regulates Exosome Secretion
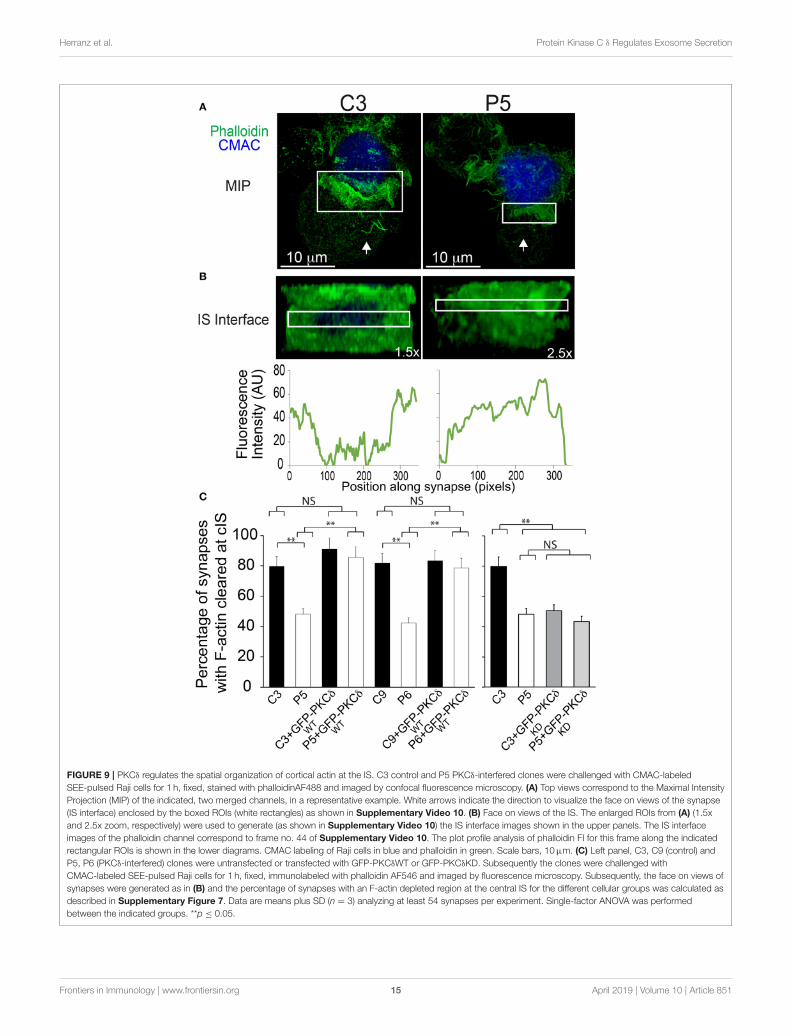
FIGURE 9 | PKCδ regulates the spatial organization of cortical actin at the IS. C3 control and P5 PKCδ-interfered clones were challenged with CMAC-labeled
SEE-pulsed Raji cells for 1 h, fixed, stained with phalloidinAF488 and imaged by confocal fluorescence microscopy. (A) Top views correspond to the Maximal Intensity
Projection (MIP) of the indicated, two merged channels, in a representative example. White arrows indicate the direction to visualize the face on views of the synapse
(IS interface) enclosed by the boxed ROIs (white rectangles) as shown in Supplementary Video 10. (B) Face on views of the IS. The enlarged ROIs from (A) (1.5x
and 2.5x zoom, respectively) were used to generate (as shown in Supplementary Video 10) the IS interface images shown in the upper panels. The IS interface
images of the phalloidin channel correspond to frame no. 44 of Supplementary Video 10. The plot profile analysis of phalloidin FI for this frame along the indicated
rectangular ROIs is shown in the lower diagrams. CMAC labeling of Raji cells in blue and phalloidin in green. Scale bars, 10µm. (C) Left panel, C3, C9 (control) and
P5, P6 (PKCδ-interfered) clones were untransfected or transfected with GFP-PKCδWT or GFP-PKCδKD. Subsequently the clones were challenged with
CMAC-labeled SEE-pulsed Raji cells for 1 h, fixed, immunolabeled with phalloidin AF546 and imaged by fluorescence microscopy. Subsequently, the face on views of
synapses were generated as in (B) and the percentage of synapses with an F-actin depleted region at the central IS for the different cellular groups was calculated as
described in Supplementary Figure 7. Data are means plus SD (n = 3) analyzing at least 54 synapses per experiment. Single-factor ANOVA was performed
between the indicated groups. **p ≤ 0.05.
Frontiers in Immunology | www.frontiersin.org 15 April 2019 | Volume 10 | Article 851
Herranz et al. Protein Kinase C δ Regulates Exosome Secretion
IS (60–63), we consider the experimental system used hereappropriate to address some biological events occurring at the IS.In addition, with the use of the PKCδ C1-based U.DAG2 sensor,we have shown that upon synaptic activation, DAG species areproduced that may recruit PKCδ at endomembranes includingMVB. The U.DAG2 sensor was described to produce rapidand robust changes in green fluorescence in a live-cell assay,and these changes were reversible, since fluorescence returns tobaseline levels 20–30 s after stimuli removal (35). In addition,there was an additional fluorescence increase of the U.DAG2sensor due to the conformational changes (35, 36); this wasan additional reason to use the sensor in our effort to revealpotential subtle DAG changes that may occur. Thus, the sensorindeed appears to be sensitive enough, although we cannot fullyexclude that some very transient or very small DAG changesmay not be detectable by the sensor. In addition, we cannotentirely exclude that the PKCδC2 domain (absent in the U.DAG2probe) may have an indirect, additional role on the selectivityof PKCδ for DAG species produced at the plasma membraneor endomembranes. In this context, we could not detect anyU.DAG2 accumulation or PKCδ recruitment at the IS membrane,although DAG-mediated accumulation of C1bPKCθ or PKD1 atthe IS was induced in parallel (Supplementary Videos 6, 7), asshown by other researchers (20, 50, 64). Thus, most probably,DAG species that were produced upon PLC activation by TCRwere capable of recruiting PKCθ (65) or PKD1 (46) to theIS via their C1 domains, but not PKCδ (66). In addition,our results support that, also upon synaptic activation, distinctDAG species to those generated at the IS are produced intoendomembranes (such as MVB), which are capable of recruitingand activate PKCδ. Supporting our data, PKCδ has been foundin lytic granules form CTLs (28). In this context, it has beenshown that differences in intrinsic affinities and selectivitiesamong the C1 and C2 DAG-binding domains for different DAGspecies control the rate, magnitude, duration, and subcellularlocalization of the diverse PKC isotypes (67, 68). The data fromother authors, based on the lack of recruitment of PKCδ tothe IS (64), may apparently argue against a contribution ofPKCδ to MTOC polarization. However, we propose that TCRsignaling regulates the production of distinct DAG species atdifferent subcellular locations (IS and MVB endomembranes),with each species recruiting different PKC isotypes, which maybe together necessary for MTOC polarization. Indeed, this mayconciliate these data with our results regarding the involvementof PKCδ in MTOC polarization toward the IS. Regarding themolecular bases that may underlie the PKCδ effect on F-actinreorganization, it has been described that phosphorylation ofpaxillin, an actin regulatory protein, by PKCδ regulates integrin-mediated adhesion and migration of lymphoid cells (69). Inparticular, PKCδ phosphorylates paxillin at T538, leading to thedepolymerization of the actin cytoskeleton (69). In addition,paxillin phosphorylation is required for the degranulation ofCTL (70). Thus, we are analyzing the phosphorylation ofpaxillin at T538 in control Jurkat clones. Our preliminary datasuggest that both pharmacologic (PMA), anti-TCR stimulationand synaptic stimulation of Jurkat control clones induced astrong phosphorylation of paxillin at T538 (not shown). Further
experiments are required to analyze whether PKCδ-interferedclones substantiate comparable paxillin phosphorylation uponstimulation. The results from these experiments may providesome clue to explain the PKCδ role on F-actin reorganizationleading to MTOC polarization.
Here we have studied the role of cortical actin reorganizationin the polarized traffic of MVB leading to exosome secretionat the IS in Th lymphocytes. PKCδ-interfered clones formingsynapses exhibited quantitative alterations (duration andmagnitude of actin reorganization) but also qualitativedifferences (absence of depletion of F-actin at the cIS) inactin rearrangement at the IS when compared with controlclones. Any of these alterations acting alone or in combination,have been described to affect T-cell activation, polarizedsecretion, AICD and CTL effector functions [reviewed in (3)].In fact, the phenotype we describe here resembles the alterationsfound in T lymphocytes deficient in TAGLN2 (71) or HS1(51). Thus, the altered actin stabilization at the IS we foundmay underlie the deficient MVB polarization occurring inPKCδ-interfered clones. The initial increase in F-actin at the ISwas followed by a decrease in F-actin density at the cIS, and thisevent appears to be the limiting step for exosome secretion. Thisprocess is similar to the degranulation of cytotoxic granules andcytokine-containing secretory granules at the F-actin-depletedregion that contains a specialized secretory domain in CTL andTh lymphocytes (4, 5, 53). Interestingly, in both cell types corticalactin reorganization at the IS, followed by the polarization ofMTOC and secretory granules toward the IS, was also reported(4, 47, 53, 72). Thus, these sequential events are essentiallycommon to IS formed by CTL or Th cells, although both thenature and cargo of the secretory granules in these cells are quitedifferent. In addition, CTL form much more transient synapsesthan Th cells, lasting only a few minutes, as the target cells arekilled (2, 5). This is probably due to the fact that the optimalCTL function requires rapid and transient contact in order todeliver as many lethal hits as possible to several target cells,whereas stable, lengthy synapses (>20–30min up to severalhours) formed by Th cells, as we studied here, are necessaryfor both directional and continuous secretion of stimulatorycytokines (2, 5). Accordingly, in CTL the directional movementof MTOC toward the synapse lasts very few minutes, whereasin long-lived synapses made by Th lymphocytes the MTOC,but also the MVB as we have shown (26), takes from severalminutes up to hours to move and dock to the IS (2, 5, 73). Thus,the contribution of the actin reorganization to the polarizationof secretory granules is a qualitative feature shared by CTL andTh cells, as well as some of the molecular components thatcontrol this reorganization (i.e., WASP, TAGLN2) (3, 71, 74).Nevertheless, there must be quantitative differences in signals,and probably in some molecular mechanisms that govern theactin cytoskeleton dynamics between the cytolytic and helpersynapses (5, 75).
Recently, it has been shown in CTL and Jurkat cells thatsecretory granule convergence toward the MTOC and MTOCpolarization to the IS are two mechanistically distinct processes(76). Interestingly, in our analysis of MVB and MTOCmigrationto the IS at the single cell level, we have found that both MVB
Frontiers in Immunology | www.frontiersin.org 16 April 2019 | Volume 10 | Article 851
Herranz et al. Protein Kinase C δ Regulates Exosome Secretion
and MTOC do not efficiently polarize in PKCδ-interfered cells,but their center of mass converge at nearby positions in controland interfered cells (Figure 1B and Supplementary Figure 1C),correlating in their migration tendency. In addition, our datashow that diminished levels of PKCδ did not affect the averagecentripetal velocity of MVB. Instead, PKCδ appears to specificallyregulate the subsequent step of the secretory traffic (i.e.,MTOC translocation to the IS). These findings are in partcompatible with what was found in PKCδ-KO mouse CTL, inwhich the lytic granules underwent convergence toward theMTOC, but these granules did not polarize to the IS and thesubsequent cytotoxicity was inhibited (29). However, althoughin these cells the absence of PKCδ inhibited polarization ofcytolytic granules, the MTOC polarization toward the IS wasnot affected (29). Currently, we lack a clear explanation forthe observed partial discrepancy, but it is certain that in thementioned study no simultaneous assessment of MVB andMTOC polarization was performed at the single cell level as wehave performed here. Additionally, and most likely, differencesbetween cytotoxic and helper synapses may cause this apparentdisagreement (see above).
In conclusion, aside from the well-known role of the PKCθ
isotype and the redundant action of PKCε and PKCη isotypesin the polarization of the secretory machinery in CD4+ Tcells (2, 77), we have identified a positive regulatory role ofthe PKCδ isotype in MVB polarization and exosome secretionupon IS formation in Th lymphocytes. Regarding the biologicalsignificance of such a regulatory mechanism, it is remarkable thatmelanocytes, among other cell types, undergo multidirectionaldispersion of secretory organelles for efficient distribution oftheir granule contents (78). In these cells, convergence ofsecretory granules toward the MTOC, which remains at theperinuclear area, prevents (but does not promote) degranulation(78). In contrast, the MTOC polarization to the IS, acting incoordination with the convergence of secretory granules towardthe MTOC, is necessary for optimal polarized and focusedsecretion in many cell types of the immune system, includinginnate NK cells (79, 80), CTL (4, 76), primary CD4+ T cells (47)and Jurkat cells [(76) and the present report]. This mechanismthat now includes the key player PKCδ appears to specificallyprovide the immune system with a finely-tuned strategy toincrease the efficiency of crucial secretory effector functions,while minimizing nonspecific, bystander cytokine stimulation,target cell killing and AICD.
AUTHOR CONTRIBUTIONS
VC and MI conceived and designed all the experiments.GH and VC did most of the experiments, analyzed data,and contributed to the writing of the manuscript. PA,SD, BS, DF-M, JG, RdM, MQ, LM-E, AB-G, and TFcontributed to the MTOC/MVB polarization experiments andtime-lapse studies. AS performed the WB analysis, exosomemeasurement, and also contributed to rescue experiments. PR-Scontributed to actin reorganization experiments, image analysis,statistical analysis of the results, and helped in writing ofthe manuscript. AF-R contributed to design some experimentsand contributed to writing the manuscript. MI conceptualizedand coordinated the research, directed the study, analyzeddata, and wrote the manuscript. All the authors contributedto the planning and designing of the experiments and tohelpful discussions.
FUNDING
This work was supported by grants from the Spanish Ministeriode Economía y Competitividad (MINECO), Plan Nacional deInvestigación Científica (SAF2016-77561-R to MI, which was inpart granted with FEDER-EC- funding). This work was partiallysupported by grant BFU2012-35067 to AF-R.
ACKNOWLEDGMENTS
We acknowledge the excellent technical support from A. M.García, A. Martínez, A. Merchán, A. Sánchez, and H. Serrano.We acknowledge Dr. M.A. Alonso (CBM, CSIC) for suggestions,reagents and critical reading of this manuscript. Thanks to LolaMorales (SIDI-UAM) and Silvia Gutiérrez (CNB, CSIC) for theirsuperb expertise with confocal microscopy. We are indebtedto Dr. I. Mérida (CNB, CSIC Madrid) for her generous andcontinuous support and reagents. We acknowledge M. Ware(Nanosight Ltd., UK) and J. Puebla (MALVERN) for theirsupport in NANOSIGHT studies.
SUPPLEMENTARY MATERIAL
The Supplementary Material for this article can be foundonline at: https://www.frontiersin.org/articles/10.3389/fimmu.2019.00851/full#supplementary-material
REFERENCES
1. de la Roche M, Asano Y, Griffiths GM. Origins of the cytolytic synapse. Nat
Rev Immunol. (2016) 16:421–32. doi: 10.1038/nri.2016.54
2. Huse M. Microtubule-organizing center polarity and the immunological
synapse: protein kinase C and beyond. Front Immunol. (2012) 3:235.
doi: 10.3389/fimmu.2012.00235
3. Billadeau DD, Nolz JC, Gomez TS. Regulation of T-cell activation by the
cytoskeleton. Nat Rev Immunol. (2007) 7:131–43. doi: 10.1038/nri2021
4. Ritter AT, Asano Y, Stinchcombe JC, Dieckmann NM, Chen BC, Gawden-
Bone C, et al. Actin depletion initiates events leading to granule
secretion at the immunological synapse. Immunity. (2015) 42:864–76.
doi: 10.1016/j.immuni.2015.04.013
5. Griffiths GM, Tsun A, Stinchcombe JC. The immunological synapse: a
focal point for endocytosis and exocytosis. J Cell Biol. (2010) 189:399–406.
doi: 10.1083/jcb.201002027
6. Ritter AT, Angus KL, Griffiths GM. The role of the cytoskeleton
at the immunological synapse. Immunol Rev. (2013) 256:107–17.
doi: 10.1111/imr.12117
7. Le Floc’h A, Huse M. Molecular mechanisms and functional implications of
polarized actin remodeling at the T cell immunological synapse. Cell Mol Life
Sci. (2015) 72:537–56. doi: 10.1007/s00018-014-1760-7
Frontiers in Immunology | www.frontiersin.org 17 April 2019 | Volume 10 | Article 851
Herranz et al. Protein Kinase C δ Regulates Exosome Secretion
8. Peters PJ, Borst J, Oorschot V, Fukuda M, Krahenbuhl O, Tschopp
J, et al. Cytotoxic T lymphocyte granules are secretory lysosomes,
containing both perforin and granzymes. J Exp Med. (1991) 173:1099–109.
doi: 10.1084/jem.173.5.1099
9. Bossi G, Griffiths GM. Degranulation plays an essential part in regulating cell
surface expression of Fas ligand in T cells and natural killer cells. Nat Med.
(1999) 5:90–6. doi: 10.1038/4779
10. Nagata S, Golstein P. The Fas death factor. Science. (1995) 267:1449–56.
doi: 10.1126/science.7533326
11. Monleon I, Martinez-Lorenzo MJ, Monteagudo L, Lasierra P, Taules
M, Iturralde M, et al. Differential secretion of Fas ligand- or APO2
ligand/TNF-related apoptosis-inducing ligand-carrying microvesicles during
activation-induced death of human T cells. J Immunol. (2001) 167:6736–44.
doi: 10.4049/jimmunol.167.12.6736
12. Zuccato E, Blott EJ, Holt O, Sigismund S, Shaw M, Bossi G, et al. Sorting
of Fas ligand to secretory lysosomes is regulated by mono-ubiquitylation
and phosphorylation. J Cell Sci. (2007) 120(Pt 1):191–9. doi: 10.1242/jcs.
03315
13. Alonso R, Rodriguez MC, Pindado J, Merino E, Merida I, Izquierdo M.
Diacylglycerol kinase alpha regulates the secretion of lethal exosomes bearing
Fas ligand during activation-induced cell death of T lymphocytes. J Biol Chem.
(2005) 280:28439–50. doi: 10.1074/jbc.M501112200
14. Martinez-Lorenzo MJ, Anel A, Gamen S, Monle n I, Lasierra P, Larrad L,
et al. Activated human T cells release bioactive Fas ligand and APO2 ligand
in microvesicles. J Immunol. (1999) 163:1274–81.
15. Blanchard N, Lankar D, Faure F, Regnault A, Dumont C, Raposo G, et al.
TCR activation of human T cells induces the production of exosomes
bearing the TCR/CD3/zeta complex. J Immunol. (2002) 168:3235–41.
doi: 10.4049/jimmunol.168.7.3235
16. Thery C, Ostrowski M, Segura E. Membrane vesicles as conveyors of immune
responses. Nat Rev Immunol. (2009) 9:581–93. doi: 10.1038/nri2567
17. Peters PJ, Geuze HJ, Van der Donk HA, Slot JW, Griffith JM, Stam NJ, et al.
Molecules relevant for T cell-target cell interaction are present in cytolytic
granules of human T lymphocytes. Eur J Immunol. (1989) 19:1469–75.
doi: 10.1002/eji.1830190819
18. Mittelbrunn M, Gutierrez-Vazquez C, Villarroya-Beltri C, Gonzalez S,
Sanchez-Cabo F, Gonzalez MA, et al. Unidirectional transfer of microRNA-
loaded exosomes from T cells to antigen-presenting cells. Nat Commun.
(2011) 2:282. doi: 10.1038/ncomms1285
19. Lundberg V, Berglund M, Skogberg G, Lindgren S, Lundqvist C,
Gudmundsdottir J, et al. Thymic exosomes promote the final maturation of
thymocytes. Sci Rep. (2016) 6:36479. doi: 10.1038/srep36479
20. Quann EJ, Merino E, Furuta T, Huse M. Localized diacylglycerol drives the
polarization of the microtubule-organizing center in T cells. Nat Immunol.
(2009) 10:627–35. doi: 10.1038/ni.1734
21. Carrasco S, Merida I. Diacylglycerol, when simplicity becomes complex.
Trends Biochem Sci. (2007) 32:27–36. doi: 10.1016/j.tibs.2006.11.004
22. Topham MK, Prescott SM. Mammalian diacylglycerol kinases, a family of
lipid kinases with signaling functions. J Biol Chem. (1999) 274:11447–50.
doi: 10.1074/jbc.274.17.11447
23. Sanjuan MA, Jones DR, Izquierdo M, Merida I. Role of diacylglycerol kinase
alpha in the attenuation of receptor signaling. J Cell Biol. (2001) 153:207–20.
doi: 10.1083/jcb.153.1.207
24. Rainero E, Caswell PT, Muller PA, Grindlay J, McCaffrey MW, Zhang
Q, et al. Diacylglycerol kinase alpha controls RCP-dependent integrin
trafficking to promote invasive migration. J Cell Biol. (2012) 196:277–95.
doi: 10.1083/jcb.201109112
25. Alonso R, Mazzeo C, Rodriguez MC, Marsh M, Fraile-Ramos A, Calvo V,
et al. Diacylglycerol kinase alpha regulates the formation and polarisation
of mature multivesicular bodies involved in the secretion of Fas ligand-
containing exosomes in T lymphocytes. Cell Death Differ. (2011) 18:1161–73.
doi: 10.1038/cdd.2010.184
26. Mazzeo C, Calvo V, Alonso R, Merida I, Izquierdo M. Protein kinase D1/2
is involved in the maturation of multivesicular bodies and secretion of
exosomes in T and B lymphocytes. Cell Death Differ. (2016) 23:99–109.
doi: 10.1038/cdd.2015.72
27. Chauveau A, Le Floc’h A, Bantilan NS, Koretzky GA, Huse M. Diacylglycerol
kinase alpha establishes T cell polarity by shaping diacylglycerol
accumulation at the immunological synapse. Sci Signal. (2014) 7:ra82.
doi: 10.1126/scisignal.2005287
28. Ma JS, Haydar TF, Radoja S. Protein kinase C delta localizes to secretory
lysosomes in CD8+ CTL and directly mediates TCR signals leading to
granule exocytosis-mediated cytotoxicity. J Immunol. (2008) 181:4716–22.
doi: 10.4049/jimmunol.181.7.4716
29. Ma JS, Monu N, Shen DT, Mecklenbrauker I, Radoja N, Haydar TF,
et al. Protein kinase Cdelta regulates antigen receptor-induced lytic granule
polarization in mouse CD8+ CTL. J Immunol. (2007) 178:7814–21.
doi: 10.4049/jimmunol.178.12.7814
30. Desai DM, Newton ME, Kadlecek T, Weiss A. Stimulation of the
phosphatidylinositol pathway can induce T-cell activation. Nature. (1990)
348:66–9. doi: 10.1038/348066a0
31. Izquierdo M, Downward J, Graves JD, Cantrell DA. Role of protein kinase
C in T-cell antigen receptor regulation of p21ras: evidence that two p21ras
regulatory pathways coexist in T cells. Mol Cell Biol. (1992) 12:3305–12.
doi: 10.1128/MCB.12.7.3305
32. Hirai S, Izumi Y, Higa K, Kaibuchi K, Mizuno K, Osada S, et al.
Ras-dependent signal transduction is indispensable but not sufficient for
the activation of AP1/Jun by PKC delta. EMBO J. (1994) 13:2331–40.
doi: 10.1002/j.1460-2075.1994.tb06517.x
33. DeVries TA, NevilleMC, ReylandME. Nuclear import of PKCdelta is required
for apoptosis: identification of a novel nuclear import sequence. EMBO J.
(2002) 21:6050–60. doi: 10.1093/emboj/cdf606
34. Pores-Fernando AT, Ranaghan MY, Zweifach A. No specific subcellular
localization of protein kinase C is required for cytotoxic T cell granule
exocytosis. J Biol Chem. (2009) 284:25107–15. doi: 10.1074/jbc.M109.011866
35. Tewson PH, Quinn AM, Hughes TE. A multiplexed fluorescent assay for
independent second-messenger systems: decoding GPCR activation in living
cells. J Biomol Screen. (2013) 18:797–806. doi: 10.1177/1087057113485427
36. Tewson P, Westenberg M, Zhao Y, Campbell RE, Quinn AM, Hughes TE.
Simultaneous detection of Ca2+ and diacylglycerol signaling in living cells.
PLoS ONE. (2012) 7:e42791. doi: 10.1371/journal.pone.0042791
37. Singh R, Andreadis ST. EGF receptor activation decreases retroviral gene
transfer through protein kinase C-delta. Mol Therap. (2007) 15:369–77.
doi: 10.1038/sj.mt.6300050
38. Thery C, Amigorena S, Raposo G, Clayton A. Isolation and characterization
of exosomes from cell culture supernatants and biological fluids. Curr Protoc
Cell Biol. (2006) Chapter 3:Unit 3 22. doi: 10.1002/0471143030.cb0322s30
39. Skliar M, Chernyshev VS, Belnap DM, Sergey GV, Al-Hakami SM, Bernard
PS, et al. Membrane proteins significantly restrict exosome mobility. Biochem
Biophys Res Commun. (2018) 501:1055–9. doi: 10.1016/j.bbrc.2018.05.107
40. Raiborg C, Rusten TE, Stenmark H. Protein sorting into
multivesicular endosomes. Curr Opin Cell Biol. (2003) 15:446–55.
doi: 10.1016/S0955-0674(03)00080-2
41. Trajkovic K, Hsu C, Chiantia S, Rajendran L, Wenzel D, Wieland F,
et al. Ceramide triggers budding of exosome vesicles into multivesicular
endosomes. Science. (2008) 319:1244–7. doi: 10.1126/science.1153124
42. Ostrowski M, Carmo NB, Krumeich S, Fanget I, Raposo G, Savina A, et al.
Rab27a and Rab27b control different steps of the exosome secretion pathway.
Nat Cell Biol. (2010) 12:19–30. doi: 10.1038/ncb2000
43. Ventimiglia LN, Fernandez-Martin L, Martinez-Alonso E, Anton OM, Guerra
M, Martinez-Menarguez JA, et al. Cutting Edge: Regulation of Exosome
Secretion by the Integral MAL Protein in T Cells. J Immunol. (2015) 195:810–
4. doi: 10.4049/jimmunol.1500891
44. Jambrina E, Alonso R, Alcalde M, del Carmen Rodriguez M, Serrano A,
Martinez AC, et al. Calcium influx through receptor-operated channel induces
mitochondria-triggered paraptotic cell death. J Biol Chem. (2003) 278:14134–
45. doi: 10.1074/jbc.M211388200
45. Calvo V, Izquierdo M. Imaging polarized secretory traffic at the
immune synapse in living T lymphocytes. Front Immunol. (2018) 9:684.
doi: 10.3389/fimmu.2018.00684
46. Spitaler M, Emslie E, Wood CD, Cantrell D. Diacylglycerol and protein kinase
D localization during T lymphocyte activation. Immunity. (2006) 24:535–46.
doi: 10.1016/j.immuni.2006.02.013
47. Ueda H, Zhou J, Xie J, Davis MM. Distinct roles of cytoskeletal components in
immunological synapse formation and directed secretion. J Immunol. (2015)
195:4117–25. doi: 10.4049/jimmunol.1402175
Frontiers in Immunology | www.frontiersin.org 18 April 2019 | Volume 10 | Article 851
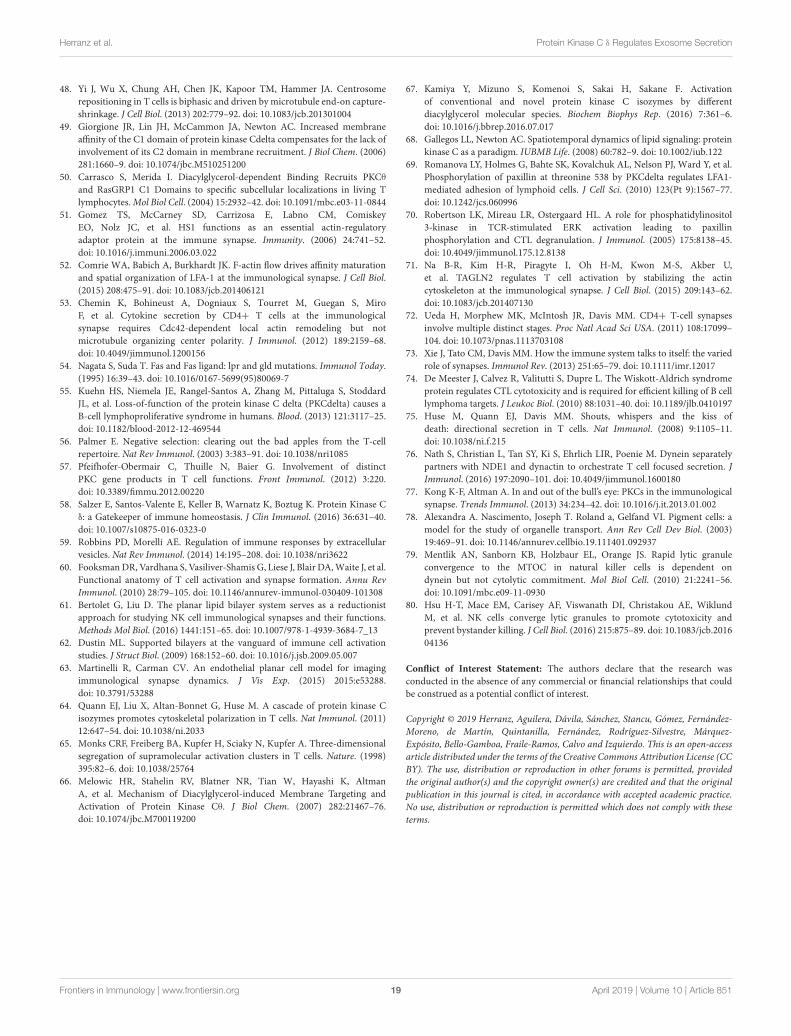
Herranz et al. Protein Kinase C δ Regulates Exosome Secretion
48. Yi J, Wu X, Chung AH, Chen JK, Kapoor TM, Hammer JA. Centrosome
repositioning in T cells is biphasic and driven by microtubule end-on capture-
shrinkage. J Cell Biol. (2013) 202:779–92. doi: 10.1083/jcb.201301004
49. Giorgione JR, Lin JH, McCammon JA, Newton AC. Increased membrane
affinity of the C1 domain of protein kinase Cdelta compensates for the lack of
involvement of its C2 domain in membrane recruitment. J Biol Chem. (2006)
281:1660–9. doi: 10.1074/jbc.M510251200
50. Carrasco S, Merida I. Diacylglycerol-dependent Binding Recruits PKCθ
and RasGRP1 C1 Domains to specific subcellular localizations in living T
lymphocytes.Mol Biol Cell. (2004) 15:2932–42. doi: 10.1091/mbc.e03-11-0844
51. Gomez TS, McCarney SD, Carrizosa E, Labno CM, Comiskey
EO, Nolz JC, et al. HS1 functions as an essential actin-regulatory
adaptor protein at the immune synapse. Immunity. (2006) 24:741–52.
doi: 10.1016/j.immuni.2006.03.022
52. Comrie WA, Babich A, Burkhardt JK. F-actin flow drives affinity maturation
and spatial organization of LFA-1 at the immunological synapse. J Cell Biol.
(2015) 208:475–91. doi: 10.1083/jcb.201406121
53. Chemin K, Bohineust A, Dogniaux S, Tourret M, Guegan S, Miro
F, et al. Cytokine secretion by CD4+ T cells at the immunological
synapse requires Cdc42-dependent local actin remodeling but not
microtubule organizing center polarity. J Immunol. (2012) 189:2159–68.
doi: 10.4049/jimmunol.1200156
54. Nagata S, Suda T. Fas and Fas ligand: lpr and gld mutations. Immunol Today.
(1995) 16:39–43. doi: 10.1016/0167-5699(95)80069-7
55. Kuehn HS, Niemela JE, Rangel-Santos A, Zhang M, Pittaluga S, Stoddard
JL, et al. Loss-of-function of the protein kinase C delta (PKCdelta) causes a
B-cell lymphoproliferative syndrome in humans. Blood. (2013) 121:3117–25.
doi: 10.1182/blood-2012-12-469544
56. Palmer E. Negative selection: clearing out the bad apples from the T-cell
repertoire. Nat Rev Immunol. (2003) 3:383–91. doi: 10.1038/nri1085
57. Pfeifhofer-Obermair C, Thuille N, Baier G. Involvement of distinct
PKC gene products in T cell functions. Front Immunol. (2012) 3:220.
doi: 10.3389/fimmu.2012.00220
58. Salzer E, Santos-Valente E, Keller B, Warnatz K, Boztug K. Protein Kinase C
δ: a Gatekeeper of immune homeostasis. J Clin Immunol. (2016) 36:631–40.
doi: 10.1007/s10875-016-0323-0
59. Robbins PD, Morelli AE. Regulation of immune responses by extracellular
vesicles. Nat Rev Immunol. (2014) 14:195–208. doi: 10.1038/nri3622
60. FooksmanDR, Vardhana S, Vasiliver-Shamis G, Liese J, Blair DA,Waite J, et al.
Functional anatomy of T cell activation and synapse formation. Annu Rev
Immunol. (2010) 28:79–105. doi: 10.1146/annurev-immunol-030409-101308
61. Bertolet G, Liu D. The planar lipid bilayer system serves as a reductionist
approach for studying NK cell immunological synapses and their functions.
Methods Mol Biol. (2016) 1441:151–65. doi: 10.1007/978-1-4939-3684-7_13
62. Dustin ML. Supported bilayers at the vanguard of immune cell activation
studies. J Struct Biol. (2009) 168:152–60. doi: 10.1016/j.jsb.2009.05.007
63. Martinelli R, Carman CV. An endothelial planar cell model for imaging
immunological synapse dynamics. J Vis Exp. (2015) 2015:e53288.
doi: 10.3791/53288
64. Quann EJ, Liu X, Altan-Bonnet G, Huse M. A cascade of protein kinase C
isozymes promotes cytoskeletal polarization in T cells. Nat Immunol. (2011)
12:647–54. doi: 10.1038/ni.2033
65. Monks CRF, Freiberg BA, Kupfer H, Sciaky N, Kupfer A. Three-dimensional
segregation of supramolecular activation clusters in T cells. Nature. (1998)
395:82–6. doi: 10.1038/25764
66. Melowic HR, Stahelin RV, Blatner NR, Tian W, Hayashi K, Altman
A, et al. Mechanism of Diacylglycerol-induced Membrane Targeting and
Activation of Protein Kinase Cθ. J Biol Chem. (2007) 282:21467–76.
doi: 10.1074/jbc.M700119200
67. Kamiya Y, Mizuno S, Komenoi S, Sakai H, Sakane F. Activation
of conventional and novel protein kinase C isozymes by different
diacylglycerol molecular species. Biochem Biophys Rep. (2016) 7:361–6.
doi: 10.1016/j.bbrep.2016.07.017
68. Gallegos LL, Newton AC. Spatiotemporal dynamics of lipid signaling: protein
kinase C as a paradigm. IUBMB Life. (2008) 60:782–9. doi: 10.1002/iub.122
69. Romanova LY, Holmes G, Bahte SK, Kovalchuk AL, Nelson PJ, Ward Y, et al.
Phosphorylation of paxillin at threonine 538 by PKCdelta regulates LFA1-
mediated adhesion of lymphoid cells. J Cell Sci. (2010) 123(Pt 9):1567–77.
doi: 10.1242/jcs.060996
70. Robertson LK, Mireau LR, Ostergaard HL. A role for phosphatidylinositol
3-kinase in TCR-stimulated ERK activation leading to paxillin
phosphorylation and CTL degranulation. J Immunol. (2005) 175:8138–45.
doi: 10.4049/jimmunol.175.12.8138
71. Na B-R, Kim H-R, Piragyte I, Oh H-M, Kwon M-S, Akber U,
et al. TAGLN2 regulates T cell activation by stabilizing the actin
cytoskeleton at the immunological synapse. J Cell Biol. (2015) 209:143–62.
doi: 10.1083/jcb.201407130
72. Ueda H, Morphew MK, McIntosh JR, Davis MM. CD4+ T-cell synapses
involve multiple distinct stages. Proc Natl Acad Sci USA. (2011) 108:17099–
104. doi: 10.1073/pnas.1113703108
73. Xie J, Tato CM, Davis MM. How the immune system talks to itself: the varied
role of synapses. Immunol Rev. (2013) 251:65–79. doi: 10.1111/imr.12017
74. De Meester J, Calvez R, Valitutti S, Dupre L. The Wiskott-Aldrich syndrome
protein regulates CTL cytotoxicity and is required for efficient killing of B cell
lymphoma targets. J Leukoc Biol. (2010) 88:1031–40. doi: 10.1189/jlb.0410197
75. Huse M, Quann EJ, Davis MM. Shouts, whispers and the kiss of
death: directional secretion in T cells. Nat Immunol. (2008) 9:1105–11.
doi: 10.1038/ni.f.215
76. Nath S, Christian L, Tan SY, Ki S, Ehrlich LIR, Poenie M. Dynein separately
partners with NDE1 and dynactin to orchestrate T cell focused secretion. J
Immunol. (2016) 197:2090–101. doi: 10.4049/jimmunol.1600180
77. Kong K-F, Altman A. In and out of the bull’s eye: PKCs in the immunological
synapse. Trends Immunol. (2013) 34:234–42. doi: 10.1016/j.it.2013.01.002
78. Alexandra A. Nascimento, Joseph T. Roland a, Gelfand VI. Pigment cells: a
model for the study of organelle transport. Ann Rev Cell Dev Biol. (2003)
19:469–91. doi: 10.1146/annurev.cellbio.19.111401.092937
79. Mentlik AN, Sanborn KB, Holzbaur EL, Orange JS. Rapid lytic granule
convergence to the MTOC in natural killer cells is dependent on
dynein but not cytolytic commitment. Mol Biol Cell. (2010) 21:2241–56.
doi: 10.1091/mbc.e09-11-0930
80. Hsu H-T, Mace EM, Carisey AF, Viswanath DI, Christakou AE, Wiklund
M, et al. NK cells converge lytic granules to promote cytotoxicity and
prevent bystander killing. J Cell Biol. (2016) 215:875–89. doi: 10.1083/jcb.2016
04136
Conflict of Interest Statement: The authors declare that the research was
conducted in the absence of any commercial or financial relationships that could
be construed as a potential conflict of interest.
Copyright © 2019 Herranz, Aguilera, Dávila, Sánchez, Stancu, Gómez, Fernández-
Moreno, de Martín, Quintanilla, Fernández, Rodríguez-Silvestre, Márquez-
Expósito, Bello-Gamboa, Fraile-Ramos, Calvo and Izquierdo. This is an open-access
article distributed under the terms of the Creative Commons Attribution License (CC
BY). The use, distribution or reproduction in other forums is permitted, provided
the original author(s) and the copyright owner(s) are credited and that the original
publication in this journal is cited, in accordance with accepted academic practice.
No use, distribution or reproduction is permitted which does not comply with these
terms.
Frontiers in Immunology | www.frontiersin.org 19 April 2019 | Volume 10 | Article 851


![Diacylglycerol kinase ζ generates dipalmitoyl-phosphatidic ... · kinase C [6], and p21 activated protein kinase 1 [7,8].PAasan intracellular signaling lipid is generated by phosphorylation](https://static.fdocument.org/doc/165x107/5fe275ed0f93ac2b35696d07/diacylglycerol-kinase-generates-dipalmitoyl-phosphatidic-kinase-c-6-and.jpg)