Protein, free amino acid, phenolic, β-carotene, and lycopene content, and antioxidative and cancer...
13
1 2 Original Research Article 3 Protein, free amino acid, phenolic, b-carotene, and lycopene content, 4 and antioxidative and cancer cell inhibitory effects of 5 12 greenhouse-grown commercial cherry tomato varieties 6 Suk Hyun Choi Q1 a , Dong-Seok Kim a , Nobuyuki Kozukue a , Hyun-Jeong Kim b , 7 Yosuke Nishitani c , Masashi Mizuno d , Carol E. Levin e , Mendel Friedman e, * 8 a Department of Food Service Industry, Seowon University, Cheongju 361-742, Republic of Korea 9 b Center for Traditional Microorganism Resources, Keimyung University, Daegu 704-701, Republic of Korea 10 c Team of Health Bioscience, Organization of Advanced Science and Technology, Graduate School of Agricultural Science, Kobe University, Kobe 657-8501, Japan 11 d Department of Agrobioscience, Graduate School of Agricultural Science, Kobe University, Kobe 657-8501, Japan 12 e Western Regional Research Center, Agricultural Research Service, U.S. Department of Agriculture, Albany, CA 94710, United States 13 14 1. Introduction 15 Tomatoes, the fruit of the species Solanum lycopersicum, are a 16 good source of nutrients and bioactive compounds (Friedman, 17 2002, 2013; Frusciante et al., 2007). The nature and concentration 18 of synthesized compounds are influenced by agricultural practices, 19 environmental factors, variety, and ripeness (Davies and Hobson, 20 1981; Sa ´ nchez-Rodrı ´guez et al., 2012). There is a large variation 21 between cultivars with respect to both fruit size and color, which 22 could affect their beneficial properties. Lenucci et al. found 23 significant differences among 14 cherry tomato cultivars and four 24 cultivars of high-pigment tomato hybrids in the composition of 25 lycopene, b-carotene, a-tocopherol, vitamin C, and total phenolic 26 and flavonoids contents, with the high-pigmented cultivars 27 showing a very high lycopene content, suggesting high variability 28 in the tomato germplasm (Lenucci et al., 2006). Breeding programs 29 have had some success in transferring antioxidant parameters from 30 wild-type species into commercial cultivars (Kavitha et al., 2014). 31 Tomato grafting has shown to both increase and decrease the Journal of Food Composition and Analysis xxx (2014) xxx–xxx A R T I C L E I N F O Article history: Received 24 October 2013 Received in revised form 12 March 2014 Accepted 15 March 2014 Keywords: Cherry tomatoes Solanum lycopersicum Food pigments Free amino acids Protein Protein quality Lycopene b-Carotene Phenolics Flavonoids Antioxidative and cancer-cell-inhibiting effects Genetic and environmental factors in biosynthesis Bioactive non-nutrients in food Cultivar differences Food composition Food analysis A B S T R A C T The content of water, free amino acids, amino acid metabolites, crude protein, the carotene pigments b- carotene and lycopene, and 9 characterized and 2 incompletely characterized individual phenolic (flavonoid) compounds of 12 greenhouse-grown cherry tomato varieties of various colors (green, yellow, orange, red, and black) was determined using HPLC and LC/MS methods. Antioxidative effects using the ABTS and FRAP assays and cancer-cell-inhibiting effects against 2 normal (Chang liver and Hel299 lung) and 3 human cancer (lung A549; liver HepG2; and cervical HeLa) cell lines using the MTT cell viability assay were also determined. Lycopene inhibited all the cell lines, but showed strong activity against the cervical carcinoma and the lung cancer cells. The tomato extracts showed inhibition at the higher doses. The HeLa cervical carcinoma cell line was most inhibited by the pure compounds, and the HeLa or the HepG2 cells lines were the most inhibited by the tomato extracts. The results demonstrate wide-ranging differences as well as similarities in the content of nutritional and bioactive compounds in cherry tomatoes, and suggest that such knowledge can benefit consumers. ß 2014 Published by Elsevier Inc. * Corresponding author. Tel.: +1 510 559 5615; fax: +1 510 559 6162. E-mail addresses: [email protected], [email protected] (M. Friedman). G Model YJFCA 2408 1–13 Please cite this article in press as: Choi, S.H., et al., Protein, free amino acid, phenolic, b-carotene, and lycopene content, and antioxidative and cancer cell inhibitory effects of 12 greenhouse-grown commercial cherry tomato varieties. J. Food Compos. Anal. (2014), http://dx.doi.org/10.1016/j.jfca.2014.03.005 Contents lists available at ScienceDirect Journal of Food Composition and Analysis jo u rn al ho m epag e: ww w.els evier .c om /lo cat e/jfc a http://dx.doi.org/10.1016/j.jfca.2014.03.005 0889-1575/ß 2014 Published by Elsevier Inc.
Transcript of Protein, free amino acid, phenolic, β-carotene, and lycopene content, and antioxidative and cancer...

12
3
4
5
6 Q1
7
89101112
1314
15
16
17
18
19
Journal of Food Composition and Analysis xxx (2014) xxx–xxx
G Model
YJFCA 2408 1–13
Original Research Article
Protein, free amino acid, phenolic, b-carotene, and lycopene content,and antioxidative and cancer cell inhibitory effects of12 greenhouse-grown commercial cherry tomato varieties
Suk Hyun Choi a, Dong-Seok Kim a, Nobuyuki Kozukue a, Hyun-Jeong Kim b,Yosuke Nishitani c, Masashi Mizuno d, Carol E. Levin e, Mendel Friedman e,*a Department of Food Service Industry, Seowon University, Cheongju 361-742, Republic of Koreab Center for Traditional Microorganism Resources, Keimyung University, Daegu 704-701, Republic of Koreac Team of Health Bioscience, Organization of Advanced Science and Technology, Graduate School of Agricultural Science, Kobe University, Kobe 657-8501, Japand Department of Agrobioscience, Graduate School of Agricultural Science, Kobe University, Kobe 657-8501, Japane Western Regional Research Center, Agricultural Research Service, U.S. Department of Agriculture, Albany, CA 94710, United States
A R T I C L E I N F O
Article history:
Received 24 October 2013
Received in revised form 12 March 2014
Accepted 15 March 2014
Keywords:
Cherry tomatoes
Solanum lycopersicum
Food pigments
Free amino acids
Protein
Protein quality
Lycopene
b-Carotene
Phenolics
Flavonoids
Antioxidative and cancer-cell-inhibiting
effects
Genetic and environmental factors in
biosynthesis
Bioactive non-nutrients in food
Cultivar differences
Food composition
Food analysis
A B S T R A C T
The content of water, free amino acids, amino acid metabolites, crude protein, the carotene pigments b-
carotene and lycopene, and 9 characterized and 2 incompletely characterized individual phenolic
(flavonoid) compounds of 12 greenhouse-grown cherry tomato varieties of various colors (green, yellow,
orange, red, and black) was determined using HPLC and LC/MS methods. Antioxidative effects using the
ABTS and FRAP assays and cancer-cell-inhibiting effects against 2 normal (Chang liver and Hel299 lung)
and 3 human cancer (lung A549; liver HepG2; and cervical HeLa) cell lines using the MTT cell viability
assay were also determined. Lycopene inhibited all the cell lines, but showed strong activity against the
cervical carcinoma and the lung cancer cells. The tomato extracts showed inhibition at the higher doses.
The HeLa cervical carcinoma cell line was most inhibited by the pure compounds, and the HeLa or the
HepG2 cells lines were the most inhibited by the tomato extracts. The results demonstrate wide-ranging
differences as well as similarities in the content of nutritional and bioactive compounds in cherry
tomatoes, and suggest that such knowledge can benefit consumers.
� 2014 Published by Elsevier Inc.
Contents lists available at ScienceDirect
Journal of Food Composition and Analysis
jo u rn al ho m epag e: ww w.els evier . c om / lo cat e/ j fc a
20212223242526
1. Introduction
Tomatoes, the fruit of the species Solanum lycopersicum, are agood source of nutrients and bioactive compounds (Friedman,2002, 2013; Frusciante et al., 2007). The nature and concentrationof synthesized compounds are influenced by agricultural practices,environmental factors, variety, and ripeness (Davies and Hobson,
2728293031
* Corresponding author. Tel.: +1 510 559 5615; fax: +1 510 559 6162.
E-mail addresses: [email protected], [email protected]
(M. Friedman).
Please cite this article in press as: Choi, S.H., et al., Protein, freeantioxidative and cancer cell inhibitory effects of 12 greenhouse-gr(2014), http://dx.doi.org/10.1016/j.jfca.2014.03.005
http://dx.doi.org/10.1016/j.jfca.2014.03.005
0889-1575/� 2014 Published by Elsevier Inc.
1981; Sanchez-Rodrıguez et al., 2012). There is a large variationbetween cultivars with respect to both fruit size and color, whichcould affect their beneficial properties. Lenucci et al. foundsignificant differences among 14 cherry tomato cultivars and fourcultivars of high-pigment tomato hybrids in the composition oflycopene, b-carotene, a-tocopherol, vitamin C, and total phenolicand flavonoids contents, with the high-pigmented cultivarsshowing a very high lycopene content, suggesting high variabilityin the tomato germplasm (Lenucci et al., 2006). Breeding programshave had some success in transferring antioxidant parameters fromwild-type species into commercial cultivars (Kavitha et al., 2014).Tomato grafting has shown to both increase and decrease the
amino acid, phenolic, b-carotene, and lycopene content, andown commercial cherry tomato varieties. J. Food Compos. Anal.

32 co33 Th34 ho35
36 un37 pi38 w39 di40 ca41 (M42 to43 W44 an45 on
46 2.
47 2.
48
49 ge50 ob51 �52 an53 W54 fro55 To56 tr57 In58
59 ca60 ce61 Ro62 Ko63 ob64 re65 Po66 ac67 m68 ob69 Ea70 ce71 Gi72
73 (P74 re75 m76 an
77
7879808182838485868788
Fig. 1. Photograph of 12 cherry tomatoes evaluated in the present study.
TaDi
V
B
T
S
S
S
G
G
V
S
J
S
R
Vaa
S.H. Choi et al. / Journal of Food Composition and Analysis xxx (2014) xxx–xxx2
G Model
YJFCA 2408 1–13
ntent of phenolic compounds (Sanchez-Rodrıguez et al., 2012).ese observations suggest the need for a better understanding ofw bioactivity of tomatoes relates to their composition.To help meet this need, the present study aims to increase ourderstanding of the distribution of free amino acids, proteins, the
gments b-carotene and lycopene, and phenolic compounds, asell as antioxidative and cancer-cell-inhibiting effects, among averse collection of cherry tomato varieties. Because compositionn vary significantly under different environmental conditionsitchell et al., 2007; Sanchez-Rodrıguez et al., 2012), the
matoes in this study were grown under the same conditions.e measured composition using HPLC and LC/MS methods,tioxidative activities by the ABTS and FRAP assays, and effects
the growth of normal and cancer cells by the MTT assay.
Materials and methods
1. Materials
Quercetin-3-rutinoside (Q3R, lot BCBB6172, 95.3%) and chloro-nic acid (3-caffeoylquinic acid, 3-CQA, lot 27H1006, 95%) weretained from Sigma (St. Louis, MO, USA), lycopene (lot 081M5160V,
90%, from tomatoes), b-carotene, purum (lot BCBH8425V, �97%)d naringenin (NG, lot BCBC7827V, 95%) from Aldrich (Milwaukee,I, USA), naringenin chalcone (NGC, lot ASB-00014207-136, 98%)m ChromaDex Inc. (Laguna Hills, CA, USA), ABTS (>98%) fromkyo Kasei Kogyo (Japan), gallic acid (lot AGM01, �98%) and
ipyridyltriazine (TPTZ, lot FHL01, 98%) from Tokyo Chemicaldustry (Japan). All other reagents were from Sigma.
Human normal liver (Chang) and lung cell lines (Hel299), lungncer (A549), hepatoma (HepG2), and cervical carcinoma (HeLa)lls were from the American Type Culture Collection (ATCC,ckville, MD, USA) and the Korean Cell Line Bank (KCLB, Seoul,rea). RAW264.7 and L929 cells used for the TNF-a studies weretained from Riken BRC Cell Bank (Tsukuba, Japan). Cell cultureagents were obtained from Gibco BRL (Life Technologies, Cergy-ntoise, France). Dulbecco’s modified Eagle’s medium (DMEM),tinomycin D, lipopolysaccharide (LPS) from E. coli O127, andurine recombinant Tumor Necrosis Factor-a (TNF-a) weretained from Wako Pure Chemical Industries (Osaka, Japan),gle’s minimum essential medium (MEM) from Nissui Pharma-utical (Tokyo, Japan), and FBS and RPMI 1640 medium frombco BRL (Grand Island, NY, USA).HPLC-grade acetonitrile and formic acid were from J.T. Baker
hillipsburg, NJ, USA) and Aldrich (Milwaukee, WI, USA),spectively. The solvents were filtered through a 0.45 mmembrane filter (Millipore, Bedford, MA, USA) and degassed in
ultrasonic bath before use.
ble 1mensions, weight, and water and protein (N � 6.25) content of 12 greenhouse-grow
ariety (cultivar) Color Length (mm) Width (mm) Weight (
lack Kiss 20 Red black 30.09 � 0.461 32.89 � 0.691 18.61 � 0
otori Gold Yellow 37.83 � 0.712 28.81 � 0.912,3 17.1 � 1
ugar Yellow Yellow 44.0 � 1.63 32.22 � 0.431 24.94 � 0
aeng Green Bichuiball Green 40.9 � 1.74 26.80 � 0.692,4 17.36 � 0
aeng Green Chorok Green 34.21 � 0.245,6 37.0 � 1.9 27.22 � 0
old Minichal Orange 31.91 � 0.391,5,7 32.24 � 0.341 18.59 � 0
old Sugar Yellow 42.15 � 0.893,4 32.1 � 1.01 22.92 � 0
itamin Red 30.45 � 0.391 29.26 � 0.103 14.29 � 0
ugar Cherry Red 30.9 � 1.11 31.87 � 0.891 18.7 � 1
ico Red Red 42.16 � 0.853,4 28.91 � 0.193,4 21.4 � 1
ugar Red Red 36.3 � 1.52,6,8 28.50 � 0.853,4 17.0 � 1
ed Vienna Red 33.7 � 1.17,8 24.38 � 0.57 12.7 � 1
lues within columns sharing a common superscript number are not significantly d
Length, width, weight and protein value are average � SD (n = 3).
Please cite this article in press as: Choi, S.H., et al., Protein, freantioxidative and cancer cell inhibitory effects of 12 greenhouse-g(2014), http://dx.doi.org/10.1016/j.jfca.2014.03.005
2.2. Sample preparation
2.2.1. Sampling of tomato fruits
Twelve commercial varieties of Korean cherry tomato fruitswere used in this experiment. Tomato seeds were planted onJanuary 15, 2012 in a greenhouse of the Buyeo Tomato ExperimentStation, Chung-Nam, Korea and harvested on May 2, 2012 at theiroptimum maturity stage for market (Fig. 1). Temperatures in thegreenhouse were set from 25 to 28 8C during the day and from 13to 18 8C during the night. Fruits were collected, weighed, andmeasured for size as shown in Table 1. Each tomato sampleconsisted of randomly selected 20 uniform-sized fresh fruits. Afterremoval of the calyx, the fruits were cut into 4–5-mm thick slices.
n cherry tomato fruits.a
g/fruit) H2O (%) Protein (g/100 g dry wt) Protein (g/100 g fresh wt)
.911 90.45 � 0.131,2,3 11.92 � 0.361,2,3,4 1.14 � 0.041,2,3
.31 88.62 � 0.204 8.27 � 0.555 0.94 � 0.061,3
.502,3 90.41 � 0.551,2,3 14.2 � 3.01 1.07 � 0.291,2,3
.271 90.81 � 0.181,3 13.18 � 0.471,2 1.21 � 0.041,2
.182 90.01 � 0.101,2,5 12.87 � 0.481,2,3 1.29 � 0.052
.081 90.19 � 0.041,2,3 10.34 � 0.242,3,4,5 1.01 � 0.021,2,3
.783,4 90.99 � 0.301,3 10.14 � 0.253,4,5 0.91 � 0.023,4
.285 90.26 � 0.321,2,3 9.68 � 0.364,5 0.94 � 0.041,3
.31 89.73 � 0.222,5 9.82 � 0.194,5 1.01 � 0.021,2,3
.04 89.02 � 0.284,5 9.80 � 0.064,5 1.08 � 0.011,2,3
.11 91.16 � 0.673 10.40 � 0.282,3,4,5 0.92 � 0.023,4
.35 88.55 � 0.544 9.67 � 0.354,5 1.11 � 0.041 2,4
ifferent (p < 0.05).
e amino acid, phenolic, b-carotene, and lycopene content, andrown commercial cherry tomato varieties. J. Food Compos. Anal.

89
90
91
92
93
94
95
96
97
98
99
100
101
102
103
104
105
106
107
108
109
110
111
112
113
114
115
116
117
118
119
120
121
122
123
124
125
126
127
128
129
130
131
132
133
134
135
136
137
138
139
140
141
142
143
144
145
146
147
148
149
150151152153154155156157158159160161162163164
165166167168169170171172173174175176177178179180181182183184185186187188
189190191192193194195196197198199200201
202
203204205206207208209210211
S.H. Choi et al. / Journal of Food Composition and Analysis xxx (2014) xxx–xxx 3
G Model
YJFCA 2408 1–13
The slices, including the seeds and gelatinous fluid, were thenimmersed in liquid nitrogen to fully freeze, then lyophilized(model PVTFD 10R, Ilsinbiobase Co., Ltd., Korea). Water contentwas determined by weighing the sample before and after freeze-drying.
The dried samples were ground briefly in a mortar and then in aWiley mill to pass a 20-mesh screen. Because dried tomatoes arevery hydroscopic, to avoid possible effects of moisture, light,temperature, and oxygen the samples were hermetically sealed ina desiccator containing P2O5 and stored in a dark freezer at �25 8C.The desiccator was brought to room temperature before removal ofthe sample.
2.2.2. Extraction of amino acids and phenolic compounds from cherry
tomatoes
A sample of each powder (44.9–75.4 mg, depending onavailability) was placed into a 25 mL volumetric flask and broughtup to volume with 80% methanol in water. The flask was thenplaced into an ultrasonic bath for 60 min at 30 8C. The sample wascentrifuged at 18,000 � g for 10 min at 1 8C. The supernatant wasthen passed through a 0.45 mm nylon filter (Millipore, Bedford,MA, USA). Spiking experiments showed that between 94.9–98.4%of phenolics were recovered. The filtrate was used for HPLCanalysis of amino acids and phenolic compounds as well as forassaying antioxidative and cell-inhibiting effects.
2.2.3. Extraction of carotenoids
The extraction of carotenoids from tomatoes was adaptedfrom the method of Nagata and Yamashita (Nagata andYamashita, 1992). Each powder (44.9–75.4 mg, depending onavailability) was placed into a 5 mL glass vial to which was addedacetone–hexane solution (2 mL, 4:6, v/v). The vial was thenplaced into an ultrasonic bath for 60 min at 30 8C. The solutionwas centrifuged at 18,000 � g for 10 min at 1 8C under darkness.The pellet was similarly re-extracted. The combined filtrateswere dried under reduced pressure. The residue was dissolved inthe acetone-hexane solution (2 mL). The extract was kept in thedark prior to analysis by HPLC. Spiking experiments showedrecovery of 91.3 and 95.6% of lycopene and b-carotene,respectively. Before testing for biologic activity, the extractswere solubilized in DMSO, then added to the aqueous systems.Although these precautions were taken to help keep the samplesin solution, it is possible that the reaction system may not behomogeneous.
2.3. Tomato component analysis
2.3.1. Crude protein content
The total N content of each freeze-dried tomato powder(�1.5 g) was determined in duplicate by a Kjeltec 2300 AnalyzerUnit (Foss, Sweden) according to the manufacturer’s instructions.Protein content/100 g of dry wt. = N � 6.25.
2.3.2. Amino acids and amino acid metabolites by HPLC
We determined the free amino acid and metabolite content ofthe cherry tomatoes in a single run. The analysis was carried outusing an ion exchange chromatography method describedpreviously (Choi et al., 2010, 2011a). Briefly, an aliquot(10 mL) of the filtrate obtained from the above extraction wasinjected into a Hitachi model L-8800 amino acid analyzer(Hitachi Co. Ltd., Tokyo, Japan) with a column packed withHitachi custom ion-exchange resin 2622 (4.6 i.d. � 60 mm,particle size = 5 mm). Lithium citrate buffer and ninhydrin flowrates for post column reaction were 0.35 and 0.30 mL/min,respectively. The column temperature was 30–70 8C and thereaction coil temperature, 135 8C.
Please cite this article in press as: Choi, S.H., et al., Protein, freeantioxidative and cancer cell inhibitory effects of 12 greenhouse-gr(2014), http://dx.doi.org/10.1016/j.jfca.2014.03.005
2.3.3. Content of phenolic compounds by HPLC
HPLC was carried out on a Shimadzu Prominance LC-20A(Shimadzu, Kyoto, Japan), which consisted of a CMA-20Acontroller, a DGU-20A3 degasser, two LC-20AD solvent deliverymodules, an SIL-20AC autosampler, a CTO-20A column oven, andan SPD-M20A photodiode array (PDA) detector. The flow ratewas 0.8 mL/min at 30 8C. Peaks were monitored at 190–400 nmand calibration was performed at 340 nm. An aliquot (20 mL)was injected directly into an Inertsil ODS-3 V (5 mm,4.6 mm � 250 mm) HPLC column (GL Sciences Inc., Tokyo, Japan).The mobile phase consisted of the following gradient modes:acetonitrile (A) and 0.5% formic acid (B), A = 5% (0–5 min), 18%(5.1–30 min), 70% (30.1–90 min), 90% (90.1–100 min), and 5%(100.1–120 min). Each sample was extracted three times andanalyzed in triplicate.
2.3.4. Identification of phenolic compounds by liquid
chromatography-mass-spectrometry (LC-MS)
LC was carried out on an Agilent Technologies (Santa Clara, CA,USA) 1200 series binary LC system with a photodiode arraydetector monitored at 190–400 nm. The LC was coupled with a3200 Q Trap LC-MS/MS system (Applied Biosystems Inc., FosterCity, CA, USA). An aliquot (20 mL) of the extract was directlyinjected into an Inertsil ODS-3 V (5 mm, 4.6–250 mm) HPLCcolumn (GL Sciences Inc., Torrance, CA, USA). The mobile phase,column temperature, and flow rate were the same as those of theabove-described HPLC system. The LC eluate was introduced intothe mass spectrometer from 5 to 40 min. Mass (MS) and tandemmass spectrometry (MS/MS) were operated in the negative ionmode in the mass range of m/z 160–1200. Helium was used as thecollision gas for the MS/MS procedures, followed by the isolationof ions over a selected mass window of 2 Da. MS/MS representsmultiple stages of precursor ion m/z selection followed by production detection for successive progeny ions. Mass selection ofthe analyte by m/z was followed by fragmentation and analysisof the fragments. For quantification, integrated chromatographicpeak areas from the test samples were compared with peakareas of known amounts of standard phenolic compounds 3-caffeoylquinic acid, quercetine-3-rutinoside, naringenin chal-cone, and naringenin.
2.3.5. Analysis of lycopene and b-carotene by HPLC
The HPLC system used was a Shimadzu HPLC (Kyoto, Japan),consisting of a LC-10ADVP pump, a SIL-10ADvp auto sampler, a CTO-10ASvp column oven, a SPDM 10Avp photodiode array (PDA)detector and a CBM-20A system controller. Data collection andintegration were accomplished using a Shimadzu LC solution. Thedetector was set at 470 nm and an autosampler cooled to 4 8C.A reversed-phase C18 column, particle size (5 mM), packed with anInertsil ODS-3V, 250 mm � 4.6 mm i.d. (GL Sciences Inc.) and heatedto 30 8C, was used. Lycopene and b-carotene were eluted withacetonitrile/methanol/dichloromethane/n-hexane (50:40:5:5, v/v/v/v) at a flow rate of1 mL/min. Peaks were compared with authenticpeaks from b-carotene and lycopene.
2.4. Bioactivities
The supernatant (500–1000 mL) obtained from the aboveextraction was placed in a 10 mL vial and dried at 30 8C underreduced pressure. Each residue was weighed and then dissolved inDMSO (f.c. 100 mg/mL) and then diluted to a concentration of1.25–10 mg/mL with phosphate buffer (0.1 M, pH 7.4). This dilutedsample was used for antioxidant assays.
The inhibition of the ABTS and FRAP free radical wascalculated using the following equation: ABTS and FRAPscavenging effect (%) = (1 � A (sample)/A (blank) � 100), where
amino acid, phenolic, b-carotene, and lycopene content, andown commercial cherry tomato varieties. J. Food Compos. Anal.

212 A
213 re214 ab215 ex216 in217 ea
218 2.
219 (3
220
221 ac222 AB223 (7224 da225 w226 of227 th228 w229 Th230 de
231 2.
232 (F
233
234 tr235 de236 St237 ac238 10239 of240 (1241 th242 Th243 so244 th245 an246 de
247 2.
248
249 ad250 fo251 fro252 16253 an254 b-255 w256 Sa257 at258 w259 co260 m261 m262 DM263 th264 He265 nu
266
%
267268269 2.
270
271 co
272273274275276277278279280281282
283
284
285286287288289290291292293294295296297298299300301
302303304305306307308309310311312313314315316317318319320321322323324325326327328329330331332333
S.H. Choi et al. / Journal of Food Composition and Analysis xxx (2014) xxx–xxx4
G Model
YJFCA 2408 1–13
(blank) is the absorbance of the control reaction (containing allagents except the test sample) and A (sample) is thesorbance of the test sample. The antioxidant activity waspressed as the IC50, defined as the concentration of sample thathibited formation of ABTS and FRAP radicals by 50%. Details forch assay follow.
4.1. Antioxidative activity by scavenging of the ABTS [2,20-azinobis-
-ethylbenzothiazoline-6-sulphonic acid)] radical
The spectrophotometric analysis of ABTS�+ radical scavengingtivity was determined according to the method of Re et al. (1999).TS�+ cation radical was produced by the reaction between ABTS
mM) in H2O and potassium persulfate (2.45 mM), stored in therk at room temperature for 24 h. Before usage, the ABTS�+ solution
as diluted with phosphate buffer (0.1 M, pH 7.4) to an absorbance 0.70 � 0.02 at 732 nm. The ABTS�+ solution (990 mL) was added toe sample (10 mL). After 1 min, the percentage inhibition at 732 nmas calculated for each concentration relative to a blank absorbance.e antioxidant potential of the sample, in terms of mg/mL, wastermined from a standard curve plotted using Trolox.
4.2. Antioxidative activity by the ferric reducing/antioxidant power
RAP) assay
The reduction by antioxidants in the sample of ferric-ipyridyltriazine (Fe3+-TPTZ) to the ferrous form (Fe2+) wastermined by the method of Benzie and Strain (Benzie andrain, 1996). The FRAP reagent was freshly prepared by mixing ofetate buffer (100 mL, 300 mM, pH 3.6), TPTZ solution (10 mL,
mM TPTZ in 40 mM/HCl), FeCl3�6H2O (10 mL, 20 nM) in a ratio 10:1:1 with distilled water (12 mL) at 37 8C. The FRAP reagent.8 mL), deionized water (180 mL) and the sample (60 mL) wereen added to a test tube, which was incubated at 37 8C for 4 min.e absorbance was measured at 593 nm using FRAP workinglution as a blank. The sample was diluted if necessary to bringe absorbance reading in the range between 0 and 2.0. Thetioxidant potential of the sample in terms of mmol Fe2+/mg, wastermined from a standard curve plotted using the FeSO4�7H2O.
4.3. MTT assay for growth inhibition of cells
The MTT assay that differentiates dead from living cells wasapted from the literature (Alley et al., 1988). The cell lines chosenr this study are the same as those in cited previous publicationsm this laboratory. The cells were maintained in a-MEM or RPMI40 medium supplemented with 10% fetal bovine serum (FBS)d 1% penicillin/streptomycin at 37 8C in a 5% CO2 incubator. Thecarotene and lycopene were dissolved in DMSO (100 mg/mL),
hile the other samples were dissolved in DMSO (10%, 10 mg/mL).mples were stored at 4 8C. Cells were seeded into a 96-well plate
a density of 1 � 104 cells/well and incubated for 24 h. Next, cellsere treated with three concentrations (10, 50, 100 mg/mL) of purempounds and five concentrations (10, 50, 100, 200, and 300 mg/L) of tomato extract samples for 48 h. The MTT solution (0.1 mg/L) was then added to each well. After 4 h of incubation at 37 8C,
SO (100 mL) was added to each well. The absorbance (A) wasen read at 540 nm using a microplate reader (Bio-Rad Co.,rcules, CA, USA). The decrease in A measures the decrease in thember of viable cells calculated by using the following formula:
inhibition of cells ¼ AðcontrolÞ � AðsampleÞAðcontrolÞ � 100:
5. Statistical analysis
Inhibitory concentrations at 50% (IC50) values were calculated bynstructing a four-parameter logistic curve using the values from
Please cite this article in press as: Choi, S.H., et al., Protein, freantioxidative and cancer cell inhibitory effects of 12 greenhouse-g(2014), http://dx.doi.org/10.1016/j.jfca.2014.03.005
the previous calculation, percentage inhibition of cells, with the aidof SigmaPlot 11 (Systat Software, Inc., San Jose, CA, USA). Theresulting equation was solved for concentration at 50% cellinhibition. Statistical differences between samples were determinedby ANOVA followed by Holm–Sidak tests using the Sigma Plot 11software.
Statistical differences were determined by analysis of variation(ANOVA) followed by Holm–Sidak post hoc tests, and correlationsby the Pearson correlation constant, using the Sigma Plot 11software (Systat, Chicago, IL, USA). Statistical significance isdefined as p < 0.05.
3. Results and discussion
3.1. Cherry tomato descriptive and content analysis
3.1.1. Colors, dimensions, water, and protein content of 12 cherry
tomato fruits
Fig. 1 shows photographs of 12 greenhouse-grown cherrytomato cultivars evaluated in this study and Table 1 lists the colors,length and width dimensions, weight, moisture, and proteincontent of these tomatoes. The chosen tomatoes represent a fullrange of the colors and sizes found in commercial tomatoes,including fully ripe green, orange, yellow, red, and black coloredtomatoes. The data show that: (a) the weight of fruit ranged from12.7 g (Red Vienna) to 27.22 g (Saeng Green Chorok) or a 2.1-foldvariation from lowest to highest weights; (b) the range of moisturecontent was narrow, from 88.55% (Red Vienna) to 91.16% (SugarRed); and (c) the ‘crude’ protein content, which consists of free andprotein-bound amino acids, ranged from 8.27 (Totori Gold) to 14.2(Sugar Yellow) g/100 g dry wt. On a fresh basis, the protein contentranged from 0.91 (Gold Sugar) to 1.29 g/100 g (Saeng GreenChorok), a smaller variation than protein on a dry basis.
3.1.2. Free amino acids and N-containing secondary metabolites
Free amino acids from plants can have a dual role in the diet. Aswith any protein, they represent a source of nitrogen and ofnutritionally essential amino acids. They are notable in that theyquickly interact with the palate, greatly affecting flavor. They arealso more bioavailable after consumption than protein-boundamino acids and can react with other components of the diet. Forexample, free amino acids can react with free sugars during heatingto produce browning products. One such browning product,acrylamide, is potentially toxic (Friedman and Levin, 2008).
During ripening, tomato pepsidases hydrolyze a significantamount of protein into free amino acids (Sorrequieta et al., 2010).In our previous work (Choi et al., 2010), we found that the freeamino acid content increased rapidly during the breaker stage andwas highest when the tomato was about one-half red. Activities ofamino acid-metabolizing enzymes during ripening may lead tochanges in amino acid profile (Sorrequieta et al., 2010). Intomatoes, it appears that free amino acids are a major contributorto protein nutrition.
Table 2 reports the free amino acid and amino acid metabolitecontent of the cherry tomato samples in the order of HPLC elutionposition. Saeng Green Chorok, followed by Saeng Green Bichuiball,has the highest levels of total free amino acids. We also calculatedthe contribution of total free amino acids to the total proteindetermined from the Kjeldahl nitrogen reported in Table 1. Thepercentage of total amino acids as free amino acids ranged from28% (Sugar Yellow) to 56% (Saeng Green Chorok).
L-Glu was the most abundant free amino acid, followed by L-Gln.Free L-Glu apparently increases significantly during tomatoripening (Boggio et al., 2000; Choi et al., 2010; Sorrequieta et al.,2010). Boggio et al. (2000) and Sorrequieta et al. (2010) tracked anumber of nitrogen metabolizing enzymes in ripening fruit and
e amino acid, phenolic, b-carotene, and lycopene content, andrown commercial cherry tomato varieties. J. Food Compos. Anal.
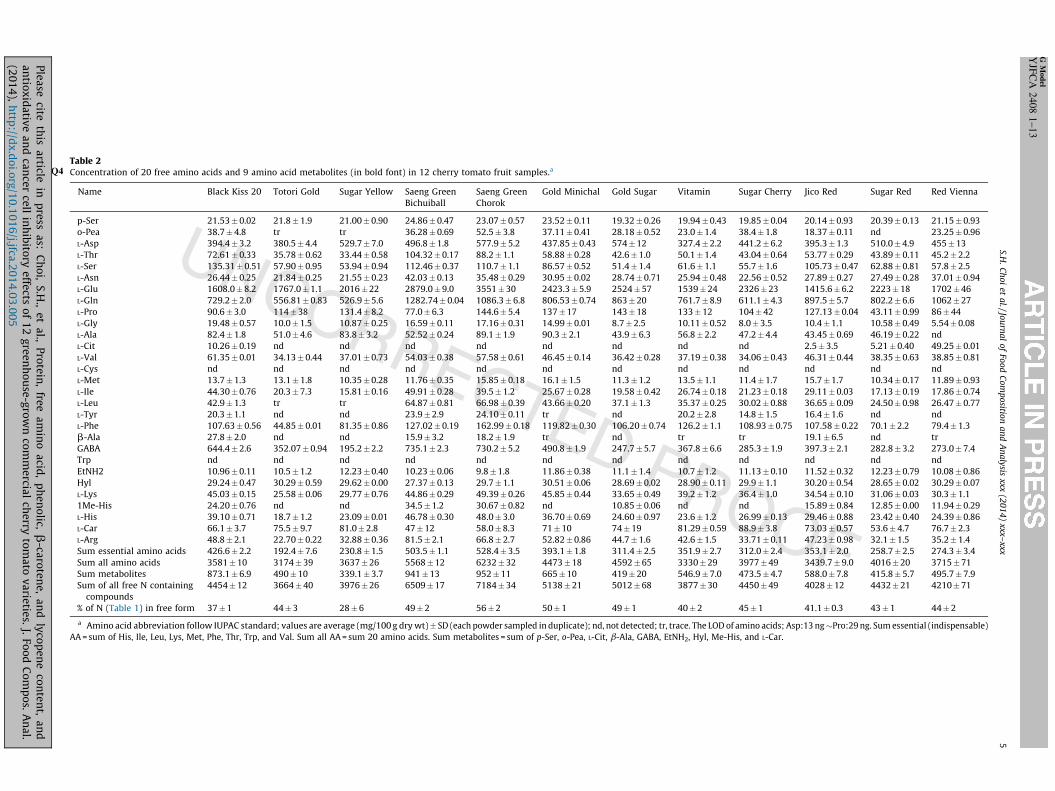
Table 2Concentration of 20 free amino acids and 9 amino acid metabolites (inQ4 bold font) in 12 cherry tomato fruit samples.a
Name Black Kiss 20 Totori Gold Sugar Yellow Saeng Green
Bichuiball
Saeng Green
Chorok
Gold Minichal Gold Sugar Vitamin Sugar Cherry Jico Red Sugar Red Red Vienna
p-Ser 21.53� 0.02 21.8�1.9 21.00� 0.90 24.86�0.47 23.07� 0.57 23.52�0.11 19.32�0.26 19.94�0.43 19.85�0.04 20.14�0.93 20.39� 0.13 21.15�0.93
o-Pea 38.7�4.8 tr tr 36.28�0.69 52.5�3.8 37.11�0.41 28.18�0.52 23.0�1.4 38.4�1.8 18.37� 0.11 nd 23.25�0.96
L-Asp 394.4�3.2 380.5�4.4 529.7�7.0 496.8�1.8 577.9�5.2 437.85�0.43 574�12 327.4�2.2 441.2�6.2 395.3�1.3 510.0�4.9 455�13
L-Thr 72.61� 0.33 35.78� 0.62 33.44�0.58 104.32�0.17 88.2�1.1 58.88�0.28 42.6�1.0 50.1�1.4 43.04�0.64 53.77� 0.29 43.89� 0.11 45.2�2.2
L-Ser 135.31�0.51 57.90� 0.95 53.94�0.94 112.46� 0.37 110.7�1.1 86.57�0.52 51.4�1.4 61.6�1.1 55.7�1.6 105.73� 0.47 62.88� 0.81 57.8�2.5
L-Asn 26.44� 0.25 21.84� 0.25 21.55�0.23 42.03�0.13 35.48� 0.29 30.95�0.02 28.74�0.71 25.94�0.48 22.56�0.52 27.89� 0.27 27.49� 0.28 37.01� 0.94
L-Glu 1608.0�8.2 1767.0�1.1 2016�22 2879.0�9.0 3551�30 2423.3�5.9 2524�57 1539�24 2326�23 1415.6�6.2 2223�18 1702�46
L-Gln 729.2�2.0 556.81�0.83 526.9�5.6 1282.74� 0.04 1086.3�6.8 806.53�0.74 863�20 761.7�8.9 611.1�4.3 897.5�5.7 802.2�6.6 1062�27
L-Pro 90.6�3.0 114�38 131.4�8.2 77.0�6.3 144.6�5.4 137�17 143�18 133�12 104�42 127.13� 0.04 43.11� 0.99 86�44
L-Gly 19.48� 0.57 10.0�1.5 10.87�0.25 16.59�0.11 17.16� 0.31 14.99�0.01 8.7�2.5 10.11� 0.52 8.0�3.5 10.4�1.1 10.58� 0.49 5.54� 0.08
L-Ala 82.4�1.8 51.0�4.6 83.8�3.2 52.52�0.24 89.1�1.9 90.3�2.1 43.9�6.3 56.8�2.2 47.2�4.4 43.45� 0.69 46.19� 0.22 nd
L-Cit 10.26� 0.19 nd nd nd nd nd nd nd nd 2.5�3.5 5.21� 0.40 49.25�0.01
L-Val 61.35� 0.01 34.13� 0.44 37.01�0.73 54.03�0.38 57.58� 0.61 46.45�0.14 36.42�0.28 37.19�0.38 34.06�0.43 46.31� 0.44 38.35� 0.63 38.85�0.81
L-Cys nd nd nd nd nd nd nd nd nd nd nd nd
L-Met 13.7�1.3 13.1�1.8 10.35�0.28 11.76�0.35 15.85� 0.18 16.1�1.5 11.3�1.2 13.5�1.1 11.4�1.7 15.7�1.7 10.34� 0.17 11.89�0.93
L-Ile 44.30� 0.76 20.3�7.3 15.81�0.16 49.91�0.28 39.5�1.2 25.67�0.28 19.58�0.42 26.74�0.18 21.23�0.18 29.11� 0.03 17.13� 0.19 17.86�0.74
L-Leu 42.9�1.3 tr tr 64.87�0.81 66.98� 0.39 43.66�0.20 37.1�1.3 35.37�0.25 30.02� 0.88 36.65� 0.09 24.50� 0.98 26.47�0.77
L-Tyr 20.3�1.1 nd nd 23.9�2.9 24.10� 0.11 tr nd 20.2�2.8 14.8�1.5 16.4�1.6 nd nd
L-Phe 107.63� 0.56 44.85� 0.01 81.35�0.86 127.02�0.19 162.99�0.18 119.82�0.30 106.20� 0.74 126.2�1.1 108.93�0.75 107.58� 0.22 70.1�2.2 79.4�1.3
b-Ala 27.8�2.0 nd nd 15.9�3.2 18.2�1.9 tr nd tr tr 19.1�6.5 nd tr
GABA 644.4�2.6 352.07� 0.94 195.2�2.2 735.1�2.3 730.2�5.2 490.8�1.9 247.7�5.7 367.8�6.6 285.3�1.9 397.3�2.1 282.8�3.2 273.0�7.4
Trp nd nd nd nd nd nd nd nd nd nd nd nd
EtNH2 10.96� 0.11 10.5�1.2 12.23�0.40 10.23�0.06 9.8�1.8 11.86�0.38 11.1�1.4 10.7�1.2 11.13�0.10 11.52� 0.32 12.23� 0.79 10.08� 0.86
Hyl 29.24� 0.47 30.29� 0.59 29.62�0.00 27.37�0.13 29.7�1.1 30.51�0.06 28.69�0.02 28.90� 0.11 29.9�1.1 30.20�0.54 28.65� 0.02 30.29� 0.07
L-Lys 45.03� 0.15 25.58� 0.06 29.77�0.76 44.86�0.29 49.39� 0.26 45.85�0.44 33.65�0.49 39.2�1.2 36.4�1.0 34.54� 0.10 31.06� 0.03 30.3�1.1
1Me-His 24.20� 0.76 nd nd 34.5�1.2 30.67� 0.82 nd 10.85� 0.06 nd nd 15.89� 0.84 12.85� 0.00 11.94�0.29
L-His 39.10� 0.71 18.7�1.2 23.09�0.01 46.78�0.30 48.0�3.0 36.70�0.69 24.60� 0.97 23.6�1.2 26.99�0.13 29.46� 0.88 23.42� 0.40 24.39�0.86
L-Car 66.1�3.7 75.5�9.7 81.0�2.8 47�12 58.0�8.3 71�10 74�19 81.29�0.59 88.9�3.8 73.03�0.57 53.6�4.7 76.7�2.3
L-Arg 48.8�2.1 22.70� 0.22 32.88�0.36 81.5�2.1 66.8�2.7 52.82�0.86 44.7�1.6 42.6�1.5 33.71�0.11 47.23� 0.98 32.1�1.5 35.2�1.4
Sum essential amino acids 426.6�2.2 192.4�7.6 230.8�1.5 503.5�1.1 528.4�3.5 393.1�1.8 311.4�2.5 351.9�2.7 312.0�2.4 353.1�2.0 258.7�2.5 274.3�3.4
Sum all amino acids 3581�10 3174�39 3637�26 5568�12 6232�32 4473�18 4592�65 3330�29 3977�49 3439.7�9.0 4016�20 3715�71
Sum metabolites 873.1�6.9 490�10 339.1�3.7 941�13 952�11 665�10 419�20 546.9�7.0 473.5�4.7 588.0�7.8 415.8�5.7 495.7�7.9
Sum of all free N containing
compounds
4454�12 3664�40 3976�26 6509�17 7184�34 5138�21 5012�68 3877�30 4450�49 4028�12 4432�21 4210�71
% of N (Table 1) in free form 37�1 44�3 28�6 49�2 56�2 50�1 49�1 40�2 45�1 41.1�0.3 43�1 44�2
a Amino acid abbreviation follow IUPAC standard; values are average (mg/100 g dry wt)� SD (each powder sampled in duplicate); nd, not detected; tr, trace. The LOD of amino acids; Asp:13 ng�Pro:29 ng. Sum essential (indispensable)
AA = sum of His, Ile, Leu, Lys, Met, Phe, Thr, Trp, and Val. Sum all AA = sum 20 amino acids. Sum metabolites = sum of p-Ser, o-Pea, L-Cit, b-Ala, GABA, EtNH2, Hyl, Me-His, and L-Car.
S.H.
Ch
oi
et a
l. /
Jou
rna
l o
f Fo
od
Co
mp
ositio
n a
nd
An
aly
sis xxx
(20
14
) xxx–
xxx
5
G M
od
el
YJF
CA
24
08
1–
13
Ple
ase
cite th
is a
rticle in
pre
ss a
s: C
ho
i, S
.H.,
et
al.,
Pro
tein
, fre
e a
min
o a
cid,
ph
en
olic,
b-ca
rote
ne
, a
nd
lyco
pe
ne
con
ten
t, a
nd
an
tiox
ida
tive
an
d ca
nce
r ce
ll in
hib
itory
effe
cts o
f 1
2 g
ree
nh
ou
se-g
row
n co
mm
ercia
l ch
erry
tom
ato
va
rietie
s. J.
Foo
d C
om
po
s. A
na
l.(2
01
4),
http
://dx
.do
i.org
/10
.10
16
/j.jfca.2
01
4.0
3.0
05

334 fo335 Co336 ch337 As338 g-339 in340
341 an342 GA343 et344 to345 20346 gr347 20348 (S349
350 th351 at352 M353 w354
355 am356 nu357 in358 po359 et360
361 av362 st363 20364 Na365 Ag366 Tr367 w368 Tr369 in370 ot371 co372 in373 co
374 3.
375
376 th377 w
378379380381382383384385386387388389390391392393394395396397398399400401402403404405406407408409410411412413414415416417418419420421422
Figwi
sta
Se
S.H. Choi et al. / Journal of Food Composition and Analysis xxx (2014) xxx–xxx6
G Model
YJFCA 2408 1–13
und that their activity was consistent with L-Glu accumulation.ntent of L-Glu is significant to tomato flavor, as it imparts thearacteristic umami taste (Sorrequieta et al., 2010). In addition, L-p, also important for tomato flavor (Fuke and Konosu, 1991), andamino-butyric acid (GABA; 4-aminobutyric acid) were present
significant amounts.GABA, a non-protein amino acid synthesized from L-Glu, is often
important component of the free amino acid pool in plants.BA levels are reported to increase in response to stress (Shelp
al., 1999), and may be a signaling molecule in plants in addition acting as a neurotransmitter in mammals (Bouche and Fromm,04). The content in tomatoes is highest just before the breakerowth stage, and then decreases (Akihiro et al., 2008; Choi et al.,10). Our results confirm that tomatoes are a good source of GABA
aito et al., 2008).The L-Pro, L-Phe, and L-Ser values ranged between 1 and 4% of
e total free amino acids. The remaining amino acids were present levels less than 2% with minor exceptions. L-Cit, b-Ala, L-Tyr, andet-His were absent from many samples and neither L-Cys nor Trpas found in any of the samples.
Protein quality is contingent on a balance of the essentialino acids His, Ile, Leu, Lys, Met, Phe, Thr, Trp, and Val. Lys istritionally limiting in cereals, Met in legumes, and Trp and Lys
corn. Presence of these three amino acids in tomatoes cantentially balance their lack in the mentioned foods (Mercer
al., 1989).Fig. 2 compares the essential amino acid profiles of: (1) the
erage free amino acids of all cherry tomatoes in this study; (2) aandard reference complete protein (Institute of Medicine,02); and (3) the standard analysis of tomato from the USDAtional Nutrient Database ( U.S. Department of Agriculture:ricultural Research Service, 2012 ). In our samples, Leu, Lys, andp were the most limiting amino acids. Leu and Lys but not Trpere also limiting in the USDA data bank. In fact, we found no freep in any of the samples. This is consistent with a previous study
which free Trp content was found in some samples but nothers (Choi et al., 2011b). In that study, Saeng Green Chorokntained free Trp, whereas the same variety in this study did not,dicating that factors other than variety may influence free Trpntent of tomatoes.
1.3. Phenolic compounds in cherry tomatoes
Cherry tomatoes are a good source of phenolic compounds, bute variation in the content of these compounds by variety is notell documented. Cherry tomatoes contain about 3–4 times the
423424425426427428429430
431432433434435436437438439440441442
Essential Amino Acid Scoring Pattern of a 'Complete' Protein, the USDA Standard Analysis of Fresh Tomatoes, and the
Average Cherry Tomato Free Essential Amino Acid Content
0
10
20
30
40
50
60
His Ile Leu Lys Met +Cys
Phe +Tyr
Thr Trp Val
mg
tota
l am
ino
acid
/ g
prot
ein
0
2
4
6
8
10
12
14
mg free am
ino acid / g proteinin cherry tom
ato
Complete ProteinUSDA TomatoCherry Tomatoes
. 2. Comparison of the average cherry tomato free essential amino acid content
th an optimal complete protein (Institute of Medicine, 2002), and the USDA
ndard analysis of tomato (U.S. Department of Agriculture: Agricultural Research
rvice, 2012).
Please cite this article in press as: Choi, S.H., et al., Protein, freantioxidative and cancer cell inhibitory effects of 12 greenhouse-g(2014), http://dx.doi.org/10.1016/j.jfca.2014.03.005
flavonoid content of standard sized tomatoes. This is notunexpected because cherry tomatoes have more surface areaper unit volume than standard sized tomatoes and because themajority of phenolics are believed to be in the epicarp (Adato et al.,2009). When tomato mutants lack phenolics in the epicarp, thefruit is pink instead of red (Ballester et al., 2010). Apparently, theyellow color of the flavonoids contributes to the typical yellowand orange hues of the fruit, suggesting some association betweentomato color and phenolic content (Adato et al., 2009). The brightcarotenes present in the flesh contribute to the dominant color. Inthe present study, we identified the individual phenolic com-pounds and determined their levels in samples of 12 cultivars ofvariable color grown and harvested under identical environmen-tal conditions.
Fig. 3 shows a chromatogram of the cherry tomato phenolicsseparated by HPLC. Chromatographic retention times (Rt), UV/Visspectra, and MS and MS/MS data are shown in Table 3. From theseresults, as well as from those reported in other studies (Ferrereset al., 2005; Ozga et al., 2007; Beelders et al., 2012), we identifiedthe following compounds: 3-caffeoylquinic acid (chlorogenic acid),5-caffeoylquinic acid (neochlorogenic acid), 3,4-di-O-caffeoylqui-nic (isochlorogenic) acid, 3,4,5-tri-caffeoylquinic acid, quercetin-3-apiosylrutinoside, quercetin-3-rutinoside (rutin), quercetin-3,7,40-triglucoside, naringenin, and naringenin chalcone (phlor-etin). The HPLC chromatograms and the MS spectra also showedthe presence of two caffeic acid–hexose isomers (Table 3) that wewere not able to completely characterize. Fig. 4 shows thestructures of the characterized compounds.
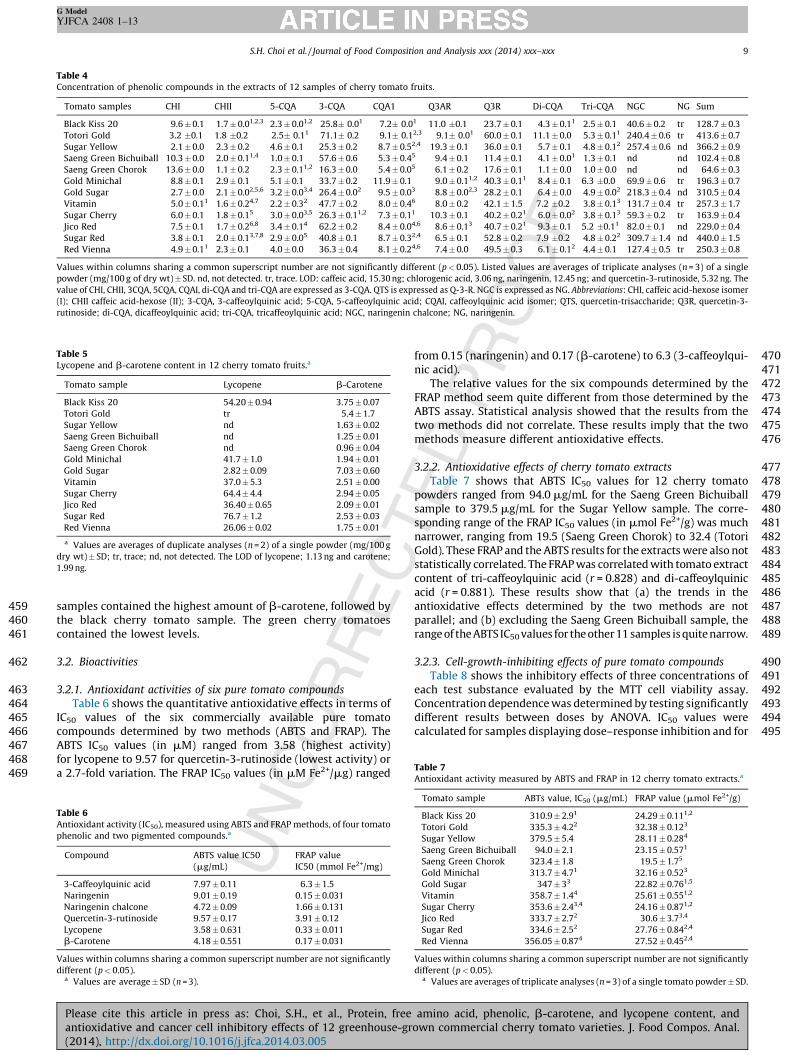
Table 4 lists the content of individual and total phenolics incherry tomatoes separated by HPLC (Fig. 3). The last column inTable 4 lists the total (sum) of phenolics for each sample. The range(in mg/100 g dry wt) is from 64.6 for the Saeng Green Choroksample to 440.0 for the Sugar Red sample or a striking 6.8-foldvariation from the lowest to the highest value. Naringeninchalcone is the most abundant phenolic in all but the Saengcherry tomato samples, in which none was detected. These twoSaeng green cherry tomato samples had the lowest total phenoliccontent. The other samples had 30–70% of their phenolics asnaringenin chalcone, with the higher content in Sugar Yellow, GoldSugar, and Sugar Red samples. 3-Caffeoylquinic acid and querce-tin-3-rutinoside were the next most abundant phenolics. Onlysmall amounts of caffeic acid hexose isomer (I) were found, andnaringenin was found in only trace amounts or not at all. Althoughhigh levels of naringenin have previously been reported intomatoes, it is believed that naringenin chalcone is eitherconverted to naringenin during certain extraction processes(Krause and Galensa, 1992), or that because the chalcone andnaringenin have similar chromatographic elution positions, theyare confused for each other during analysis (Slimestad andVerheul, 2011). Besides naringenin chalcone levels, which rangedbetween 0 and 70%, the caffeic hexose isomer (I) varied the most,from 0.6% in Sugar Yellow to 21% in Saeng Green Chorok samples(from 2.1 to 13.6 mg/100 g).
3.1.4. Lycopene and b-carotene content of 12 cherry tomatoes
In addition to phenolic-type antioxidants, tomatoes alsocontain the antioxidative carotenes, lycopene and b-carotene.Lycopene is responsible for the red and b-carotene for the orangecolor in the tomato pericarp. Carotenes accumulate in ripeningtomatoes during the process of differentiation of chlorophyll-containing chloroplasts into carotene-containing chromoplasts(Egea et al., 2010). Various mutations in this pathway may result intomatoes of different colors; lacking the ability to synthesizecarotenes or to degrade chlorophyll (Paran and van der Knaap,2007). Purple and black tomatoes produce carotenes, but do notfully degrade chlorophyll, leading to a dark brownish fruit color
e amino acid, phenolic, b-carotene, and lycopene content, andrown commercial cherry tomato varieties. J. Food Compos. Anal.
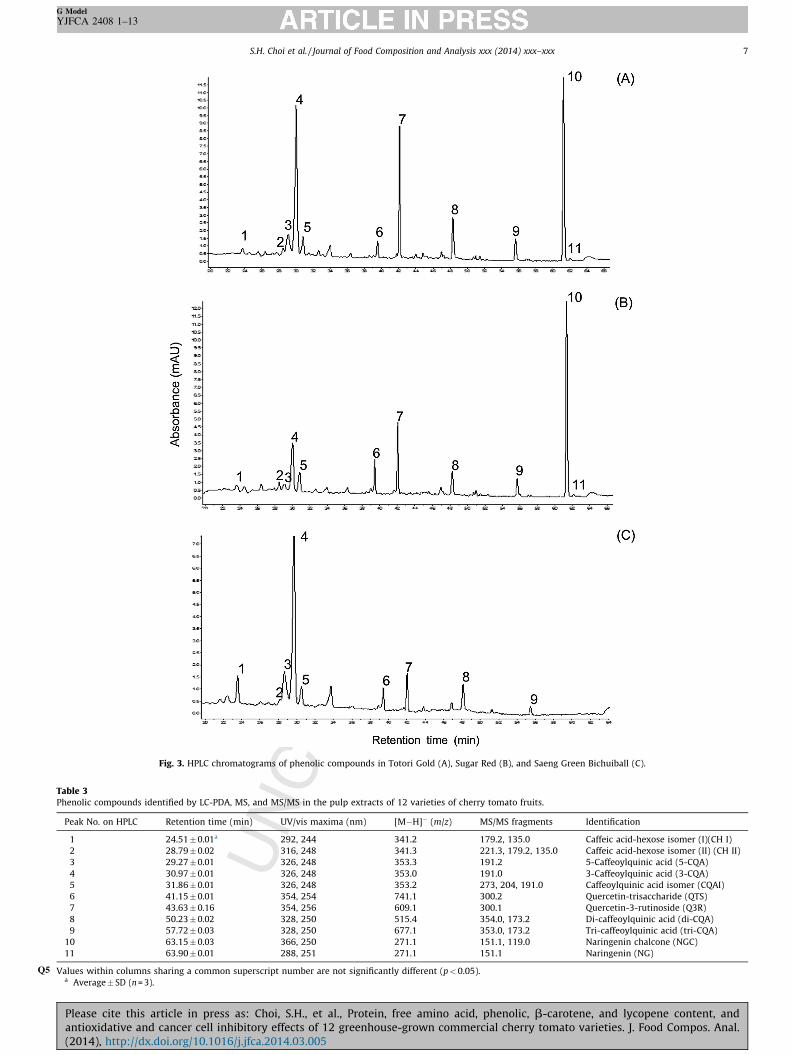
Fig. 3. HPLC chromatograms of phenolic compounds in Totori Gold (A), Sugar Red (B), and Saeng Green Bichuiball (C).
Table 3Phenolic compounds identified by LC-PDA, MS, and MS/MS in the pulp extracts of 12 varieties of cherry tomato fruits.
Peak No. on HPLC Retention time (min) UV/vis maxima (nm) [M�H]� (m/z) MS/MS fragments Identification
1 24.51 � 0.01a 292, 244 341.2 179.2, 135.0 Caffeic acid-hexose isomer (I)(CH I)
2 28.79 � 0.02 316, 248 341.3 221.3, 179.2, 135.0 Caffeic acid-hexose isomer (II) (CH II)
3 29.27 � 0.01 326, 248 353.3 191.2 5-Caffeoylquinic acid (5-CQA)
4 30.97 � 0.01 326, 248 353.0 191.0 3-Caffeoylquinic acid (3-CQA)
5 31.86 � 0.01 326, 248 353.2 273, 204, 191.0 Caffeoylquinic acid isomer (CQAI)
6 41.15 � 0.01 354, 254 741.1 300.2 Quercetin-trisaccharide (QTS)
7 43.63 � 0.16 354, 256 609.1 300.1 Quercetin-3-rutinoside (Q3R)
8 50.23 � 0.02 328, 250 515.4 354.0, 173.2 Di-caffeoylquinic acid (di-CQA)
9 57.72 � 0.03 328, 250 677.1 353.0, 173.2 Tri-caffeoylquinic acid (tri-CQA)
10 63.15 � 0.03 366, 250 271.1 151.1, 119.0 Naringenin chalcone (NGC)
11 63.90 � 0.01 288, 251 271.1 151.1 Naringenin (NG)
Values withinQ5 columns sharing a common superscript number are not significantly different (p < 0.05).a Average � SD (n = 3).
S.H. Choi et al. / Journal of Food Composition and Analysis xxx (2014) xxx–xxx 7
G Model
YJFCA 2408 1–13
Please cite this article in press as: Choi, S.H., et al., Protein, free amino acid, phenolic, b-carotene, and lycopene content, andantioxidative and cancer cell inhibitory effects of 12 greenhouse-grown commercial cherry tomato varieties. J. Food Compos. Anal.(2014), http://dx.doi.org/10.1016/j.jfca.2014.03.005

443 fro444 Pa445 in446 th447 co448 et449
450 dr
451452453454455456457458
OHO
HO
OOH
naringenin
O
OH
OH
HO OH
O
HO
HO
O
3-caff eoylquinic acid(chlorgenic acid)
OOH
OH
HO OH
O
HO
HO
O
5-caffeoylquinic acid(neochlorgenic acid)
OOO H
OHO
HO
OHO
OHHO
OO
HOOH
OH
quercetin-3-rutinoside
OOO H
OO
OHOO
OHOHHO
OHO
HOOHOH
OH
quercetin-3,7,4'-triglucosi de
OOH
OHOH
HO
OO
OH
HO OH
O
HO
HO
O
3,4-di-O-caffeoylquinic acid (Isochlorogenic acid)
O
HH
OHHO
OO
O
HO OH
O
HO
HO
O
3,4,5-tri-O-caffeoylquinic acid
O
OHHO
OHOH
O
O
HO
OH
OH
OH
naringenin chalconeβ-carotene
lycopene
HO
OOOH
OHO
OH
OOH
OHOH
OO
OOH
HO
quercetin-3-apiosylrutino si de
OH
O
HO
OHOH
Fig. 4. Structures of characterized compounds in cherry tomato extracts.
S.H. Choi et al. / Journal of Food Composition and Analysis xxx (2014) xxx–xxx8
G Model
YJFCA 2408 1–13
m the combined green, red, and orange pigments (Barry andndey, 2009). Several recently developed cultivars (not evaluated
this study) are bright purple due to a high anthocyanin contentat results from crossing tomato with the related anthocyanin-ntaining species, Solanum chilense (Jones et al., 2003; Gonzali
al., 2009).The carotene range (Table 5, b-carotene + lycopene in mg/100 g
y wt) in green and yellow tomatoes was 0.96–9.9, and in orange,
Please cite this article in press as: Choi, S.H., et al., Protein, freantioxidative and cancer cell inhibitory effects of 12 greenhouse-g(2014), http://dx.doi.org/10.1016/j.jfca.2014.03.005
red, and red-black, 27.8–79.2. We ranked the cherry tomatoesbased on color as follows: green (1), yellow (2), orange (3), red (4),and red-black (5). Color rank was correlated with lycopene(r = 0.84, p < 0.05) but not with b-carotene content. None of thegreen or yellow varieties contained more than a trace of lycopene.We could not predict the b-carotene content in the red tomatoesbecause the dark red lycopene concealed the contribution of thelighter-colored orange b-carotene. Two of the three yellow
e amino acid, phenolic, b-carotene, and lycopene content, andrown commercial cherry tomato varieties. J. Food Compos. Anal.
459
460
461
462
463
464
465
466
467
468
469
470471472473474475476
477478479480481482483484485486487488489
490491492493494495
Table 4Concentration of phenolic compounds in the extracts of 12 samples of cherry tomato fruits.
Tomato samples CHI CHII 5-CQA 3-CQA CQA1 Q3AR Q3R Di-CQA Tri-CQA NGC NG Sum
Black Kiss 20 9.6 � 0.1 1.7 � 0.01,2,3 2.3 � 0.01,2 25.8� 0.01 7.2� 0.01 11.0 �0.1 23.7 � 0.1 4.3 � 0.11 2.5 � 0.1 40.6 � 0.2 tr 128.7 � 0.3
Totori Gold 3.2 �0.1 1.8 �0.2 2.5� 0.11 71.1� 0.2 9.1� 0.12,3 9.1� 0.01 60.0 � 0.1 11.1 � 0.0 5.3 � 0.11 240.4 � 0.6 tr 413.6 � 0.7
Sugar Yellow 2.1 � 0.0 2.3 � 0.2 4.6 � 0.1 25.3 � 0.2 8.7 � 0.52,4 19.3 � 0.1 36.0 � 0.1 5.7 � 0.1 4.8 � 0.12 257.4 � 0.6 nd 366.2 � 0.9
Saeng Green Bichuiball 10.3 � 0.0 2.0 � 0.11,4 1.0 � 0.1 57.6 � 0.6 5.3 � 0.45 9.4 � 0.1 11.4 � 0.1 4.1 � 0.01 1.3 � 0.1 nd nd 102.4 � 0.8
Saeng Green Chorok 13.6 � 0.0 1.1 � 0.2 2.3 � 0.11,2 16.3 � 0.0 5.4 � 0.05 6.1 � 0.2 17.6 � 0.1 1.1 � 0.0 1.0 � 0.0 nd nd 64.6 � 0.3
Gold Minichal 8.8 � 0.1 2.9 � 0.1 5.1 � 0.1 33.7 � 0.2 11.9 � 0.1 9.0 � 0.11,2 40.3 � 0.11 8.4 � 0.1 6.3 �0.0 69.9 � 0.6 tr 196.3 � 0.7
Gold Sugar 2.7 � 0.0 2.1 � 0.02,5,6 3.2 � 0.03,4 26.4 � 0.02 9.5 � 0.03 8.8 � 0.02,3 28.2 � 0.1 6.4 � 0.0 4.9 � 0.02 218.3 � 0.4 nd 310.5 � 0.4
Vitamin 5.0 � 0.11 1.6 � 0.24,7 2.2 � 0.32 47.7 � 0.2 8.0 � 0.46 8.0 � 0.2 42.1 � 1.5 7.2 �0.2 3.8 � 0.13 131.7 � 0.4 tr 257.3 � 1.7
Sugar Cherry 6.0 � 0.1 1.8 � 0.15 3.0 � 0.03,5 26.3 � 0.11,2 7.3 � 0.11 10.3 � 0.1 40.2 � 0.21 6.0 � 0.02 3.8 � 0.13 59.3 � 0.2 tr 163.9 � 0.4
Jico Red 7.5 � 0.1 1.7 � 0.26,8 3.4 � 0.14 62.2 � 0.2 8.4 � 0.04,6 8.6 � 0.13 40.7 � 0.21 9.3 � 0.1 5.2 �0.11 82.0 � 0.1 nd 229.0 � 0.4
Sugar Red 3.8 � 0.1 2.0 � 0.13,7,8 2.9 � 0.05 40.8 � 0.1 8.7 � 0.32,4 6.5 � 0.1 52.8 � 0.2 7.9 �0.2 4.8 � 0.22 309.7 � 1.4 nd 440.0 � 1.5
Red Vienna 4.9 � 0.11 2.3 � 0.1 4.0 � 0.0 36.3 � 0.4 8.1 � 0.24,6 7.4 � 0.0 49.5 � 0.3 6.1 � 0.12 4.4 � 0.1 127.4 � 0.5 tr 250.3 � 0.8
Values within columns sharing a common superscript number are not significantly different (p < 0.05). Listed values are averages of triplicate analyses (n = 3) of a single
powder (mg/100 g of dry wt) � SD. nd, not detected. tr, trace. LOD: caffeic acid, 15.30 ng; chlorogenic acid, 3.06 ng, naringenin, 12.45 ng; and quercetin-3-rutinoside, 5.32 ng. The
value of CHI, CHII, 3CQA, 5CQA, CQAI, di-CQA and tri-CQA are expressed as 3-CQA. QTS is expressed as Q-3-R. NGC is expressed as NG. Abbreviations: CHI, caffeic acid-hexose isomer
(I); CHII caffeic acid-hexose (II); 3-CQA, 3-caffeoylquinic acid; 5-CQA, 5-caffeoylquinic acid; CQAI, caffeoylquinic acid isomer; QTS, quercetin-trisaccharide; Q3R, quercetin-3-
rutinoside; di-CQA, dicaffeoylquinic acid; tri-CQA, tricaffeoylquinic acid; NGC, naringenin chalcone; NG, naringenin.
Table 5Lycopene and b-carotene content in 12 cherry tomato fruits.a
Tomato sample Lycopene b-Carotene
Black Kiss 20 54.20 � 0.94 3.75 � 0.07
Totori Gold tr 5.4 � 1.7
Sugar Yellow nd 1.63 � 0.02
Saeng Green Bichuiball nd 1.25 � 0.01
Saeng Green Chorok nd 0.96 � 0.04
Gold Minichal 41.7 � 1.0 1.94 � 0.01
Gold Sugar 2.82 � 0.09 7.03 � 0.60
Vitamin 37.0 � 5.3 2.51 � 0.00
Sugar Cherry 64.4 � 4.4 2.94 � 0.05
Jico Red 36.40 � 0.65 2.09 � 0.01
Sugar Red 76.7 � 1.2 2.53 � 0.03
Red Vienna 26.06 � 0.02 1.75 � 0.01
a Values are averages of duplicate analyses (n = 2) of a single powder (mg/100 g
dry wt) � SD; tr, trace; nd, not detected. The LOD of lycopene; 1.13 ng and carotene;
1.99 ng.
Table 7Antioxidant activity measured by ABTS and FRAP in 12 cherry tomato extracts.a
S.H. Choi et al. / Journal of Food Composition and Analysis xxx (2014) xxx–xxx 9
G Model
YJFCA 2408 1–13
samples contained the highest amount of b-carotene, followed bythe black cherry tomato sample. The green cherry tomatoescontained the lowest levels.
3.2. Bioactivities
3.2.1. Antioxidant activities of six pure tomato compounds
Table 6 shows the quantitative antioxidative effects in terms ofIC50 values of the six commercially available pure tomatocompounds determined by two methods (ABTS and FRAP). TheABTS IC50 values (in mM) ranged from 3.58 (highest activity)for lycopene to 9.57 for quercetin-3-rutinoside (lowest activity) ora 2.7-fold variation. The FRAP IC50 values (in mM Fe2+/mg) ranged
Table 6Antioxidant activity (IC50), measured using ABTS and FRAP methods, of four tomato
phenolic and two pigmented compounds.a
Compound ABTS value IC50
(mg/mL)
FRAP value
IC50 (mmol Fe2+/mg)
3-Caffeoylquinic acid 7.97 � 0.11 6.3 � 1.5
Naringenin 9.01 � 0.19 0.15 � 0.031
Naringenin chalcone 4.72 � 0.09 1.66 � 0.131
Quercetin-3-rutinoside 9.57 � 0.17 3.91 � 0.12
Lycopene 3.58 � 0.631 0.33 � 0.011
b-Carotene 4.18 � 0.551 0.17 � 0.031
Values within columns sharing a common superscript number are not significantly
different (p < 0.05).a Values are average � SD (n = 3).
Please cite this article in press as: Choi, S.H., et al., Protein, freeantioxidative and cancer cell inhibitory effects of 12 greenhouse-gr(2014), http://dx.doi.org/10.1016/j.jfca.2014.03.005
from 0.15 (naringenin) and 0.17 (b-carotene) to 6.3 (3-caffeoylqui-nic acid).
The relative values for the six compounds determined by theFRAP method seem quite different from those determined by theABTS assay. Statistical analysis showed that the results from thetwo methods did not correlate. These results imply that the twomethods measure different antioxidative effects.
3.2.2. Antioxidative effects of cherry tomato extracts
Table 7 shows that ABTS IC50 values for 12 cherry tomatopowders ranged from 94.0 mg/mL for the Saeng Green Bichuiballsample to 379.5 mg/mL for the Sugar Yellow sample. The corre-sponding range of the FRAP IC50 values (in mmol Fe2+/g) was muchnarrower, ranging from 19.5 (Saeng Green Chorok) to 32.4 (TotoriGold). These FRAP and the ABTS results for the extracts were also notstatistically correlated. The FRAP was correlated with tomato extractcontent of tri-caffeoylquinic acid (r = 0.828) and di-caffeoylquinicacid (r = 0.881). These results show that (a) the trends in theantioxidative effects determined by the two methods are notparallel; and (b) excluding the Saeng Green Bichuiball sample, therange of the ABTS IC50 values for the other 11 samples is quite narrow.
3.2.3. Cell-growth-inhibiting effects of pure tomato compounds
Table 8 shows the inhibitory effects of three concentrations ofeach test substance evaluated by the MTT cell viability assay.Concentration dependence was determined by testing significantlydifferent results between doses by ANOVA. IC50 values werecalculated for samples displaying dose–response inhibition and for
Tomato sample ABTs value, IC50 (mg/mL) FRAP value (mmol Fe2+/g)
Black Kiss 20 310.9 � 2.91 24.29 � 0.111,2
Totori Gold 335.3 � 4.22 32.38 � 0.123
Sugar Yellow 379.5 � 5.4 28.11 � 0.284
Saeng Green Bichuiball 94.0 � 2.1 23.15 � 0.571
Saeng Green Chorok 323.4 � 1.8 19.5 � 1.75
Gold Minichal 313.7 � 4.71 32.16 � 0.523
Gold Sugar 347 � 33 22.82 � 0.761,5
Vitamin 358.7 � 1.44 25.61 � 0.551,2
Sugar Cherry 353.6 � 2.43,4 24.16 � 0.871,2
Jico Red 333.7 � 2.72 30.6 � 3.73,4
Sugar Red 334.6 � 2.52 27.76 � 0.842,4
Red Vienna 356.05 � 0.874 27.52 � 0.452,4
Values within columns sharing a common superscript number are not significantly
different (p < 0.05).a Values are averages of triplicate analyses (n = 3) of a single tomato powder � SD.
amino acid, phenolic, b-carotene, and lycopene content, andown commercial cherry tomato varieties. J. Food Compos. Anal.

Table 8Inhibitory effects of four tomato phenolics and two pigments against normal liver (Chang), normal lung (Hel299), lung cancer cell (A549), liver cancer (HepG2), and cervical carcinoma (HeLa) cells determined by the MTT assay.a
Growth inhibition (%) IC50
Compounds Conc.
(mg/mL)
Chang Hel299 A549 HepG2 HeLa Chang Hel299 A549 HepG2 HeLa
3-Caffeoylquinic
acid
10 �7.8�5.3 7.63�0.311 �12.1�4.91 �8.1�4.91 0.09�0.631 SG NDR NDR Weak Weak
50 �13.38� 0.601 8.74�0.191 �15.5�5.01 �5.7�4.51 0.87�0.451
100 �15.6�2.61 8.4�1.11 �16.6�3.61 6.2�2.0 4.30�0.59
Naringenin 10 �17.0�6.6 0.3�5.7 �2.3�1.4 14.8�3.4 5.4�1.6 SG Weak SG Weak 94.1�5.9
50 �44.1�3.22 10.8�1.22 �14.8�1.7 21.6�1.02 39.5�5.0
100 �36.0�1.12 10.5�1.12 �34.5�3.2 20.80� 0.902 51.0�4.2
Naringenin
chalcone
10 �30.2�2.53 3.6�2.43 �15.05�0.533 12.11� 0.76 �2.95�0.35 SG NDR NDR Weak 84.2�3.3
50 �47.9�3.24 7.91�0.543 �30.3�8.03 17.5�3.43 33.44�0.92
100 �38.4�5.93,4 8.4�3.23 �21�113 20.4�1.33 59.4�1.9
Quercetin-3-
rutinoside
10 �4.9�1.9 6.5�3.44 19.4�3.54 13.7�1.14 21.2�4.94 Weak NDR Weak Weak Weak
50 5.7�2.95 6.7�2.84 19.4�2.54 12.5�1.44 25.0�2.24
100 8.0�3.05 8.46�0.584 32.9�3.0 20.49� 0.87 36.3�2.6
Lycopene 10 34.8�1.7 45.0�4.9 54.82�0.60 38.8�1.3 64.1�2.4 30.84�0.351 21.0�3.4 9.12�0.442 27.79� 0.311 7.8�1.22
50 67.0�1.7 77.9�1.3 63.4�1.5 64.78� 0.65 74.69�0.11
100 86.7�1.1 89.19�0.09 66.5�1.1 88.82� 0.83 89.31�0.38
b-Carotene 10 �2.8�3.56 �6�165 7.0�3.25 �0.2�2.1 14.2�2.65 NDR NDR NDR >100 NDR
50 �1.2�1.16 �1.9�5.75 7.1�1.85 2.61� 0.57 17.3�2.35
100 1.2�1.46 15.1�3.45 7.6�2.35 6.27� 0.20 19.09�0.695
Values within a column sharing a superscript number are not significantly different (p<0.05). Values within a row sharing a superscript number are not significantly different (p<0.05).a Listed values are expressed as average� SD (n = 3). NDR = no dose response, i.e. the inhibition of the cells by the three doses was not significantly different; SG = stimulated growth; Weak inhibition designated when 2 of the 3 doses were
not significantly different.
S.H.
Ch
oi
et a
l. /
Jou
rna
l o
f Fo
od
Co
mp
ositio
n a
nd
An
aly
sis xxx
(20
14
) xxx–
xxx1
0
G M
od
el
YJF
CA
24
08
1–
13
Ple
ase
cite th
is a
rticle in
pre
ss a
s: C
ho
i, S
.H.,
et
al.,
Pro
tein
, fre
e a
min
o a
cid,
ph
en
olic,
b-ca
rote
ne
, a
nd
lyco
pe
ne
con
ten
t, a
nd
an
tiox
ida
tive
an
d ca
nce
r ce
ll in
hib
itory
effe
cts o
f 1
2 g
ree
nh
ou
se-g
row
n co
mm
ercia
l ch
erry
tom
ato
va
rietie
s. J.
Foo
d C
om
po
s. A
na
l.(2
01
4),
http
://dx
.do
i.org
/10
.10
16
/j.jfca.2
01
4.0
3.0
05
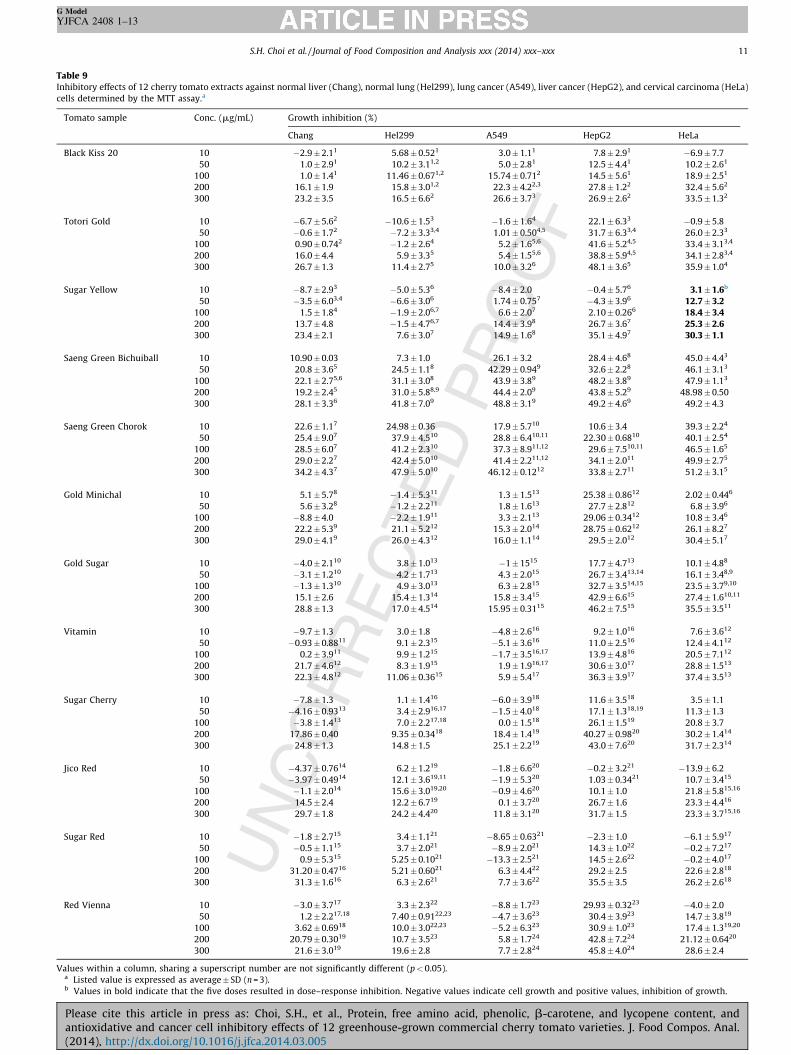
Table 9Inhibitory effects of 12 cherry tomato extracts against normal liver (Chang), normal lung (Hel299), lung cancer (A549), liver cancer (HepG2), and cervical carcinoma (HeLa)
cells determined by the MTT assay.a
Tomato sample Conc. (mg/mL) Growth inhibition (%)
Chang Hel299 A549 HepG2 HeLa
Black Kiss 20 10 �2.9 � 2.11 5.68 � 0.521 3.0 � 1.11 7.8 � 2.91 �6.9 � 7.7
50 1.0 � 2.91 10.2 � 3.11,2 5.0 � 2.81 12.5 � 4.41 10.2 � 2.61
100 1.0 � 1.41 11.46 � 0.671,2 15.74 � 0.712 14.5 � 5.61 18.9 � 2.51
200 16.1 � 1.9 15.8 � 3.01,2 22.3 � 4.22,3 27.8 � 1.22 32.4 � 5.62
300 23.2 � 3.5 16.5 � 6.62 26.6 � 3.73 26.9 � 2.62 33.5 � 1.32
Totori Gold 10 �6.7 � 5.62 �10.6 � 1.53 �1.6 � 1.64 22.1 � 6.33 �0.9 � 5.8
50 �0.6 � 1.72 �7.2 � 3.33,4 1.01 � 0.504,5 31.7 � 6.33,4 26.0 � 2.33
100 0.90 � 0.742 �1.2 � 2.64 5.2 � 1.65,6 41.6 � 5.24,5 33.4 � 3.13,4
200 16.0 � 4.4 5.9 � 3.35 5.4 � 1.55,6 38.8 � 5.94,5 34.1 � 2.83,4
300 26.7 � 1.3 11.4 � 2.75 10.0 � 3.26 48.1 � 3.65 35.9 � 1.04
Sugar Yellow 10 �8.7 � 2.93 �5.0 � 5.36 �8.4 � 2.0 �0.4 � 5.76 3.1 � 1.6b
50 �3.5 � 6.03,4 �6.6 � 3.06 1.74 � 0.757 �4.3 � 3.96 12.7 � 3.2100 1.5 � 1.84 �1.9 � 2.06,7 6.6 � 2.07 2.10 � 0.266 18.4 � 3.4200 13.7 � 4.8 �1.5 � 4.76,7 14.4 � 3.98 26.7 � 3.67 25.3 � 2.6300 23.4 � 2.1 7.6 � 3.07 14.9 � 1.68 35.1 � 4.97 30.3 � 1.1
Saeng Green Bichuiball 10 10.90 � 0.03 7.3 � 1.0 26.1 � 3.2 28.4 � 4.68 45.0 � 4.43
50 20.8 � 3.65 24.5 � 1.18 42.29 � 0.949 32.6 � 2.28 46.1 � 3.13
100 22.1 � 2.75,6 31.1 � 3.08 43.9 � 3.89 48.2 � 3.89 47.9 � 1.13
200 19.2 � 2.45 31.0 � 5.88,9 44.4 � 2.09 43.8 � 5.29 48.98 � 0.50
300 28.1 � 3.36 41.8 � 7.09 48.8 � 3.19 49.2 � 4.69 49.2 � 4.3
Saeng Green Chorok 10 22.6 � 1.17 24.98 � 0.36 17.9 � 5.710 10.6 � 3.4 39.3 � 2.24
50 25.4 � 9.07 37.9 � 4.510 28.8 � 6.410,11 22.30 � 0.6810 40.1 � 2.54
100 28.5 � 6.07 41.2 � 2.310 37.3 � 8.911,12 29.6 � 7.510,11 46.5 � 1.65
200 29.0 � 2.27 42.4 � 5.010 41.4 � 2.211,12 34.1 � 2.011 49.9 � 2.75
300 34.2 � 4.37 47.9 � 5.010 46.12 � 0.1212 33.8 � 2.711 51.2 � 3.15
Gold Minichal 10 5.1 � 5.78 �1.4 � 5.311 1.3 � 1.513 25.38 � 0.8612 2.02 � 0.446
50 5.6 � 3.28 �1.2 � 2.211 1.8 � 1.613 27.7 � 2.812 6.8 � 3.96
100 �8.8 � 4.0 �2.2 � 1.911 3.3 � 2.113 29.06 � 0.3412 10.8 � 3.46
200 22.2 � 5.39 21.1 � 5.212 15.3 � 2.014 28.75 � 0.6212 26.1 � 8.27
300 29.0 � 4.19 26.0 � 4.312 16.0 � 1.114 29.5 � 2.012 30.4 � 5.17
Gold Sugar 10 �4.0 � 2.110 3.8 � 1.013 �1 � 1515 17.7 � 4.713 10.1 � 4.88
50 �3.1 � 1.210 4.2 � 1.713 4.3 � 2.015 26.7 � 3.413,14 16.1 � 3.48,9
100 �1.3 � 1.310 4.9 � 3.013 6.3 � 2.815 32.7 � 3.514,15 23.5 � 3.79,10
200 15.1 � 2.6 15.4 � 1.314 15.8 � 3.415 42.9 � 6.615 27.4 � 1.610,11
300 28.8 � 1.3 17.0 � 4.514 15.95 � 0.3115 46.2 � 7.515 35.5 � 3.511
Vitamin 10 �9.7 � 1.3 3.0 � 1.8 �4.8 � 2.616 9.2 � 1.016 7.6 � 3.612
50 �0.93 � 0.8811 9.1 � 2.315 �5.1 � 3.616 11.0 � 2.516 12.4 � 4.112
100 0.2 � 3.911 9.9 � 1.215 �1.7 � 3.516,17 13.9 � 4.816 20.5 � 7.112
200 21.7 � 4.612 8.3 � 1.915 1.9 � 1.916,17 30.6 � 3.017 28.8 � 1.513
300 22.3 � 4.812 11.06 � 0.3615 5.9 � 5.417 36.3 � 3.917 37.4 � 3.513
Sugar Cherry 10 �7.8 � 1.3 1.1 � 1.416 �6.0 � 3.918 11.6 � 3.518 3.5 � 1.1
50 �4.16 � 0.9313 3.4 � 2.916,17 �1.5 � 4.018 17.1 � 1.318,19 11.3 � 1.3
100 �3.8 � 1.413 7.0 � 2.217,18 0.0 � 1.518 26.1 � 1.519 20.8 � 3.7
200 17.86 � 0.40 9.35 � 0.3418 18.4 � 1.419 40.27 � 0.9820 30.2 � 1.414
300 24.8 � 1.3 14.8 � 1.5 25.1 � 2.219 43.0 � 7.620 31.7 � 2.314
Jico Red 10 �4.37 � 0.7614 6.2 � 1.219 �1.8 � 6.620 �0.2 � 3.221 �13.9 � 6.2
50 �3.97 � 0.4914 12.1 � 3.619,11 �1.9 � 5.320 1.03 � 0.3421 10.7 � 3.415
100 �1.1 � 2.014 15.6 � 3.019,20 �0.9 � 4.620 10.1 � 1.0 21.8 � 5.815,16
200 14.5 � 2.4 12.2 � 6.719 0.1 � 3.720 26.7 � 1.6 23.3 � 4.416
300 29.7 � 1.8 24.2 � 4.420 11.8 � 3.120 31.7 � 1.5 23.3 � 3.715,16
Sugar Red 10 �1.8 � 2.715 3.4 � 1.121 �8.65 � 0.6321 �2.3 � 1.0 �6.1 � 5.917
50 �0.5 � 1.115 3.7 � 2.021 �8.9 � 2.021 14.3 � 1.022 �0.2 � 7.217
100 0.9 � 5.315 5.25 � 0.1021 �13.3 � 2.521 14.5 � 2.622 �0.2 � 4.017
200 31.20 � 0.4716 5.21 � 0.6021 6.3 � 4.422 29.2 � 2.5 22.6 � 2.818
300 31.3 � 1.616 6.3 � 2.621 7.7 � 3.622 35.5 � 3.5 26.2 � 2.618
Red Vienna 10 �3.0 � 3.717 3.3 � 2.322 �8.8 � 1.723 29.93 � 0.3223 �4.0 � 2.0
50 1.2 � 2.217,18 7.40 � 0.9122,23 �4.7 � 3.623 30.4 � 3.923 14.7 � 3.819
100 3.62 � 0.6918 10.0 � 3.022,23 �5.2 � 6.323 30.9 � 1.023 17.4 � 1.319,20
200 20.79 � 0.3019 10.7 � 3.523 5.8 � 1.724 42.8 � 7.224 21.12 � 0.6420
300 21.6 � 3.019 19.6 � 2.8 7.7 � 2.824 45.8 � 4.024 28.6 � 2.4
Values within a column, sharing a superscript number are not significantly different (p < 0.05).a Listed value is expressed as average � SD (n = 3).b Values in bold indicate that the five doses resulted in dose–response inhibition. Negative values indicate cell growth and positive values, inhibition of growth.
S.H. Choi et al. / Journal of Food Composition and Analysis xxx (2014) xxx–xxx 11
G Model
YJFCA 2408 1–13
Please cite this article in press as: Choi, S.H., et al., Protein, free amino acid, phenolic, b-carotene, and lycopene content, andantioxidative and cancer cell inhibitory effects of 12 greenhouse-grown commercial cherry tomato varieties. J. Food Compos. Anal.(2014), http://dx.doi.org/10.1016/j.jfca.2014.03.005

496 w497 ly498 ly499 co500 su501 w502 lin503
504 ab505 ca506 b-507 qu508 so
509 3.
510
511 th512 m513 to514 (3515 ex516 at517 gr518 He519 ce520 th521 ce522 lu523
524 in525 tio526 co527 bl
528 4.
529
530 co531 pr532 pr533 8.534 an535 pr536 in537 fa538 to539 Se540 sa541 ca542 ra543
544 du545 bi546 of547 th548 th549 un550 L-A551 fre552 w553 ac554 ca555 ex556 ca557
558 go
559560561562563564565
566
567568
569
570571572573574575576577578579580581582583584585586587588589590591592593594595596597598599600601602603604605606607608609610611612613614615616617618619620621622623624625626627628629630631632633634635
S.H. Choi et al. / Journal of Food Composition and Analysis xxx (2014) xxx–xxx12
G Model
YJFCA 2408 1–13
hich the highest dose inhibited at least 50% of the cells. Onlycopene inhibited all the cell lines. Additionally, the IC50 values forcopene were lower (activity was higher) than any of the othermpounds. The HeLa cervical carcinoma cell line was the mostsceptible to inhibition by the pure compounds, although thereas no dose-response by b-carotene. The HepG2 normal liver celle was mildly inhibited by all the compounds.As noted in the Methods section, there is some uncertainty
out the values for the hydrophobic compounds lycopene androtene in this aqueous system. Indeed, the reproducibility of thecarotene sample is poor, possibly due to this effect; however, it isite good for lycopene, indicating that lycopene may be betterlubilized.
2.4. Cell-growth-inhibiting effects of cherry tomato extracts
Table 9 shows the results of the cell-growth-inhibiting effects ofe 12 tomato extracts tested against the same cell linesentioned above. Although all cherry tomato extracts inhibited some extent all cancer cell lines at the highest concentration00 mg/mL), IC50 values were not calculated because none of thetracts caused dose–response inhibition of at least 50% of the cells
the doses tested. For the 300 mg/mL dose of each extract, theeatest inhibition was seen either with the HeLa cervical or thepG2 liver cancer cell lines, depending on sample. For the liver
lls, the extracts were considerably more active against the canceran the normal cells. However, this was not the case for the lunglls. There was little difference in the effect of the extracts on theng cancer compared to the normal lung cells.
These results indicate variable and unpredictable cellularhibitory effects of the tomato extracts based on their composi-n. Thus, only the effect of the total tomato extract should bensidered, because no one component would likely be responsi-e for the observed activity of the extracts.
Conclusions
Tomato extracts varied considerably in their levels of measuredmponents. Variation in the protein content and in the amino acidofile can affect the nutritious value of the tomato. The crudeotein content of the cherry tomato powders, which ranged from3 to 14.2 g/100 g dry wt., is similar to that of cereals such as riced wheat, suggesting that dry tomato powders with the highestotein content might contribute to dietary protein, and highlight-g the need to evaluate their nutritional quality. But despite thect that Trp is listed as being relatively abundant in cherrymatoes (U.S. Department of Agriculture: Agricultural Researchrvice, 2012), free Trp was not found in any of our cherry tomatomples, thus affecting the quality of the protein. Phenolic androtenoid compounds also varied many-fold, suggesting there is ange of healthfulness among different varieties.
The amino acid metabolite GABA, which has garnered attentione to its role as a neurotransmitter as well as other possible
ological functions (Watanabe et al., 2002), is the most prevalent the metabolites in the 12 cherry tomato cultivars, suggestingat these tomatoes are a good source of GABA. However, as withe other metabolites, the effect of dietary intake is still largelyknown. The concentration of the acrylamide precursor freesp was relatively low in most samples, suggesting that addingsh or processed cherry tomatoes to other food before ‘cooking’
ill not significantly increase the heat-induced formation of toxicrylamide. Cancer cells, especially the cervical and the liverrcinoma cells, were susceptible to inhibition by all the tomatotracts. Their preventive and therapeutic efficacy against humanncers merits study.In conclusion, because both genetic and environmental factors
vern the biosynthesis of bioactive tomato compounds (Gautier
Please cite this article in press as: Choi, S.H., et al., Protein, freantioxidative and cancer cell inhibitory effects of 12 greenhouse-g(2014), http://dx.doi.org/10.1016/j.jfca.2014.03.005
et al., 2008; Rossi et al., 2008; Juroszek et al., 2009; Prudent et al.,2009,2010; Carli et al., 2011; Barbagallo et al., 2013; Hallmannet al., 2013; Mazzucato et al., 2013; Iglesias et al., 2014), the largedifferences in composition and bioactivities observed in thepresent study among the 12 cherry tomato samples grown underidentical environmental conditions appear to be governed bygenetic factors.
Uncited references Q2
U.S. Department of Agriculture: Agricultural Research Service(2011).
References
Adato, A., Mandel, T., Mintz-Oron, S., Venger, I., Levy, D., Yativ, M., Domınguez, E.,Wang, Z., De Vos, R.C.H., Jetter, R., Schreiber, L., Heredia, A., Rogachev, I., Aharoni,A., 2009. Fruit-surface flavonoid accumulation in tomato is controlled by aSLMYB12-regulated transcriptional network. PLoS Genetics 5, e1000777, http://dx.doi.org/10.1371/journal.pgen.1000777.
Akihiro, T., Koike, S., Tani, R., Tominaga, T., Watanabe, S., Iijima, Y., Aoki, K., Shibata,D., Ashihara, H., Matsukura, C., Akama, K., Fujimura, T., Ezura, H., 2008. Bio-chemical mechanism on GABA accumulation during fruit development intomato. Plant and Cell Physiology 49, 1378–1389.
Alley, M.C., Scudiero, D.A., Monks, A., Hursey, M.L., Czerwinski, M.J., Fine, D.L.,Abbott, B.J., Mayo, J.G., Shoemaker, R.H., Boyd, M.R., 1988. Feasibility of drugscreening with panels of human tumor cell lines using a microculture tetrazo-lium assay. Cancer Research 48, 589–601.
Ballester, A.-R., Molthoff, J., de Vos, R., Hekkert, B.L., Orzaez, D., Fernandez-Moreno,J.-P., Tripodi, P., Grandillo, S., Martin, C., Heldens, J., Ykema, M., Granell, A., Bovy,A., 2010. Biochemical and molecular analysis of pink tomatoes: deregulatedexpression of the gene encoding transcription factor SLMYB12 leads to pinktomato fruit color. Plant Physiology 152, 71–84.
Barbagallo, R.N., Di Silvestro, I., Patane, C., 2013. Yield, physicochemical traits,antioxidant pattern, polyphenol oxidase activity and total visual quality offield-grown processing tomato cv. Brigade as affected by water stress inMediterranean climate. Journal of the Science of Food and Agriculture 93,1449–1457.
Barry, C.S., Pandey, P., 2009. A survey of cultivated heirloom tomato varietiesidentifies four new mutant alleles at the green-flesh locus. Molecular Breeding24, 269–276.
Beelders, T., Sigge, G.O., Joubert, E., De Beer, D., De Villiers, A., 2012. Kineticoptimisation of the reversed phase liquid chromatographic separation of rooi-bos tea (Aspalathus linearis) phenolics on conventional high performance liquidchromatographic instrumentation. Journal of Chromatography A 1219, 128–139.
Benzie, I.F.F., Strain, J.J., 1996. The ferric reducing ability of plasma (FRAP) as ameasure of ‘antioxidant power’: the FRAP assay. Analytical Biochemistry 239,70–76.
Boggio, S.B., Palatnik, J.F., Heldt, H.W., Valle, E.M., 2000. Changes in amino acidcomposition and nitrogen metabolizing enzymes in ripening fruits of Lycoper-sicon esculentum Mill. Plant Science 159, 125–133.
Bouche, N., Fromm, H., 2004. GABA in plants: just a metabolite? Trends in PlantScience 9, 110–115.
Carli, P., Barone, A., Fogliano, V., Frusciante, L., Ercolano, M.R., 2011. Dissection ofgenetic and environmental factors involved in tomato organoleptic quality.BMC Plant Biology 11.
Choi, S.-H., Ahn, J.-B., Kozukue, N., Levin, C.E., Friedman, M., 2011a. Distribution offree amino acids, flavonoids, total phenolics, and antioxidative activities ofjujube (Ziziphus jujuba) fruits and seeds harvested from plants grown in Korea.Journal of Agricultural and Food Chemistry 59, 6594–6604.
Choi, S.-H., Kim, H.-R., Kim, H.-J., Lee, I.-S., Kozukue, N., Levin, C.E., Friedman, M.,2011b. Free amino acid and phenolic contents and antioxidative and cancercell-inhibiting activities of extracts of 11 greenhouse-grown tomato varietiesand 13 tomato-based foods. Journal of Agricultural and Food Chemistry 59,12801–12814.
Choi, S.-H., Lee, S.-H., Kim, H.-J., Lee, I.-S., Nobuyuki, K., Levin, C.E., Friedman, M.,2010. Changes in free amino acid, phenolic, chlorophyll, carotenoid, and gly-coalkaloid contents in tomatoes during 11 stages of growth and inhibition ofcervical and lung human cancer cells by green tomato extracts. Journal ofAgricultural and Food Chemistry 58, 7547–7556.
Davies, J.N., Hobson, G.E., 1981. Constituents of tomato fruit – the influence ofenvironment, nutrition, and genotype. CRC Critical Reviews in Food Science andNutrition 15, 205–280.
Egea, I., Barsan, C., Bian, W., Purgatto, E., Latche, A., Chervin, C., Bouzayen, M., Pech,J.-C., 2010. Chromoplast differentiation: current status and perspectives. Plantand Cell Physiology 51, 1601–1611.
Ferreres, F., Sousa, C., Justin, M., Valentao, P., Andrade, P.B., Llorach, R., Rodrigues, A.,Seabra, R.M., Leitao, A., 2005. Characterisation of the phenolic profile of Boer-haavia diffusa L. by HPLC-PAD–MS/MS as a tool for quality control. Phytochem-ical Analysis 16, 451–458.
e amino acid, phenolic, b-carotene, and lycopene content, andrown commercial cherry tomato varieties. J. Food Compos. Anal.
636
637
638
639
640
641
642
643
644
645
646
647
648
649
650
651
652
653
654
655
656
657
658
659
660
661
662
663
664
665
666
667
668
669
670
671
672
673
674
675
676
677
678
679
680
681
682 Q3683
684
685
686
687
688689690691692693694695696697698699700701702703704705706707708709710711712713714715716717718719720721722723724725726727728729730731732733734735736737738739
S.H. Choi et al. / Journal of Food Composition and Analysis xxx (2014) xxx–xxx 13
G Model
YJFCA 2408 1–13
Friedman, M., 2002. Tomato glycoalkaloids: role in the plant and in the diet. Journalof Agricultural and Food Chemistry 50, 5751–5780.
Friedman, M., 2013. Anticarcinogenic, cardioprotective, and other health benefits oftomato compounds lycopene, a-tomatine, and tomatidine in pure form and infresh and processed tomatoes. Journal of Agricultural and Food Chemistry 61,9534–9550.
Friedman, M., Levin, C.E., 2008. Review of methods for the reduction of dietarycontent and toxicity of acrylamide. Journal of Agricultural and Food Chemistry56, 6113–6140.
Frusciante, L., Carli, P., Ercolano, M.R., Pernice, R., Di Matteo, A., Fogliano, V.,Pellegrini, N., 2007. Antioxidant nutritional quality of tomato. Molecular Nu-trition & Food Research 51, 609–617.
Fuke, S., Konosu, S., 1991. Taste-active components in some foods: a review ofJapanese research. Physiology and Behavior 49, 863–868.
Gautier, H., Diakou-Verdin, V., Benard, C., Reich, M., Buret, M., Bourgaud, F., Poessel,J.L., Caris-Veyrat, C., Genard, M., 2008. How does tomato quality (sugar, acid,and nutritional quality) vary with ripening stage, temperature, and irradiance?Journal of Agricultural and Food Chemistry 56, 1241–1250.
Gonzali, S., Mazzucato, A., Perata, P., 2009. Purple as a tomato: towards highanthocyanin tomatoes. Trends in Plant Science 14, 237–241.
Hallmann, E., Lipowski, J., Marszalek, K., Rembialkowska, E., 2013. The seasonalvariation in bioactive compounds content in juice from organic and non-organictomatoes. Plant Foods for Human Nutrition 68, 171–176.
Iglesias, M.J., Lopez, J.G., Collados Lujan, J.F., Ortiz, F.L., Pereznieto, H.B., Toresano, F.,Camacho, F., 2014. Effect of genetic and phenotypic factors on the compositionof commercial marmande type tomatoes studied through HRMAS NMR spec-troscopy. Food Chemistry 142, 1–11.
Institute of Medicine, 2002. Protein and Amino Acids. National Academy of Sciences,Washington, DC, pp. 589–768.
Jones, C.M., Mes, P., Myers, J.R., 2003. Characterization and inheritance of theanthocyanin fruit (Aft) tomato. Journal of Heredity 94, 449–456.
Juroszek, P., Lumpkin, H.M., Yang, R.-Y., Ledesma, D.R., Ma, C.-H., 2009. Fruit qualityand bioactive compounds with antioxidant activity of tomatoes grown on-farm: comparison of organic and conventional management systems. Journal ofAgricultural and Food Chemistry 57, 1188–1194.
Kavitha, P., Shivashankara, K.S., Rao, V.K., Sadashiva, A.T., Ravishankar, K.V., Sathish,G.J., 2014. Genotypic variability for antioxidant and quality parameters amongtomato cultivars, hybrids, cherry tomatoes and wild species. Journal of theScience of Food and Agriculture 94, 993–999.
Krause, M., Galensa, R., 1992. Determination of naringenin and naringenin-chalconein tomato skins by reversed phase HPLC after solid phase extraction. ZeitschriftFur Lebensmittel-Untersuchung und -Forschung 194, 29–32.
Lenucci, M.S., Cadinu, D., Taurino, M., Piro, G., Dalessandro, G., 2006. Antioxidantcomposition in cherry and high-pigment tomato cultivars. Journal of Agricul-tural and Food Chemistry 54, 2606–2613.
Mazzucato, A., Willems, D., Bernini, R., Picarella, M.E., Santangelo, E., Ruiu, F., Tilesi,F., Soressi, G.P., 2013. Novel phenotypes related to the breeding of purple-fruited tomatoes and effect of peel extracts on human cancer cell proliferation.Plant Physiology and Biochemistry.
Mercer, I.P., Dodds, S.J., Smith, D.L., 1989. In: Friedman, M. (Ed.), Dispensable,Indispensable, and Conditionally Indispensable Amino Acid Ratios in the Diet.CRC, Boca Raton, LA, pp. 1–13.
Please cite this article in press as: Choi, S.H., et al., Protein, freeantioxidative and cancer cell inhibitory effects of 12 greenhouse-gr(2014), http://dx.doi.org/10.1016/j.jfca.2014.03.005
Mitchell, A.E., Hong, Y.J., Koh, E., Barrett, D.M., Bryant, D.E., Denison, R.F., Kaffka, S.,2007. Ten-year comparison of the influence of organic and conventional cropmanagement practices on the content of flavonoids in tomatoes. Journal ofAgricultural and Food Chemistry 55, 6154–6159.
Nagata, M., Yamashita, I., 1992. Simple method simultaneous determination ofchlorophyll and carotenoids in tomato fruit. Nippon Shokuhin Kogyo Gakkaishi39, 925–928.
Ozga, J.A., Saeed, A., Wismer, W., Reinecke, D.M., 2007. Characterization of cyanidin-and quercetin-derived flavonoids and other phenolics in mature saskatoonfruits (Amelanchier alnifolia Nutt.). Journal of Agricultural and Food Chemistry55, 10414–10424.
Paran, I., van der Knaap, E., 2007. Genetic and molecular regulation of fruit and plantdomestication traits in tomato and pepper. Journal of Experimental Botany 58,3841–3852.
Prudent, M., Bertin, N., Genard, M., Munos, S., Rolland, S., Garcia, V., Petit, J., Baldet,P., Rothan, C., Causse, M., 2010. Genotype-dependent response to carbonavailability in growing tomato fruit. Plant, Cell and Environment 33, 1186–1204.
Prudent, M., Causse, M., Genard, M., Tripodi, P., Grandillo, S., Bertin, N., 2009. Geneticand physiological analysis of tomato fruit weight and composition: influence ofcarbon availability on QTL detection. Journal of Experimental Botany 60, 923–937.
Re, R., Pellegrini, N., Proteggente, A., Pannala, A., Yang, M., Rice-Evans, C., 1999.Antioxidant activity applying an improved ABTS radical cation decolorizationassay. Free Radical Biology and Medicine 26, 1231–1237.
Rossi, F., Godani, F., Bertuzzi, T., Trevisan, M., Ferrari, F., Gatti, S., 2008. Health-promoting substances and heavy metal content in tomatoes grown withdifferent farming techniques. European Journal of Nutrition 47, 266–272.
Saito, T., Matsukura, C., Sugiyama, M., Watahiki, A., Ohshima, I., Iijima, Y., Konishi, C.,Fujii, T., Inai, S., Fukuda, N., Nishimura, S., Ezura, H., 2008. Screening for g-aminobutyric acid (GABA)-rich tomato varieties. Journal of the Japanese Societyfor Horticultural Science 77, 242–250.
Sanchez-Rodrıguez, E., Ruiz, J.M., Ferreres, F., Moreno, D.A., 2012. Phenolic profilesof cherry tomatoes as influenced by hydric stress and rootstock technique. FoodChemistry 134, 775–782.
Shelp, B.J., Bown, A.W., McLean, M.D., 1999. Metabolism and functions of gamma-aminobutyric acid. Trends in Plant Science 4, 446–452.
Slimestad, R., Verheul, M., 2011. Properties of chalconaringenin and rutin isolatedfrom cherry tomatoes. Journal of Agricultural and Food Chemistry 59, 3180–3185.
Sorrequieta, A., Ferraro, G., Boggio, S.B., Valle, E.M., 2010. Free amino acid produc-tion during tomato fruit ripening: a focus on L-glutamate. Amino Acids 38,1523–1532.
U.S. Department of Agriculture: Agricultural Research Service, 2011. 03/07/2012.USDA Database for the Flavonoid Content of Selected Foods, Release 3. Re-trieved from http://www.ars.usda.gov/nutrientdata (25.04.13).
U.S. Department of Agriculture: Agricultural Research Service, 2012. 03/07/2012.USDA National Nutrient Database for Standard Reference, Release 25. Retrievedfrom http://www.ars.usda.gov/ba/bhnrc/ndl (25.04.13).
Watanabe, M., Maemura, K., Kanbara, K., Tamayama, T., Hayasaki, H., 2002. GABAand GABA receptors in the central nervous system and other organs. Interna-tional Review of Cytology 213, 1–47.
amino acid, phenolic, b-carotene, and lycopene content, andown commercial cherry tomato varieties. J. Food Compos. Anal.