PROCESSES IN BIOLOGICAL VISION - The Complete Neural System
157
PROCESSES IN BIOLOGICAL VISION: including, ELECTROCHEMISTRY OF THE NEURON This material is excerpted from the full β-version of the text. The final printed version will be more concise due to further editing and economical constraints. A Table of Contents and an index are located at the end of this paper. James T. Fulton Vision Concepts [email protected] April 30, 2017 Copyright 2000 James T. Fulton
Transcript of PROCESSES IN BIOLOGICAL VISION - The Complete Neural System
PROCESSES INBIOLOGICAL VISION:including, ELECTROCHEMISTRYOF THE NEURONThis material is excerpted from the full β-version of the text. Thefinal printed version will be more concise due to further editing andeconomical constraints. A Table of Contents and an index are located at the end of this paper.
James T. FultonVision Concepts
April 30, 2017 Copyright 2000James T. Fulton
The Photoreceptor Cell 4- 1
1Released: April 30, 2017
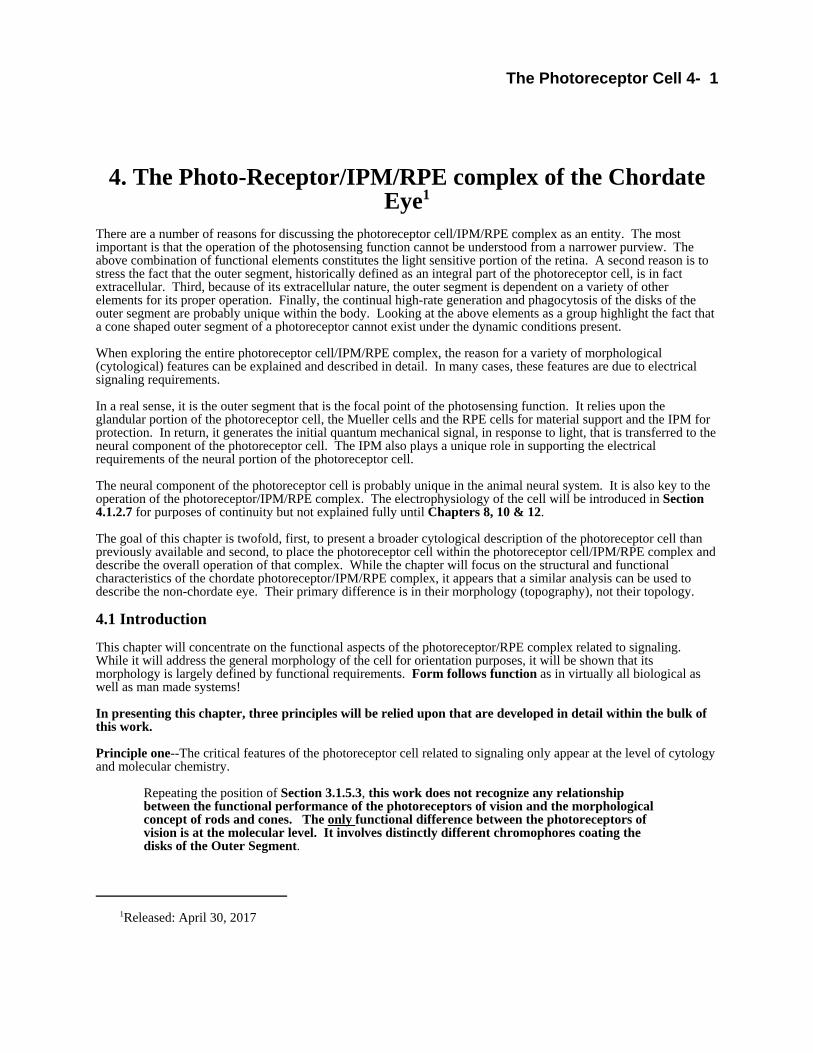
4. The Photo-Receptor/IPM/RPE complex of the ChordateEye1
There are a number of reasons for discussing the photoreceptor cell/IPM/RPE complex as an entity. The mostimportant is that the operation of the photosensing function cannot be understood from a narrower purview. Theabove combination of functional elements constitutes the light sensitive portion of the retina. A second reason is tostress the fact that the outer segment, historically defined as an integral part of the photoreceptor cell, is in factextracellular. Third, because of its extracellular nature, the outer segment is dependent on a variety of otherelements for its proper operation. Finally, the continual high-rate generation and phagocytosis of the disks of theouter segment are probably unique within the body. Looking at the above elements as a group highlight the fact thata cone shaped outer segment of a photoreceptor cannot exist under the dynamic conditions present.
When exploring the entire photoreceptor cell/IPM/RPE complex, the reason for a variety of morphological(cytological) features can be explained and described in detail. In many cases, these features are due to electricalsignaling requirements.
In a real sense, it is the outer segment that is the focal point of the photosensing function. It relies upon theglandular portion of the photoreceptor cell, the Mueller cells and the RPE cells for material support and the IPM forprotection. In return, it generates the initial quantum mechanical signal, in response to light, that is transferred to theneural component of the photoreceptor cell. The IPM also plays a unique role in supporting the electricalrequirements of the neural portion of the photoreceptor cell.
The neural component of the photoreceptor cell is probably unique in the animal neural system. It is also key to theoperation of the photoreceptor/IPM/RPE complex. The electrophysiology of the cell will be introduced in Section4.1.2.7 for purposes of continuity but not explained fully until Chapters 8, 10 & 12.
The goal of this chapter is twofold, first, to present a broader cytological description of the photoreceptor cell thanpreviously available and second, to place the photoreceptor cell within the photoreceptor cell/IPM/RPE complex anddescribe the overall operation of that complex. While the chapter will focus on the structural and functionalcharacteristics of the chordate photoreceptor/IPM/RPE complex, it appears that a similar analysis can be used todescribe the non-chordate eye. Their primary difference is in their morphology (topography), not their topology.
4.1 Introduction
This chapter will concentrate on the functional aspects of the photoreceptor/RPE complex related to signaling. While it will address the general morphology of the cell for orientation purposes, it will be shown that itsmorphology is largely defined by functional requirements. Form follows function as in virtually all biological aswell as man made systems!
In presenting this chapter, three principles will be relied upon that are developed in detail within the bulk ofthis work.
Principle one--The critical features of the photoreceptor cell related to signaling only appear at the level of cytologyand molecular chemistry.
Repeating the position of Section 3.1.5.3, this work does not recognize any relationshipbetween the functional performance of the photoreceptors of vision and the morphologicalconcept of rods and cones. The only functional difference between the photoreceptors ofvision is at the molecular level. It involves distinctly different chromophores coating thedisks of the Outer Segment.
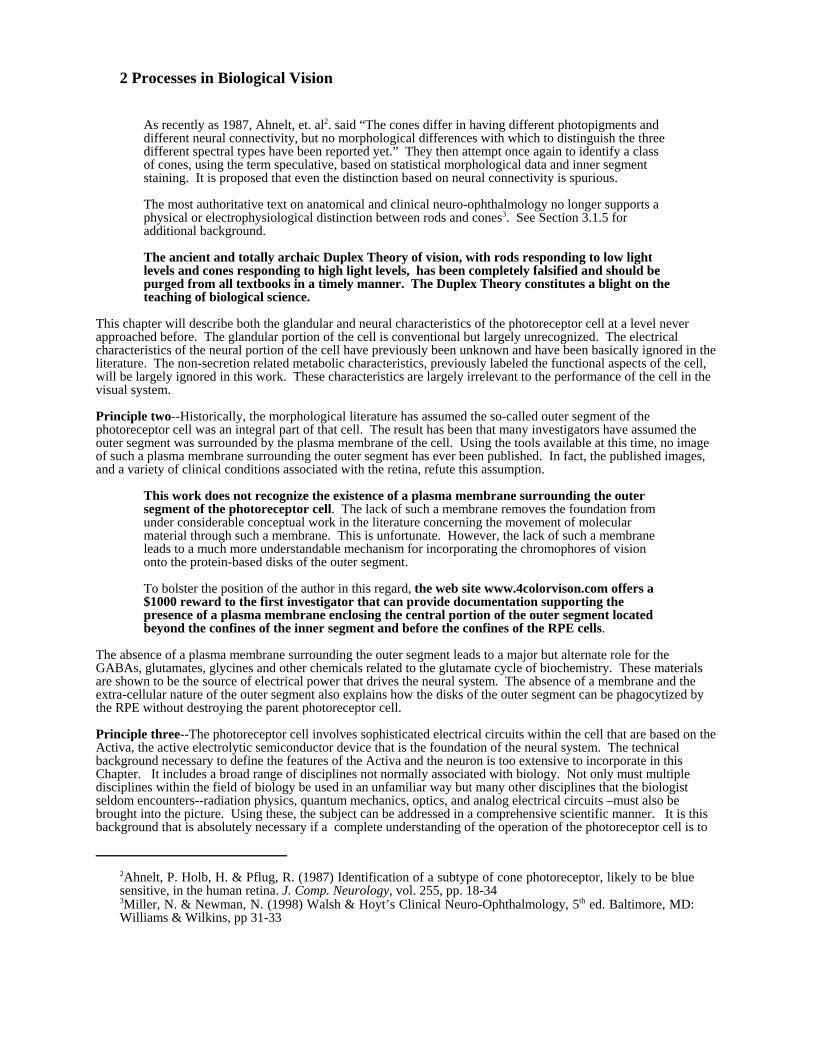
2 Processes in Biological Vision
2Ahnelt, P. Holb, H. & Pflug, R. (1987) Identification of a subtype of cone photoreceptor, likely to be bluesensitive, in the human retina. J. Comp. Neurology, vol. 255, pp. 18-343Miller, N. & Newman, N. (1998) Walsh & Hoyt’s Clinical Neuro-Ophthalmology, 5th ed. Baltimore, MD:Williams & Wilkins, pp 31-33
As recently as 1987, Ahnelt, et. al2. said “The cones differ in having different photopigments anddifferent neural connectivity, but no morphological differences with which to distinguish the threedifferent spectral types have been reported yet.” They then attempt once again to identify a classof cones, using the term speculative, based on statistical morphological data and inner segmentstaining. It is proposed that even the distinction based on neural connectivity is spurious.
The most authoritative text on anatomical and clinical neuro-ophthalmology no longer supports aphysical or electrophysiological distinction between rods and cones3. See Section 3.1.5 foradditional background.
The ancient and totally archaic Duplex Theory of vision, with rods responding to low lightlevels and cones responding to high light levels, has been completely falsified and should bepurged from all textbooks in a timely manner. The Duplex Theory constitutes a blight on theteaching of biological science.
This chapter will describe both the glandular and neural characteristics of the photoreceptor cell at a level neverapproached before. The glandular portion of the cell is conventional but largely unrecognized. The electricalcharacteristics of the neural portion of the cell have previously been unknown and have been basically ignored in theliterature. The non-secretion related metabolic characteristics, previously labeled the functional aspects of the cell,will be largely ignored in this work. These characteristics are largely irrelevant to the performance of the cell in thevisual system.
Principle two--Historically, the morphological literature has assumed the so-called outer segment of thephotoreceptor cell was an integral part of that cell. The result has been that many investigators have assumed theouter segment was surrounded by the plasma membrane of the cell. Using the tools available at this time, no imageof such a plasma membrane surrounding the outer segment has ever been published. In fact, the published images,and a variety of clinical conditions associated with the retina, refute this assumption.
This work does not recognize the existence of a plasma membrane surrounding the outersegment of the photoreceptor cell. The lack of such a membrane removes the foundation fromunder considerable conceptual work in the literature concerning the movement of molecularmaterial through such a membrane. This is unfortunate. However, the lack of such a membraneleads to a much more understandable mechanism for incorporating the chromophores of visiononto the protein-based disks of the outer segment.
To bolster the position of the author in this regard, the web site www.4colorvison.com offers a$1000 reward to the first investigator that can provide documentation supporting thepresence of a plasma membrane enclosing the central portion of the outer segment locatedbeyond the confines of the inner segment and before the confines of the RPE cells.
The absence of a plasma membrane surrounding the outer segment leads to a major but alternate role for theGABAs, glutamates, glycines and other chemicals related to the glutamate cycle of biochemistry. These materialsare shown to be the source of electrical power that drives the neural system. The absence of a membrane and theextra-cellular nature of the outer segment also explains how the disks of the outer segment can be phagocytized bythe RPE without destroying the parent photoreceptor cell.
Principle three--The photoreceptor cell involves sophisticated electrical circuits within the cell that are based on theActiva, the active electrolytic semiconductor device that is the foundation of the neural system. The technicalbackground necessary to define the features of the Activa and the neuron is too extensive to incorporate in thisChapter. It includes a broad range of disciplines not normally associated with biology. Not only must multipledisciplines within the field of biology be used in an unfamiliar way but many other disciplines that the biologistseldom encounters--radiation physics, quantum mechanics, optics, and analog electrical circuits –must also bebrought into the picture. Using these, the subject can be addressed in a comprehensive scientific manner. It is thisbackground that is absolutely necessary if a complete understanding of the operation of the photoreceptor cell is to
The Photoreceptor Cell 4- 3
4Prince, J. (1956) Comparative Anatomy of the Eye. Springfield, Il: Charles C. Thomas5Snyder, A. & Menzel, R. (1975) Photoreceptor optics. NY: Springer-Verlag. Particularly pp. 1-136Yamada, E. (1982) Morphology of vertebrate photoreceptors. Methods in Enzymology, vol 81, pp. 3-167Eakin, R. (1982) Morphology of invertebrate photoreceptors. Methods in Enzymology, vol 81, pp. 16-258Carthy, J. & Newell, G. (1968) Invertebrate receptors. NY: Academic Press for the Zoological Society ofLondon
be obtained. The required information is provided in other parts of this work. Appendix B develops the principlesof the Activa and its occurrence in the neurons of animals. Chapter 8 develops the circuits, common to all neurons,that use the Activa and Chapter 9 addresses the neural circuits unique to the photoreceptor cell. Section 4.1.1 &4.1.2 will present a few of the most critical concepts drawn from this material and needed to understand theremainder of the chapter.
This work proposes that the neural system is entirely electrolytic in its operation. All signaltransfers between neurons and between the dendrites, podites and axons of neurons areelectrical in character. The carrier of the signal between neurons is a charge, (an electronicneurotransmitter). While the chemistry of the glutamate cycle plays a major role in theoperation of the neural system, it is in an electrostenolytic support role. There is no need forchemical neurotransmitters within the signaling functions of the neural system.
As indicated in Chapter 3, there are a wide variety of photoreceptor shapes in the animal eye, but a somewhat lessernumber in the primate and human eyes. Prince4 has shown that the human eye displays a minimal number ofdifferent types of photoreceptor. Primarily because of this fact, this Chapter will concentrate on a typicalphotoreceptor of the human eye, how it is configured, how it performs its functions, and how it is supported by itslocal environment. Later material will discuss additional ramifications when broadening the discussion to includeother animal eyes.
It must be stressed that the presentation of two-dimensional pictures in the literature representing a slice of a three-dimensional structure frequently leads to misinterpretation of the true situation. The three-dimensional structures ofinterest here are not axially symmetrical. Therefore, many features are omitted in any given two-dimensionalrepresentation of the actual situation. To create a comprehensive understanding of almost any function of aphotoreceptor requires the study of a group of photographs as a minimum in order to create a three-dimensionalconcept in ones mind. Once this is accomplished, a realistic caricature of the subject can be presented.
Three works in the morphology literature are particularly noteworthy in the above context, Snyder & Menzel5,Yamada6 and Eakin7. These works provide important clues that can be assembled into a more appropriate compositepicture if the variety of overlapping terminology can be distilled. Snyder & Menzel title their work “PhotoreceptorOptics” but in the context of this work, it is limited to the physiological (geometry and structure of thephotoreceptors) as opposed to the physical optics of eyes. Although many of their conclusions and/or proposals arearchaic, the data and caricatures are important. It should be noted that they do not address the eye of Mollusca andtheir level of observed detail is limited to light microscopy. Their caricatures at the molecular level are markedhypothetical and their discussion of the orientation of the chromophore molecules in the surface of the disks can onlybe considered speculative. They were unaware of the importance of the liquid crystalline state of matter and discussthe chromophores in the single molecule form. Eakin provides some excellent scanning electron micrographs withdetail at the 0.05 micron level or better. His figure 3 is an excellent example of a photoreceptor Outer Segment. Italong with figure 1 and 2 show no sign of an outer plasma membrane surrounding the disk stack. Figure 4 showsexcellent detail of the fissures in a disk as well as the location of several microtubules (dendrites) at the entrance tothe fissures. Excellent imagery of the cilium (dendrite grouping) as it passes through the colax is also provided. Eakin has provided some excellent submicron level imagery of a variety of structures within various primitive eyes. He suggests that certain cilia (loosely defined) of the protist, Euglena viridis, were the earliest photoreceptorsorganized toward signaling the nature of the surrounding environment. He opens with his long held doubt about theconstituents of the photo-pigments (chromophores) of vision.
A related work by Carthy & Newell8 discusses the structural aspects of the eye of the locust and also provides actualmeasurements on the polarization sensitivity of that eye. It also includes very early remarks by M. Land where heequates the eye of the scallop, Pecten, with the typical eye of Mollusca. This work clearly demonstrates the uniqueand specialized nature of the eye of Pecten that is completely compatible with all of Land’s remarks but shows that itis far from typical of Mollusca.
To understand the operation of the photoreceptor cell, and other neurological cells, it is critical that they are
4 Processes in Biological Vision
examined under electron microscopy at a minimum of 120,000x. At this level, differences in the structure ofindividual lemmas and the arrangement between adjacent lemmas can be analyzed. One of the most unexpectedoutcomes of these analyses has been the recognition that something that is not normally studied in the laboratory isvery important. The space between the axon of one neuron and the dendrite of the next is a critical circuitparameter. If this space is of the correct dimensions, an Activa is formed between the two neurons. This Activa isof the simplest type and is the foundation of the so-called “gap junction.” Whereas the external morphology of thecell is largely irrelevant to vision, the internal cytology of the cell is critical. The photoreceptor cell includes avariety of internal lemma. These lemmas provide electrical isolation as well as an asymmetrical electricalimpedance. When these impedances are combined with an appropriate “space” that is actually filled withhydronium, another Activa is formed. It is this Activa that is the amplifier found within all neural cells. The Activa is an active 3-terminal biological semiconductor, technically similar to an active 3-terminal solid state semiconductorknown as a transistor. The Activa is a fundamental component of all animal neurons, regardless of phyla or family.
The true test of many of the caricatures to be presented below, as well as those in the literature, is whether theyproperly represent the actual biological situation in agreement with the photo-images found in the literature. Acaricature must be compatible with these images. If a caricature fails this test, its appropriateness is highly suspect.
A major problem in the electrophysiological laboratory has been the failure to completely appreciate the nature ofthe electrical pathways of the neurological system. The electronic circuits supporting the Activa are electrolyticinstead of metallic in nature. Some are conductive (analog circuit paths) and some are electromagnetic (phasicpaths) in their character.
A similar problem exists in the understanding of the operation of the photoreceptor. Much work, bothmorphological and physiological, has been done on the static properties of the photoreceptor cell. However,insufficient work has appeared describing its dynamic aspects, particularly the anagenesis of the disks and signaling. This problem has been exacerbated recently by the assignment of some of the metabolic materials found in thevicinity of neurons to a signaling role. These materials include GABA, glycine, glutamic acid (glutamate), etc. Theassignment has been made based on a floating model that has not been shown to be compatible with the overalloperation of the eye. Several additional materials have been defined based on this floating model. Some of them areonly defined conceptually and others appear to be illusory.
4.1.1 A roadmap of the photoreceptor/IPM/RPE complex
The photoreceptor cell is more than a cell. It is one of the most, if not the most, complicated cellular complexes inthe animal system. It incorporates all of the functions found in, or associated with, any neuro-secretory cell whilesimultaneously including the most complex electronic circuitry found in any neural cell. The overall complexincludes both the photoreceptor cell and at least one retinal pigment epithelium, RPE, cell. A crucial feature of thiscell complex is the appreciation of the fact that it includes both cellular and extracellular components. Both theinitial sensing element of the complex, the outer segment, and the mechanisms that provide electrical power tothe cell are extracellular. The outer segment can be likened to a finger nail in that it is a structure secreted by thephotoreceptor cell.
It is difficult to address all aspects of the photoreceptor cell without a background in the material in later chapters. This because much of the operation of the cell is not discernable from microscopic imagery without an extensiveknowledge of what one is looking for. Because of the physical dynamics of many processes and the electricalcharacter of the signaling elements, the imagery cannot be used as an effective exploratory tool. An investigatormust know what he is looking for. To allow introduction of the photoreceptor cell at this point, the terminology andglossary section will be more extensive than normal. Sections 4.1.2.6 & 7 are important because they develop theelectrical foundation for the operation of the photoreceptor cell and the neural system.
Following these introductory sections, Section 4.2 will address the morphology of the cell available from lightmicroscopy. This material provides an inadequate view of the cell. Section 4.3 initially addresses the grosscytology of the cell using electron microscopy at 10,000x to 50,000x. This level of magnification begins to explainthe structure of the cell. However, the section proceeds to the detailed level, based on magnifications of 100,000x orhigher, required to actually understand the operation of the photoreceptor cell. Section 4.6 will introduce anddiscuss how the cell continually generates and regenerates the various elements associated with the outer segment ofthe cell. Section 4.7 will then introduce and briefly discuss the operation of the cell in signaling. The details ofsignaling will be found in Chapter 12. The cell plays two roles in signaling. It creates the initial electrical signalthat is the key to the operation of the visual system and it processes this signal before passing it to other neurons ofthe neural system. The chapter concludes with two short sections addressing the differences among the
The Photoreceptor Cell 4- 5
9Lehninger, A. (1970) Biochemistry. NY: Worth
photoreceptors of a given species or retina (Section 4.7.3) and the significance of the surrounding environment in theoperation and experimental observation of the cell (Section 4.7.4).
4.1.1.1 The role of the RPE
The photosensing mechanism is completely nonfunctional in the absence of the RPE. The main function of the RPEis to manufacture and re-manufacture, following phagocytosis of the Outer Segments, the chromophores of vision. As part of this process, it stores chromophores in pigment granules until they are required. The recycling of thechromophores involves an operating lifetime of at least a week. There is no recycling on the scale of seconds tominutes as envisioned, or required, by the stereoisomeric theories of photosensing.
The RPE accepts retinoid material from the choroid vascular system in the process of manufacturing the Rhodoninechromophores. It does not fabricate opsin. On the other hand, the photoreceptor cells accept amino acids from theretinal blood supply and create opsin. The photoreceptor cells do not accept retinoid materials from the bloodstreamfor the purpose of manufacturing Rhodonine.
4.1.1.2 The role of Mueller and other glial cells
The role of the various glial cells interspersed between the photoreceptors of the retina is still poorly understood. Many of these cells appear to straddle the Outer Limiting Membrane and may contribute to the isolation of the IPMfrom the INM. There are suggestions in the literature that these cells may play a role in secreting the IRBP type ofretinoid binding proteins required to be present in the IPM. In this role, their location would be ideal.
4.1.2 Terminology
In describing the elements of the visual system at the histological, cytological and molecular level, it is important tohave clear agreement on certain terms. These terms are defined in this section, Section 4.1.3 and the Glossary.
4.1.2.1 Relevant biochemistry of lipids and proteins
4.1.2.1.1 The lipids
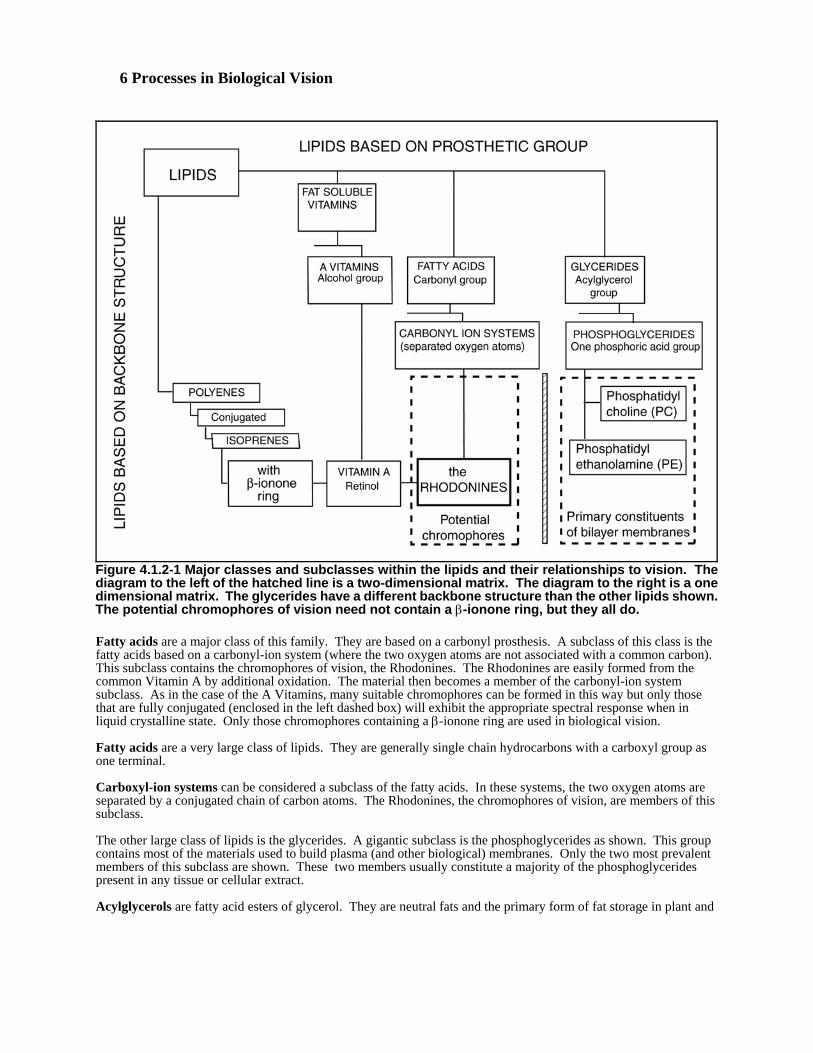
The lipid family is unusual in chemistry. Members are not defined by their structure or their content. They areprimarily defined by their solubility. Lipids are water-insoluble organic substances found in cells which areextractable by non polar solvents9. They are generally saturated but may contain double or triple bonds (which aid insemantic labeling). As a result of this definition, individual lipids can also be described by a variety of otherdesignations. A variety of lipids play important roles in the operation of the photoreceptor-IPM-RPE complex. The lipids can generally be described graphically in a two-dimensional hierarchal format. Figure 4.1.2-1 illustratesthe primary family relationships among the lipids of vision based on their prosthetic group. Those members on theleft of the hatched line are also described in terms of their backbone structure. The members on the right of thehatched line can also be described by their structural organization but this involves a more complex breakdown thanjustified here.
Terpenes are a minor class of lipids. They are generally single chain hydrocarbons based on the isoprene structureand with a hydroxyl group as one terminal. Because of the isoprene structure, they are unsaturated by definition.
The fat soluble vitamins are a minor class in this family but a significant fraction of all vitamins. One group of thisclass is the A vitamin group. This group contains a variety of hormonally active chemical species including thecommon alcohol, aldehyde and acid derived from carotene and known collectively as the retinenes. Only theretinene containing the hydroxyl group as the prosthesis, the common Vitamin A, is diagramed in this figure. Thisvitamin is defined by its structure as shown at the lower center. Other members of the A vitamin group are based ondifferent structures and prostheses.
Fat soluble vitamins are characterized by their insolubility in water. There are a large number of hormones in the AVitamin family. One of the simplest and most common is known simply as Vitamin A. It is an alcohol with ahydroxyl group as one terminal. Common Vitamin A is also a terpene.
6 Processes in Biological Vision
Figure 4.1.2-1 Major classes and subclasses within the lipids and their relationships to vision. Thediagram to the left of the hatched line is a two-dimensional matrix. The diagram to the right is a onedimensional matrix. The glycerides have a different backbone structure than the other lipids shown.The potential chromophores of vision need not contain a β-ionone ring, but they all do.
Fatty acids are a major class of this family. They are based on a carbonyl prosthesis. A subclass of this class is thefatty acids based on a carbonyl-ion system (where the two oxygen atoms are not associated with a common carbon). This subclass contains the chromophores of vision, the Rhodonines. The Rhodonines are easily formed from thecommon Vitamin A by additional oxidation. The material then becomes a member of the carbonyl-ion systemsubclass. As in the case of the A Vitamins, many suitable chromophores can be formed in this way but only thosethat are fully conjugated (enclosed in the left dashed box) will exhibit the appropriate spectral response when inliquid crystalline state. Only those chromophores containing a β-ionone ring are used in biological vision.
Fatty acids are a very large class of lipids. They are generally single chain hydrocarbons with a carboxyl group asone terminal.
Carboxyl-ion systems can be considered a subclass of the fatty acids. In these systems, the two oxygen atoms areseparated by a conjugated chain of carbon atoms. The Rhodonines, the chromophores of vision, are members of thissubclass.
The other large class of lipids is the glycerides. A gigantic subclass is the phosphoglycerides as shown. This groupcontains most of the materials used to build plasma (and other biological) membranes. Only the two most prevalentmembers of this subclass are shown. These two members usually constitute a majority of the phosphoglyceridespresent in any tissue or cellular extract.
Acylglycerols are fatty acid esters of glycerol. They are neutral fats and the primary form of fat storage in plant and

The Photoreceptor Cell 4- 7
10Gilman, A. (1987) G Proteins: transducers of receptor-generated signals, Ann. Rev. Biochem. vol. 56, pp 615-64911Gomez, J. & Benovic, J. (1992) Molecular and regulatory properties of the adenylyl cyclase-coupled b-adrenergic receptors. Inter. Rev. Cytol. vol. 137B, pp 1-3412 Dohlman, H. et. al. (1991) Model systems for the study of seven-transmembrane-segment receptors. Ann.Rev. Biochem. vol. 60, pp 653-688
animal cells.
Triacylglycerols (formerly triglycerides) make up the great bulk of the neutral fats. By varying the individual fattyacids, and their molecular position in individual triacylglycerols, a very large family of compounds can be formed.
Phosphoglycerides (glycerol phosphatides) are formed when one of the primary hydroxyl groups of glycerol isesterfied to phosphoric acid instead of a fatty acid. As in the case of the triacylglycerols, a very large family isformed. This family exhibits an asymmetrical carbon atom resulting in every member exhibiting two stereo specificforms. All phosphoglycerides possess a polar head and two non polar hydrocarbon tails and are called amphipathicor polar lipids. These materials are found almost entirely in cell membranes.
The most important phosphoglycerides in biological bilayer membranes are phosphatidyl choline (PC) andphosphatidyl ethanolamine (PE). Mention has been made in the literature of converting PE to PC by the addition ofa methyl group. The process is considerably more complex. It involves the addition of three methyl groupsaccording to Lehninger (pg 196). In both cases, the exposed terminal of the head group is polarized positive with anegative charge located between that terminal and the two glyceride chains.
4.1.2.1.2 The proteins
Proteins are the most abundant organic molecules in cells, typically constituting 50 per cent of their dry weight. They consist of a series of amino acids connected by amide linkages called peptide bonds. They are formed by theelimination of water from the carboxyl group of one amino acid and the a-amino group of the next. Many of themare easily hydrolyzed in acid back to their constituent amino acid building blocks. The proteins can be categorized interms of their structure and their function. Recently, they have been subdivided into a family based only on theirability to react with guanine, the G-proteins. These will be discussed in the next section.
The proteins are divided into two major classes according to their structure, the simple and conjugated proteins.
Simple proteins, upon hydrolysis, yield nothing but amino acids.
Conjugated proteins, upon hydrolysis, yield a variety of amino acids and at least one other organic or inorganicgroup. This material is called the prosthetic group. The conjugated proteins are labeled according to the nature ofthe prosthetic group. The lipoproteins are one such large group.
Three major classes of proteins based on their function are uniquely important in vision. Opsin is a member of thestructural protein class. It has a molecular weight of about 40,000. The second important class contains thetransport proteins. There are nearly a dozen transport proteins involved in the creation and distribution of thechromophores of vision. They have molecular weights above 60,000. The third functional class of proteins providesthe energy required to power the electrical operation of the neural system. These are of relatively low molecularweight, from 89 to less than 5,000, and are associated with the glutamate cycle.
4.1.2.1.3 The G-proteins
Recently, a large family of proteins have been segregated based on their ability to bind with the guanine nucleotide. These so-called guanine nucleotide-binding proteins (G proteins) are not characterized by their chemical formula,their chemical structure, or function10. Thus, the family is very heterogenous and care must be exercised whenrationalizing their properties. Gomez & Benovic have provided references to several important papers in this area11. A large subfamily of the G proteins is the “seven-transmembrane-segment (7 TMS) proteins, or alternately seven-transmembrane-segment receptors12. The stereographic form of these proteins includes seven regions that arearranged roughly side-by-side with their long axes parallel. The common caricature of these proteins shows themembedded periodically in a plasma membrane. However, it will be shown below that in the case of the disks, theyconstitute the bulk of the disk surface and form a liquid crystalline bilayer. This bilayer may appear like a plasmamembrane but in fact contains no phosphoglycerides. It is merely a bilayer structure formed with its hydrophilic
8 Processes in Biological Vision
13Hargrave, P. & McDowell, J. (1992) Rhodopsin and phototransduction. Inter. Rev. Cytol. vol. 137B, pp 49-9714Boesze-Battaglia, K. & Albert, A. (1990) xxx J. Biol. Chem. vol. 265, pp 20727-20730
surfaces exposed to the surrounding water-based environment.
It is an early day in characterizing all of the known 7-TMS proteins. Currently, they are being described asconstituted of three subunits, α, β, & γ where the names relate to the molecular weight of the subunits in descendingorder. It appears the α-subunit normally contains the amide terminal of the protein. However, this α-subunit has notbeen shown to be functionally significant. The β and γ subunits are less well characterized. The size of the α-subunit may be constant among a specific class of G-proteins or 7-TMS proteins but size is not constant among thevarious classes of G proteins within the 7-TMS sub-family.
The G proteins are frequently described as transducers of chemically and physically coded information. This is notthe same meaning that is associated with the transduction of light in this work. Gilman specifically caveats hisdefinition of the G proteins, in order to remain alert for such proteins that do not operate within the rules he definedfor these materials in 1987.
Hargrave & McDowell surfaced some additional aspects of the visual proteins in 199213. They defined the pigmentin the rods of vision as rhodopsin but the pigment in the cones of vision as opsin. They also differentiated betweenthe two types of membranes in the Outer Segment. They said that 94-95% are “disk membranes” with the remainderbeing plasma membranes. They suggested that the difficulty of physically separating these two types of membranesexperimentally has greatly impeded efforts to understand them. Quoting Boesze-Battaglia & Albert, et. al14., theyalso suggested that “rhodopsin may only be present as a supply needed for the formation of disk membranes.” Hargrave & McDowell use a variety of percentages when discussing the rhodopsin content of the Outer Segmentsand the disks. It appears that more precise terms are needed to organize these percentages more specifically.
If one accepts the position of this work, that the disks of the rods are formed without the presence of retinal as aligand, the 7-TMS proteins of the “cones” and “rods” of vision are both opsin (not rhodopsin in the case of the“rods”).
A review of the protein chemistry literature of the 7-TMS proteins uncovered two important facts.
+ Except for one group, no authors have ever confirmed the presence of retinol within the material they designatedas rhodopsin prior to their experiments. As discussed in Section 4.6.2.3, that group found that retinol was notincorporated into the putative rhodopsin prior to its secretion by the photoreceptor cell.
+ In all of the sequencing work of recent years, no group could be found in the literature who confirmed the presenceof retinol in any of the residues of its work or showed where the retinol ligand was attached to the protein.
All of the work and literature relied upon the location of a putative Schiff-base proposed by Bownds in 1967 whichin turn relied upon the proposed existence of a Schiff-base joining the protein and retinol put forth by Collins in1953. Neither of these proposals, upon which so much of the literature is based, have been confirmed in thelaboratory. See Section 5.5.2.1.
Much of the research associated with the 7-TMS proteins, including the putative rhodopsin (claimed to be just opsinin this work), has been in-vitro and involved the hydrolysis and/or phosphorylation of the material. It is proposedthat while much of this work is excellent, it is extraneous to the role of opsin in vision. Opsin is a benign substrate,external to the plasma membrane of the photoreceptor cell, in the protected chemical environment of the IPM.
4.1.2.1.4 The specific lipids and proteins of photodetection
The specific lipid involved in photosensing in vision is Rhodonine, a derivative of retinol, when in the liquidcrystalline state of matter and condensed on a planar substrate. The molecular weight of the family varies between285 and 299. This family of chemicals is so sensitive to chemical attack that it is frequently destroyed during typicalbiochemical extraction techniques. It is also so low in molecular weight that it is frequently overlooked inchromatography experiments to determine the molecular weights of the components of the disks of the outersegment.
The precise nature of the substrate on which Rhodonine is condensed is less clear and less important. The substrate

The Photoreceptor Cell 4- 9
15Bibb, C. & Young, R. (1974) Renewal of fatty acids in the membranes of visual cell outer segments. J. CellBiol. vol. 61, pp 327-34316Bibb, C. & Young, R. (1974) Renewal of glycerol in the visual cells and pigment epithelium of the frog retina.J. Cell Biol. vol. 61, pp 378-38917Birge, R. (1981) Photophysics of light transduction in rhodopsin and bacteriorhodopsin. Ann. Rev. Biophys.Bioeng. vol. 10, pp 315-35418Fliesler, S. Rayborn, M. & Hollyfield, J. (1985) Membrane morphogenesis in retinal rod outer segments J.Cell. Biol. vol. 100, pp 574-58719Hargrave, P. (1982) Rhodopsin chemistry, structure, and topography. In Progress in Retinal research vol. 1.Osborne, N & Chader, G. ed. NY: Pergamon Press pp 1-5120Nathans, J. (1987) Molecular biology of visual pigments. Ann. Rev. Neurosci. vol. 10, pp 163-19421Stryer, L. (1986) Cyclic GMP cascade of vision Ann. Rev. Neurosci. Vol. 9, pp 87-119
is passive with regard to the photosensing function. Attempts to define the precise nature of the substrate haveprovided conflicting results. When the protein formed within the inner segment is analyzed, the findings tend to bedifferent from what is found when the material from the outer segment is analyzed. It is necessary to criticallyreview the procedures used in such experiments.
In 1974, Bibb & Young provided a broad discussion of the characteristics of the substrates of the outer segments(colored by a variety of suppositions concerning the overall processes of vision that are not supported here)15. Thelast paragraph of their introduction is noteworthy. They also concluded that 60% of the dry weight of the substrateswas protein and about 40% were phospholipids. They state that “The protein content is unusually simple . . . whereas much as 80% of protein appears to be opsin.” 80-85% of the phospholipids present were phosphatidyl cholineand phosphatidyl ethanolamine. These two materials are normally associated with cell membranes. They thereforecontinue to consider this group of protein and phospholipid materials to be associated with a single cell membrane. However, it is not clear that they prevented the phospholipid membrane material from other sources to mingle withthe protein of the substrates. They also provided additional definition of the character of the phospholipids. Theirconclusion was unusual in that they say rhodopsin apparently floats in the lipid material that has a viscosity of a lightoil, and the rhodopsin molecules are free to rotate while maintaining their long axis in the plane of the “membrane.” Additional information was provided in a continuing paper16. Figure 1 in both papers shows the RPE cells extendingmuch further along the outer segment than in most similar figures. Birge put the percentage of opsin in the substrateat ~95% in 1981 and provided a large bibliography17.
Fliesler, et. al18. following Hargrave arrived at a different structure for the material they collected in 198519. Theyconcluded that the opsin of vision (or rhodopsin depending on the author) is a conjugate protein with a prostheticgroup consisting of two unusually short asparagine-linked oligosaccharide chains linked to the simple opsin bycovalent coupling. This form may only be present as an intermediary, or apoprotein, prior to the secretion of thecomplete protein. Their statement that rhodopsin is a cell specific glycoprotein does not appear consistent with theabove definition or their description of the underlying protein on page 575.
A team led by Nathans has presented a considerably different structure of the outer segments based on geneticprinciples and based on a variety of assumptions from the common wisdom of the time20. Their position is thatretinol is conjugated with the protein at an intermediate point along the length of the protein to form thechromophore but no other prosthetic terminal groups are present. It will be shown that neither this putativeconjugate protein nor retinol alone is a chromophore of vision. Nathans, et. al. as well as Stryer21 have developed acaricature of the disks as consisting of a lipid (biological) membrane with the protein rhodopsin intertwined with thismembrane in a very complex pattern. The intertwining maintains the putative retinol in a plane parallel to thesurface of the membrane. There is no suggestion that any part of this structure has the fluidity of light machine oil. Whereas most authors have assumed the spectral differences of the putative rhodopsin have been due to singular, orat the most small, differences between the rhodopsins, Nathans proposes hundreds of differences in various aminoacids within the opsin account for these differences. No experimental justification for this position was presented forthis proposition as of 1987.
As the field of G protein research has advanced, the substrate found to form the disks of vision have been sequenced. They are members of the 7-TMS sub-family of G proteins. They are closely packed in a planar sheet that has beenfolded to protect (isolate) the hydrophobic termini of the proteins. The resulting bilayer appears similar to a plasmamembrane but it contains no phosphoglycerides. The substrate is passive with respect to the signaling function invision. It is not involved in the transduction of photons into an electrical signal.
Lacking direct correlation with the mechanism of photosensing, the discussions of phenotyping in the literature have
10 Processes in Biological Vision
22Tien, H. (1974) Bilayer lipid membranes. NY: Dekker
not been correlated, beyond low level statistical inference, with actual vision defects.
4.1.2.2 Membranes, films and coatings
Of particular importance at both the histological and cytological level are the terms, membrane, film and coating. Inthis work, the following meanings will be assigned to these words (see Glossary for more detailed definitions);
+ A membrane is a complex structure traceable to the tissue of a living cell or organism and known to havecharacteristic porosity to metabolic materials. More specifically, as in cytology, it is a three-layer structureconsisting of two leaflets and the space between them. It is frequently labeled a bi-layer membrane, BLM, or lessfrequently a three-layer membrane after counting the space between the two layers.
+ A film is a complex structure of organic or inorganic molecules not necessarily traceable to living tissue. Itexhibits tensile and compressive strength appropriate to its molecular structure. It is normally homogeneous at themolecular level.
+ A coating is a heterogeneous material found on the surface of another structure which is not traceable to livingtissue and does not exhibit significant tensile strength.
These definitions differ somewhat from the vernacular. They must be more precise to avoid confusion.
4.1.2.2.1 Membranes as exterior cell walls
[xxx this section 4.1.2.2.1 also appears as 8.2.1.3 ]All neural cells employ an external cell wall (not to be confused with the cellulose based outer “cell wall” of plants)that can be described as a typical biological membrane. Such a typical membrane consists of two films of moleculesseparated by an extremely small space. It is frequently described as a three-layer structure. The two physical filmsare known as leaflets. Each layer consists of a liquid crystalline film of a phosphoglyceride. The hydrophobic endsof these molecules form one surface of each leaflet. The hydrophobic surfaces of the two leaflets are adjacent toeach other. The resulting membrane is hydrophilic but it is impervious to water. Its porosity to other materials maybe highly specialized, depending on the specific phosphoglycerides involved. Although the two films appearidentical under the electron microscope, there is usually a critical difference between the phosphatidyl groups. Thedifference may involve only one atom in each molecule.
An asymmetrical biological membrane separating two different solutions may cause the solutions to exhibit adifference in potential. This potential difference is the foundation for the electrical operation of the neuron. Byproper selection of the phosphoglycerides and solutes, different potentials can be obtained. By proper adjustment ofthe area of the membrane formed from a specific phosphoglyceride(s), the power handling capabilities of this sourcecan be determined. If external test equipment is attached to the two solutions, the impedance of the configurationwill be seen to be highly asymmetrical and hence nonlinear. In fact, the impedance is that of a perfect diode at lowcurrents. The electrochemistry of such configurations is well understood22 and is reviewed in Appendix B. However, little emphasis has been placed on the dynamic characteristics of these configurations. In addition, it hasseldom been recognized that there are additional charge carrying mechanisms besides electrons and ions. Theseinclude the holes of conventional semiconductor physics.
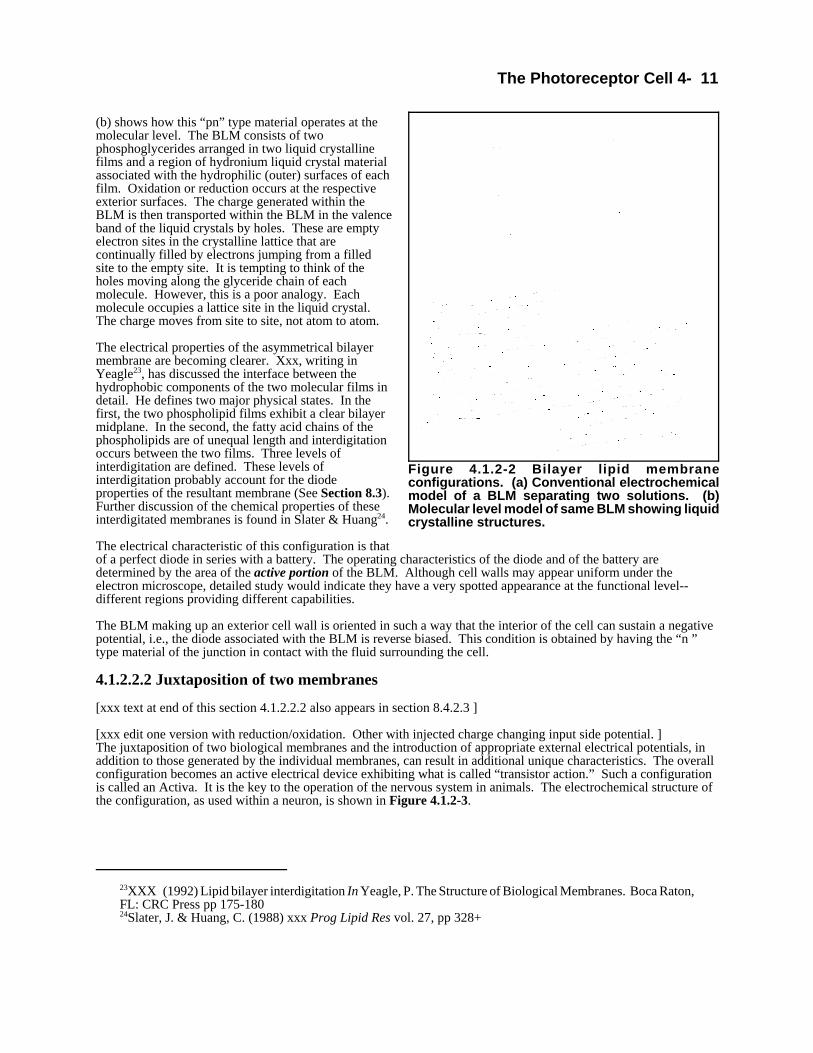
The semiconductor properties of BLM configurations are poorly understood. Figure 4.1.2-2 illustrates thefundamental situation. (a) shows the conventional electrochemical description of a single BLM immersed betweentwo different solutions. (b) shows the same situation but with the BLM described at the molecular level.
(a) shows that no ions actually pass through the membrane. Instead, all reduction and oxidation occur at therespective surfaces with only charge actually passing through the BLM (indicated by the horizontal lines). Thischarge is composed of two components, electrons and “+” charges or holes. The net charge transfer is the algebraicsum of these two components. The ratio between these two components is an important characteristic of asemiconductor. In BLM’s of interest to neuroscience, the hole current dominates in one part of the membrane crosssection and that material is described as “p” (positive) type material. The dominant current in another part of thecross section is dominated by electrons. It is described as “n” type material. The overall material is described as a“pn” junction and exhibits a perfect diode impedance characteristic under low charge flow conditions.
The Photoreceptor Cell 4- 11
23XXX (1992) Lipid bilayer interdigitation In Yeagle, P. The Structure of Biological Membranes. Boca Raton,FL: CRC Press pp 175-18024Slater, J. & Huang, C. (1988) xxx Prog Lipid Res vol. 27, pp 328+
Figure 4.1.2-2 Bilayer lipid membraneconfigurations. (a) Conventional electrochemicalmodel of a BLM separating two solutions. (b)Molecular level model of same BLM showing liquidcrystalline structures.
(b) shows how this “pn” type material operates at themolecular level. The BLM consists of twophosphoglycerides arranged in two liquid crystallinefilms and a region of hydronium liquid crystal materialassociated with the hydrophilic (outer) surfaces of eachfilm. Oxidation or reduction occurs at the respectiveexterior surfaces. The charge generated within theBLM is then transported within the BLM in the valenceband of the liquid crystals by holes. These are emptyelectron sites in the crystalline lattice that arecontinually filled by electrons jumping from a filledsite to the empty site. It is tempting to think of theholes moving along the glyceride chain of eachmolecule. However, this is a poor analogy. Eachmolecule occupies a lattice site in the liquid crystal. The charge moves from site to site, not atom to atom.
The electrical properties of the asymmetrical bilayermembrane are becoming clearer. Xxx, writing inYeagle23, has discussed the interface between thehydrophobic components of the two molecular films indetail. He defines two major physical states. In thefirst, the two phospholipid films exhibit a clear bilayermidplane. In the second, the fatty acid chains of thephospholipids are of unequal length and interdigitationoccurs between the two films. Three levels ofinterdigitation are defined. These levels ofinterdigitation probably account for the diodeproperties of the resultant membrane (See Section 8.3). Further discussion of the chemical properties of theseinterdigitated membranes is found in Slater & Huang24.
The electrical characteristic of this configuration is thatof a perfect diode in series with a battery. The operating characteristics of the diode and of the battery aredetermined by the area of the active portion of the BLM. Although cell walls may appear uniform under theelectron microscope, detailed study would indicate they have a very spotted appearance at the functional level--different regions providing different capabilities.
The BLM making up an exterior cell wall is oriented in such a way that the interior of the cell can sustain a negativepotential, i.e., the diode associated with the BLM is reverse biased. This condition is obtained by having the “n ”type material of the junction in contact with the fluid surrounding the cell.
4.1.2.2.2 Juxtaposition of two membranes
[xxx text at end of this section 4.1.2.2.2 also appears in section 8.4.2.3 ]
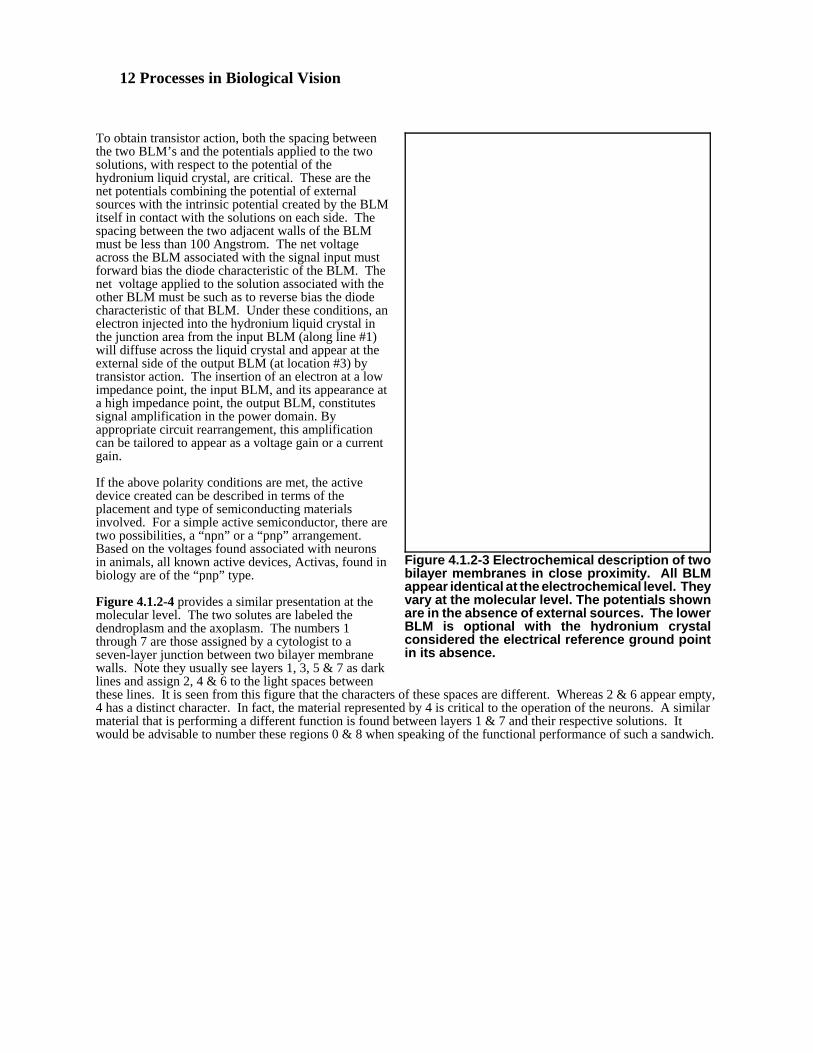
[xxx edit one version with reduction/oxidation. Other with injected charge changing input side potential. ]The juxtaposition of two biological membranes and the introduction of appropriate external electrical potentials, inaddition to those generated by the individual membranes, can result in additional unique characteristics. The overallconfiguration becomes an active electrical device exhibiting what is called “transistor action.” Such a configurationis called an Activa. It is the key to the operation of the nervous system in animals. The electrochemical structure ofthe configuration, as used within a neuron, is shown in Figure 4.1.2-3.
12 Processes in Biological Vision
Figure 4.1.2-3 Electrochemical description of twobilayer membranes in close proximity. All BLMappear identical at the electrochemical level. Theyvary at the molecular level. The potentials shownare in the absence of external sources. The lowerBLM is optional with the hydronium crystalconsidered the electrical reference ground pointin its absence.
To obtain transistor action, both the spacing betweenthe two BLM’s and the potentials applied to the twosolutions, with respect to the potential of thehydronium liquid crystal, are critical. These are thenet potentials combining the potential of externalsources with the intrinsic potential created by the BLMitself in contact with the solutions on each side. Thespacing between the two adjacent walls of the BLMmust be less than 100 Angstrom. The net voltageacross the BLM associated with the signal input mustforward bias the diode characteristic of the BLM. Thenet voltage applied to the solution associated with theother BLM must be such as to reverse bias the diodecharacteristic of that BLM. Under these conditions, anelectron injected into the hydronium liquid crystal inthe junction area from the input BLM (along line #1)will diffuse across the liquid crystal and appear at theexternal side of the output BLM (at location #3) bytransistor action. The insertion of an electron at a lowimpedance point, the input BLM, and its appearance ata high impedance point, the output BLM, constitutessignal amplification in the power domain. Byappropriate circuit rearrangement, this amplificationcan be tailored to appear as a voltage gain or a currentgain.
If the above polarity conditions are met, the activedevice created can be described in terms of theplacement and type of semiconducting materialsinvolved. For a simple active semiconductor, there aretwo possibilities, a “npn” or a “pnp” arrangement. Based on the voltages found associated with neuronsin animals, all known active devices, Activas, found inbiology are of the “pnp” type.
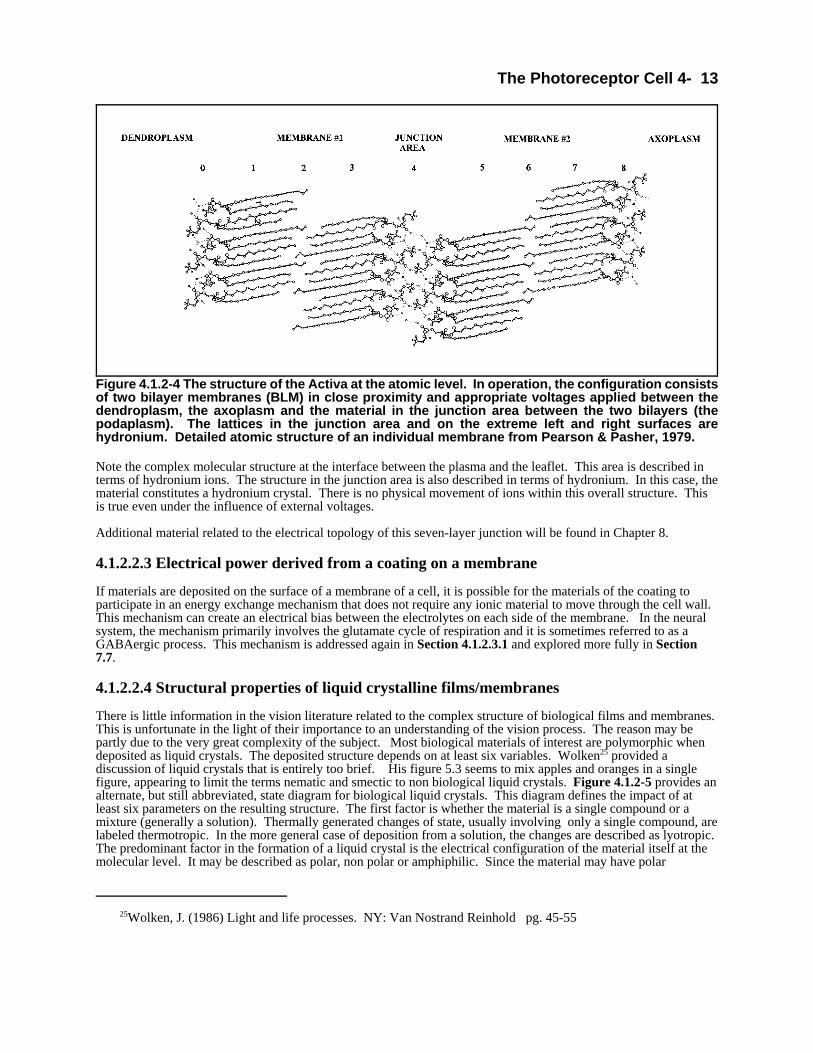
Figure 4.1.2-4 provides a similar presentation at themolecular level. The two solutes are labeled thedendroplasm and the axoplasm. The numbers 1through 7 are those assigned by a cytologist to aseven-layer junction between two bilayer membranewalls. Note they usually see layers 1, 3, 5 & 7 as darklines and assign 2, 4 & 6 to the light spaces betweenthese lines. It is seen from this figure that the characters of these spaces are different. Whereas 2 & 6 appear empty,4 has a distinct character. In fact, the material represented by 4 is critical to the operation of the neurons. A similarmaterial that is performing a different function is found between layers 1 & 7 and their respective solutions. Itwould be advisable to number these regions 0 & 8 when speaking of the functional performance of such a sandwich.
The Photoreceptor Cell 4- 13
25Wolken, J. (1986) Light and life processes. NY: Van Nostrand Reinhold pg. 45-55
Figure 4.1.2-4 The structure of the Activa at the atomic level. In operation, the configuration consistsof two bilayer membranes (BLM) in close proximity and appropriate voltages applied between thedendroplasm, the axoplasm and the material in the junction area between the two bilayers (thepodaplasm). The lattices in the junction area and on the extreme left and right surfaces arehydronium. Detailed atomic structure of an individual membrane from Pearson & Pasher, 1979.
Note the complex molecular structure at the interface between the plasma and the leaflet. This area is described interms of hydronium ions. The structure in the junction area is also described in terms of hydronium. In this case, thematerial constitutes a hydronium crystal. There is no physical movement of ions within this overall structure. Thisis true even under the influence of external voltages.
Additional material related to the electrical topology of this seven-layer junction will be found in Chapter 8.
4.1.2.2.3 Electrical power derived from a coating on a membrane
If materials are deposited on the surface of a membrane of a cell, it is possible for the materials of the coating toparticipate in an energy exchange mechanism that does not require any ionic material to move through the cell wall. This mechanism can create an electrical bias between the electrolytes on each side of the membrane. In the neuralsystem, the mechanism primarily involves the glutamate cycle of respiration and it is sometimes referred to as aGABAergic process. This mechanism is addressed again in Section 4.1.2.3.1 and explored more fully in Section7.7.
4.1.2.2.4 Structural properties of liquid crystalline films/membranes
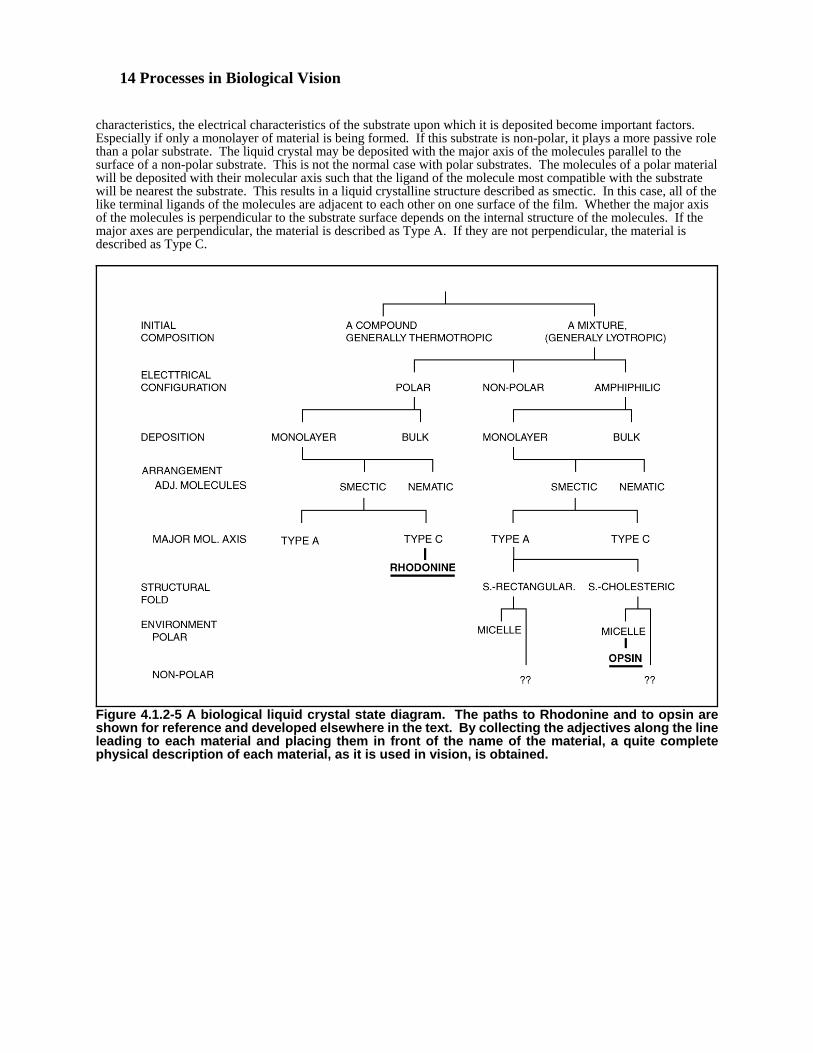
There is little information in the vision literature related to the complex structure of biological films and membranes. This is unfortunate in the light of their importance to an understanding of the vision process. The reason may bepartly due to the very great complexity of the subject. Most biological materials of interest are polymorphic whendeposited as liquid crystals. The deposited structure depends on at least six variables. Wolken25 provided adiscussion of liquid crystals that is entirely too brief. His figure 5.3 seems to mix apples and oranges in a singlefigure, appearing to limit the terms nematic and smectic to non biological liquid crystals. Figure 4.1.2-5 provides analternate, but still abbreviated, state diagram for biological liquid crystals. This diagram defines the impact of atleast six parameters on the resulting structure. The first factor is whether the material is a single compound or amixture (generally a solution). Thermally generated changes of state, usually involving only a single compound, arelabeled thermotropic. In the more general case of deposition from a solution, the changes are described as lyotropic. The predominant factor in the formation of a liquid crystal is the electrical configuration of the material itself at themolecular level. It may be described as polar, non polar or amphiphilic. Since the material may have polar
14 Processes in Biological Vision
Figure 4.1.2-5 A biological liquid crystal state diagram. The paths to Rhodonine and to opsin areshown for reference and developed elsewhere in the text. By collecting the adjectives along the lineleading to each material and placing them in front of the name of the material, a quite completephysical description of each material, as it is used in vision, is obtained.
characteristics, the electrical characteristics of the substrate upon which it is deposited become important factors. Especially if only a monolayer of material is being formed. If this substrate is non-polar, it plays a more passive rolethan a polar substrate. The liquid crystal may be deposited with the major axis of the molecules parallel to thesurface of a non-polar substrate. This is not the normal case with polar substrates. The molecules of a polar materialwill be deposited with their molecular axis such that the ligand of the molecule most compatible with the substratewill be nearest the substrate. This results in a liquid crystalline structure described as smectic. In this case, all of thelike terminal ligands of the molecules are adjacent to each other on one surface of the film. Whether the major axisof the molecules is perpendicular to the substrate surface depends on the internal structure of the molecules. If themajor axes are perpendicular, the material is described as Type A. If they are not perpendicular, the material isdescribed as Type C.

The Photoreceptor Cell 4- 15
An additional complication arises when the deposited material is multilayer. This can occur during initial depositionor by folding of a monolayer onto itself. For most amphiphilic materials, this results in the layers of the liquidcrystal being arranged alternately so that hydrophobic surfaces face each other and hydrophilic surfaces face eachother. However, the adjacent layers may exhibit lattice vectors that are not aligned layer-to-layer. If they arealigned, no special name is applied but the label rectangular is used in the figure. If they are not aligned, the materialis described as either nematic-cholesteric or smectic-cholesteric. It is common in the non biological literature toshorten the nematic-cholesteric description to just cholesteric. However, this is not appropriate in the biologicalfield. Many biological liquid crystals are smectic-cholesteric. Following the folding of an amphiphilic liquidcrystalline film, the nature of the environment plays an important role. A folded film has regions where the exposedsurface may be abhorrent of the liquid environment. In that case, the abhorrent surface will tend to withdraw. As aresult, the more acceptable ligand will be pulled into a position to protect the abhorrent ligand. The result will be amicelle with a continuous outer surface compatible with the surrounding environment.
The figure shows that opsin is formed lyotropically into a micelle that is smectic-cholesteric and probably of TypeA. The wall of the micelle is a monolayer film that is amphiphilic. It also shows that the chromophores of vision aredeposited onto the above micelles lyotropically as a polar monolayer that is smectic, Type C. By depositingRhodonine(7) on a substrate consisting of a micelle of opsin, the conceptual material rhodopsin is formed. Theisotropic absorption spectrum of this material exhibits a peak at ~500 nm. The anisotropic absorption spectrum ofthis material when in the in-vivo state peaks at 532 nm. and it has previously been labeled iodopsin in the literature. These descriptions will be justified in the following paragraphs and chapters.
4.1.2.2.4 Deposited films/membranes
The deposition of proteins and chromophores from a solution play an important role in vision. In the general case,the protein or chromophore has been secreted through a cell wall into an enclosed space containing a uniquesolution. This solution and the nature of the walls forming the space determine the nature of the product precipitatedfrom the solution. In the case of proteins, which are generally amphiphilic, a polar substrate with its hydrophilicsurface exposed will cause the proteins to aggregate into a smectic liquid crystalline film on the surface of thesubstrate(especially if the solvent is non polar). This is particularly true if the protein film is made to move along thesurface of the substrate as in the extrusion cup of the Inner Segment. If this film is caused to fold due to theconfining shape of the substrate, the result will be a sandwich of two amphiphilic films with their hydrophobicsurfaces in close contact. Most of the periphery of the new two-layer membrane will be exposed to the solvent. Ifthe solvent should become predominantly water based, the exposed hydrophobic surfaces along the periphery of themembrane will withdraw from the polar solvent and the hydrophilic surfaces will close on each other. The result is athin membrane with a rounded fold along all of its periphery and only a hydrophilic surface exposed to the solvent. A micelle will be defined narrowly in this work as the above form of membrane.
The detailed crystalline form of the protein within the micelle will be determined by the specific properties of theprotein. If the protein is initially deposited with its major axis perpendicular to the substrate, the resulting smecticstructure is known as Type A. Otherwise, it is known as a Type C.
The relationship between the two films forming the micelle is also important. The surface of a protein film willfrequently exhibit lattice axes. If the axes approaching the fold line is folded back parallel to itself, the resultingmembrane will remain described as a smectic crystalline structure. If however, the axis is not folded back parallel toitself, the two films will exhibit lattices that are not aligned. The resulting structure is designated smectic-cholesteric.
If a micelle of the above form is now exposed to a supersaturated solution of polar chromophores, the chromophoreswill precipitate onto the surface of the micelle. The chromophores will form a smectic liquid crystalline surface thatcan cover the entire surface of the micelle.
4.1.2.3 Cells, micelles, & protocells
A biological cell invariably consists of a bilayer external membrane enclosing an electrolytic environment ofimmense cytological complexity. The fundamental bilayer consists of a lipid material. In more advanced cells, thecharacter of the lipid may change with location on the cell surface. A fundamental cell for purposes of investigation
16 Processes in Biological Vision
26Wolken, J. (1986) Light and life processes. NY: Van Nostrand Reinhold pp. 54-5527Levitzki, A. (1984) Receptors: A quantitative approach. Menlo Park, CA: The Benjamin/CummingsPublishing Co.
and further ramification has been defined by Wolken26 under the name protocell. A protocell is formed of a bilayerof uniform smectic lipid material enclosing a nematic electrolyte free of inclusions. This conceptual protocell can beextended, stepwise, to more fully define a conceptual cell equivalent to a real biological cell.
The term micelle first arose in organic chemistry to define a form taken by an amphiphilic material when introducedinto a polar solvent, usually water. The material may be of many different forms, including protein. The materialtypically attempts to isolate its hydrophobic surface from the solvent by forming a fundamentally spherical surfacewith the hydrophilic terminals of the individual molecules all aligned to each other and in contact with the solvent. The result is a smectic liquid crystalline film enclosing an empty space. Alternately, it can enclose a hydrophobicmaterial and this material may assume a liquid crystalline form. A flattened form of a micelle may result in theformation of a disk wherein the two hydrophobic surfaces of the amphiphilic layers are in contact with each other. However, the result remains a shape with an external wall that is a monolayer. If this monolayer encloses a secondhydrophobic material that is nematic, a gross configuration very similar to the protocell is obtained. However, it isstill a micelle with a monolayer for an exterior wall.
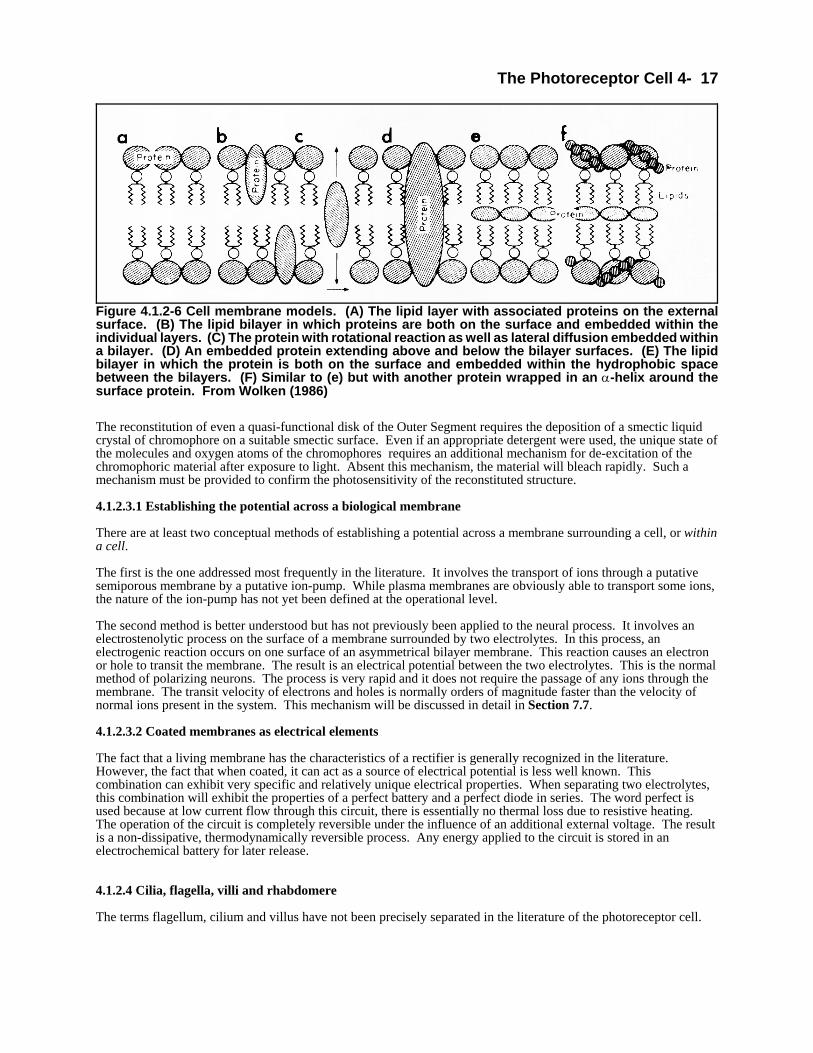
Based on the fundamental difference between a biological cell and a micelle, it is important to examine the nature ofthe surfaces of these elements. Figure 4.1.2-6 presents some alternative structures frequently seen in the literatureand related to the pharmacological aspects of vision. [This figure will be deleted in the next editing review. xxx] They also frequently appear in discussions of the synaptic junctions of neurons. They clearly apply to the cell withan external plasma membrane consisting of a bilayer of lipid material. It has not been shown that they apply to amicelle. It has not even been shown that these situations apply to an asymmetrical bilayer or that they apply to allareas of a given bilayer. There are major questions related to the electrical integrity of a bilayer that is penetrated byany material, such as represented in (d) of this figure. When discussing micelles, it is important to remember that theexterior wall is normally not a bilayer. If it is sufficiently flattened, small local areas may resemble a bilayer. However, the un-flattened ends define its true character. Adopting one of the forms shown in the above figure indiscussions of a visual disk requires considerable substantiation. First; the micelle wall is not a bilayer. Second; thefilm, although formed by an amphiphilic material, is not formed of a lipid. Third; it is not a living cell and does notrequire penetration by even simple biological materials for its operation. Fourth; there is no known functional ormetabolic reason for such a micelle to include protein material within it.
Much of the biochemical analysis of the Outer Segments has relied on techniques developed in the study of thesurface structure and constituency of cells. This includes the solubilization and reconstitution of these surfacefeatures27. The subject of receptorology has developed within this field. This subject refers to biological receptorson the surface of cells and does not relate directly to the field of vision. It will be shown in this work that it does notapply to signal transmission by the visual synapse either. Unfortunately, most of the solubilization andreconstitution processes in this field are not compatible with the liquid crystalline chromophores of vision. Thedetergents used in that field do not assure the reconstitution of a visual disk as found in the Outer Segment.
The Photoreceptor Cell 4- 17
Figure 4.1.2-6 Cell membrane models. (A) The lipid layer with associated proteins on the externalsurface. (B) The lipid bilayer in which proteins are both on the surface and embedded within theindividual layers. (C) The protein with rotational reaction as well as lateral diffusion embedded withina bilayer. (D) An embedded protein extending above and below the bilayer surfaces. (E) The lipidbilayer in which the protein is both on the surface and embedded within the hydrophobic spacebetween the bilayers. (F) Similar to (e) but with another protein wrapped in an α-helix around thesurface protein. From Wolken (1986)
The reconstitution of even a quasi-functional disk of the Outer Segment requires the deposition of a smectic liquidcrystal of chromophore on a suitable smectic surface. Even if an appropriate detergent were used, the unique state ofthe molecules and oxygen atoms of the chromophores requires an additional mechanism for de-excitation of thechromophoric material after exposure to light. Absent this mechanism, the material will bleach rapidly. Such amechanism must be provided to confirm the photosensitivity of the reconstituted structure.
4.1.2.3.1 Establishing the potential across a biological membrane
There are at least two conceptual methods of establishing a potential across a membrane surrounding a cell, or withina cell.
The first is the one addressed most frequently in the literature. It involves the transport of ions through a putativesemiporous membrane by a putative ion-pump. While plasma membranes are obviously able to transport some ions,the nature of the ion-pump has not yet been defined at the operational level.
The second method is better understood but has not previously been applied to the neural process. It involves anelectrostenolytic process on the surface of a membrane surrounded by two electrolytes. In this process, anelectrogenic reaction occurs on one surface of an asymmetrical bilayer membrane. This reaction causes an electronor hole to transit the membrane. The result is an electrical potential between the two electrolytes. This is the normalmethod of polarizing neurons. The process is very rapid and it does not require the passage of any ions through themembrane. The transit velocity of electrons and holes is normally orders of magnitude faster than the velocity ofnormal ions present in the system. This mechanism will be discussed in detail in Section 7.7.
4.1.2.3.2 Coated membranes as electrical elements
The fact that a living membrane has the characteristics of a rectifier is generally recognized in the literature. However, the fact that when coated, it can act as a source of electrical potential is less well known. Thiscombination can exhibit very specific and relatively unique electrical properties. When separating two electrolytes, this combination will exhibit the properties of a perfect battery and a perfect diode in series. The word perfect isused because at low current flow through this circuit, there is essentially no thermal loss due to resistive heating. The operation of the circuit is completely reversible under the influence of an additional external voltage. The resultis a non-dissipative, thermodynamically reversible process. Any energy applied to the circuit is stored in anelectrochemical battery for later release.
4.1.2.4 Cilia, flagella, villi and rhabdomere
The terms flagellum, cilium and villus have not been precisely separated in the literature of the photoreceptor cell.
18 Processes in Biological Vision
28Eakin, R. (1965) Evolution of photoreceptors. In Symposia on Quantitative Biology, vol XXX. NY: ColdSpring Harbor Laboratory pp 363-370
Using the definitions in the Merriam Webster Medical Dictionary, the term villus is constrained to an element of thevascular system. Both cilium and flagellum apply to hair like projections. A flagellum is always associated withmotion and a cilium is frequently associated with motion. However, a cilium is frequently associated with a sensorynerve ending.
In discussing the photoreceptor cell, the term cilium appears appropriate. The question is what does it apply to?In the general case, the cilium is a proteinaceous material, secreted by a cell, that transmits a structural strain to asensory nerve ending. This is the precise function of the coated disks of the outer segment. However, the “strain” (aquantum-mechanical excitation) is transmitted from the chromophoric coating of the cilium to the dendrite of theneuron. These dendritic structures, frequently called microtubules in the histological context, then pass through thecolax into the soma of the photoreceptor cell. In this analog, the cilium has evolved into the disk stack by breakingand extrusion from the calyx. The colax is not associated with the cilium. It is a passthrough supporting the neuralportion of the photoreceptor cell. The structures passing though the colax are the dendrites (frequently labeledmicrotubules) of the photoreceptor cell.
Akin introduced the term rhabdomere in 1963 to distinguish topographically between photoreceptor cells of twotypes. He describes his delineation as speculative and does not follow any recognizable phylogenic tree28. However,the terminology is now used quite widely. He derived two classes of photoreceptor cells, based on light microscopy,and employing a ciliary foundation and a none ciliary or rhabdomeric foundation. For the purposes of this work, therhabdomeric photoreceptors are found in Arthropoda and Mollusca. The others are found in Chordata. The termrhabdomere derives from the Greek for a bundle of cylindrical rods. It is generally applied to the type of cell and nota specific configuration of the secreted protein material.
4.1.2.5 Morphogenesis through phagocytosis
The processes of photosensing, transduction and translation in vision rely upon an unusually active process ofphysical generation and regeneration that may be unique in the neural system. There is an obvious initial stage ofmorphogenesis that creates the fundamental structure of the eye and generates the initial physical elements. In thepresence of disease, there are also mechanisms for isolating and digesting foreign material, usually defined asphagocytosis. However, the photoreceptor/IPM/RPE complex involves another chain of events involving genesisand phagocytosis that are not widely appreciated. There is an additional process of continual disk generation,chromophore deposition and subsequent phagocytosis and material recovery operating continuously within thiscomplex. Large numbers of new disks are generated every minute and all of the disks of the retina are replaced on aweekly basis in warm blooded chordates. This situation calls for additional nomenclature.
Anagenesis–The continual creation of new disks at the proximal end of the Outer Segment and their coating with achromophore in anticipation of operation.
Migration– The continual movement of each disk of each operational Outer Segment toward its distal end at a rateof 320 nm/hr for warm-blooded chordates.
Phagocytosis–As used here, the normal engulfing and digesting of the disks of the Outer Segment. This step isfollowed by the reclaiming of most of the amino acids and retinoids contained in those disks. Synonymous withendocytosis by an RPE cell. See Section 4.6.1.5.
Sloughing– A term encountered in the literature to describe the falling away of part of the Outer Segment prior to itsphagocytosis by the RPE cells. The term implies the part falling away is somehow isolated from the rest of thephotoreceptor cell and is no longer within the plasma membrane of the cell. This term concept is not supported inthis work. The Outer Segment is taken to be an extracellular structure secreted by the exocrine glandular capabilityof the photoreceptor cell. It is not surrounded by a plasma membrane!
4.1.2.6 Electrical currents, terminals and devices
4.1.2.6.1 Current versus electron flow
Figure 4.1.2-7 provides some important electrical terminology that will be relied upon in the electrical description of
The Photoreceptor Cell 4- 19
29Matsuura, T. Miller, W. & Tomita, T. (1977) Cone-specific c-wave in the turtle retina. Vision Res. vol. 18,pp 767-775
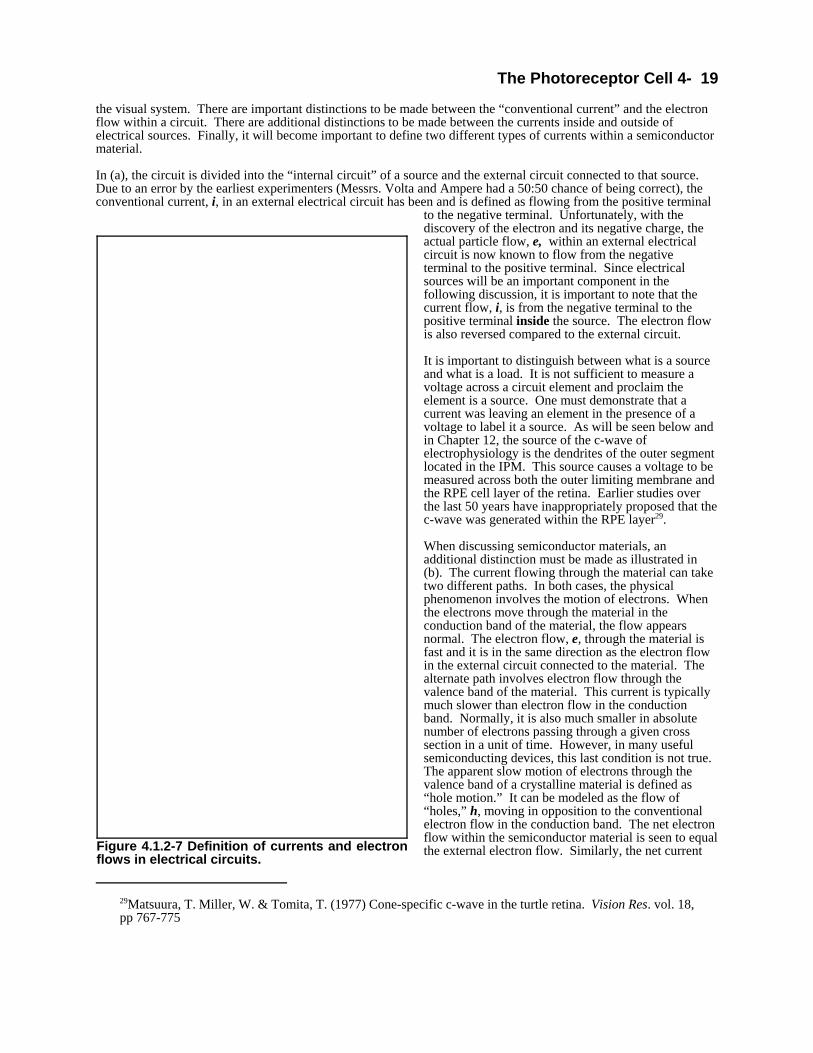
Figure 4.1.2-7 Definition of currents and electronflows in electrical circuits.
the visual system. There are important distinctions to be made between the “conventional current” and the electronflow within a circuit. There are additional distinctions to be made between the currents inside and outside ofelectrical sources. Finally, it will become important to define two different types of currents within a semiconductormaterial.
In (a), the circuit is divided into the “internal circuit” of a source and the external circuit connected to that source. Due to an error by the earliest experimenters (Messrs. Volta and Ampere had a 50:50 chance of being correct), theconventional current, i, in an external electrical circuit has been and is defined as flowing from the positive terminal
to the negative terminal. Unfortunately, with thediscovery of the electron and its negative charge, theactual particle flow, e, within an external electricalcircuit is now known to flow from the negativeterminal to the positive terminal. Since electricalsources will be an important component in thefollowing discussion, it is important to note that thecurrent flow, i, is from the negative terminal to thepositive terminal inside the source. The electron flowis also reversed compared to the external circuit.
It is important to distinguish between what is a sourceand what is a load. It is not sufficient to measure avoltage across a circuit element and proclaim theelement is a source. One must demonstrate that acurrent was leaving an element in the presence of avoltage to label it a source. As will be seen below andin Chapter 12, the source of the c-wave ofelectrophysiology is the dendrites of the outer segmentlocated in the IPM. This source causes a voltage to bemeasured across both the outer limiting membrane andthe RPE cell layer of the retina. Earlier studies overthe last 50 years have inappropriately proposed that thec-wave was generated within the RPE layer29.
When discussing semiconductor materials, anadditional distinction must be made as illustrated in(b). The current flowing through the material can taketwo different paths. In both cases, the physicalphenomenon involves the motion of electrons. Whenthe electrons move through the material in theconduction band of the material, the flow appearsnormal. The electron flow, e, through the material isfast and it is in the same direction as the electron flowin the external circuit connected to the material. Thealternate path involves electron flow through thevalence band of the material. This current is typicallymuch slower than electron flow in the conductionband. Normally, it is also much smaller in absolutenumber of electrons passing through a given crosssection in a unit of time. However, in many usefulsemiconducting devices, this last condition is not true. The apparent slow motion of electrons through thevalence band of a crystalline material is defined as“hole motion.” It can be modeled as the flow of“holes,” h, moving in opposition to the conventionalelectron flow in the conduction band. The net electronflow within the semiconductor material is seen to equalthe external electron flow. Similarly, the net current

20 Processes in Biological Vision
within the material is seen to equal the external current. Holes play an important role in the operation of neurons.
4.1.2.6.2 Terminals of relevant devices
A second set of terms relates to the internal and external terminals of the neuron and the Activa. These involve thethree terminals associated with each Activa and each neuron.
The similarity of the Activa and the Transistor makes it appropriate to adopt similar names for their terminals toavoid confusion. From a quantum-physics viewpoint, they are functionally identical.
From a signal perspective, the fundamental neuron can be considered a three terminal black box with at least oneActiva inside of it. The poda is an area on the surface of the external neuron membrane where current is observed toleave or enter the cell concurrently with other currents entering or leaving a dendrite or axon. It would be consideredthe “common” connection in most analogous man-made circuits. In each case, there may be electrical impedanceslocated between the internal terminal of an Activa and the corresponding external terminal of the neuron. Theconductive impedances are electrolytic in nature and do not involve metallic paths.
The fundamental neuron has three additional terminals besides those discussed above. These have to do with thepower sources involved in the overall neuron. Figure 4.1.2-8 provides a diagram defining all six of the fundamentalterminals. Each of the three signal handling structures, the dendrite, the axon and the poda have a power sourceassociated with it. These power sources are all connected to the interneural plasma. They derive power from redoxreactions occurring on each side of the cell membrane. Note that the signal input terminals of the dendrite are shownwith a hollow diode (a white center) to indicate it is reverse biased in the absence of an external, transistor based,connection. Therefore, no current passes through the dendroplasm, this “open” connection, to the interneural plasmain the absence of a separate mechanism.
In the case of the photoreceptor cell, the networks shown as #1 are replicated nine times and converted intoindividual Activas. When modified morphologically as part of the replication process, these individual structures are converted into the microtubules extending from the Inner Segment to the Outer Segment of the photoreceptorcell. As a result of this action, the photoreceptor cell is seen to consist of a number of individual signaling paths,containing their own Activa, converging on a second Activa within the same cell. This more complex circuit will bepresented in Section 4.7. The detailed operation of this circuit will be discussed in detail in Section 9.2.3 andChapter 12.
Each Activa exhibits a unique electronic phenomena known as the “transistor effect.” This effect is only realizedwhen two rectifying devices are connected back to back and share a common region of a very small but finite size. In addition, one of the devices must be electrically biased so as to conduct current while the other device is biased tooppose the flow of current. Under these conditions, a charge or current introduced at the emitter terminal (associatedwith the conducting device) will appear at the collector terminal even though the collector is biased to opposecurrent flow. The result of this process can be signal (although not necessarily current) amplification.
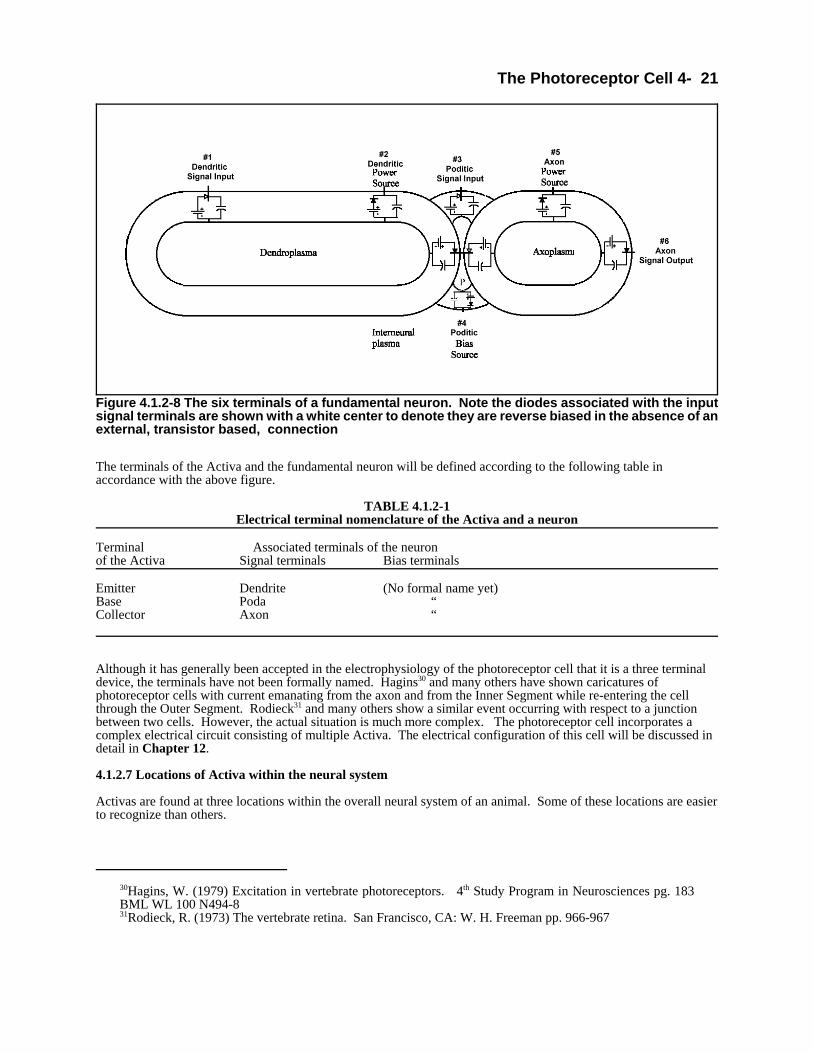
The Photoreceptor Cell 4- 21
30Hagins, W. (1979) Excitation in vertebrate photoreceptors. 4th Study Program in Neurosciences pg. 183BML WL 100 N494-831Rodieck, R. (1973) The vertebrate retina. San Francisco, CA: W. H. Freeman pp. 966-967
Figure 4.1.2-8 The six terminals of a fundamental neuron. Note the diodes associated with the inputsignal terminals are shown with a white center to denote they are reverse biased in the absence of anexternal, transistor based, connection
The terminals of the Activa and the fundamental neuron will be defined according to the following table inaccordance with the above figure.
TABLE 4.1.2-1Electrical terminal nomenclature of the Activa and a neuron
Terminal Associated terminals of the neuronof the Activa Signal terminals Bias terminals
Emitter Dendrite (No formal name yet)Base Poda “Collector Axon “
Although it has generally been accepted in the electrophysiology of the photoreceptor cell that it is a three terminaldevice, the terminals have not been formally named. Hagins30 and many others have shown caricatures ofphotoreceptor cells with current emanating from the axon and from the Inner Segment while re-entering the cellthrough the Outer Segment. Rodieck31 and many others show a similar event occurring with respect to a junctionbetween two cells. However, the actual situation is much more complex. The photoreceptor cell incorporates acomplex electrical circuit consisting of multiple Activa. The electrical configuration of this cell will be discussed indetail in Chapter 12.
4.1.2.7 Locations of Activa within the neural system
Activas are found at three locations within the overall neural system of an animal. Some of these locations are easierto recognize than others.
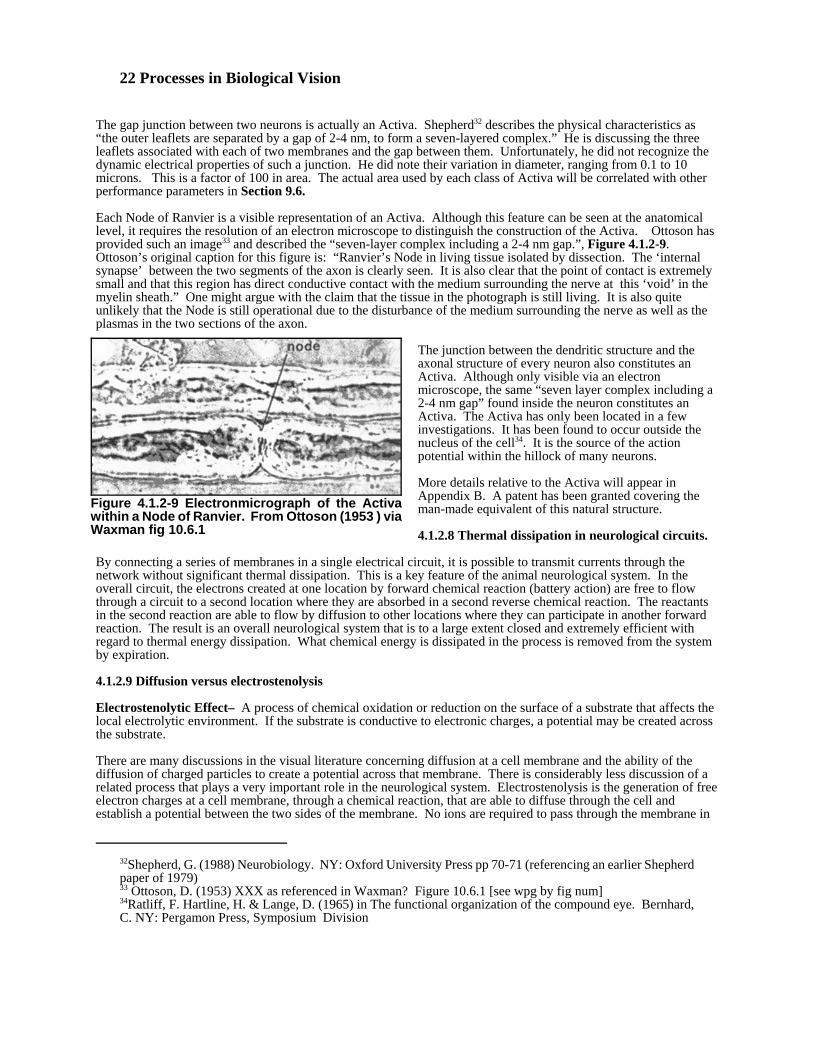
22 Processes in Biological Vision
32Shepherd, G. (1988) Neurobiology. NY: Oxford University Press pp 70-71 (referencing an earlier Shepherdpaper of 1979)33 Ottoson, D. (1953) XXX as referenced in Waxman? Figure 10.6.1 [see wpg by fig num]34Ratliff, F. Hartline, H. & Lange, D. (1965) in The functional organization of the compound eye. Bernhard,C. NY: Pergamon Press, Symposium Division
Figure 4.1.2-9 Electronmicrograph of the Activawithin a Node of Ranvier. From Ottoson (1953 ) viaWaxman fig 10.6.1
The gap junction between two neurons is actually an Activa. Shepherd32 describes the physical characteristics as“the outer leaflets are separated by a gap of 2-4 nm, to form a seven-layered complex.” He is discussing the threeleaflets associated with each of two membranes and the gap between them. Unfortunately, he did not recognize thedynamic electrical properties of such a junction. He did note their variation in diameter, ranging from 0.1 to 10microns. This is a factor of 100 in area. The actual area used by each class of Activa will be correlated with otherperformance parameters in Section 9.6.
Each Node of Ranvier is a visible representation of an Activa. Although this feature can be seen at the anatomicallevel, it requires the resolution of an electron microscope to distinguish the construction of the Activa. Ottoson hasprovided such an image33 and described the “seven-layer complex including a 2-4 nm gap.”, Figure 4.1.2-9. Ottoson’s original caption for this figure is: “Ranvier’s Node in living tissue isolated by dissection. The ‘internalsynapse’ between the two segments of the axon is clearly seen. It is also clear that the point of contact is extremelysmall and that this region has direct conductive contact with the medium surrounding the nerve at this ‘void’ in themyelin sheath.” One might argue with the claim that the tissue in the photograph is still living. It is also quiteunlikely that the Node is still operational due to the disturbance of the medium surrounding the nerve as well as theplasmas in the two sections of the axon.
The junction between the dendritic structure and theaxonal structure of every neuron also constitutes anActiva. Although only visible via an electronmicroscope, the same “seven layer complex including a2-4 nm gap” found inside the neuron constitutes anActiva. The Activa has only been located in a fewinvestigations. It has been found to occur outside the nucleus of the cell34. It is the source of the actionpotential within the hillock of many neurons.
More details relative to the Activa will appear inAppendix B. A patent has been granted covering theman-made equivalent of this natural structure.
4.1.2.8 Thermal dissipation in neurological circuits.
By connecting a series of membranes in a single electrical circuit, it is possible to transmit currents through thenetwork without significant thermal dissipation. This is a key feature of the animal neurological system. In theoverall circuit, the electrons created at one location by forward chemical reaction (battery action) are free to flowthrough a circuit to a second location where they are absorbed in a second reverse chemical reaction. The reactantsin the second reaction are able to flow by diffusion to other locations where they can participate in another forwardreaction. The result is an overall neurological system that is to a large extent closed and extremely efficient withregard to thermal energy dissipation. What chemical energy is dissipated in the process is removed from the systemby expiration.
4.1.2.9 Diffusion versus electrostenolysis
Electrostenolytic Effect– A process of chemical oxidation or reduction on the surface of a substrate that affects thelocal electrolytic environment. If the substrate is conductive to electronic charges, a potential may be created acrossthe substrate.
There are many discussions in the visual literature concerning diffusion at a cell membrane and the ability of thediffusion of charged particles to create a potential across that membrane. There is considerably less discussion of arelated process that plays a very important role in the neurological system. Electrostenolysis is the generation of freeelectron charges at a cell membrane, through a chemical reaction, that are able to diffuse through the cell andestablish a potential between the two sides of the membrane. No ions are required to pass through the membrane in
The Photoreceptor Cell 4- 23
this process. Both of these processes are important in the operation of the neurological system.
4.1.2.10 Definition of the OS/IS interface
In the past, it has been conventional to consider the OS and IS adjacent internal parts of a single photoreceptor cell. In this interpretation, a group of cilia was found to exit the cell membrane at one point near the OS/IS demarcationand either disappear or re-enter the cell membrane again. Where the group of cilia left the cell membrane hasgenerally been called the colax but has been described by a variety of other names. These include the ciliary stalk,ciliary transport and calyx. In this work, the root calyx takes on a more significant meaning. Therefore, thestructure surrounding the cilia at the point where they leave the cell membrane will be called the colax. The namecalyx will be reserved for the larger collar or lip of the cup forming the distal end of the IS. This calyx acts as anextrusion die associated with the above extrusion cup. The die forms the furrows in which the dendrites from theciliary transport, i.e., colax, are placed.
4.1.2.11 Dimensions at the atomic and molecular level
It is important to recognize there are no sharp corners at the molecular and atomic levels of material. It is verydifficult to define the edges of various surfaces, which are generally quantum-electronic in nature, and to define thecentroid of a given feature based on those edges. In this Chapter, all numeric values should be considered nominalor mean values subject to an error term. In general, two decimal digit accuracy is the best that can be specified in theabsence of very specific definitions of surface or edge locations and supporting statistical calculations. Most authorsquoted here have not provided either detailed definitions or adequate statistical data to support more accuratenumerics.
4.1.3 Additional glossary entries
The previous section has defined a wide variety of terms. This section includes additional miscellaneous definitions.
Lipofuscin– A generic term for age-related lysosomal residual bodies of classical pathology and cell biology(Eldred, 1982). The material is generally identified via light microscopy. It is usually characterized by itsfluorescence using a large area aperture that integrates light from many smaller sources. The typical spectrum isbroad 540-640 nm but is historically quantified at 470 nm. In the case of RPE cells, the material is an aggregate ofpigment granules and other materials.
There are a variety of terms in the literature used to describe the components of the photoreceptor cell. Most of themstem from light microscope-based morphology. The following table proposes alternate names for several of thesecomponents based on their function.
OLD NAME PROPOSED NAME FUNCTION
Calyx Calyx Extrusion of the outer segment disksCiliary Stalk \Cilium / Dendritic Bundle Dendritic Path from Is to OSCilium Transport Colax (dendritic Channel) Channel enclosing Den. Bundle
Microtubules Dendrites (or item in dendrites) Sensing State of ChromophoresOuter Segment Photon Detection/Nerve Excitation
Midget Bipolar Cells Analog summing neuronsHorizontal Cells Analog differencing neuronsMost amercine cells “Ganglion Cells Analog to Pulse encoding neuronsStellate Cells Pulse to analog decoding neuronsNode of Ranvier Signal repeater internal to an axon
Ribbon, axonal Conduit, axonal Electrical channel to gap junction
Gap Base region of an Activa
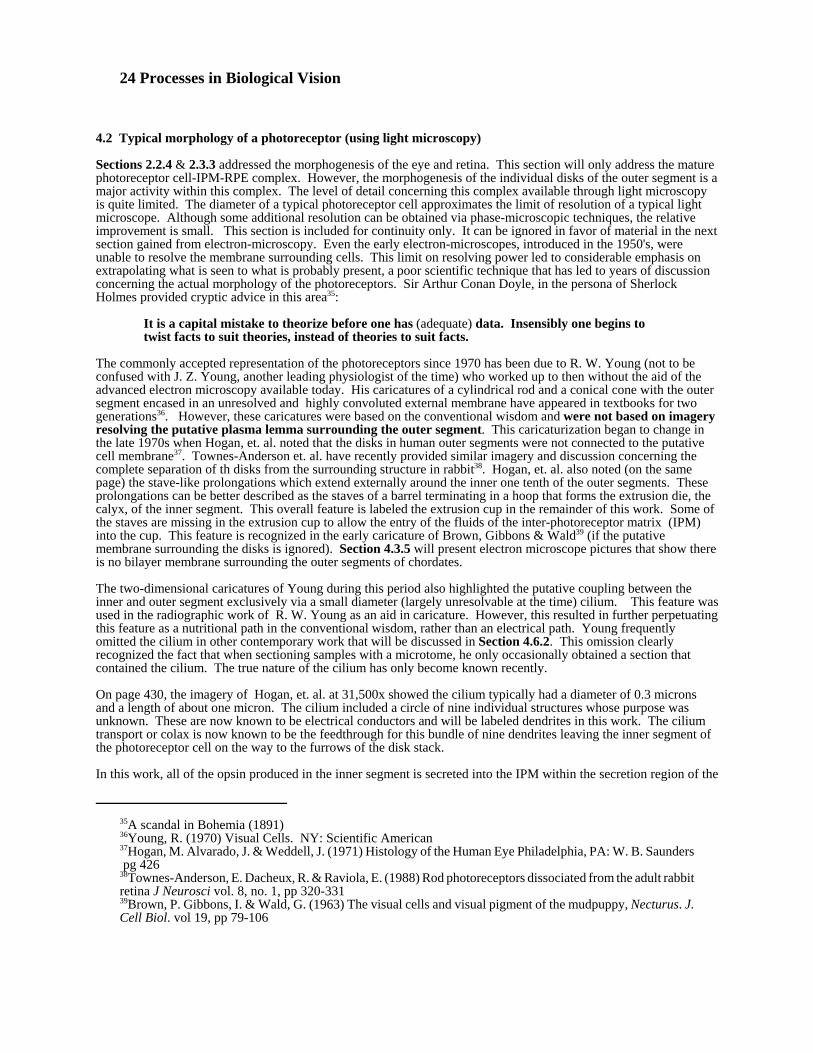
24 Processes in Biological Vision
35A scandal in Bohemia (1891)36Young, R. (1970) Visual Cells. NY: Scientific American37Hogan, M. Alvarado, J. & Weddell, J. (1971) Histology of the Human Eye Philadelphia, PA: W. B. Saunders pg 42638Townes-Anderson, E. Dacheux, R. & Raviola, E. (1988) Rod photoreceptors dissociated from the adult rabbitretina J Neurosci vol. 8, no. 1, pp 320-33139Brown, P. Gibbons, I. & Wald, G. (1963) The visual cells and visual pigment of the mudpuppy, Necturus. J.Cell Biol. vol 19, pp 79-106
4.2 Typical morphology of a photoreceptor (using light microscopy)
Sections 2.2.4 & 2.3.3 addressed the morphogenesis of the eye and retina. This section will only address the maturephotoreceptor cell-IPM-RPE complex. However, the morphogenesis of the individual disks of the outer segment is amajor activity within this complex. The level of detail concerning this complex available through light microscopyis quite limited. The diameter of a typical photoreceptor cell approximates the limit of resolution of a typical lightmicroscope. Although some additional resolution can be obtained via phase-microscopic techniques, the relativeimprovement is small. This section is included for continuity only. It can be ignored in favor of material in the nextsection gained from electron-microscopy. Even the early electron-microscopes, introduced in the 1950's, wereunable to resolve the membrane surrounding cells. This limit on resolving power led to considerable emphasis onextrapolating what is seen to what is probably present, a poor scientific technique that has led to years of discussionconcerning the actual morphology of the photoreceptors. Sir Arthur Conan Doyle, in the persona of SherlockHolmes provided cryptic advice in this area35:
It is a capital mistake to theorize before one has (adequate) data. Insensibly one begins totwist facts to suit theories, instead of theories to suit facts.
The commonly accepted representation of the photoreceptors since 1970 has been due to R. W. Young (not to beconfused with J. Z. Young, another leading physiologist of the time) who worked up to then without the aid of theadvanced electron microscopy available today. His caricatures of a cylindrical rod and a conical cone with the outersegment encased in an unresolved and highly convoluted external membrane have appeared in textbooks for twogenerations36. However, these caricatures were based on the conventional wisdom and were not based on imageryresolving the putative plasma lemma surrounding the outer segment. This caricaturization began to change inthe late 1970s when Hogan, et. al. noted that the disks in human outer segments were not connected to the putativecell membrane37. Townes-Anderson et. al. have recently provided similar imagery and discussion concerning thecomplete separation of th disks from the surrounding structure in rabbit38. Hogan, et. al. also noted (on the samepage) the stave-like prolongations which extend externally around the inner one tenth of the outer segments. Theseprolongations can be better described as the staves of a barrel terminating in a hoop that forms the extrusion die, thecalyx, of the inner segment. This overall feature is labeled the extrusion cup in the remainder of this work. Some ofthe staves are missing in the extrusion cup to allow the entry of the fluids of the inter-photoreceptor matrix (IPM)into the cup. This feature is recognized in the early caricature of Brown, Gibbons & Wald39 (if the putativemembrane surrounding the disks is ignored). Section 4.3.5 will present electron microscope pictures that show thereis no bilayer membrane surrounding the outer segments of chordates.
The two-dimensional caricatures of Young during this period also highlighted the putative coupling between theinner and outer segment exclusively via a small diameter (largely unresolvable at the time) cilium. This feature wasused in the radiographic work of R. W. Young as an aid in caricature. However, this resulted in further perpetuatingthis feature as a nutritional path in the conventional wisdom, rather than an electrical path. Young frequentlyomitted the cilium in other contemporary work that will be discussed in Section 4.6.2. This omission clearlyrecognized the fact that when sectioning samples with a microtome, he only occasionally obtained a section thatcontained the cilium. The true nature of the cilium has only become known recently.
On page 430, the imagery of Hogan, et. al. at 31,500x showed the cilium typically had a diameter of 0.3 micronsand a length of about one micron. The cilium included a circle of nine individual structures whose purpose wasunknown. These are now known to be electrical conductors and will be labeled dendrites in this work. The ciliumtransport or colax is now known to be the feedthrough for this bundle of nine dendrites leaving the inner segment ofthe photoreceptor cell on the way to the furrows of the disk stack.
In this work, all of the opsin produced in the inner segment is secreted into the IPM within the secretion region of the

The Photoreceptor Cell 4- 25
40Laughlin, S. (1981) in Handbook of Sensory Physiology. vol. VII/6B, NY: Springer-Verlag pp. 263-26641Zeki, S. (1993) A Vision of the Brain. Oxford: Blackwell Scientific Publications. pg 642Thurm, U. (1974) in Jaenicke,L. ed. Biochemistry of Sensory Functions. NY: Springer-Verlag, pp 367-38943Autrum, H. ed. (1979) Comparative Physiology and Evolution of Vision in Invertebrates, A: InvertebratePhotoreceptors. NY: Springer-Verlag, pp 609-XXX44Eakin, R. & Kuda, A. (1971) Ultrastructure of sensory receptors in ascidian tadpoles. Z. Zellforsch. vol. 112,pp 287-312
extrusion cup. Several authors have noted the prodigious production rate of opsin required to maintain the disks inthe outer segment in the face of phagocytosis by the RPE. The cross sectional area of the colax is less than onefortieth of the diameter of the disks. If the Golgi apparatus, the mitochondria and the secretion region of the innersegment must work mightily to produce sufficient opsin, imagine the flow rate of opsin through the small area of thecolax that would have to be maintained under Young’s conceptualization.
4.2.1 Photoreceptors of Chordata versus those of Arthropoda and Mollusca
The photoreceptors in the chordate retina are topologically similar to those in the retinula of arthropods andmolluscs. The major difference between them is topographical. This difference leads to small physiologicaldifferences as well. Both types of differences are discussed in this section. Laughlin40 provides a summarydiscussion of the common principles between the two systems after a broad discussion of more than 100 pages. Hissummary stresses the commonality of processes in animal vision and does not support the signal polarity differenceassumed by many (and frequently credited to him). There are many differences between the interpretation of thiswork and his at the detailed level. His work assumes chemical synapses except “(Limulus is an exception to this).” He also stresses the dense packing of the photo-pigments. This is true at the light microscope level of morphologybut is not true at the level of cytology and quantum mechanics. Similarly, he discusses the transducer function in abulk sense whereas here it will be subdivided into more discrete processes.
Laughlin and many others have adopted a lexicon based on some terms defined by Eakin. These terms inmorphology suffer from the same problem as “the poverty of our neural language” proclaimed by Zeki41. In thiscase, the terms flagellum, cilium and villus have not been precisely separated. See Section 4.1.2.4.
4.2.1.1 Morphological differences
Figure 4.2.1-1 provides a collage highlighting the primary differences between the chordate and non chordatephotoreceptor cells. The variety at the detailed level among species can be amazing. The figure can be compared tothe figure of Thurm42, who trace the structure all of the way back to Planaria, and the discussion and references inAutrum43. However, a key element in the discussion should be one of the invertebrate chordates, the tunicates. Eakin & Kuda have provided interesting electron micrographs of this animal that place it as an intermediary betweenMollusca and the remainder of Chordata44. The disks of Chordata are generally assumed to be formed serially bysecretion from a single region of the IS, followed by bending and extrusion to form disks aligned with their surfaceperpendicular to the axis of the inner segment. In Mollusca, the photosensitive surfaces appear to be formed by thecreation of multiple filaments that extend radially from a central column. However, the resulting surfaces are stillperpendicular to the axis of the bulk of the inner segment. In the case of the tunicate tadpole, the photosensitivesurfaces are formed from multiple secretion sites, as in the case of the Mollusca, but are not bent and extruded as inthe case of other members of Chordata. In the “retina” of the tunicate tadpole, the laminas of

26 Processes in Biological Vision
Figure 4.2.1-1 Major differences between the photoreceptor cells of Chordata and Mollusca andshowing the intermediate state represented by the tadpole of tunicate. Left; outer portion of Molluscaphotoreceptor from Goldsmith (1973) merged with inner segment of this work for purposes oforientation. Right; photoreceptor of Chordata from this work. Top; photoreceptor of ascidian tadpolefrom Eakin and Kuda, 1971. In all cases, the irradiance is applied perpendicular to the chromophorecoated substrates. Whereas both Mollusca and the tunicates employ multiple filament secretingvesicles, it is not known whether this approach to disk formation is used in Chordata.
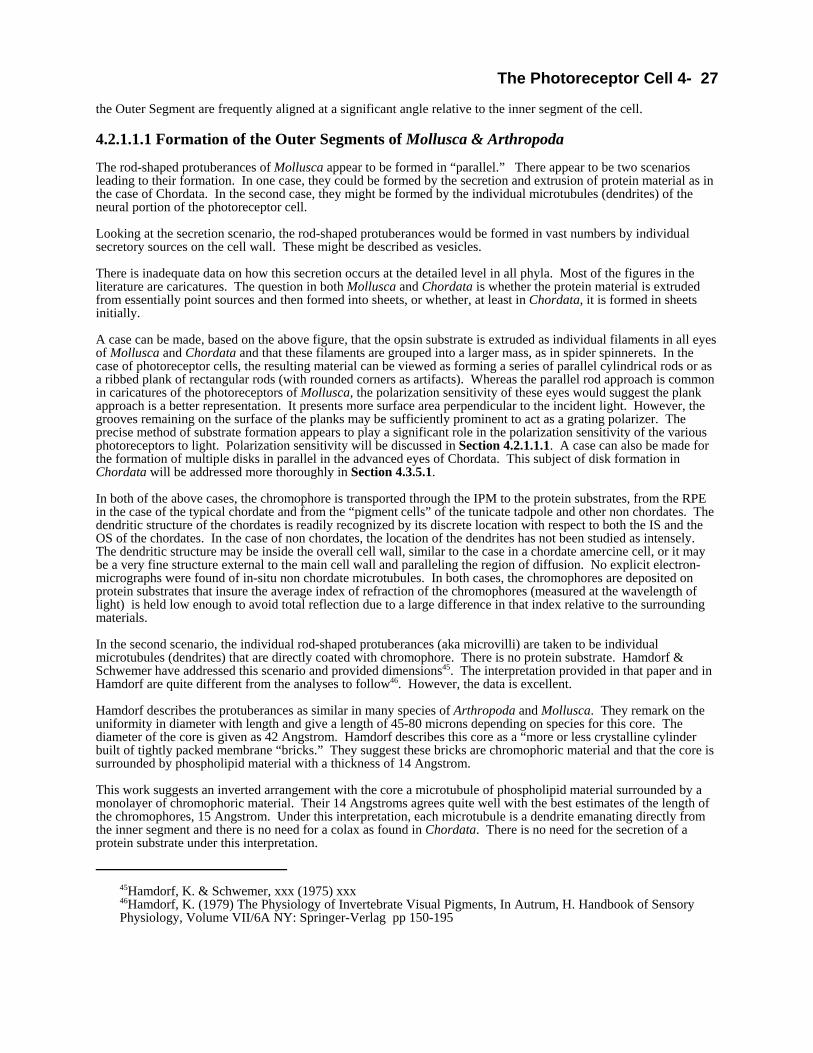
The Photoreceptor Cell 4- 27
45Hamdorf, K. & Schwemer, xxx (1975) xxx 46Hamdorf, K. (1979) The Physiology of Invertebrate Visual Pigments, In Autrum, H. Handbook of SensoryPhysiology, Volume VII/6A NY: Springer-Verlag pp 150-195
the Outer Segment are frequently aligned at a significant angle relative to the inner segment of the cell.
4.2.1.1.1 Formation of the Outer Segments of Mollusca & Arthropoda
The rod-shaped protuberances of Mollusca appear to be formed in “parallel.” There appear to be two scenariosleading to their formation. In one case, they could be formed by the secretion and extrusion of protein material as inthe case of Chordata. In the second case, they might be formed by the individual microtubules (dendrites) of theneural portion of the photoreceptor cell.
Looking at the secretion scenario, the rod-shaped protuberances would be formed in vast numbers by individualsecretory sources on the cell wall. These might be described as vesicles.
There is inadequate data on how this secretion occurs at the detailed level in all phyla. Most of the figures in theliterature are caricatures. The question in both Mollusca and Chordata is whether the protein material is extrudedfrom essentially point sources and then formed into sheets, or whether, at least in Chordata, it is formed in sheetsinitially.
A case can be made, based on the above figure, that the opsin substrate is extruded as individual filaments in all eyesof Mollusca and Chordata and that these filaments are grouped into a larger mass, as in spider spinnerets. In thecase of photoreceptor cells, the resulting material can be viewed as forming a series of parallel cylindrical rods or asa ribbed plank of rectangular rods (with rounded corners as artifacts). Whereas the parallel rod approach is commonin caricatures of the photoreceptors of Mollusca, the polarization sensitivity of these eyes would suggest the plankapproach is a better representation. It presents more surface area perpendicular to the incident light. However, thegrooves remaining on the surface of the planks may be sufficiently prominent to act as a grating polarizer. Theprecise method of substrate formation appears to play a significant role in the polarization sensitivity of the variousphotoreceptors to light. Polarization sensitivity will be discussed in Section 4.2.1.1.1. A case can also be made forthe formation of multiple disks in parallel in the advanced eyes of Chordata. This subject of disk formation inChordata will be addressed more thoroughly in Section 4.3.5.1.
In both of the above cases, the chromophore is transported through the IPM to the protein substrates, from the RPEin the case of the typical chordate and from the “pigment cells” of the tunicate tadpole and other non chordates. Thedendritic structure of the chordates is readily recognized by its discrete location with respect to both the IS and theOS of the chordates. In the case of non chordates, the location of the dendrites has not been studied as intensely. The dendritic structure may be inside the overall cell wall, similar to the case in a chordate amercine cell, or it maybe a very fine structure external to the main cell wall and paralleling the region of diffusion. No explicit electron-micrographs were found of in-situ non chordate microtubules. In both cases, the chromophores are deposited onprotein substrates that insure the average index of refraction of the chromophores (measured at the wavelength oflight) is held low enough to avoid total reflection due to a large difference in that index relative to the surroundingmaterials.
In the second scenario, the individual rod-shaped protuberances (aka microvilli) are taken to be individualmicrotubules (dendrites) that are directly coated with chromophore. There is no protein substrate. Hamdorf &Schwemer have addressed this scenario and provided dimensions45. The interpretation provided in that paper and inHamdorf are quite different from the analyses to follow46. However, the data is excellent.
Hamdorf describes the protuberances as similar in many species of Arthropoda and Mollusca. They remark on theuniformity in diameter with length and give a length of 45-80 microns depending on species for this core. Thediameter of the core is given as 42 Angstrom. Hamdorf describes this core as a “more or less crystalline cylinderbuilt of tightly packed membrane “bricks.” They suggest these bricks are chromophoric material and that the core issurrounded by phospholipid material with a thickness of 14 Angstrom.
This work suggests an inverted arrangement with the core a microtubule of phospholipid material surrounded by amonolayer of chromophoric material. Their 14 Angstroms agrees quite well with the best estimates of the length ofthe chromophores, 15 Angstrom. Under this interpretation, each microtubule is a dendrite emanating directly fromthe inner segment and there is no need for a colax as found in Chordata. There is no need for the secretion of aprotein substrate under this interpretation.
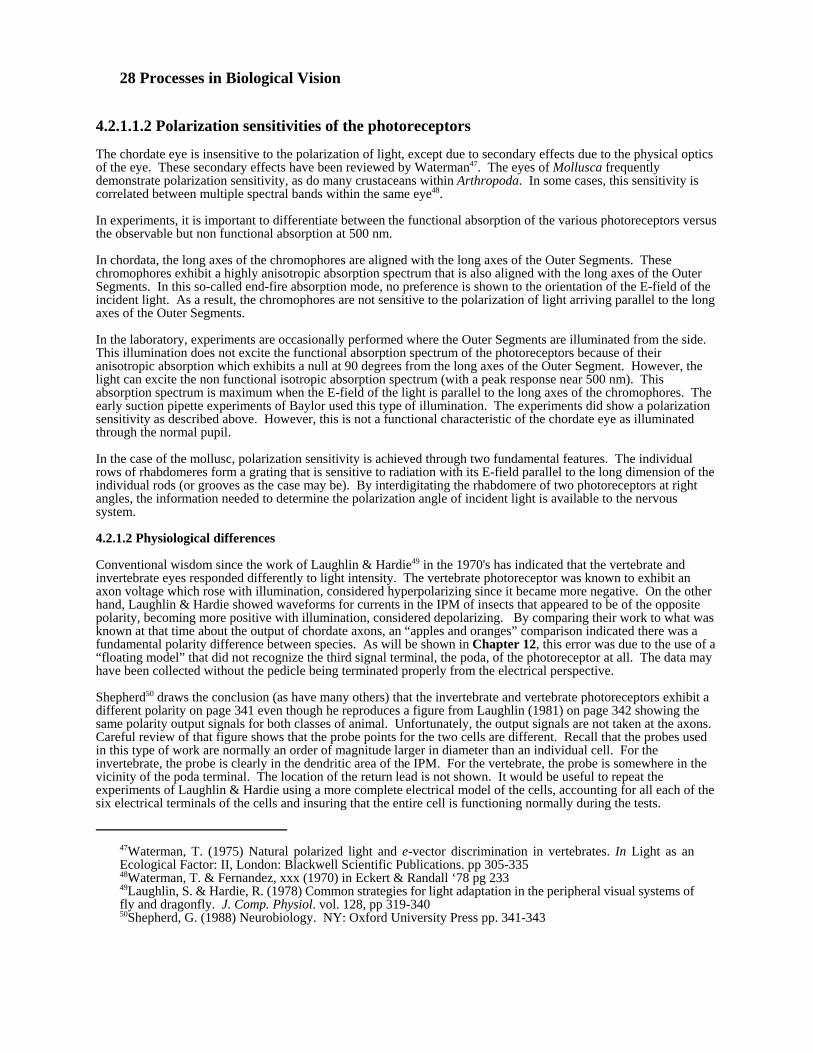
28 Processes in Biological Vision
47Waterman, T. (1975) Natural polarized light and e-vector discrimination in vertebrates. In Light as anEcological Factor: II, London: Blackwell Scientific Publications. pp 305-33548Waterman, T. & Fernandez, xxx (1970) in Eckert & Randall ‘78 pg 23349Laughlin, S. & Hardie, R. (1978) Common strategies for light adaptation in the peripheral visual systems offly and dragonfly. J. Comp. Physiol. vol. 128, pp 319-340 50Shepherd, G. (1988) Neurobiology. NY: Oxford University Press pp. 341-343
4.2.1.1.2 Polarization sensitivities of the photoreceptors
The chordate eye is insensitive to the polarization of light, except due to secondary effects due to the physical opticsof the eye. These secondary effects have been reviewed by Waterman47. The eyes of Mollusca frequentlydemonstrate polarization sensitivity, as do many crustaceans within Arthropoda. In some cases, this sensitivity iscorrelated between multiple spectral bands within the same eye48.
In experiments, it is important to differentiate between the functional absorption of the various photoreceptors versusthe observable but non functional absorption at 500 nm.
In chordata, the long axes of the chromophores are aligned with the long axes of the Outer Segments. Thesechromophores exhibit a highly anisotropic absorption spectrum that is also aligned with the long axes of the OuterSegments. In this so-called end-fire absorption mode, no preference is shown to the orientation of the E-field of theincident light. As a result, the chromophores are not sensitive to the polarization of light arriving parallel to the longaxes of the Outer Segments.
In the laboratory, experiments are occasionally performed where the Outer Segments are illuminated from the side. This illumination does not excite the functional absorption spectrum of the photoreceptors because of theiranisotropic absorption which exhibits a null at 90 degrees from the long axes of the Outer Segment. However, thelight can excite the non functional isotropic absorption spectrum (with a peak response near 500 nm). Thisabsorption spectrum is maximum when the E-field of the light is parallel to the long axes of the chromophores. Theearly suction pipette experiments of Baylor used this type of illumination. The experiments did show a polarizationsensitivity as described above. However, this is not a functional characteristic of the chordate eye as illuminatedthrough the normal pupil.
In the case of the mollusc, polarization sensitivity is achieved through two fundamental features. The individualrows of rhabdomeres form a grating that is sensitive to radiation with its E-field parallel to the long dimension of theindividual rods (or grooves as the case may be). By interdigitating the rhabdomere of two photoreceptors at rightangles, the information needed to determine the polarization angle of incident light is available to the nervoussystem.
4.2.1.2 Physiological differences
Conventional wisdom since the work of Laughlin & Hardie49 in the 1970's has indicated that the vertebrate andinvertebrate eyes responded differently to light intensity. The vertebrate photoreceptor was known to exhibit anaxon voltage which rose with illumination, considered hyperpolarizing since it became more negative. On the otherhand, Laughlin & Hardie showed waveforms for currents in the IPM of insects that appeared to be of the oppositepolarity, becoming more positive with illumination, considered depolarizing. By comparing their work to what wasknown at that time about the output of chordate axons, an “apples and oranges” comparison indicated there was afundamental polarity difference between species. As will be shown in Chapter 12, this error was due to the use of a“floating model” that did not recognize the third signal terminal, the poda, of the photoreceptor at all. The data mayhave been collected without the pedicle being terminated properly from the electrical perspective.
Shepherd50 draws the conclusion (as have many others) that the invertebrate and vertebrate photoreceptors exhibit adifferent polarity on page 341 even though he reproduces a figure from Laughlin (1981) on page 342 showing thesame polarity output signals for both classes of animal. Unfortunately, the output signals are not taken at the axons. Careful review of that figure shows that the probe points for the two cells are different. Recall that the probes usedin this type of work are normally an order of magnitude larger in diameter than an individual cell. For theinvertebrate, the probe is clearly in the dendritic area of the IPM. For the vertebrate, the probe is somewhere in thevicinity of the poda terminal. The location of the return lead is not shown. It would be useful to repeat theexperiments of Laughlin & Hardie using a more complete electrical model of the cells, accounting for all each of thesix electrical terminals of the cells and insuring that the entire cell is functioning normally during the tests.
The Photoreceptor Cell 4- 29
51Van Sluyters, R. Atkinson, J. Banks, M. Held, R. Hoffmann, K, & Shatz, C. (1990) The development of visionand visual perception, In, Visual Perception, Spillmann, L. & Werner, J. Eds. NY: Academic Press. pp. 374-37752Hendrickson, A. & Yuodelis, C. (1984) The morphological development of the human fovea.Ophthalmology, vol. 91, pp. 603-61253Banks, M. & Bennett, P. (1988) Optical and photoreceptor immaturities limit the spatial and chromatic visionof human neonates. J. Opt. Soc. Am. vol. 5, pp 2059-207954Fliesler, S. & Anderson, R. (1983) Chemistry and metabolism of lipids in the vertebrate retina. Prog. LipidRes. vol. 22, pp 79-13155Holtzman, xxx. (1975 xxx In Weissmann,G. & Claiborne, R. ed. Cell Membranes: Biochemistry, Cell Biology& Pathology. NY: HP Publishing Co. Chap 16, pg 16556West, R. & Dowling, J. (1975) Anatomical evidence for cone and rod-like receptors in the gray squirrel,ground squirrel and prairie dog retinas J Comp Neurol vol. 159, pp 439-46057Young, R. ( 1967) The renewal of photoreceptor cell outer segments. J. Cell Biol. vol. 33, pp. 61-72 [[check this reference in the original]]
All photoreceptors exhibit a current entering the poda connection of the cell. The total current entering the poda isnominally a constant under physiological conditions. In the absence of illumination, there is no current exiting thecell via the IPM. The IPM near the OS will exhibit a zero potential relative to the IPM in the vicinity of the poda. On the other hand, there is a large current exiting the axon and flowing into the INM. The current exiting the axonestablishes the quiescent voltage level of the axoplasma relative to the poda. Under physiological conditions, thevoltage remains considerably below the negative voltage supply of the axon. Upon illumination, current begins toexit the cell through the adaptation amplifier and into the IPM. This current causes the voltage of the IPM near thedendritic tissue to rise relative to the voltage of the IPM near the poda. Simultaneously, the current exiting the axonis reduced by a similar amount. This causes the axon voltage to rise toward the supply voltage and become morenegative.
4.2.2 Typical photoreceptor of Chordata
Van sluyters, et. al51. have provided a discussion incorporating two important drawings defining the externalcharacteristics of chordate photoreceptors in vivo. The caricature from Hendrickson & Yuodelis52 stresses thecurved nature of the axon segment, labeled the Fiber of Henle, and the curvature between the IS and the OS fortypical photoreceptors not located within the fovea. The other caricature from Banks & Bennett53 stresses theuniform diameter of the OS, and the IS, in a so-called foveal cone of a human. The OS is shown as a true cylinderwith a constant diameter of 1.2 microns over a length of 50 microns. The IS is shown as an extended cone with ataper of only 2 percent (diameter varying from 1.9 to 1.2 microns over a distance of 32 microns). This caricaturealso shows the “cones” of neonates as having a much larger diameter, but shorter length, IS while the OS remains ata constant diameter of 1.2 microns as it grows from an initial length of near 3.1 microns.
Recognizing the similarities and differences developed above, Figure 4.2.2-1 will serve as a typical caricature of aphotoreceptor positioned within a larger context. It bares a family resemblance to a figure by Fliesler & Anderson54. It is also similar to a simpler caricature by Holtzman, except the line surrounding the disks does not represent aplasma membrane55. Holtzman shows all of the disks as independent of any surrounding structure. Because of thecomplexity of the figure, an exploded view of the same cell will be presented later in this section. This caricaturewill be further developed into a block diagram and then further into a schematic diagram as the discussion belowdevelops.
The drawing has labeled three distortions. The so-called ROS has a typical aspect ration of 25:1. Similarly, thedistance between the nucleus and the pedicle and the distance between the nucleus and the inner segment can bothbe much longer than the entire inner segment. Confusion has arisen in the literature when the inner segment and thenucleus are in close proximity. They have sometimes been described by the single label “inner segment” under thiscondition56. This has aggravated the discussion concerning the location of the true inner segment. In the figurepresented by West & Dowling, it is clear that all of the inner segments are found in a single plain. However, thenuclei are staggered in depth to take advantage of the available real estate.
The caricature does not display the narrow neck between the Outer and Inner Segments that has become an iconbased on an original caricature of Young57. This narrow neck does not correspond to our current knowledge. Hisdrawing was prepared by an artist and was apparently based on only a few images of photoreceptors, or limitedconsultation. The neck probably would have been presented differently if more information had been available tothe artist. Young worked with a team and the neck was presented inconsistently by that team. His paper of 1967
30 Processes in Biological Vision
58Young, R. (1967) The renewal of photoreceptor cell outer segments. J. Cell Biol. vol. 33, pp. 61-72 asprinted in Molecular processes in vision. (1981) Abrahamson & Ostroy, ed. Stroudsburg PA: Hutchinson RossPublishing Co. 59Richardson, T. (1969) Cytoplasmic and ciliary connections between the inner and outer segments ofmammalian visual receptors. Vision Res. vol. 9, pp. 727-731 (Also in Hogan, pp. 73-75)
(without coauthors) does not show a neck at all58. Unfortunately the neck has become a means of quick recognitionin the literature. More recent electron micrographs show the neck playing a more limited role. No nutritional ormetabolic functions have been associated with this neck, now labeled the Ciliary Collar. Its role is to facilitate thepassage of the dendrites of the photoreceptor neuron through the outer cell membrane. The problem is complicatedby the asymmetric three-dimensional structure of the OS/IS junction. Images chosen to clearly show the ciliarycollar area frequently do not show the circularly symmetrical calyx area equally well. Richardson59 provides severalgood electron micrographs and a drawing to explain his imagery. Unfortunately the drawing does not show thedendrites passing up through the ciliary collar although the electron micrograph clearly does.
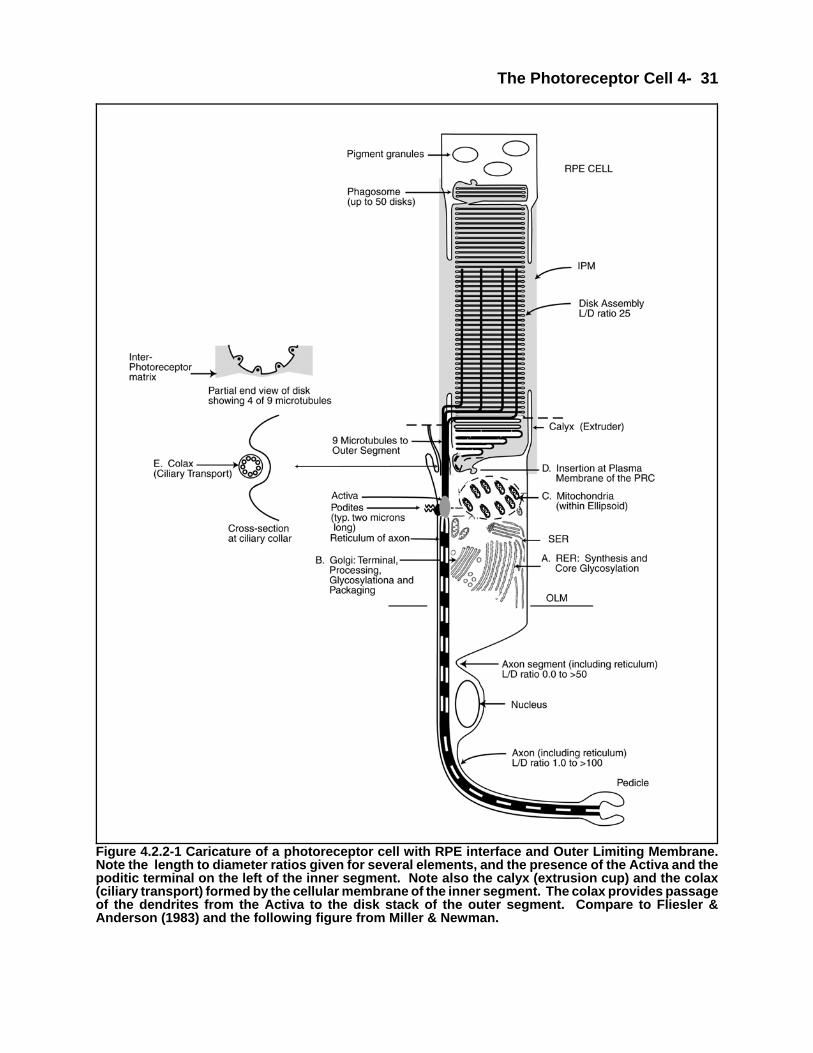
The Photoreceptor Cell 4- 31
Figure 4.2.2-1 Caricature of a photoreceptor cell with RPE interface and Outer Limiting Membrane.Note the length to diameter ratios given for several elements, and the presence of the Activa and thepoditic terminal on the left of the inner segment. Note also the calyx (extrusion cup) and the colax(ciliary transport) formed by the cellular membrane of the inner segment. The colax provides passageof the dendrites from the Activa to the disk stack of the outer segment. Compare to Fliesler &Anderson (1983) and the following figure from Miller & Newman.
32 Processes in Biological Vision
60Kuwabara, T. In Bloom & Fawcett (1968) A textbook of histology. Philadelphia, PA: W. B. Saunders pg.80161Bownds, D. & Brodie, A. (1975) Light-sensitive swelling of isolated frog outer segments. J. Gen. Physiol.,vol. 66, pp. 407-42562Ong, D. (1985) Vitamin A-binding proteins. Nutrition Reviews, vol. 43, no. 8, Pg. 23063O’Day, W. & Young, R. (1978) J. Cell Biol. 76: 593-604
Young’s artist also introduced a conceptual outer cell membrane on the assumption that the Outer Segment was aninternal part of the photoreceptor cell. Considerable artistic license was taken in sketching this putative membrane. The membrane as drawn has the characteristics of an Escher drawing. The nature of the “membrane” was notdiscussed or its content defined. The “membrane” enclosing the Outer Segment will be shown to be a coating asdefined in this work, a heterogeneous conglomerate of materials involved primarily in generating an electricalpotential by metabolic means. Kuwabara60 has provided an excellent electron micrograph showing the micelles ofthe disks to be in direct contact with the exocellular space of the IPM. There is no sign of an external membraneenclosing the disk stack. Bownds & Brodie have also provided an excellent micrograph showing the InnerSegment/Outer Segment interface when a portion of the Outer Segments has been sheared away61. There is no signof any debris relating to the fracture of membranes putatively surrounding and containing the disks of the OuterSegment.
The Outer Limiting Membrane, OLM, is also shown explicitly in the figure because of the important functional roleit plays in vision. Ong62 indicates the OLM was named based on light microscopy. Electron microscopy shows thatit is formed by a multi-holed membrane (similar to the lamina cribosa of the optic nerve) as well as Mueller cellspacked in between the photoreceptor cells. The overall membrane is important for its hydraulic and electricalimpedance. This would place the Muller Cells in a role similar to that of the pigment cells surrounding the retinulaof compound eyes. Note the length to diameter ratios provided for several features in the figure. Some of thenomenclature shown (with letters in front of the caption) is from Fliesler & Anderson.
4.2.2.1 The Outer Segment
In the above caricature, the Outer Segment is defined as a series of disks stacked like compact disks (CDs) in acolumn some two thousand disks high. The diameter of this column is typically 2 microns in diameter and 50-100microns long. The extreme end of this column is located near and partially surrounded by the RPE. The RPEprovides at least two functions important to the operation of the photoreceptor, producing the chromophoric materialfor new disks and phagocytosis of the old disks. The end of the Outer Segment adjacent to the Inner Segment is seento be in intimate contact with and to be partially surrounded by the IS.
4.2.2.2 The Inner Segment
The inner segment of the photoreceptor is structurally much more complex than the outer segment, and appropriatelyso because of the many functions it will be seen to perform. Nearest the Outer Segment, the Inner Segment is shownto provide a “pocket” from which the Outer Segment emanates. It also exhibits a ciliary structure that seems toconnect to the Outer Segment at or beyond the area of the “pocket.” From detailed study, the Inner Segment isknown to contain all of the functional parts of a typical nerve cell.
Various researchers have, however, gone farther and defined many additional features to the cell beyond those of a nerve cell. As an example, it is frequently claimed that the photoreceptor Inner Segment has significant contractileproperties as shown in O’Day & Young63. If true, the exterior shape of the Inner Segment could change with timeunder various experimental conditions. This would be a very important characteristic to note since it might havesignificant bearing on the categorization of photoreceptors into bins related to the shape of the main body of theInner Segment, i. e. “rod” shaped or “cone shaped” inner segments. The possibility that the photoreceptor would becategorized differently at a different time cannot be ignored and a researcher who did not make note of thecontractile state of the photoreceptor would be seriously amiss. This work does not address these potentialcontractile properties except to introduce two questions:
+ whether significant movement of the optically sensitive portions of the cells is compatible with maintaining their position in the focal surface of the optical system
+ whether contraction between the main body of the cell and the foot is compatible with nerve tissueconnecting the two structures.

The Photoreceptor Cell 4- 33
64Rodieck, R. (1973) The vertebrate retina. San Francisco, CA: W. H. Freeman, pp. 197-19865Penn, R. & Hagins, W. (1969) Nature, vol. 223: 201-20566Daw, N. (1995) Visual Development. NY: Plenum Press67Papermaster, D. Schneider, B. & Besharse, J. (1985) Vesicular transport of newly synthesized opsin from theGolgi Apparatus toward the rod outer segment. Invest. Ophthal. & Visual Sci. pp 1386-140468Lolley, R. Lee, R. Chase, D. L& Racz, E. (1986) Rod photoreceptor cells dissociated from mature miceretinas. Invest. Ophthal. Visual Sci. Vol. 27, no. 3, pp 285-295
4.2.2.2.1. Motion of the Inner Segment relative to the nucleus
Various investigators have spoken of a motion between the Inner Segments and the nuclei of photoreceptor cells as afunction of their state of illumination prior to dissection. These discussions have been based on the variable distancebetween Inner Segments and nuclei found upon dissection. To account for this motion, some of the tissue of theInner Segment is assumed to be muscle and is defined as the myoid. As Rodieck says, the literature on this subjectis large but relatively sparse in recent times64. The investigations are generally based on light microscopy andseldom define the precise location of the investigation within the retina. The presentations are nearly all caricaturesand they frequently refer to the OLM as a reference surface instead of the Petzval surface which is more relevant. O’Day & Young illustrate motions of the photoreceptors upwards of 50 microns when referenced to the OLM. Asshown elsewhere in this work, the depth of focus of the optical system is on the order of +/-8 microns. Similarly,the change in myoid length of –6:1 would imply a significant stretching or coiling of any neural tissue travelingalong the length of the inner segment. The requirement for and/or practicality of this amount of motion needs to beestablished. No electron micrographs have shown any coiling of the reticulum structures of the Inner Segment. Thelikelihood that such material is stretchable to the above extent appears low.
Such gross motion may be sought as a putative mechanism for moving the putative rods and cones in and out of thefocal plane depending on the illumination level. However, such a mechanism is not needed since this work showsthat all photoreceptors have the same dynamic signal range and there are no achromatic photoreceptor cells.
Penn & Hagins 65 have shown that an effective packaging of nuclei of adjacent photoreceptor cells calls for avariable length between the individual nuclei and their associated Inner Segments. In their caricature, all of theInner Segments, and particularly, the Inner Segment/Outer Segment interface maintain a constant distance from theOLM (at least in a local sense). At the same time, the “myoid” lengths are quite variable but not dynamic. It isproposed that this is the more likely scenario for explaining the variable distances between nuclei and InnerSegments. Under this scenario, the photoreceptors would maintain a constant position relative to the Petzval surface
No reference to a cell exhibiting both neural and muscular properties could be found in the neurological literature. Thus, the term myoid is believed to be archaic in reference to the photoreceptor cells. This morphologicalstructure is more appropriately described as the ellipsoid. Daw66 dropped any reference to either the myoid orellipsoid in his 1995 reproduction of figure one of Papermaster, et. al67. On the other hand, many types of neuralcells exhibit both neural and glandular properties. The photoreceptor cells are one of these types.
4.2.2.3 The Junction of the Outer & Inner Segment
At the end of the Outer Segment nearest the Inner Segment, several processes are observed in the biological senseof the word and several processes are also observed in the operational sense. There is clearly an extrusion functiongoing on that is generating the disk material. This will be discussed further in a following histological section. Similarly, there is an electrical signal path connecting the Outer Segment to the Inner Segment via the ciliary collar.
4.2.2.4 The Junction of the Inner Segment and the soma EMPTY XXX
4.2.2.5 The proximal terminal of the photoreceptor cell
The figure shows an extended distance between the inner segment of the photoreceptor cell and its pedicle. Thisfeature is seldom illustrated in textbooks. However, Lolley, et. al. show a variety of cells exhibiting this feature attheir true scale68. Note the distinct separation frequently found between the inner segment and the nucleus of fovealphotoreceptors as well as the significant length of the axon between the nucleus and the pedicle in order to cross theouter fiber layer of the retina. The length-to-diameter ratios shown in the figure are taken from the figures of Lolley.

34 Processes in Biological Vision
69Werbin, F. & Dowling, J. (1969) J. Neurophysiology. 32:33970O’Day, W. & Young, R. (1978) Rhythmic daily shedding of outer-segment membranes by visual cells ingoldfish. J. Cell Biol. vol. 76, pp. 593-604
The pedicle is generally more than 20 times the diameter of the axon.
At the proximal end of the Inner Segment, the cell does exhibit an ending not unlike other nerve cells. Differentphotoreceptor cells do exhibit variations in this area. However, the most critical circumstance here is the width ofthe cleft between the foot of the photoreceptor cell and its associated nerve cell. Several teams, especially Vardi, et.al. and Shein have provided excellent data in this area. Whereas Vardi, et. al. have decorated a pedicle caricaturefrequently presented in the literature, Shein has provided computer generated tomographs of actual pedicles. Tsukamoto, et. al. have provided actual electron micrographs that underlay these interpretations. See Section4.3.6.1.1.
The pedicle of a photoreceptor cell plays an unusual role in the neural system of vision. It acts as a current-to-voltage converter prior to participating in the synaptic process. Werbin et. al.69 report measuring a voltage at the footof the photoreceptor. They were making measurements under large signal conditions and the waveforms shown arenot typical of normal eye operation, i.e., small signal conditions. This subject as well as the detailed structure of thephotoreceptor pedicle will be discussed in detail in Chapter 12.
4.2.3 Other cells in the photoreceptor laminate
Both light and electron micrographs of retinas frequently display unusual morphological forms of what are believedto be photoreceptor cells. This is particularly common in non primate chordates. One form that is common even inprimates is what appears to be a photoreceptor cell with a cone shaped Outer Segment that does not extend to theinterface with the RPE. Knowing that normal photoreceptors in these animals are typically growing toward the RPEat a nominal rate (7.2 microns per day for humans), the reason for the existence of these cells must be determined. The entire disk stack of the Outer Segment (nominally 50 microns long) is normally replaced in 7-10 days. O’Day& Young70, as late as 1978, said “evidence of disk shedding by cones is very rare, and has not been shown to be aregularly occurring process.” Based on the expected growth rate of all human photoreceptors, a “cone” with aconical Outer Segment cannot exist under normal conditions for more than a week. Morphologically, it appears thata short cone shaped Outer Segment must belong to either a juvenile cell or a cell that has been stunted in its growth. If it is juvenile, it would not be expected to begin shedding disks until the OS reaches the RPE and phagocytosisbegins.
4.3 Histology of photoreceptor and RPE cells (Introducing electron microscopy)
The advent of the electron-microscope in the 1950-60's marked a turning point in our knowledge concerning thephotoreceptor cells. As performance improved to about 100,000x in the 1970's, it even became possible to resolvethe image of the plasma lemma of the cell as a line or pair of lines. More recent improvements have actually allowedthe resolution of the bilayer structure of a lemma. At this level of performance, it became possible to demonstratethat the outer segment of the photoreceptor cell is actually an extra-cellular structure.
This section will only touch on the histology of the photoreceptor. It will address what might be called the grosscytology of the cell. A more inclusive discussion of the detailed cytology, based on much higher magnificationelectron microscopy, will appear in Chapter 10.
The participation of the chromophores of vision in the formation of the complete disks of the outer segment willbegin to appear in this section. This is necessary to provide continuity in the discussion. Details of the formation ofthe chromophores of vision will be developed primarily in Chapters 5 & 7. The basic premises assumed here anddemonstrated there include:
+ the chromophores are formed in the RPE and not the photoreceptor cells.+ the chromophores are deposited on the disks in the extrusion cup which is external to the photoreceptor cell.+ once the chromophores are deposited on the disks, they remain there until phagocytosis of the disk.+ the chromophores are functionally active and reusable without traveling to the RPE for renewal.
4.3.1 Recent morphology based, chronology of the view of a photoreceptor cell

The Photoreceptor Cell 4- 35
71Miller, N. & Newman, N. (1998) Walsh and Hoyt’s Clinical Neuro-Ophthalmology, 5th ed. Baltimore, MD:Williams & Wilkins. pg 3272Townes-Anderson, E. Dacheux, R. & Raviola, E. (1988) Rod photoreceptors dissociated from the adult rabbitretina J Neuorsci vol. 8, no. 1, pp 320-33173Lolley, R. Lee, R. Chase, D. L& Racz, E. (1986) Rod photoreceptor cells dissociated from mature miceretinas. Invest. Ophthal. Visual Sci. Vol. 27, no. 3, pp 285-295
The conventional view of a photoreceptor cell is changing rapidly in the literature. Figure 4.3.1-1(A) shows ahistological caricature of a pair of photoreceptor cells taken from the new 5th edition of Walsh & Hoyt’s ClinicalNeuro-Ophthalmology71. The figure shows cells labeled rod and cone but virtually no discernable morphological orcytological difference between them. The figure is accompanied by virtually no explanation or discussion of thedifference. There is no discussion of the spectral performance of the putative “rod” or “cone.” The obviousdifference is the location of the nucleus of the two cells. However, this difference is ephemeral. In the actual retina,such a difference is a function of location in the retina and not a function of the spectral characteristic of the cell. Figure 4.3.1-1(B) shows a complete photoreceptor teased from the retina of a rabbit72. The structures labeled outerand inner fiber are dominated internally by the axon of the cell. The cell body is essentially extraneous to thesignaling function of the cell. Townes-Anderson et. al. also provided a variety of higher magnification images ofparts of the cell. A similar figure, showing a photoreceptor teased from the actual retina of a mouse was published in198673. Although the precise orientation of the parts of the photoreceptor cell may have changed, it is not likely thattheir relative sizes or lengths changed. The separate axon segments between the inner segment and nucleus andpedicle are clearly seen. Lolley, et. al. also provided a variety of images in their 1986 paper. In one, it is claimedthat one cell is a cone, apparently because its nucleus was relatively larger than the others and the inner segment wasnot attached (and may never have been attached) to an outer segment. The inset to figure 4 of Lolley, et. al. showsthe first published picture of the poditic terminal of a photoreceptor cell (unrecognized by them as to function). Thisfigure will be discussed in Section 4.3.6. The limitations of the differential interference contrast microscope shouldbe reviewed when examining their figures in detail.
Neither of the authors presenting these images discussed the spectral performance, the internal cytology nor theelectrophysiology of any of the cells shown. The right side of the caricature drawn by Hengst is noteworthy for thespace shown between the basal bodies of the cilium and the ciliary rootlets. This space corresponds to the base ofthe Activa proposed by this work. Recognizing this fact, the so-called basal bodies are actually the emitter terminalsof the Activa and the ciliary rootlets are the collector terminals. These latter terminals represent the start of thereticulums within the axon leading to the pedicle of the cell.
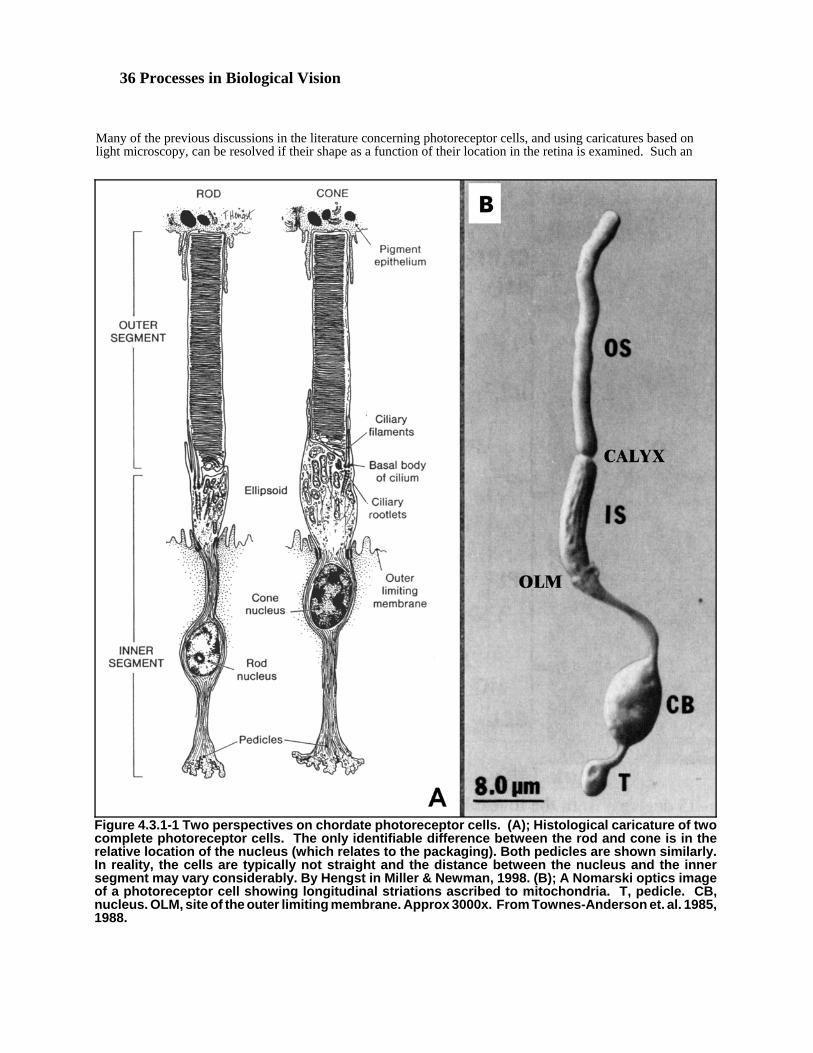
36 Processes in Biological Vision
Figure 4.3.1-1 Two perspectives on chordate photoreceptor cells. (A); Histological caricature of twocomplete photoreceptor cells. The only identifiable difference between the rod and cone is in therelative location of the nucleus (which relates to the packaging). Both pedicles are shown similarly.In reality, the cells are typically not straight and the distance between the nucleus and the innersegment may vary considerably. By Hengst in Miller & Newman, 1998. (B); A Nomarski optics imageof a photoreceptor cell showing longitudinal striations ascribed to mitochondria. T, pedicle. CB,nucleus. OLM, site of the outer limiting membrane. Approx 3000x. From Townes-Anderson et. al. 1985,1988.
Many of the previous discussions in the literature concerning photoreceptor cells, and using caricatures based onlight microscopy, can be resolved if their shape as a function of their location in the retina is examined. Such an
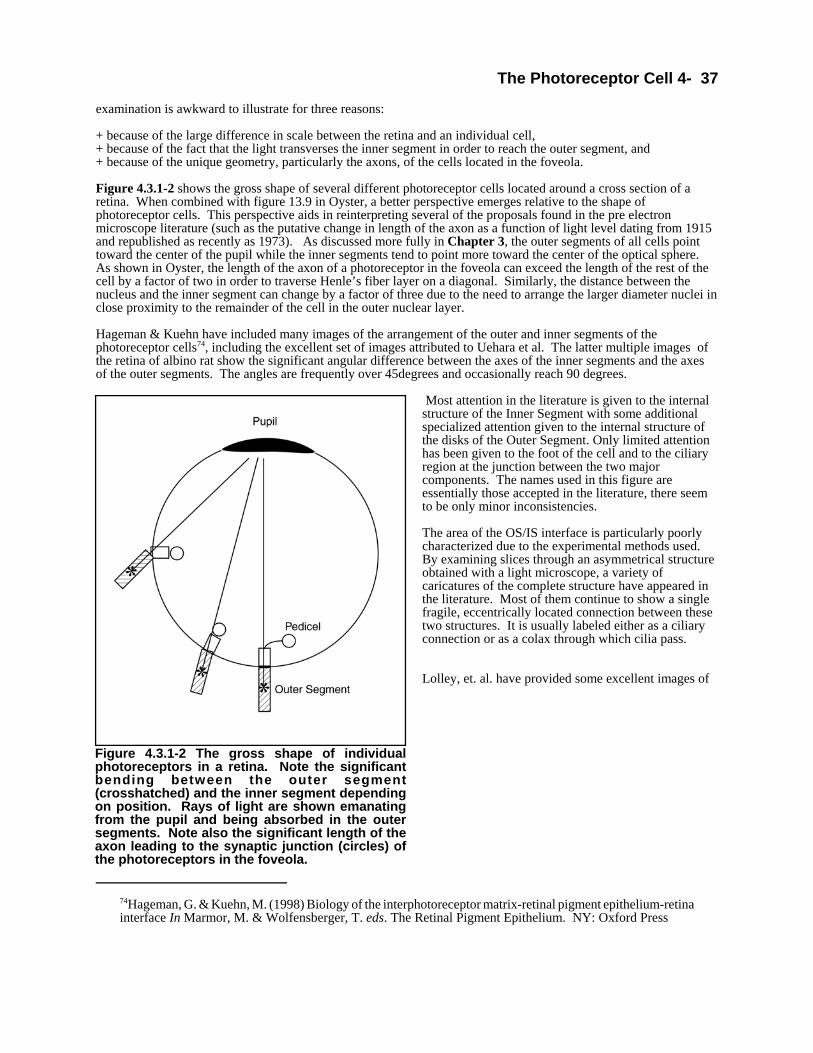
The Photoreceptor Cell 4- 37
74Hageman, G. & Kuehn, M. (1998) Biology of the interphotoreceptor matrix-retinal pigment epithelium-retinainterface In Marmor, M. & Wolfensberger, T. eds. The Retinal Pigment Epithelium. NY: Oxford Press
Figure 4.3.1-2 The gross shape of individualphotoreceptors in a retina. Note the significantbending between the outer segment(crosshatched) and the inner segment dependingon position. Rays of light are shown emanatingfrom the pupil and being absorbed in the outersegments. Note also the significant length of theaxon leading to the synaptic junction (circles) ofthe photoreceptors in the foveola.
examination is awkward to illustrate for three reasons:
+ because of the large difference in scale between the retina and an individual cell,+ because of the fact that the light transverses the inner segment in order to reach the outer segment, and + because of the unique geometry, particularly the axons, of the cells located in the foveola.
Figure 4.3.1-2 shows the gross shape of several different photoreceptor cells located around a cross section of aretina. When combined with figure 13.9 in Oyster, a better perspective emerges relative to the shape ofphotoreceptor cells. This perspective aids in reinterpreting several of the proposals found in the pre electronmicroscope literature (such as the putative change in length of the axon as a function of light level dating from 1915and republished as recently as 1973). As discussed more fully in Chapter 3, the outer segments of all cells pointtoward the center of the pupil while the inner segments tend to point more toward the center of the optical sphere. As shown in Oyster, the length of the axon of a photoreceptor in the foveola can exceed the length of the rest of thecell by a factor of two in order to traverse Henle’s fiber layer on a diagonal. Similarly, the distance between thenucleus and the inner segment can change by a factor of three due to the need to arrange the larger diameter nuclei inclose proximity to the remainder of the cell in the outer nuclear layer. Hageman & Kuehn have included many images of the arrangement of the outer and inner segments of thephotoreceptor cells74, including the excellent set of images attributed to Uehara et al. The latter multiple images ofthe retina of albino rat show the significant angular difference between the axes of the inner segments and the axesof the outer segments. The angles are frequently over 45degrees and occasionally reach 90 degrees.
Most attention in the literature is given to the internalstructure of the Inner Segment with some additionalspecialized attention given to the internal structure ofthe disks of the Outer Segment. Only limited attentionhas been given to the foot of the cell and to the ciliaryregion at the junction between the two majorcomponents. The names used in this figure areessentially those accepted in the literature, there seemto be only minor inconsistencies.
The area of the OS/IS interface is particularly poorlycharacterized due to the experimental methods used. By examining slices through an asymmetrical structureobtained with a light microscope, a variety ofcaricatures of the complete structure have appeared inthe literature. Most of them continue to show a singlefragile, eccentrically located connection between thesetwo structures. It is usually labeled either as a ciliaryconnection or as a colax through which cilia pass.
Lolley, et. al. have provided some excellent images of
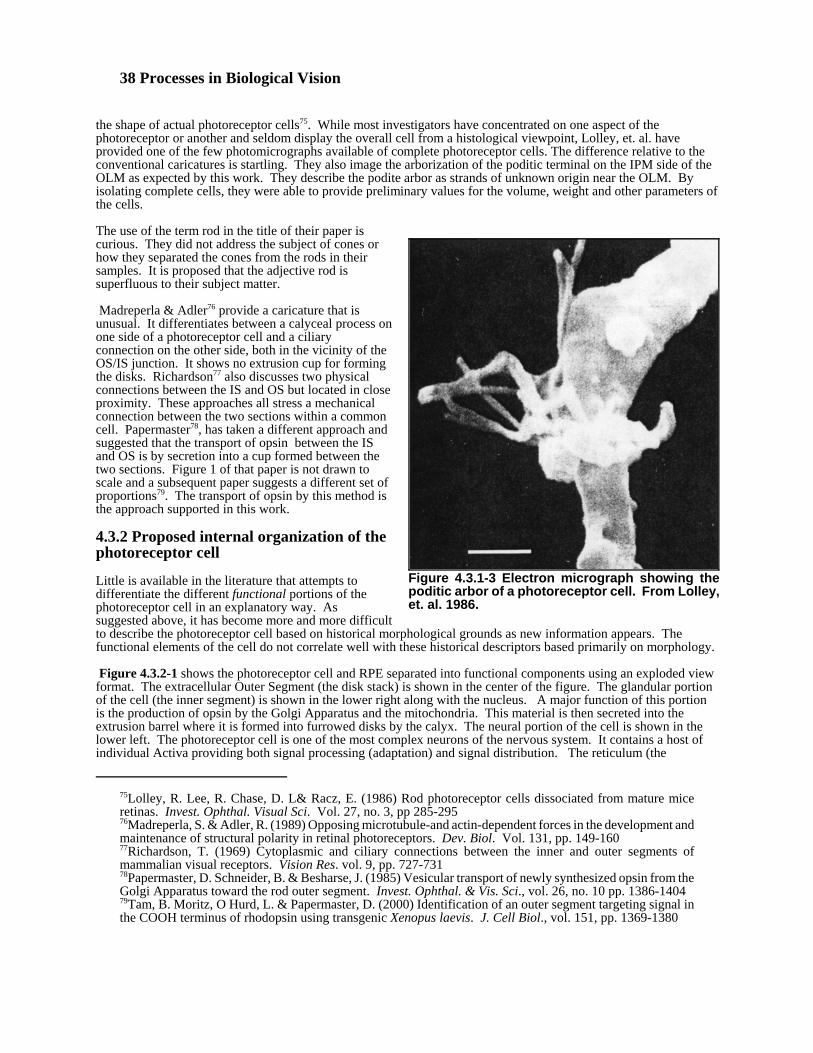
38 Processes in Biological Vision
75Lolley, R. Lee, R. Chase, D. L& Racz, E. (1986) Rod photoreceptor cells dissociated from mature miceretinas. Invest. Ophthal. Visual Sci. Vol. 27, no. 3, pp 285-29576Madreperla, S. & Adler, R. (1989) Opposing microtubule-and actin-dependent forces in the development andmaintenance of structural polarity in retinal photoreceptors. Dev. Biol. Vol. 131, pp. 149-16077Richardson, T. (1969) Cytoplasmic and ciliary connections between the inner and outer segments ofmammalian visual receptors. Vision Res. vol. 9, pp. 727-73178Papermaster, D. Schneider, B. & Besharse, J. (1985) Vesicular transport of newly synthesized opsin from theGolgi Apparatus toward the rod outer segment. Invest. Ophthal. & Vis. Sci., vol. 26, no. 10 pp. 1386-140479Tam, B. Moritz, O Hurd, L. & Papermaster, D. (2000) Identification of an outer segment targeting signal inthe COOH terminus of rhodopsin using transgenic Xenopus laevis. J. Cell Biol., vol. 151, pp. 1369-1380
Figure 4.3.1-3 Electron micrograph showing thepoditic arbor of a photoreceptor cell. From Lolley,et. al. 1986.
the shape of actual photoreceptor cells75. While most investigators have concentrated on one aspect of thephotoreceptor or another and seldom display the overall cell from a histological viewpoint, Lolley, et. al. haveprovided one of the few photomicrographs available of complete photoreceptor cells. The difference relative to theconventional caricatures is startling. They also image the arborization of the poditic terminal on the IPM side of theOLM as expected by this work. They describe the podite arbor as strands of unknown origin near the OLM. Byisolating complete cells, they were able to provide preliminary values for the volume, weight and other parameters ofthe cells.
The use of the term rod in the title of their paper iscurious. They did not address the subject of cones orhow they separated the cones from the rods in theirsamples. It is proposed that the adjective rod issuperfluous to their subject matter.
Madreperla & Adler76 provide a caricature that isunusual. It differentiates between a calyceal process onone side of a photoreceptor cell and a ciliaryconnection on the other side, both in the vicinity of theOS/IS junction. It shows no extrusion cup for formingthe disks. Richardson77 also discusses two physicalconnections between the IS and OS but located in closeproximity. These approaches all stress a mechanicalconnection between the two sections within a commoncell. Papermaster78, has taken a different approach andsuggested that the transport of opsin between the ISand OS is by secretion into a cup formed between thetwo sections. Figure 1 of that paper is not drawn toscale and a subsequent paper suggests a different set ofproportions79. The transport of opsin by this method isthe approach supported in this work.
4.3.2 Proposed internal organization of thephotoreceptor cell
Little is available in the literature that attempts todifferentiate the different functional portions of thephotoreceptor cell in an explanatory way. Assuggested above, it has become more and more difficultto describe the photoreceptor cell based on historical morphological grounds as new information appears. Thefunctional elements of the cell do not correlate well with these historical descriptors based primarily on morphology.
Figure 4.3.2-1 shows the photoreceptor cell and RPE separated into functional components using an exploded view format. The extracellular Outer Segment (the disk stack) is shown in the center of the figure. The glandular portionof the cell (the inner segment) is shown in the lower right along with the nucleus. A major function of this portionis the production of opsin by the Golgi Apparatus and the mitochondria. This material is then secreted into theextrusion barrel where it is formed into furrowed disks by the calyx. The neural portion of the cell is shown in thelower left. The photoreceptor cell is one of the most complex neurons of the nervous system. It contains a host ofindividual Activa providing both signal processing (adaptation) and signal distribution. The reticulum (the

The Photoreceptor Cell 4- 39
conductor within the morphologically designated axon) connects the distribution amplifier to the pedicle of the cell.In this view, the (typically) nine dendrites of the neuron exit the cell at the colax (the basal body of the cilium) andfan out around the Outer Segment before being placed in the furrows of the disk stack (where they have previouslybeen called microtubules). Below the cilium, the dendrites merge into a single connection to the distributionamplifier, or Activa, shown. The poditic terminal of this Activa is shown explicitly. The adaptation amplifierActiva cannot be shown at this scale. They are represented by the microtubules. Full details of the elements of thephotoreceptor cell will be described in Chapter 12. The individual structures associated with these portions of thecell can only be imaged at 120,000x or higher.
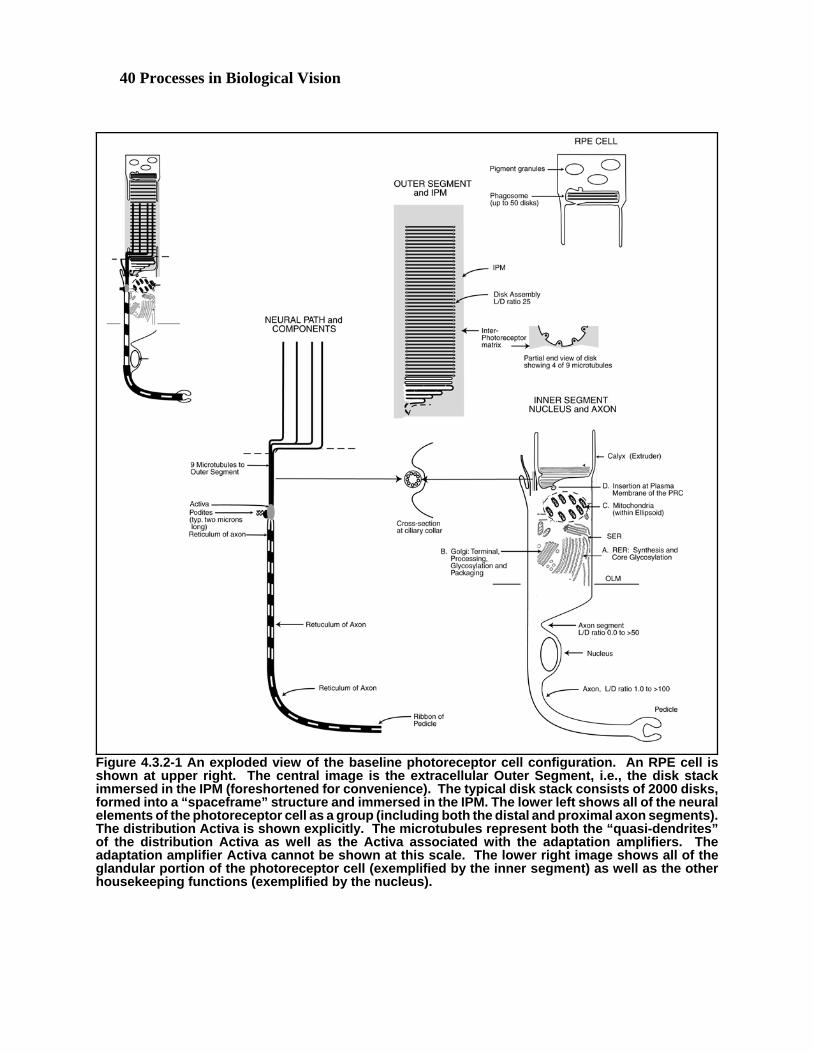
40 Processes in Biological Vision
Figure 4.3.2-1 An exploded view of the baseline photoreceptor cell configuration. An RPE cell isshown at upper right. The central image is the extracellular Outer Segment, i.e., the disk stackimmersed in the IPM (foreshortened for convenience). The typical disk stack consists of 2000 disks,formed into a “spaceframe” structure and immersed in the IPM. The lower left shows all of the neuralelements of the photoreceptor cell as a group (including both the distal and proximal axon segments).The distribution Activa is shown explicitly. The microtubules represent both the “quasi-dendrites”of the distribution Activa as well as the Activa associated with the adaptation amplifiers. Theadaptation amplifier Activa cannot be shown at this scale. The lower right image shows all of theglandular portion of the photoreceptor cell (exemplified by the inner segment) as well as the otherhousekeeping functions (exemplified by the nucleus).
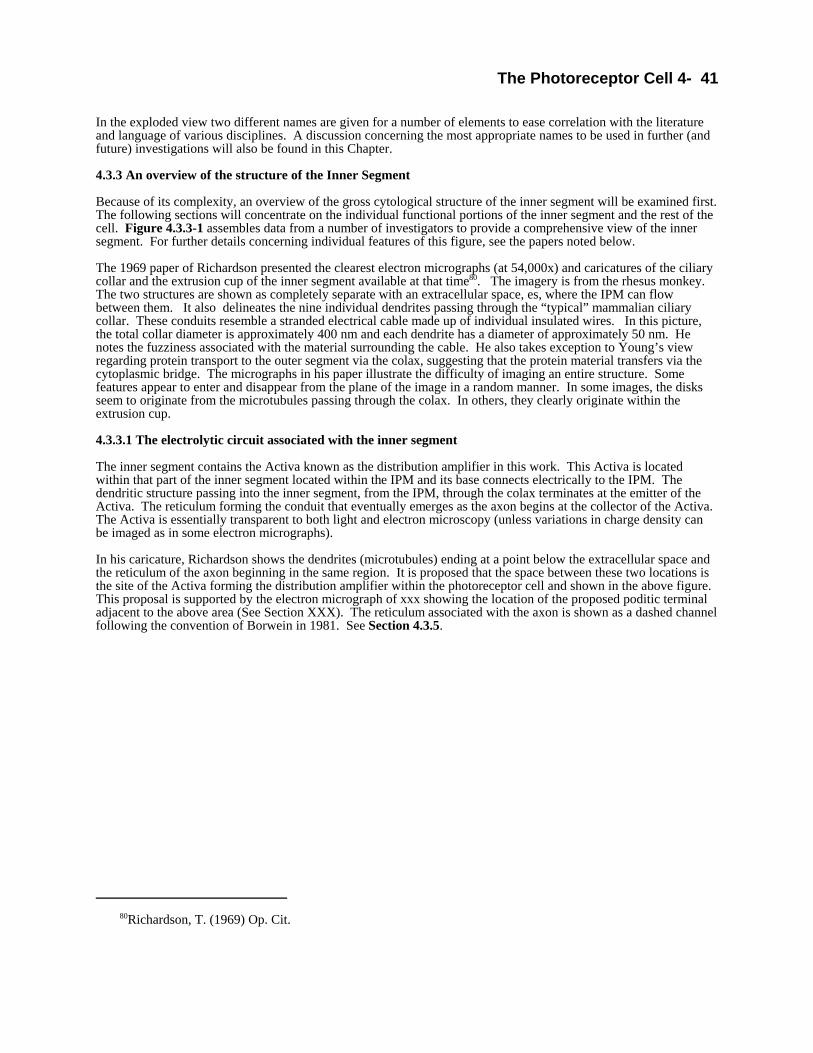
The Photoreceptor Cell 4- 41
80Richardson, T. (1969) Op. Cit.
In the exploded view two different names are given for a number of elements to ease correlation with the literatureand language of various disciplines. A discussion concerning the most appropriate names to be used in further (andfuture) investigations will also be found in this Chapter.
4.3.3 An overview of the structure of the Inner Segment
Because of its complexity, an overview of the gross cytological structure of the inner segment will be examined first. The following sections will concentrate on the individual functional portions of the inner segment and the rest of thecell. Figure 4.3.3-1 assembles data from a number of investigators to provide a comprehensive view of the innersegment. For further details concerning individual features of this figure, see the papers noted below.
The 1969 paper of Richardson presented the clearest electron micrographs (at 54,000x) and caricatures of the ciliarycollar and the extrusion cup of the inner segment available at that time80. The imagery is from the rhesus monkey. The two structures are shown as completely separate with an extracellular space, es, where the IPM can flowbetween them. It also delineates the nine individual dendrites passing through the “typical” mammalian ciliarycollar. These conduits resemble a stranded electrical cable made up of individual insulated wires. In this picture,the total collar diameter is approximately 400 nm and each dendrite has a diameter of approximately 50 nm. Henotes the fuzziness associated with the material surrounding the cable. He also takes exception to Young’s viewregarding protein transport to the outer segment via the colax, suggesting that the protein material transfers via thecytoplasmic bridge. The micrographs in his paper illustrate the difficulty of imaging an entire structure. Somefeatures appear to enter and disappear from the plane of the image in a random manner. In some images, the disksseem to originate from the microtubules passing through the colax. In others, they clearly originate within theextrusion cup.
4.3.3.1 The electrolytic circuit associated with the inner segment The inner segment contains the Activa known as the distribution amplifier in this work. This Activa is locatedwithin that part of the inner segment located within the IPM and its base connects electrically to the IPM. Thedendritic structure passing into the inner segment, from the IPM, through the colax terminates at the emitter of theActiva. The reticulum forming the conduit that eventually emerges as the axon begins at the collector of the Activa. The Activa is essentially transparent to both light and electron microscopy (unless variations in charge density canbe imaged as in some electron micrographs).
In his caricature, Richardson shows the dendrites (microtubules) ending at a point below the extracellular space andthe reticulum of the axon beginning in the same region. It is proposed that the space between these two locations isthe site of the Activa forming the distribution amplifier within the photoreceptor cell and shown in the above figure. This proposal is supported by the electron micrograph of xxx showing the location of the proposed poditic terminaladjacent to the above area (See Section XXX). The reticulum associated with the axon is shown as a dashed channelfollowing the convention of Borwein in 1981. See Section 4.3.5.
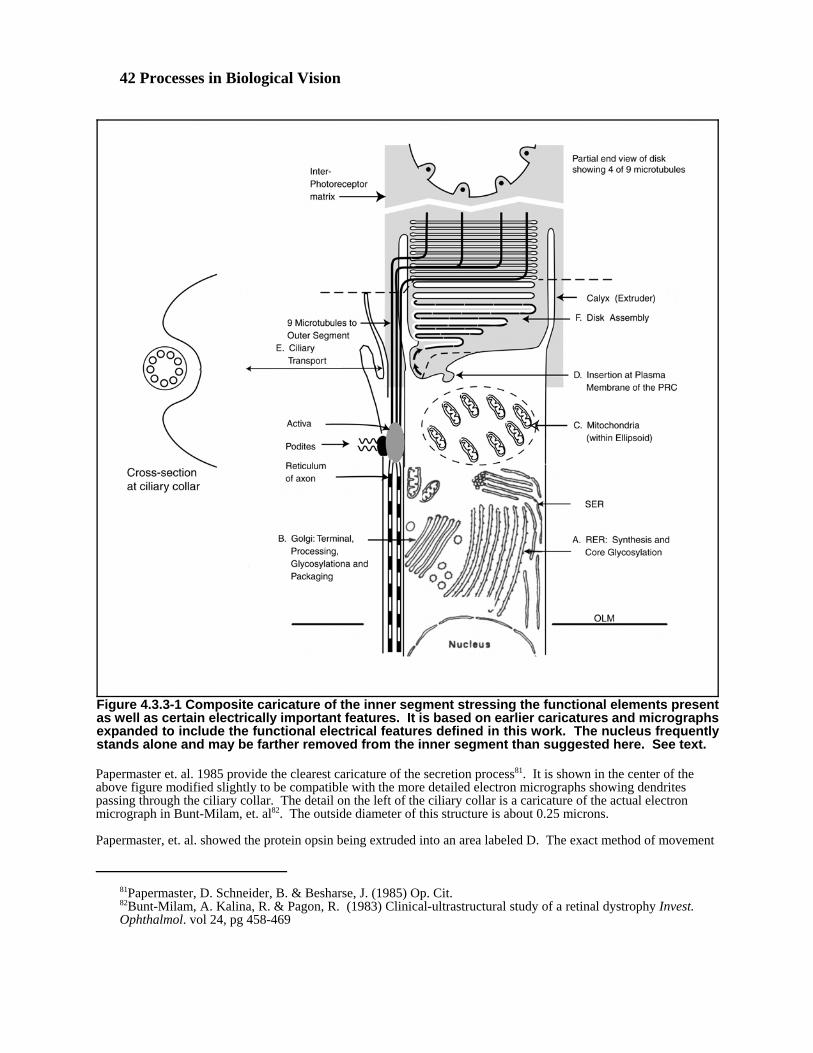
42 Processes in Biological Vision
81Papermaster, D. Schneider, B. & Besharse, J. (1985) Op. Cit. 82Bunt-Milam, A. Kalina, R. & Pagon, R. (1983) Clinical-ultrastructural study of a retinal dystrophy Invest.Ophthalmol. vol 24, pg 458-469
Figure 4.3.3-1 Composite caricature of the inner segment stressing the functional elements presentas well as certain electrically important features. It is based on earlier caricatures and micrographsexpanded to include the functional electrical features defined in this work. The nucleus frequentlystands alone and may be farther removed from the inner segment than suggested here. See text.
Papermaster et. al. 1985 provide the clearest caricature of the secretion process81. It is shown in the center of theabove figure modified slightly to be compatible with the more detailed electron micrographs showing dendritespassing through the ciliary collar. The detail on the left of the ciliary collar is a caricature of the actual electronmicrograph in Bunt-Milam, et. al82. The outside diameter of this structure is about 0.25 microns.
Papermaster, et. al. showed the protein opsin being extruded into an area labeled D. The exact method of movement

The Photoreceptor Cell 4- 43
83Jamieson, xxx. (1975) XXX in Weissmann,G. & Claiborne, R. ed. Cell Membranes: Biochemistry, CellBiology & Pathology. NY: HP Publishing Co. Chap 15, pg 15084Ottoson, D. (1983) Physiology of the Nervous System. NY: Oxford University Press pg 2585Brown, P. Gibbons, I. & Wald, G. (1963) The visual cells and visual pigment of the mudpuppy, Necturus.J. Cell Biol. vol. 19, pp. 79-106 Also Fig. V-5 in Rodieck
of the protein through the cell wall remains a question. Jamieson has described his concept in caricature83. ThePapermaster figure has been extended to suggest how the secreted opsin is forced to form a continuous sheet by theshape of the extrusion cup cavity. This cavity is nominally circular. While the protein is being folded back andforth, two steps occur. The material is coated on its hydrophilic side with one of the Rhodonines, the chromophoresof vision. The Rhodonines enter the extrusion cavity from the Inter-Photoreceptor Matrix, IPM, through ports in thewall of the cavity. The material also begins to harden due to the chemical character of the environment within thecavity. As the strip of opsin is compressed, it breaks into small pieces prior to extrusion from the cavity. In theprocess of extrusion, furrows are introduced into the periphery of the disks (prior to crossing the dashed line) by theCalyx, or extrusion dye. These furrows are subsequently filled by the individual dendrites emanating from theciliary collar. This detail is shown in the cross section. Two separate reticulums (electrical conduits) are shownwithin the structure that will become known as the axon when it emerges from the inner segment. The location ofthe Outer Limiting Membrane (OLM) is shown explicitly because it plays a role in the electrical performance of thephotoreceptor cells and the retina. In this figure, the ellipsoid is seen to be a morphological designation for an areawith a different optical index in light microscopy.
It is important to note that the disk formation process may appear quite differently depending onthe plane of the section taken relative to the circular cavity. Whereas the disk forming shoulder isshown in the same plane as the midline of the colax, this is not a condition in real cells.
Ottoson, discusses microtubules and neurofilaments in the generic sense84. He describes them as slightly larger thanthose of the colax and the outer segments. He lists the microtubules as typically 240 Angstrom in diameter. They arefrequently stranded and filled with neurofilaments on the order of 100 Angstrom in diameter. The specificdimensions of those structures associated with the outer segment are critical to the operation of the visual system andwill be discussed further in Section 4.3.5.
Brown, et. al have provided an interesting image of the Calyx85. It shows the reinforcement of the Calyx typical ofwhat would be found in a man-made extrusion die. A heavy external band is placed around the die and connected tothe staves of the extrusion cup. Where staves are missing, the fluids of the IPM can enter the extrusion cavity.
In many caricatures, it is claimed that there is a “membrane” surrounding the Outer Segment. However, no electronmicroscope picture or any other evidence could be found that shows the material surrounding the OS to be amembrane in the technical sense. There is excellent evidence that there is no membrane (See Section 4.3.5). In theabsence of evidence to the contrary, the material surrounding the OS will be considered a coating and not amembrane.
Dowling (1967) shows the disks of the OS extending beyond the end of the calyx at a resolution appropriate for thetime. However, the words in the caption relative to the membrane cannot be supported at this resolution. There isno suggestion that the lines were resolved adequately to determine whether they are a membrane or a coating. In thisfigure, the coating present around the disks after leaving the calyx, is not present deep in the seat of the calyx.
4.3.3.2 The glandular function associated with the inner segment
It is extremely difficult to find a single electron-micrograph that completely describes in a single two-dimensionalimage the fundamentally three-dimensional cytology and secretion processes associated with the IS. An imageworth studying appears as Figure 9-23 in Hogan. It is at x36,000 and appears to show that even in Chordata, thedisk stack may be formed from multiple secretion sources. It is quite clear that these sources are not related to thecolax (ciliary collar) and the dendrites passing through the colax. The termination of the calyx is shown clearly onthe left side of the Outer Segment but less definitively on the right because of the presence of the dendritic bundle. The figure also appears to show the location of the Activa within the IS. It is proposed that the base of the Activa isformed at the upper end of the two dendrites shown passing through the colax. Immediately above this base region,and before the top of the image, the axolemma and axoplasm can be seen in faint outlines. Being a section through athree-dimensional shape, the image does not show any furrows within the disks or the insertion of any dendrites intothese furrows. A discontinuous boundary is shown on the left side of the OS but no similar boundary is obvious on
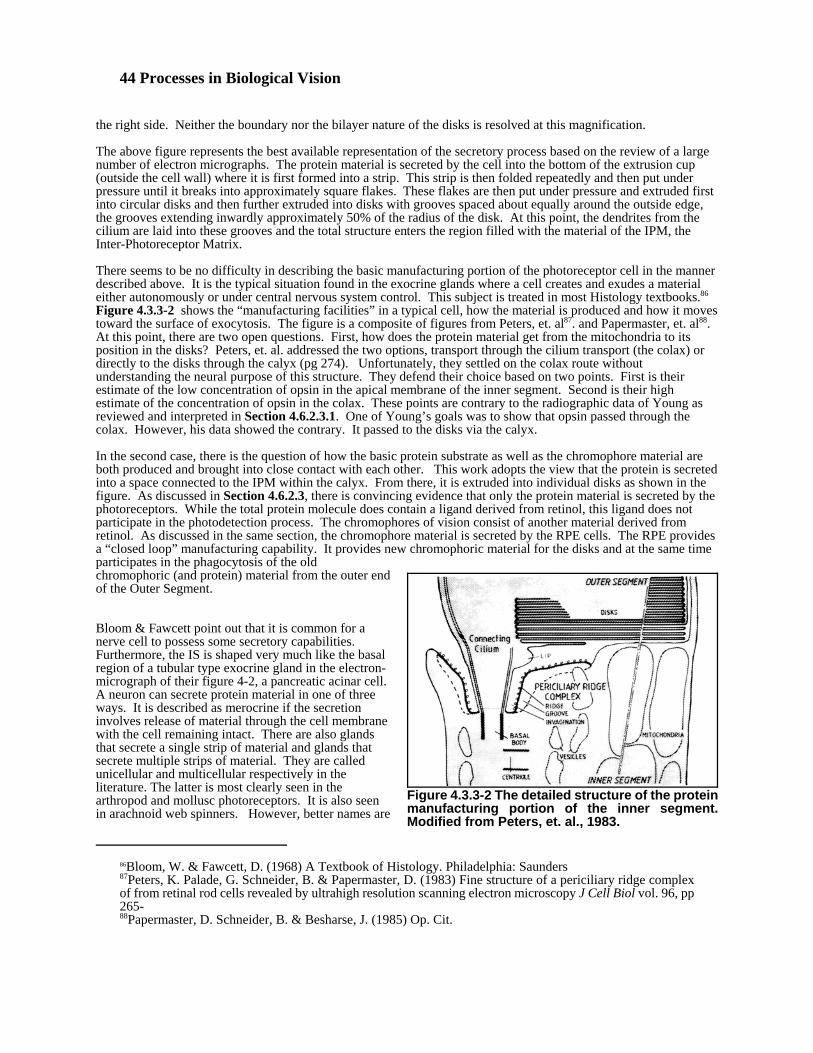
44 Processes in Biological Vision
86Bloom, W. & Fawcett, D. (1968) A Textbook of Histology. Philadelphia: Saunders87Peters, K. Palade, G. Schneider, B. & Papermaster, D. (1983) Fine structure of a periciliary ridge complexof from retinal rod cells revealed by ultrahigh resolution scanning electron microscopy J Cell Biol vol. 96, pp265-88Papermaster, D. Schneider, B. & Besharse, J. (1985) Op. Cit.
Figure 4.3.3-2 The detailed structure of the proteinmanufacturing portion of the inner segment.Modified from Peters, et. al., 1983.
the right side. Neither the boundary nor the bilayer nature of the disks is resolved at this magnification.
The above figure represents the best available representation of the secretory process based on the review of a largenumber of electron micrographs. The protein material is secreted by the cell into the bottom of the extrusion cup(outside the cell wall) where it is first formed into a strip. This strip is then folded repeatedly and then put underpressure until it breaks into approximately square flakes. These flakes are then put under pressure and extruded firstinto circular disks and then further extruded into disks with grooves spaced about equally around the outside edge,the grooves extending inwardly approximately 50% of the radius of the disk. At this point, the dendrites from thecilium are laid into these grooves and the total structure enters the region filled with the material of the IPM, theInter-Photoreceptor Matrix.
There seems to be no difficulty in describing the basic manufacturing portion of the photoreceptor cell in the mannerdescribed above. It is the typical situation found in the exocrine glands where a cell creates and exudes a materialeither autonomously or under central nervous system control. This subject is treated in most Histology textbooks.86 Figure 4.3.3-2 shows the “manufacturing facilities” in a typical cell, how the material is produced and how it movestoward the surface of exocytosis. The figure is a composite of figures from Peters, et. al87. and Papermaster, et. al88. At this point, there are two open questions. First, how does the protein material get from the mitochondria to itsposition in the disks? Peters, et. al. addressed the two options, transport through the cilium transport (the colax) ordirectly to the disks through the calyx (pg 274). Unfortunately, they settled on the colax route withoutunderstanding the neural purpose of this structure. They defend their choice based on two points. First is theirestimate of the low concentration of opsin in the apical membrane of the inner segment. Second is their highestimate of the concentration of opsin in the colax. These points are contrary to the radiographic data of Young asreviewed and interpreted in Section 4.6.2.3.1. One of Young’s goals was to show that opsin passed through thecolax. However, his data showed the contrary. It passed to the disks via the calyx.
In the second case, there is the question of how the basic protein substrate as well as the chromophore material areboth produced and brought into close contact with each other. This work adopts the view that the protein is secretedinto a space connected to the IPM within the calyx. From there, it is extruded into individual disks as shown in thefigure. As discussed in Section 4.6.2.3, there is convincing evidence that only the protein material is secreted by thephotoreceptors. While the total protein molecule does contain a ligand derived from retinol, this ligand does notparticipate in the photodetection process. The chromophores of vision consist of another material derived fromretinol. As discussed in the same section, the chromophore material is secreted by the RPE cells. The RPE providesa “closed loop” manufacturing capability. It provides new chromophoric material for the disks and at the same timeparticipates in the phagocytosis of the oldchromophoric (and protein) material from the outer endof the Outer Segment.
Bloom & Fawcett point out that it is common for anerve cell to possess some secretory capabilities. Furthermore, the IS is shaped very much like the basalregion of a tubular type exocrine gland in the electron-micrograph of their figure 4-2, a pancreatic acinar cell. A neuron can secrete protein material in one of threeways. It is described as merocrine if the secretioninvolves release of material through the cell membranewith the cell remaining intact. There are also glandsthat secrete a single strip of material and glands thatsecrete multiple strips of material. They are calledunicellular and multicellular respectively in theliterature. The latter is most clearly seen in thearthropod and mollusc photoreceptors. It is also seenin arachnoid web spinners. However, better names are
The Photoreceptor Cell 4- 45
89Platt, J. (1964) Systematics of the electronic spectra of conjugated molecules. NY: John Wiley & Sons.Chapter 2 pp. 71-123 (Also in Radiation Biology (1956) edited by Hollaender, A. NY: McGraw Hill)
probably monofilament and multifilament since the materials may be formed in fine ducts or by multiple vesicles, allwithin a single cell. See Section 4.2.1.
A reinterpretation of figure 4 in Peters, et. al. (in line with their discussion on page 267) would suggest that the nineridges (or grooves) of the frog inner segment are each sources of opsin, and the nine dendrites passing through thecolax align themselves in the outer portion of the grooves between the individual strands of opsin. As suggested intheir text, the colax is frequently less centered than shown in their figure. In fact the stereotypical image of the colaxshows it located external to the calyx. Many micrographs actually show a void between them. The adjacentportions of the material secreted from the apical membrane of the inner segment grooves tend to merge (althoughthey frequently remain visible in plan-view pictures of disks). See the plan view of a human disk in [Figure 4.3.5-3].
4.3.4 Gross structure of the outer segment
There is considerable inconsistency in the literature concerning the detailed structure of the Outer Segment. This isparticularly apparent between the early caricatures, based on light microscopy, and more recent electron-micrographs. Much of it seems to relate to insufficient scope in the original investigations or to attempts to tie thedata to preconceived ideas about what to expect. As an example, there is considerable discussion of an outermembrane enclosing the disks; however, several caricatures show the membrane in question disappearing within ashort distance of the junction with the Inner Segment--and some of these imply that the outer membrane becomes anintegral part of the disks or is absorbed by the disks. Most electron-micrographs do not show any trace of an outermembrane. These images will be discussed in Section 4.3.5.1.1.
4.3.4.1 The Outer Segment as a passive element
In the electronics field, there are two broad classes of passive elements, the simple elements such as the resistor,capacitor, inductor and diode, and the more complex elements such as transformers and piezoelectric crystals. Onlythe resistor, among the above elements consumes power in its normal operation. The transformer can change theimpedance level between two circuits and thereby cause a change in voltage or current. However, it cannot cause achange in signal power.
The Outer Segment is involved in a two-step passive process, the transduction of photons into excitons and excitonsinto free electrons. This latter function is performed in close association with the dendritic system of thephotoreceptor cell and is called translation in this work for purposes of clarity.
4.3.4.2 The Outer Segment from a light wave perspective
As in conventional antenna theory, the OS can be described in terms of a group of individual resonators forming atwo or three-dimensional array. Because of the sharing of electrons by the molecules of an individual disk coating,each coating looks like two clouds of electrons separated by a conductor of finite length. Each cloud isapproximately the diameter of the disk. The resonant frequency of each coating is determined by the effectivedistance and the velocity of electron propagation between the two clouds. The velocity of propagation of excitonenergy has been shown to be quite slow in a resonant conjugated structure. The propagation along the resonant axisof such a structure is approximately 230 times slower than free space propagation (the speed of light)89. A slowwave factor is defined as the ratio of this velocity to the free space speed of light.
To determine the exact relationship between the wavelength of excitation and the ability of the chromophore todetect it efficiently, a number of factors are involved. The principal factors are the actual slow wave factor and theexact geometry of the chromophores. Detailed knowledge of the stereo geometry of the chromophores in the liquidcrystalline film on the surface of the opsin substrate is required. Neither of these values is known precisely at thistime. Figure 4.3.4-1 presents a nomograph illustrating the relationships involved. Wolken has given a value of fiveAngstrom for the diameter and ~15 Angstrom for the length of the retinal molecule (in some publications, hedropped the approximation sign). It can be assumed that the Rhodonine molecule will not be significantly differentin length although it may be slightly less circular. All of the available data suggests the chromophores of vision aredeposited on the opsin substrate as a liquid crystalline film. These chromophores are defined as Rhodonine, arederivatives of retinol, and are discussed in Chapter 5. If Rhodonine is deposited on the substrate as a Type Asmectic film, then the molecules would be arranged perpendicular to the surface of the opsin and parallel to the
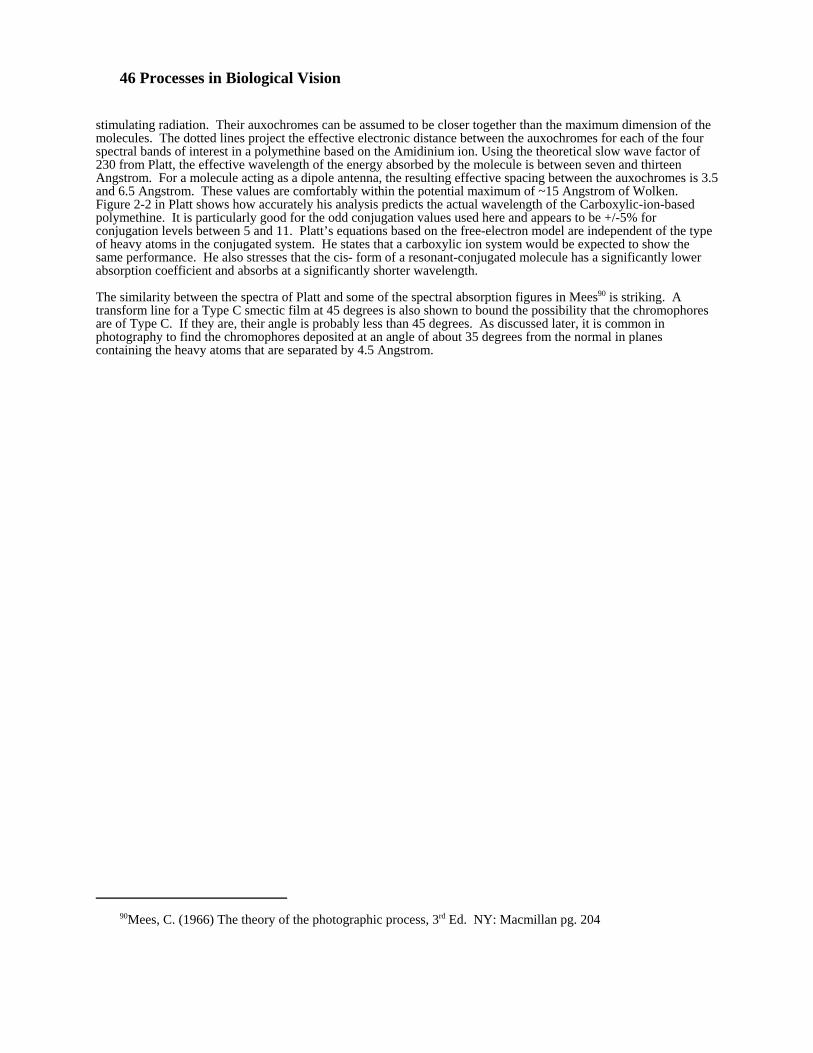
46 Processes in Biological Vision
90Mees, C. (1966) The theory of the photographic process, 3rd Ed. NY: Macmillan pg. 204
stimulating radiation. Their auxochromes can be assumed to be closer together than the maximum dimension of themolecules. The dotted lines project the effective electronic distance between the auxochromes for each of the fourspectral bands of interest in a polymethine based on the Amidinium ion. Using the theoretical slow wave factor of230 from Platt, the effective wavelength of the energy absorbed by the molecule is between seven and thirteenAngstrom. For a molecule acting as a dipole antenna, the resulting effective spacing between the auxochromes is 3.5and 6.5 Angstrom. These values are comfortably within the potential maximum of ~15 Angstrom of Wolken. Figure 2-2 in Platt shows how accurately his analysis predicts the actual wavelength of the Carboxylic-ion-basedpolymethine. It is particularly good for the odd conjugation values used here and appears to be +/-5% forconjugation levels between 5 and 11. Platt’s equations based on the free-electron model are independent of the typeof heavy atoms in the conjugated system. He states that a carboxylic ion system would be expected to show thesame performance. He also stresses that the cis- form of a resonant-conjugated molecule has a significantly lowerabsorption coefficient and absorbs at a significantly shorter wavelength.
The similarity between the spectra of Platt and some of the spectral absorption figures in Mees90 is striking. Atransform line for a Type C smectic film at 45 degrees is also shown to bound the possibility that the chromophoresare of Type C. If they are, their angle is probably less than 45 degrees. As discussed later, it is common inphotography to find the chromophores deposited at an angle of about 35 degrees from the normal in planescontaining the heavy atoms that are separated by 4.5 Angstrom.
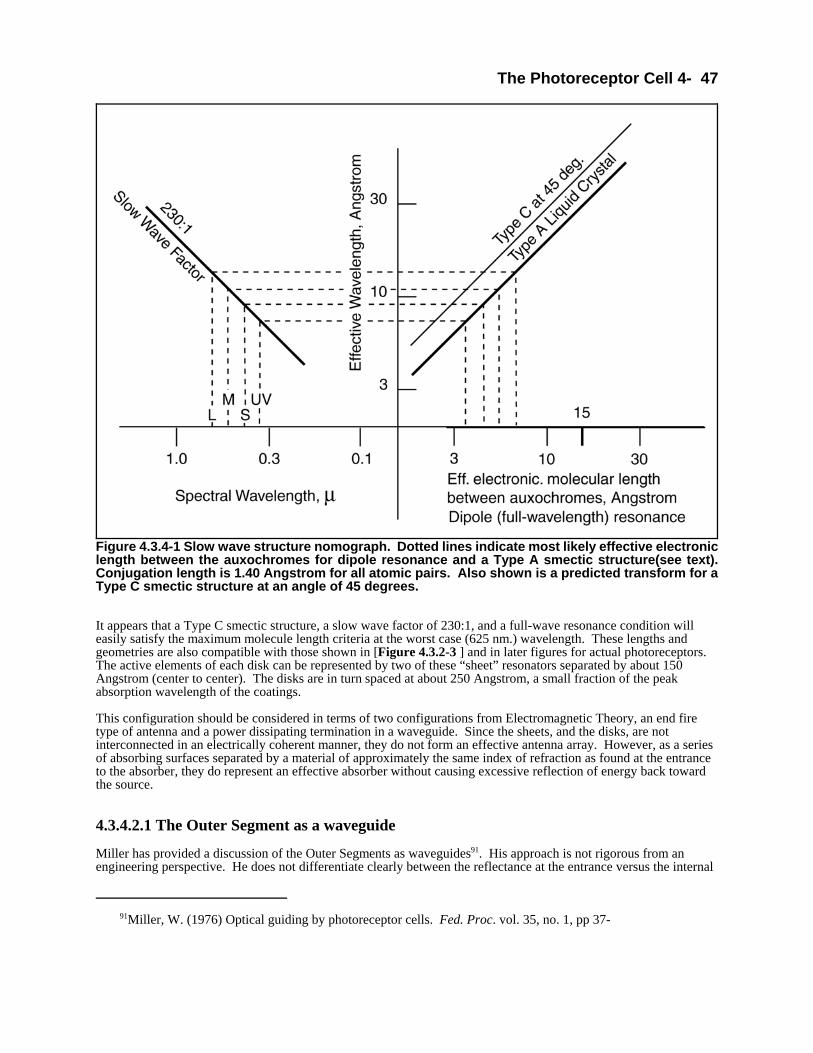
The Photoreceptor Cell 4- 47
91Miller, W. (1976) Optical guiding by photoreceptor cells. Fed. Proc. vol. 35, no. 1, pp 37-
Figure 4.3.4-1 Slow wave structure nomograph. Dotted lines indicate most likely effective electroniclength between the auxochromes for dipole resonance and a Type A smectic structure(see text).Conjugation length is 1.40 Angstrom for all atomic pairs. Also shown is a predicted transform for aType C smectic structure at an angle of 45 degrees.
It appears that a Type C smectic structure, a slow wave factor of 230:1, and a full-wave resonance condition willeasily satisfy the maximum molecule length criteria at the worst case (625 nm.) wavelength. These lengths andgeometries are also compatible with those shown in [Figure 4.3.2-3 ] and in later figures for actual photoreceptors. The active elements of each disk can be represented by two of these “sheet” resonators separated by about 150Angstrom (center to center). The disks are in turn spaced at about 250 Angstrom, a small fraction of the peakabsorption wavelength of the coatings.
This configuration should be considered in terms of two configurations from Electromagnetic Theory, an end firetype of antenna and a power dissipating termination in a waveguide. Since the sheets, and the disks, are notinterconnected in an electrically coherent manner, they do not form an effective antenna array. However, as a seriesof absorbing surfaces separated by a material of approximately the same index of refraction as found at the entranceto the absorber, they do represent an effective absorber without causing excessive reflection of energy back towardthe source.
4.3.4.2.1 The Outer Segment as a waveguide
Miller has provided a discussion of the Outer Segments as waveguides91. His approach is not rigorous from anengineering perspective. He does not differentiate clearly between the reflectance at the entrance versus the internal
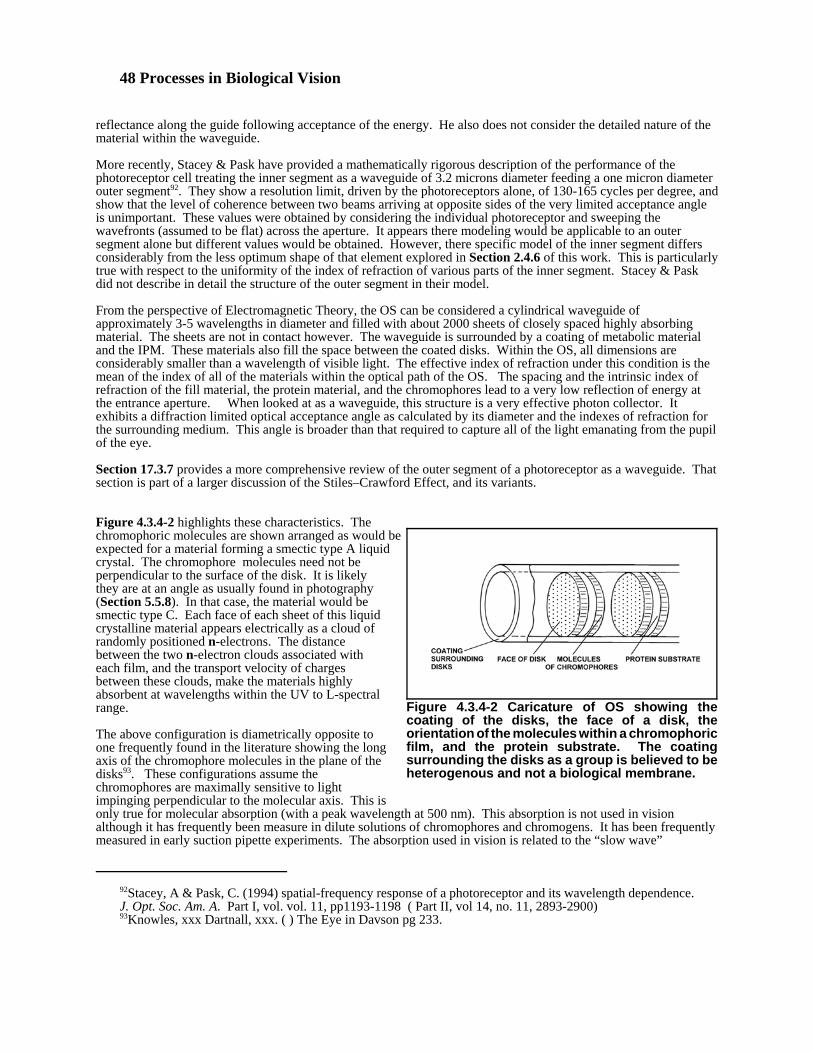
48 Processes in Biological Vision
92Stacey, A & Pask, C. (1994) spatial-frequency response of a photoreceptor and its wavelength dependence.J. Opt. Soc. Am. A. Part I, vol. vol. 11, pp1193-1198 ( Part II, vol 14, no. 11, 2893-2900)93Knowles, xxx Dartnall, xxx. ( ) The Eye in Davson pg 233.
Figure 4.3.4-2 Caricature of OS showing thecoating of the disks, the face of a disk, theorientation of the molecules within a chromophoricfilm, and the protein substrate. The coatingsurrounding the disks as a group is believed to beheterogenous and not a biological membrane.
reflectance along the guide following acceptance of the energy. He also does not consider the detailed nature of thematerial within the waveguide.
More recently, Stacey & Pask have provided a mathematically rigorous description of the performance of thephotoreceptor cell treating the inner segment as a waveguide of 3.2 microns diameter feeding a one micron diameterouter segment92. They show a resolution limit, driven by the photoreceptors alone, of 130-165 cycles per degree, andshow that the level of coherence between two beams arriving at opposite sides of the very limited acceptance angleis unimportant. These values were obtained by considering the individual photoreceptor and sweeping thewavefronts (assumed to be flat) across the aperture. It appears there modeling would be applicable to an outersegment alone but different values would be obtained. However, there specific model of the inner segment differsconsiderably from the less optimum shape of that element explored in Section 2.4.6 of this work. This is particularlytrue with respect to the uniformity of the index of refraction of various parts of the inner segment. Stacey & Paskdid not describe in detail the structure of the outer segment in their model.
From the perspective of Electromagnetic Theory, the OS can be considered a cylindrical waveguide ofapproximately 3-5 wavelengths in diameter and filled with about 2000 sheets of closely spaced highly absorbingmaterial. The sheets are not in contact however. The waveguide is surrounded by a coating of metabolic materialand the IPM. These materials also fill the space between the coated disks. Within the OS, all dimensions areconsiderably smaller than a wavelength of visible light. The effective index of refraction under this condition is themean of the index of all of the materials within the optical path of the OS. The spacing and the intrinsic index ofrefraction of the fill material, the protein material, and the chromophores lead to a very low reflection of energy atthe entrance aperture. When looked at as a waveguide, this structure is a very effective photon collector. Itexhibits a diffraction limited optical acceptance angle as calculated by its diameter and the indexes of refraction forthe surrounding medium. This angle is broader than that required to capture all of the light emanating from the pupilof the eye.
Section 17.3.7 provides a more comprehensive review of the outer segment of a photoreceptor as a waveguide. Thatsection is part of a larger discussion of the Stiles–Crawford Effect, and its variants.
Figure 4.3.4-2 highlights these characteristics. Thechromophoric molecules are shown arranged as would beexpected for a material forming a smectic type A liquidcrystal. The chromophore molecules need not beperpendicular to the surface of the disk. It is likelythey are at an angle as usually found in photography(Section 5.5.8). In that case, the material would besmectic type C. Each face of each sheet of this liquidcrystalline material appears electrically as a cloud ofrandomly positioned n-electrons. The distancebetween the two n-electron clouds associated witheach film, and the transport velocity of chargesbetween these clouds, make the materials highlyabsorbent at wavelengths within the UV to L-spectralrange.
The above configuration is diametrically opposite toone frequently found in the literature showing the longaxis of the chromophore molecules in the plane of thedisks93. These configurations assume thechromophores are maximally sensitive to lightimpinging perpendicular to the molecular axis. This isonly true for molecular absorption (with a peak wavelength at 500 nm). This absorption is not used in visionalthough it has frequently been measure in dilute solutions of chromophores and chromogens. It has been frequentlymeasured in early suction pipette experiments. The absorption used in vision is related to the “slow wave”

The Photoreceptor Cell 4- 49
94Davson, H. (1990) Physiology of the Eye. NY: Pergamon Press. pg 233-234
absorption. This absorption occurs at wavelengths of 342, 437, 532 or 625 nm and is optimally effective when thelight impinges parallel to the axis of the individual chromophores. The orientation of the chromophores presentedabove leads to a different interpretation of the material in Davson (with largely the same results)94.
The spectral characteristics of this configuration when examined in the laboratory are complicated due to the manyspecial properties of the chromophores. The individual chromophore molecules exhibit an isotropic spectralcharacteristic related to “molecular absorption.” This absorption is directly related to the physical size of the entiremolecule. This is the spectrum usually reported in the literature, based on measurements of dilute solutions, and onelectrophysiological experiments on Outer Segments with transverse illumination, either in-vivo or in-vitro. Thewavelength observed (~500 nm) is characteristic of retinol and all retinenes and Rhodonines. This absorption isstrongest when the Poynting vector of the incident light is perpendicular to the long axis of the molecules and theelectric field is parallel to the length of the individual molecules. This is the absorption traditionally reported in theliterature and associated with the radiation from or to a dipole antenna. It is not the primary absorption characteristicof vision.
There is a second highly anisotropic absorption characteristic associated with the spectra of vision. This absorptionspectrum is maximum when the Poynting vector of the illumination is parallel to the axis of the resonant retinoid. Under this condition, absorption is maximum when the frequency of the illumination is the same as the resonantfrequency of the resonant liquid crystalline structure. This spectrum is normally only measured in retro-reflectionabsorption experiments on in-vivo specimens. Most recently it has also been measured in quasi-in-vivo experimentsusing suction-pipette techniques. It is only exhibited when the chromophoric material is in the liquid crystallinestate. In addition, it shows no polarization preference. This is why the face of the disks in the above figure shows anarray of dots instead of an array of bars as found elsewhere in the literature. The dots do not suggest any polarizationpreference.

50 Processes in Biological Vision
95Brown, G. & Wolken, J. (1979) Liquid Crystals and Biological Membranes. NY: Academic Press, pg 12496Martin, J. (1996) Neuroanatomy: atlas and text. Stamford CT: Appleton & Lange pg. 132
4.3.4.3 The chemical composition of the outer segment
There is little data on the composition of the outer segments and most of the data is questionable based on theextraction techniques used to obtain it. Brown & Wolken have provided an early table based on a variety of sourcesthat they did not identify95. Nor did they describe the techniques used to collect the data. They averaged thecollected values. Lacking a model, it is not clear whether the data incorporates parts of photoreceptor cells, Muellercells or RPE cells. Nor does it indicate whether the materials found within the IPM were included in the values. Nocategory was provided in the table for retinoids or a putative rhodopsin containing a retinoid.
While the molecular weight of the Rhodonines (285-299) is much less than the protein of the substrate (opsin =~41,000), and they are both present in a monolayer configuration, it is important that a value be determined for theamount of chromophore present in any analysis of the outer segments. In 1982, Corless, et. al. indicated that morethan 90% of the mass of the outer segment is protein. Based on the relative thickness of the chromophore layer andthe protein layer of this work, and excluding any other material from the IPM, the number should be on the order of80%. Section 4.3.5 addresses this subject in more detail.
4.3.4.4 Summary of the Outer Segment Histology
In summary, the component commonly called the outer segment in the literature is not a component part of thephotoreceptor cell at all. It is not contained within the cell membrane. It is an exocellular element that afterformation acts as a transducer for the excitation of the nerve part of the photoreceptor cell. In this sense, the neuro-anatomist would label the Outer Segment a capsule in intimate contact with the nerve endings. The combination of acapsule and a neuron in intimate contact is frequently defined as a mechano-receptor96. This definition appears toapply in the photoreceptor case if the capsule is considered a quantum-mechanical transducer stimulating a neuron.
In the vertebrate and some other eyes, this capsule is surrounded by the dendrites of the neural portion of thephotoreceptor cell. The capsule consists of a stack of disks. In other species, the capsule surrounds the neuraldendrites in which case, it is called a retinula--although the literature is inconsistent in this name. The retinula isfrequently made up of a set of sectors, as in an orange, instead of disks. However, the functional purpose is stillachieved, separating the chromophoric liquid crystalline material into a number of individual, electrically isolated,elements.
The nerve portion of the photoreceptor cell is conventional, receiving “irritation” from the “outer segment” andsynapsing with another nerve cell at its foot. The variation in the shape of the pedicles among the photoreceptorcells serve only to accommodate the variable number of synapsis involved
The principal components of the outer segment are the disks which support the chromophores that absorb theincident light. These disks are coated on their exterior surfaces with the chromophore. The substrate of the disks isa well-characterized protein material, opsin. There is significant space between the coated disks, even near the edgeswhere they are most closely packed. The available data indicate considerable experimental range in the 20-50Angstrom thickness of the substrate, while indicating the auxochrome pitch to be 50 Angstrom and the chromophorepitch to be 60-70 Angstrom. In his Figure 9-24, Hogan portrays the major difference between his two cases,presumed to be from a morphological rod and a morphological cone, as due to the difference in thickness of thesubstrate layer. This may be the situation, however, his broad brush in the schematic does not provide the desireddegree of authenticity for these numbers. Both Vanderkooi & Sundaralingam and Nilsson provide a significantlymore detailed interpretation of these dimensions with both leading to a lower auxochrome spacing. Anotherinteresting observation is that the space between the disks is quite considerable, some 50 Angstroms near thethickened edges and as much as 165 Angstroms near the center of the disks. This spacing leaves room forconsiderable hydraulic and metabolic activity to occur within the space between the disks.
The conventional wisdom, as quoted by Rodieck, is that an effective “ . . . chromophore absorbs light to the degreethat its conjugated chain lies (1) perpendicular to the light ray and (2) parallel with its electric vector.” This“wisdom” is not based on a model of the underlying process. It appears to be based on his interpretation of theparameters compatible with common crossfire antenna theory. This work does not support this position.

The Photoreceptor Cell 4- 51
97Liebman, P. (1962) In Situ microspectrophotometric studies on the pigments of single retinal rods. Biophys. J. vol. 2, pp. 161-178 Also in Rodieck (1973) pg 14098Nilsson, S. (1964) Receptor cell outer segment development and ultrastructure of the disk membranes in theretina of the tadpole (Rana pipiens). J Ultrastructure. Res vol. 11, pp 581-62099Nilsson, S. (1965) The ultrastructure of the receptor Outer Segments in the retina of the leopard frog (Ranapipiens) J. Ultrastructure. Res. vol. 12, pp 207-231100Nilsson, S. & Crescitelli, F. (1969) Changes in ultrastructure and electroretinogram of bullfrog retina duringdevelopment, J. Ultrastructure. Res. vol. 27, pp 45-62101Eakin, R. & Kuda, A. (1971) xxx J. Ultrastruct. Res. vol. 112, pg 287
The configuration proposed in this work places the axes of the chromophores, the conjugated carbon chainsconnecting the two auxochromes, parallel to the expected direction of the incident light ray in chordates. Thisconfiguration is called the end-fire condition in antenna theory. It is compatible with the slow-wave theory ofphotoexcitation of Platt. It also results in a highly anisotropic absorption pattern.
The proposed structure is compatible with all of the orientation data referenced by Rodieck. Of some possiblesignificance is the reference to Liebman97 wherein Liebman discusses the possibility that the axis of an individualchromophore may not be exactly perpendicular to the surface of the substrate and therefore exactly parallel to thedirection of the incident light ray. This may be true for at least three reasons. There is an angular dispersion to thelight rays entering an outer segment and the light rays within this bundle are reflected down the length of the diskstack, acting as a waveguide, at a variety of angles. More importantly, as frequently found in photography, thechromophores making up the liquid crystal may assume an angle other than 90 degrees to the substrate in order tosatisfy packing factor requirements. This is a small but probably a measurable factor. Finally, there is no assuranceor requirement that the two liquid crystalline layers on opposite sides of a substrate have the molecular axes of thechromophores parallel.
Most of the literature has examined and discussed the structure related to photo-transduction in a static context. Thus they speak of the disks or rhabdomere as being invaginations of a cell wall without concern as to how they gotthere. Some authors speak of these photo-transduction structures as based on cilia and other speak of these as basedon microvilli. Such differences are not easily defensible because of the wide variety of shapes found for thesestructures in different animals. This work proposes that the protein portion of all disks and/or rhabdomere is formedby a secretion from the photoreceptor cell. Whether the resultant material is formed as a single strip or as multipleadjacent rods is not of great consequence as far as the basic extrusion process is concerned.
It is clear that different mechanisms are involved in processing the protein material of the disks and the retinoidmaterial of the chromophores. Section 4.6.2.3 will discuss the autoradiographic data supporting the separation of thedisk formation and the disk activation processes.
4.3.5 Detailed structure of the Outer Segment
Nilsson provided a series of papers during the 1960's that are probably the most comprehensive studies available ofthe Outer Segment at sufficient resolution to answer many questions98,99,100. He achieved a resolution on the order of20 Angstrom in that time period. That resolution should be sufficient to resolve a plasma membrane of some 150Angstrom. Although he speaks of a plasma membrane surrounding the Outer Segment, his images do not resolvesuch a bilayer structure. His images do show numerous structural features on the order of 50-60 Angstrom. Hisreferral to magnifications of x745,000 and x800,000 may involve photographic enlargement as much as electron-micrographic enlargement. These numbers do not infer higher limiting resolution than his work at x300,000.
4.3.5.1 Mechanical formation of the disk stack (EXTRUSION AND COATING)
There is insufficient information on the precise method of protein secretion by the inner segment in Chordata. Aquestion remains as to whether the protein is secreted in fine filaments from numerous individual points, as inspiders prior to winding the filaments into a cable, or whether the material is secreted as a liquid and pressed into asheet. In Mollusca, it appears more certain that individual filaments are initially secreted. The question is thenwhether the filaments are formed into ordered sheets that still exhibit parallel striations reminiscent of their origin. The latter appear likely based on the sensitivity to light polarization found in various crustaceans and molluscs.
In Chordata, it is interesting to note that one of the lower members of the phyla leading to the vertebrates, theascidians do not have disks aligned perpendicular to the axis of the inner segment. These animals have what appearto be parallel slabs of protein extruded from rows of secretory points much like in Mollusca101. See Section 4.2.1.
52 Processes in Biological Vision
This would suggest that the fundamental secretory process in all chordates is similar to that in Mollusca. However,in the immediately following process in vertebrates, the protein sheets are turned and broken into disks prior toextrusion through the calyx. Whether the disks of vertebrates are formed singly or in parallel may impact theportrayal used in this chapter based on Papermaster, et. al.
Figure 4.3.5-1, adapted from Papermaster, shows more clearly the dendritic structure of the neuron passing throughthe ciliary collar on the way to the outer segment. It also shows additional steps in the formation of the disks. Although not easily identified in electron micrographs, there are holes in the Calyx of the inner segment that allowthe fluid of the IPM to enter this chamber. The raw protein material, opsin, is secreted into the cup of the InnerSegment behind the Calyx. The protein proceeds to form into a liquid crystalline sheet within the cup. However, itis forced to fold back and forth under the influence of the inner Calyx wall. The Calyx has a shoulder near theciliary collar that forces the protein material to begin forming a strip of liquid crystalline protein. This sheet crossesthe calyx and then forms a new fold. As the material enfolds and becomes more rigid in the new fluid environmentof the IPM, it fractures into disks at the sharp bends. These disks are further shaped by the Calyx as shown belowand then coated by the chromophoric material. The drawing shows the raw disks as straight lines. The emphasis inthe drawing changes after coating. It has become conventional to emphasize the shape of the coating on the disksrather than the protein substrate. After disk formation and coating, the assembly leaves the Calyx. In the process ofleaving the Calyx, the assembly becomes coated with metabolic material needed for the electrical operation of thedendrites. The metabolic material is a coating and not a membrane in the semantics of this work. This coating ismaintained for the life of the disk. It is stripped away as the disks enter the digestive area of the RPE cells prior tophagocytosis of the disks themselves.
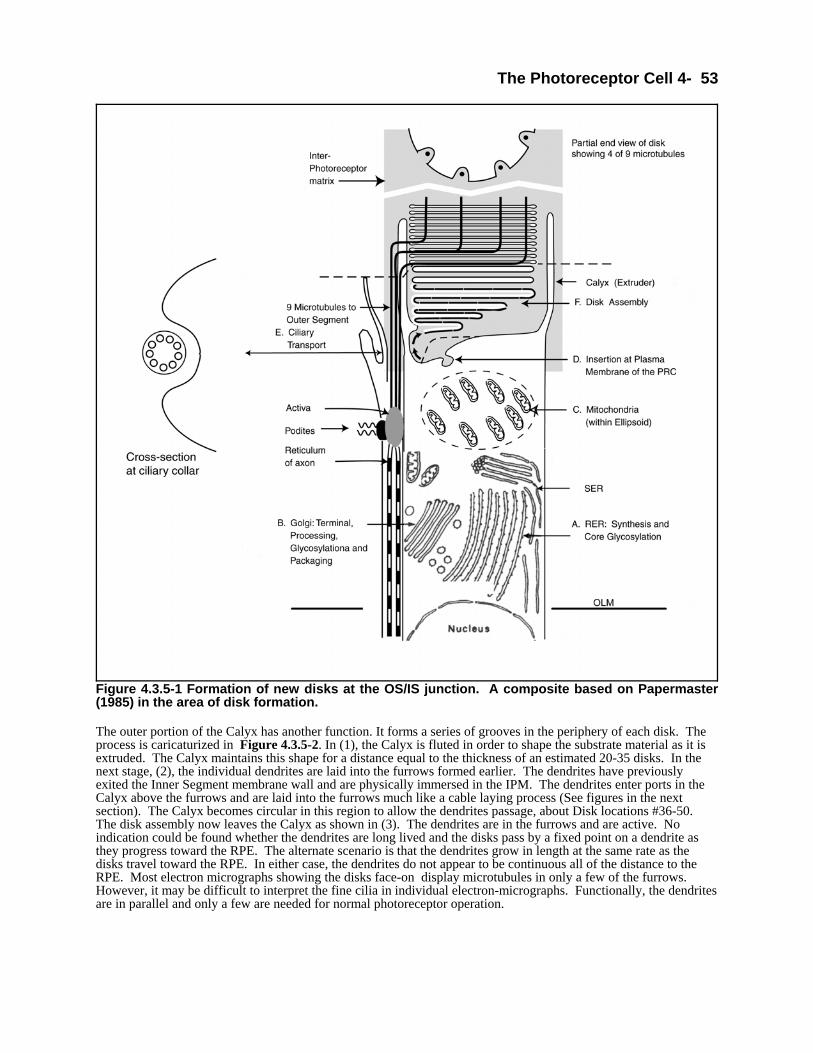
The Photoreceptor Cell 4- 53
Figure 4.3.5-1 Formation of new disks at the OS/IS junction. A composite based on Papermaster(1985) in the area of disk formation.
The outer portion of the Calyx has another function. It forms a series of grooves in the periphery of each disk. Theprocess is caricaturized in Figure 4.3.5-2. In (1), the Calyx is fluted in order to shape the substrate material as it isextruded. The Calyx maintains this shape for a distance equal to the thickness of an estimated 20-35 disks. In thenext stage, (2), the individual dendrites are laid into the furrows formed earlier. The dendrites have previouslyexited the Inner Segment membrane wall and are physically immersed in the IPM. The dendrites enter ports in theCalyx above the furrows and are laid into the furrows much like a cable laying process (See figures in the nextsection). The Calyx becomes circular in this region to allow the dendrites passage, about Disk locations #36-50. The disk assembly now leaves the Calyx as shown in (3). The dendrites are in the furrows and are active. Noindication could be found whether the dendrites are long lived and the disks pass by a fixed point on a dendrite asthey progress toward the RPE. The alternate scenario is that the dendrites grow in length at the same rate as thedisks travel toward the RPE. In either case, the dendrites do not appear to be continuous all of the distance to theRPE. Most electron micrographs showing the disks face-on display microtubules in only a few of the furrows. However, it may be difficult to interpret the fine cilia in individual electron-micrographs. Functionally, the dendritesare in parallel and only a few are needed for normal photoreceptor operation.
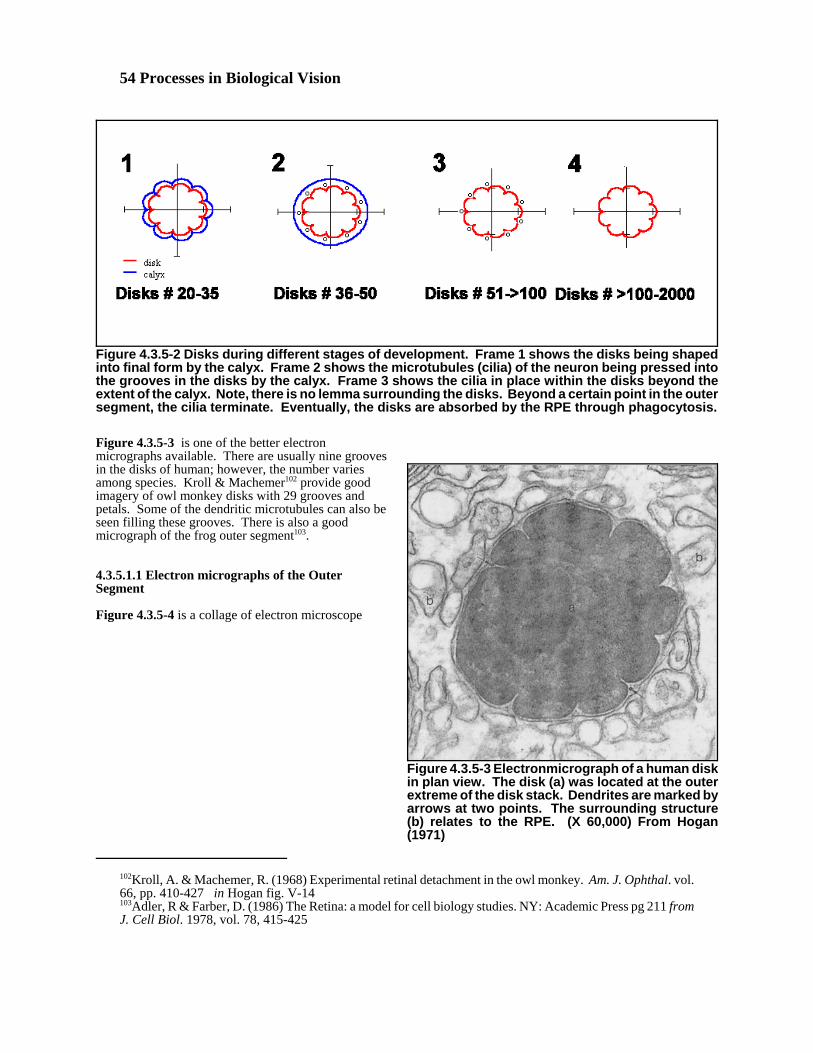
54 Processes in Biological Vision
102Kroll, A. & Machemer, R. (1968) Experimental retinal detachment in the owl monkey. Am. J. Ophthal. vol.66, pp. 410-427 in Hogan fig. V-14103Adler, R & Farber, D. (1986) The Retina: a model for cell biology studies. NY: Academic Press pg 211 fromJ. Cell Biol. 1978, vol. 78, 415-425
Figure 4.3.5-2 Disks during different stages of development. Frame 1 shows the disks being shapedinto final form by the calyx. Frame 2 shows the microtubules (cilia) of the neuron being pressed intothe grooves in the disks by the calyx. Frame 3 shows the cilia in place within the disks beyond theextent of the calyx. Note, there is no lemma surrounding the disks. Beyond a certain point in the outersegment, the cilia terminate. Eventually, the disks are absorbed by the RPE through phagocytosis.
Figure 4.3.5-3 Electronmicrograph of a human diskin plan view. The disk (a) was located at the outerextreme of the disk stack. Dendrites are marked byarrows at two points. The surrounding structure(b) relates to the RPE. (X 60,000) From Hogan(1971)
Figure 4.3.5-3 is one of the better electronmicrographs available. There are usually nine groovesin the disks of human; however, the number variesamong species. Kroll & Machemer102 provide goodimagery of owl monkey disks with 29 grooves andpetals. Some of the dendritic microtubules can also beseen filling these grooves. There is also a goodmicrograph of the frog outer segment103.
4.3.5.1.1 Electron micrographs of the OuterSegment
Figure 4.3.5-4 is a collage of electron microscope

The Photoreceptor Cell 4- 55
104Autrum, H. (1979) Comparative Physiology and Evolution of Vision in Invertebrates. NY: Springer-Verlag,pp 127-130105Nolte, J. (1999) The Human Brain. St. Louis, MO: Mosby pg 404106Matsuura, T. Miller, W. & Tomita, T. (1977) Op. Cit. pg 769107Steinberg, R. (1973) Scanning electron microscopy of the bullfrog’s retina and pigment epithelium Z.Zellforsch. vol. 143, pp 451-463108Adler, R. & Farber, D. (1986) Op. Cit. pg 7
pictures from Tiering and Miller, writing in Autrum 104. By going to the references cited, uncropped images of evenhigher resolution are available. Tiering’s figure 35 from a pig (shown in upper left) is particularly useful invisualizing the length over diameter ratio of typical Outer Segments and locating the photoreceptors relative to theouter limiting membrane. A similar figure from Steinberg appears in Nolte and gives even more detail about theINM/IPM interface105. Figure 37 of Miller from a frog, Rana Catesbiana, (and shown in the remainder of the abovefigure) is at a higher magnification and shows many details. Frame C of that figure is shown without cropping andat a larger scale in Matsurra, et. al106 where it is credited to Steinberg107. Note carefully the considerable surfaceroughness associated with the exterior of each Outer Segment. This roughness does not suggest the presence of ashrouding membrane. Careful examination of many of these figures will show a relatively smooth outer surface forthe overall structure near the Outer Limiting Membrane that then becomes rougher and the furrows become moredistinct. This interface is indicative of the end of the calyx. Steinberg has specifically noted this feature in his figure6 where the beginning of the furrows is quite recognizable. Note also the multiple microtubules (many more than inhumans) surrounding the Inner Segment near the Outer Limiting Membrane and prior to their entry into the calyxarea. These appear to be being placed in the individual furrows of the disk stack. These furrows are generallynarrower than the resolution of the image but they can be seen as long vertical lines at various points in the figure. Note also the twisting of the disk stack on the left in frame C as indicated by the curvature of the furrows. Thephotoreceptor stack in the center of the figure appears to have become disconnected from the inner segment and isprobably no longer functional. The remaining connection to the disk stack is labeled a myoid (3) in the Miller figurebut not in Matsuura or Steinberg. No microtubules are seen connecting to this disk stack, although there may be aremnant visible near the outer limiting membrane. Note also the deep indentations in the broken segment, in theupper left of the Matsuura and Steinberg images, which do not appear to be compatible with a shrouding membrane. Finally, there is no debris from torn exterior membranes in the vicinity of the ends of the disk stacks and the ends ofsome microtubules appear to be visible around the perimeter of some disk stacks. A picture is also available inAdler & Farber credited to Flannery108.

56 Processes in Biological Vision
Figure 4.3.5-4 A collage of photoreceptor Outer Segments.
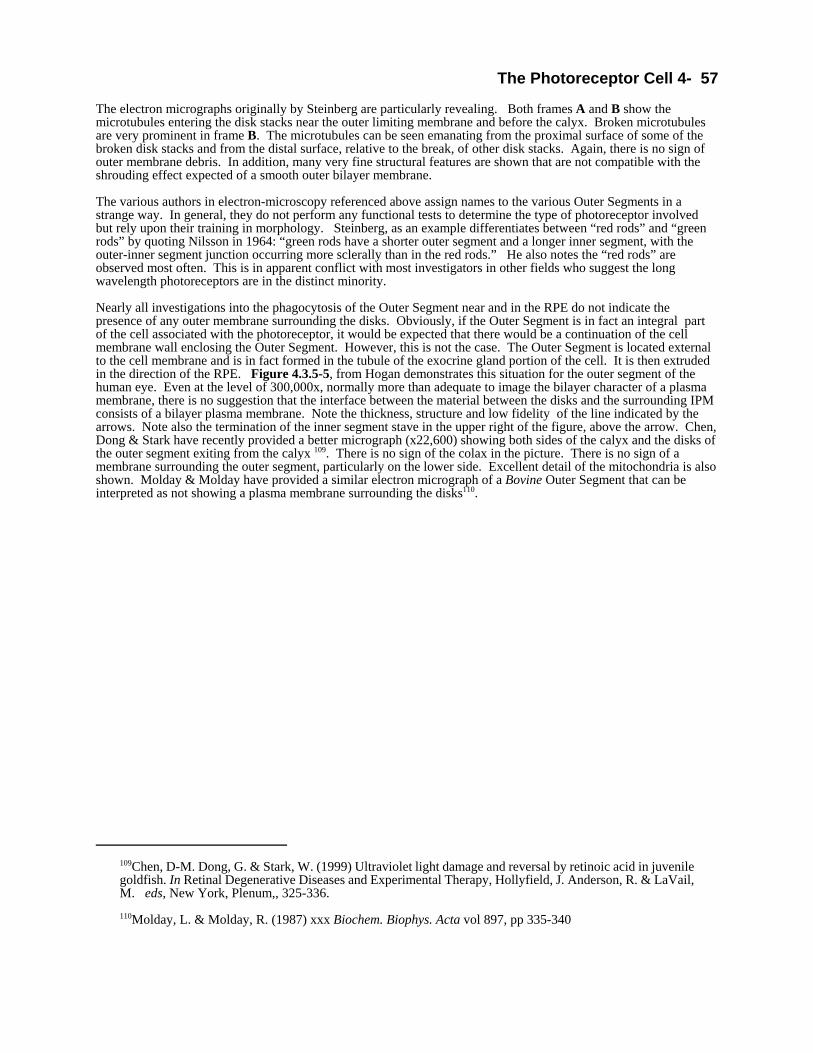
The Photoreceptor Cell 4- 57
109Chen, D-M. Dong, G. & Stark, W. (1999) Ultraviolet light damage and reversal by retinoic acid in juvenilegoldfish. In Retinal Degenerative Diseases and Experimental Therapy, Hollyfield, J. Anderson, R. & LaVail,M. eds, New York, Plenum,, 325-336.110Molday, L. & Molday, R. (1987) xxx Biochem. Biophys. Acta vol 897, pp 335-340
The electron micrographs originally by Steinberg are particularly revealing. Both frames A and B show themicrotubules entering the disk stacks near the outer limiting membrane and before the calyx. Broken microtubulesare very prominent in frame B. The microtubules can be seen emanating from the proximal surface of some of thebroken disk stacks and from the distal surface, relative to the break, of other disk stacks. Again, there is no sign ofouter membrane debris. In addition, many very fine structural features are shown that are not compatible with theshrouding effect expected of a smooth outer bilayer membrane.
The various authors in electron-microscopy referenced above assign names to the various Outer Segments in astrange way. In general, they do not perform any functional tests to determine the type of photoreceptor involvedbut rely upon their training in morphology. Steinberg, as an example differentiates between “red rods” and “greenrods” by quoting Nilsson in 1964: “green rods have a shorter outer segment and a longer inner segment, with theouter-inner segment junction occurring more sclerally than in the red rods.” He also notes the “red rods” areobserved most often. This is in apparent conflict with most investigators in other fields who suggest the longwavelength photoreceptors are in the distinct minority.
Nearly all investigations into the phagocytosis of the Outer Segment near and in the RPE do not indicate thepresence of any outer membrane surrounding the disks. Obviously, if the Outer Segment is in fact an integral partof the cell associated with the photoreceptor, it would be expected that there would be a continuation of the cellmembrane wall enclosing the Outer Segment. However, this is not the case. The Outer Segment is located externalto the cell membrane and is in fact formed in the tubule of the exocrine gland portion of the cell. It is then extrudedin the direction of the RPE. Figure 4.3.5-5, from Hogan demonstrates this situation for the outer segment of thehuman eye. Even at the level of 300,000x, normally more than adequate to image the bilayer character of a plasmamembrane, there is no suggestion that the interface between the material between the disks and the surrounding IPMconsists of a bilayer plasma membrane. Note the thickness, structure and low fidelity of the line indicated by thearrows. Note also the termination of the inner segment stave in the upper right of the figure, above the arrow. Chen,Dong & Stark have recently provided a better micrograph (x22,600) showing both sides of the calyx and the disks ofthe outer segment exiting from the calyx 109. There is no sign of the colax in the picture. There is no sign of amembrane surrounding the outer segment, particularly on the lower side. Excellent detail of the mitochondria is alsoshown. Molday & Molday have provided a similar electron micrograph of a Bovine Outer Segment that can beinterpreted as not showing a plasma membrane surrounding the disks110.
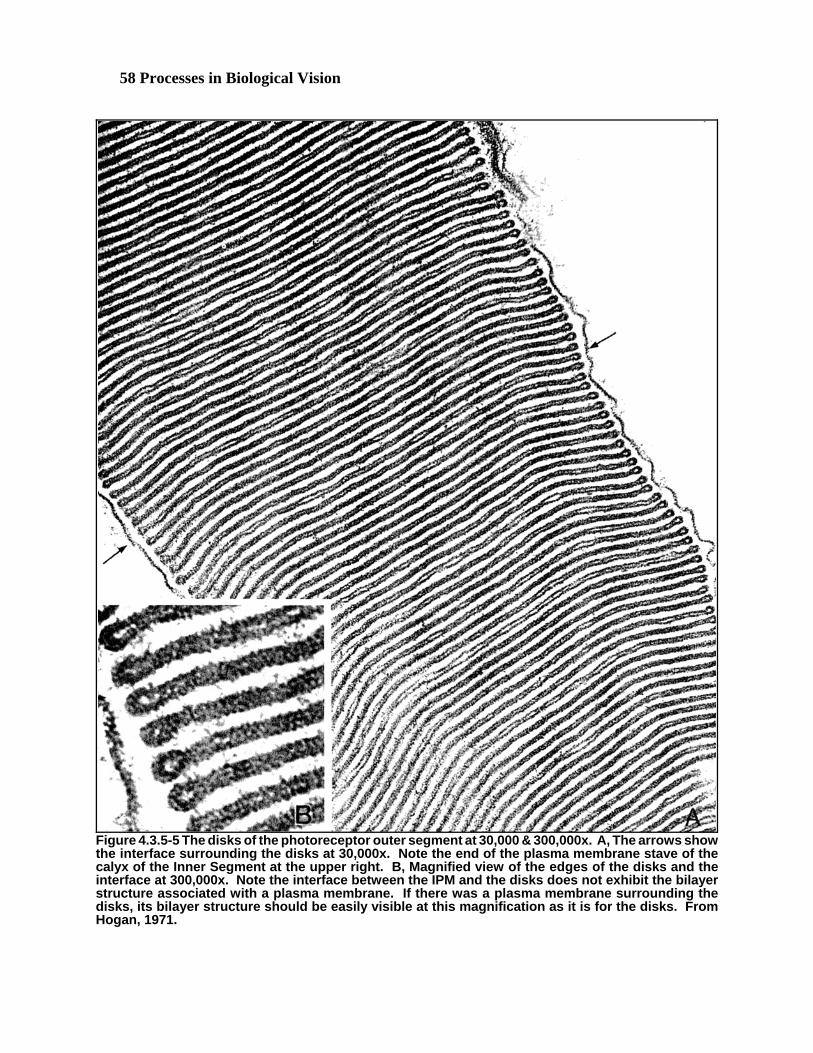
58 Processes in Biological Vision
Figure 4.3.5-5 The disks of the photoreceptor outer segment at 30,000 & 300,000x. A, The arrows showthe interface surrounding the disks at 30,000x. Note the end of the plasma membrane stave of thecalyx of the Inner Segment at the upper right. B, Magnified view of the edges of the disks and theinterface at 300,000x. Note the interface between the IPM and the disks does not exhibit the bilayerstructure associated with a plasma membrane. If there was a plasma membrane surrounding thedisks, its bilayer structure should be easily visible at this magnification as it is for the disks. FromHogan, 1971.
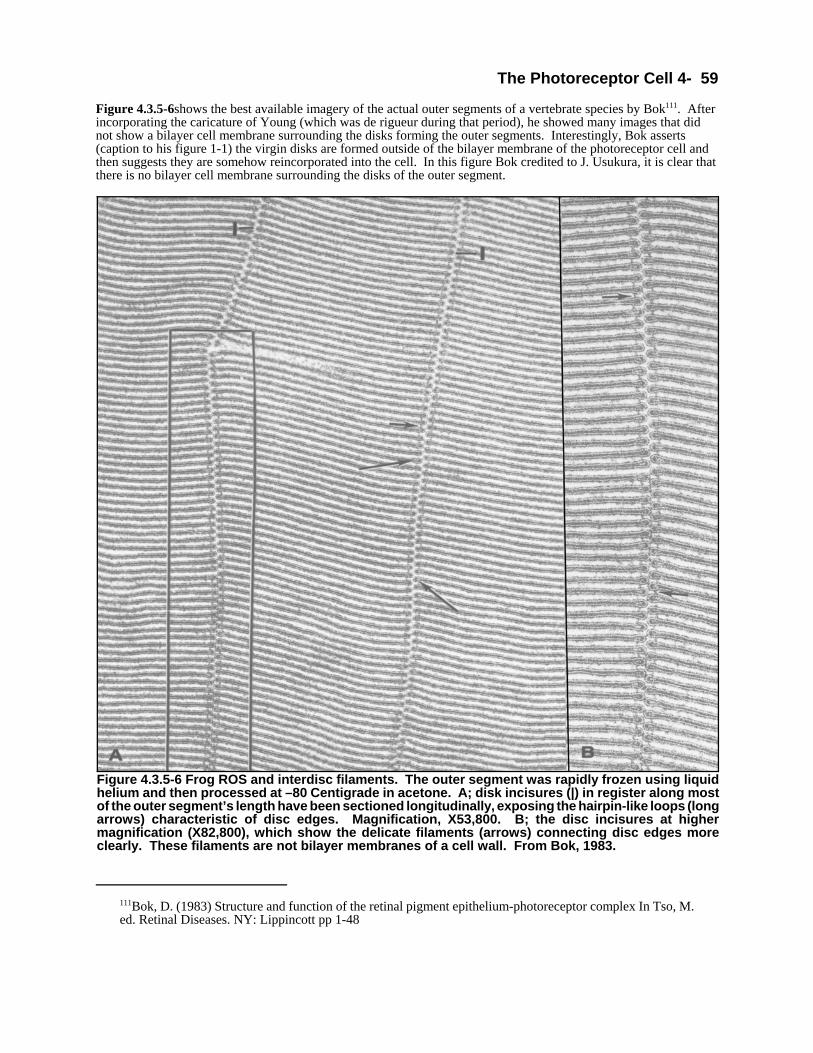
The Photoreceptor Cell 4- 59
111Bok, D. (1983) Structure and function of the retinal pigment epithelium-photoreceptor complex In Tso, M.ed. Retinal Diseases. NY: Lippincott pp 1-48
Figure 4.3.5-6shows the best available imagery of the actual outer segments of a vertebrate species by Bok111. Afterincorporating the caricature of Young (which was de rigueur during that period), he showed many images that didnot show a bilayer cell membrane surrounding the disks forming the outer segments. Interestingly, Bok asserts(caption to his figure 1-1) the virgin disks are formed outside of the bilayer membrane of the photoreceptor cell andthen suggests they are somehow reincorporated into the cell. In this figure Bok credited to J. Usukura, it is clear thatthere is no bilayer cell membrane surrounding the disks of the outer segment.
Figure 4.3.5-6 Frog ROS and interdisc filaments. The outer segment was rapidly frozen using liquidhelium and then processed at –80 Centigrade in acetone. A; disk incisures (|) in register along mostof the outer segment’s length have been sectioned longitudinally, exposing the hairpin-like loops (longarrows) characteristic of disc edges. Magnification, X53,800. B; the disc incisures at highermagnification (X82,800), which show the delicate filaments (arrows) connecting disc edges moreclearly. These filaments are not bilayer membranes of a cell wall. From Bok, 1983.
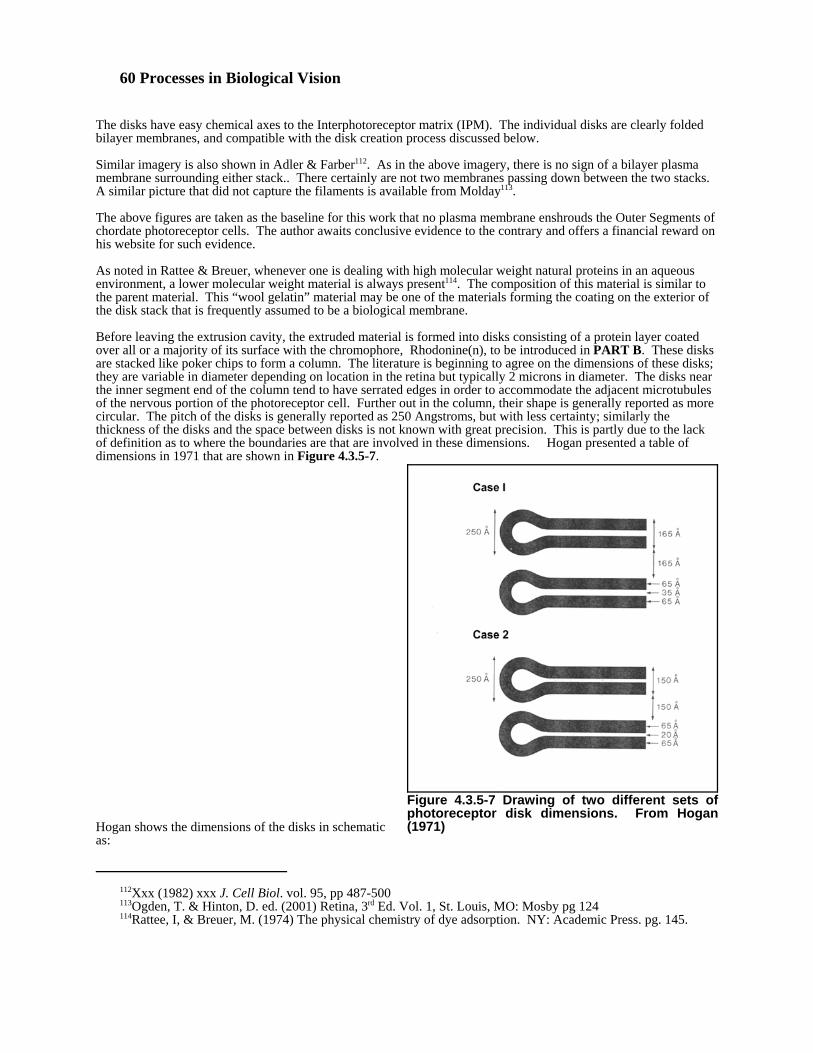
60 Processes in Biological Vision
112Xxx (1982) xxx J. Cell Biol. vol. 95, pp 487-500113Ogden, T. & Hinton, D. ed. (2001) Retina, 3rd Ed. Vol. 1, St. Louis, MO: Mosby pg 124114Rattee, I, & Breuer, M. (1974) The physical chemistry of dye adsorption. NY: Academic Press. pg. 145.
Figure 4.3.5-7 Drawing of two different sets ofphotoreceptor disk dimensions. From Hogan(1971)
The disks have easy chemical axes to the Interphotoreceptor matrix (IPM). The individual disks are clearly foldedbilayer membranes, and compatible with the disk creation process discussed below.
Similar imagery is also shown in Adler & Farber112. As in the above imagery, there is no sign of a bilayer plasmamembrane surrounding either stack.. There certainly are not two membranes passing down between the two stacks. A similar picture that did not capture the filaments is available from Molday113.
The above figures are taken as the baseline for this work that no plasma membrane enshrouds the Outer Segments ofchordate photoreceptor cells. The author awaits conclusive evidence to the contrary and offers a financial reward onhis website for such evidence.
As noted in Rattee & Breuer, whenever one is dealing with high molecular weight natural proteins in an aqueousenvironment, a lower molecular weight material is always present114. The composition of this material is similar tothe parent material. This “wool gelatin” material may be one of the materials forming the coating on the exterior ofthe disk stack that is frequently assumed to be a biological membrane.
Before leaving the extrusion cavity, the extruded material is formed into disks consisting of a protein layer coatedover all or a majority of its surface with the chromophore, Rhodonine(n), to be introduced in PART B. These disksare stacked like poker chips to form a column. The literature is beginning to agree on the dimensions of these disks; they are variable in diameter depending on location in the retina but typically 2 microns in diameter. The disks nearthe inner segment end of the column tend to have serrated edges in order to accommodate the adjacent microtubulesof the nervous portion of the photoreceptor cell. Further out in the column, their shape is generally reported as morecircular. The pitch of the disks is generally reported as 250 Angstroms, but with less certainty; similarly thethickness of the disks and the space between disks is not known with great precision. This is partly due to the lackof definition as to where the boundaries are that are involved in these dimensions. Hogan presented a table ofdimensions in 1971 that are shown in Figure 4.3.5-7.
Hogan shows the dimensions of the disks in schematicas:
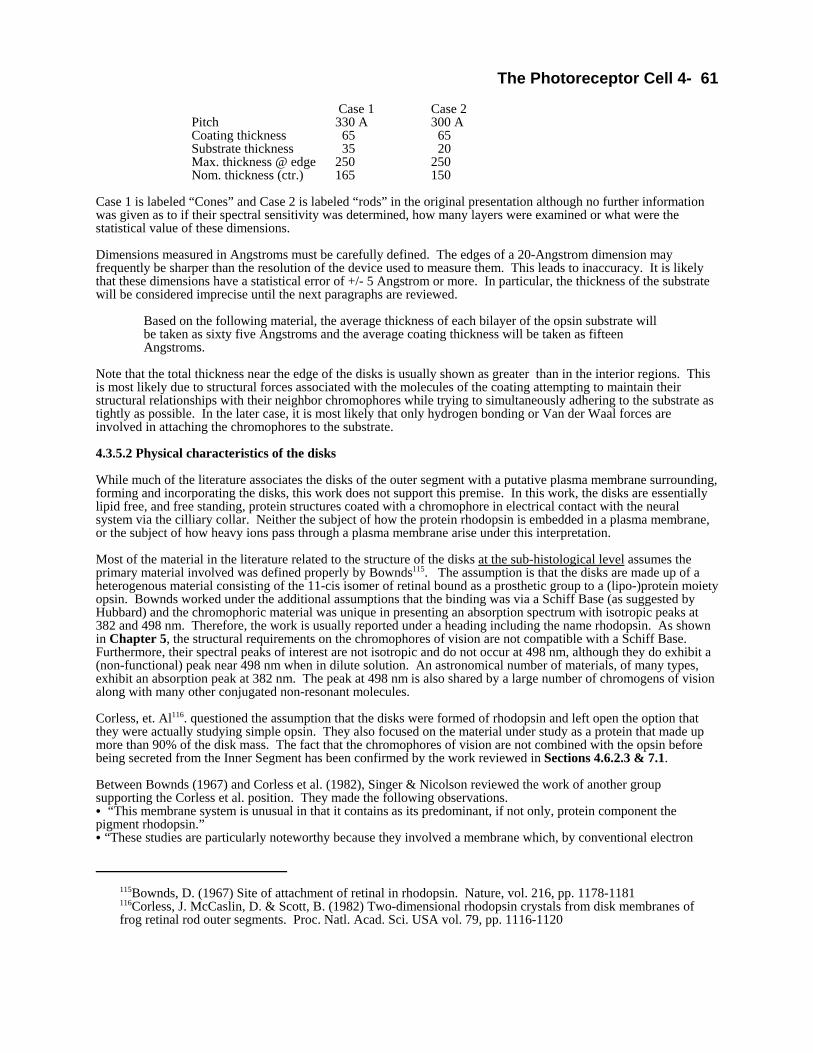
The Photoreceptor Cell 4- 61
115Bownds, D. (1967) Site of attachment of retinal in rhodopsin. Nature, vol. 216, pp. 1178-1181116Corless, J. McCaslin, D. & Scott, B. (1982) Two-dimensional rhodopsin crystals from disk membranes offrog retinal rod outer segments. Proc. Natl. Acad. Sci. USA vol. 79, pp. 1116-1120
Case 1 Case 2Pitch 330 A 300 ACoating thickness 65 65Substrate thickness 35 20Max. thickness @ edge 250 250Nom. thickness (ctr.) 165 150
Case 1 is labeled “Cones” and Case 2 is labeled “rods” in the original presentation although no further informationwas given as to if their spectral sensitivity was determined, how many layers were examined or what were thestatistical value of these dimensions.
Dimensions measured in Angstroms must be carefully defined. The edges of a 20-Angstrom dimension mayfrequently be sharper than the resolution of the device used to measure them. This leads to inaccuracy. It is likelythat these dimensions have a statistical error of +/- 5 Angstrom or more. In particular, the thickness of the substratewill be considered imprecise until the next paragraphs are reviewed.
Based on the following material, the average thickness of each bilayer of the opsin substrate willbe taken as sixty five Angstroms and the average coating thickness will be taken as fifteenAngstroms.
Note that the total thickness near the edge of the disks is usually shown as greater than in the interior regions. Thisis most likely due to structural forces associated with the molecules of the coating attempting to maintain theirstructural relationships with their neighbor chromophores while trying to simultaneously adhering to the substrate astightly as possible. In the later case, it is most likely that only hydrogen bonding or Van der Waal forces areinvolved in attaching the chromophores to the substrate.
4.3.5.2 Physical characteristics of the disks
While much of the literature associates the disks of the outer segment with a putative plasma membrane surrounding,forming and incorporating the disks, this work does not support this premise. In this work, the disks are essentiallylipid free, and free standing, protein structures coated with a chromophore in electrical contact with the neuralsystem via the cilliary collar. Neither the subject of how the protein rhodopsin is embedded in a plasma membrane,or the subject of how heavy ions pass through a plasma membrane arise under this interpretation.
Most of the material in the literature related to the structure of the disks at the sub-histological level assumes theprimary material involved was defined properly by Bownds115. The assumption is that the disks are made up of aheterogenous material consisting of the 11-cis isomer of retinal bound as a prosthetic group to a (lipo-)protein moietyopsin. Bownds worked under the additional assumptions that the binding was via a Schiff Base (as suggested byHubbard) and the chromophoric material was unique in presenting an absorption spectrum with isotropic peaks at382 and 498 nm. Therefore, the work is usually reported under a heading including the name rhodopsin. As shownin Chapter 5, the structural requirements on the chromophores of vision are not compatible with a Schiff Base.Furthermore, their spectral peaks of interest are not isotropic and do not occur at 498 nm, although they do exhibit a(non-functional) peak near 498 nm when in dilute solution. An astronomical number of materials, of many types,exhibit an absorption peak at 382 nm. The peak at 498 nm is also shared by a large number of chromogens of visionalong with many other conjugated non-resonant molecules.
Corless, et. Al116. questioned the assumption that the disks were formed of rhodopsin and left open the option thatthey were actually studying simple opsin. They also focused on the material under study as a protein that made upmore than 90% of the disk mass. The fact that the chromophores of vision are not combined with the opsin beforebeing secreted from the Inner Segment has been confirmed by the work reviewed in Sections 4.6.2.3 & 7.1.
Between Bownds (1967) and Corless et al. (1982), Singer & Nicolson reviewed the work of another groupsupporting the Corless et al. position. They made the following observations. C “This membrane system is unusual in that it contains as its predominant, if not only, protein component thepigment rhodopsin.”C “These studies are particularly noteworthy because they involved a membrane which, by conventional electron
62 Processes in Biological Vision
117Schertler, B. & Hargrave, P. (1995) Projection structure of frog rhodopsin in two crystal forms. Proc. Natl.Acad. Sci. USA, vol. 92, pp. 11578-11582
microscopic techniques, appears to show long-range periodicity over its surface.”
The physical characteristics of the disks are dominated by the structural properties of the opsin substrate. The thincoating of chromophoric material is frequently removed in the process of preparing the disks for study.
As indicated above, the disks in their virgin form are made of protein secreted by the Inner Segments of thephotoreceptor cells. The secreted material appears to form a planar liquid crystal based on the Nilsson electronmicrograph. This strip of material is folded prior to breaking and extrusion by the calyx. The nature of the materialprovides an insight into this folding and breaking. Low resolution electron micrographs of Outer Segment cross-sections frequently indicate a folding at one side of a disk but not at the other. This is probably due to theasymmetrical internal structure of the protein, opsin. It appears that it bends easily back upon itself to form a bilayerwith a hydrophilic external surface. It does not easily bend to form a bilayer with a hydrophobic external surface. Thus a disk is generally formed that exhibits a shape like the eye of a needle along one edge when sectioned. Theother sides may not exhibit this feature. More study is needed of the fate of any exposed hydrophobic surface.
As initially formed, each disk is approximately 2.0 microns in diameter and on the order of 165 Angstrom thick. Immediately after formation, they are grooved by the calyx before coating with chromophore and having thedendrites laid into the grooves. As developed in Section 4.6.2.3, the disks do not contain nor are they coated withchromophore when formed. No chromophoric material is found in the Inner Segments, although small amounts ofthe growth vitamin and chromogen, retinol, are found in the segment. The actual chromophores, the Rhodonines, aretransported from the RPE via the IPM to near the Inner Segment/Outer Segment interface. They pass into the cup ofthe Inner Segment and are coated onto the appropriate disks at that location. The coating may completely enclosethe protein substrate in order to form a structure that can transport excited electrons from their point of generation tothe dendrites.
4.3.5.2.1 Structure of the disk substrates based on the literature
It is routine in laboratory studies of the Outer Segment, to employ detergents to separate the disks. This theoryproposes that the chromophoric and substrate material are normally solubilized separately. There are several crucialresults of this process. First, the chromophoric material is separated from the substrate material. Second, thechromophoric material is frequently oxidized back to a non chromophoric state. The resulting liquid mixture is thenprocessed further to obtain a precipitate consisting primarily of the substrate. The process frequently does not isolateand preserve the chromogenic component of the mixture.
The in-situ structure of the protein substrate is not known because of experimental complexity. However, it appearsto be ordered. On the assumption that it is ordered and that it will assume the same order after its removal withdetergent and reconstitution, Schertler & Hargrave have provided some useful material117. Their figure 1 showsreconstituted substrate material from frogs. The images and substrate dimensions look very similar to images byothers obtained after less complete solubilization of Outer Segment disks. However, the images only show rod orstrip shaped crystals, although it is possible that they selected images showing only cross sectional views. Schertler& Hargrave proceeded to use optical diffraction techniques to determine the liquid crystalline structure of thesereconstituted substrates. They showed that there were subtle differences in the crystalline structure of thereconstituted material depending on the concentration of detergent in the solution. In one case, the crystals were ofform p2. In the second, they were of form p22121. They also noted that in some cases, they obtained planar sheets ofmaterial consisting of “two superimposed layers. In their figure 2, they showed the actual diffraction patterns. These show a pattern distinctive of a multilayered material that has been folded along a particular crystalline axis. Inthis case, the pattern is hexagonal with four of the six sides more distinct than the other two. Corless et. al. haveshown two cases of a similar diffraction pattern obtained from more obviously planar crystals. They also found thecrystalline form to be p22121. In their figure 1, no fold is obvious in the planar crystal and no fold is indicated by thediffraction pattern. In their figure 3, they show a square diffraction pattern indicative of a single fold, in agreementwith the electron-micrograph image.
By using larger liquid crystals of the reconstituted material (but still smaller than the diameter of an in-situ disk),Corless was able to determine additional information about the unit cell of the crystal. They found the two-dimensional unit cell to be orthorhombic with dimensions of 47 ± 1 by 151 ± 2 Angstrom. They also found that intheir planar sheets, the molecules are arranged in a herringbone pattern, undoubtedly due to the affinity between their
The Photoreceptor Cell 4- 63
118Unger, V. Hargrave, P. Baldwin, J. & Schertler, G. (1997) Arrangement of rhodopsin trans-membrane α-helices. Nature, vol. 389, pp. 203-206119Hargrave, P. et. al. (1982) The carboxyl-terminal one-third of bovine rhodopsin, Vision Res. vol. 22, pp 1429-1438120Dratz, E. & Hargrave, P. (1983) The structure of rhodopsin and the rod outer segment disk membrane. TIBS,April, pp 128-131121Miljanich, G. Brown, M. Marbey-Gaud, S. et al. (1985) Thermotropic Behavior of Retinal Rod Membranesand Dispersions of Extracted Phospholipids J Membrane Biol vol 85, pp 79-86122Miljanich, G. Sklar, L. White, D. & Dratz, E. (1979) Disaturated and dipolyunsaturated phospholipids in thebovine retinal rod outer segment disk membrane Biochimica et Biophysica Acta (BBA) - Biomembranes vol552(2), pp 294-306
asymmetrical terminals. There is general agreement that the dimensions of the individual molecules are 28 by 39 by~64 Angstrom118. The work of that group also shows that the material studied was clearly a protein and not a lipidor lipoprotein.
Corless, et. al. did not present any material concerning the formation of liquid crystalline sheets in the orthogonaldirection to the sheets formed on a carbon-coated grid suitable for electron microscopy. They did report a variety ofother crystalline structures based on the same unit cell that occurred during the precipitation procedure. There is astrong possibility that the actual liquid crystals used in the disks are folded from a planar material where all of thepolar molecules have their hydrophilic terminals on one surface associated with a temporary deposition substrate. This arrangement would result in a folded bilayer sheet thickness on the order of 128 Angstrom before coating witha chromophore. This arrangement would not necessarily conform to the unit cell described above. After coating onboth sides with a Rhodonine chromophore (of about 15 Angstrom thickness), the total disk would have a thicknessof from 150 to 165 Angstrom. This range is in excellent agreement with the above data at the histological level. This arrangement would also be analogous to a typical lipid membrane found in a cell wall. It may follow that thepolar protein-based disk substrate was formed on a temporary polar substrate consisting of the Inner Segment plasmamembrane.
None of the above crystallographers presented any information showing their reconstituted disks exhibited anyphotosensitivity.
Hargrave has presented several papers describing a reconstruction of the rhodopsin molecule. In 1982, both skeletaland space filled models were presented based on a partial sequencing of the rhodopsin molecule119. The 1982representations were described as hypothetical in the text but not in the captions to the figures. In 1983, he andDratz presented a paper containing a group of four caricatures120. For the first time, he assigned dimensions to theputative lipid membrane of the disks. However, the dimensions were based on gross calculations related to assumedmolecular and disk volumes. The thickness of the putative lipid based disk does not agree with the electronmicroscope images of Nilsson (See Section 4.3.5.3.1) or the estimates by other investigators. The estimated center-to-center spacing of protein molecules of 56 Å does not appear consistent with the caricature in their Fig. 2. The2001 paper of Hargrave provided a more complete space filled model of the molecule that appears to supercede the1982 results. It gives the dimensions of the rhodopsin molecule of frog as 28 Å x 39 Å x 64 Å in height. Whilefigure 1 of that paper shows the molecules of the protein imbedded in the structure of a disk membrane containing asignificant fraction of smaller molecules, it did not give the thickness used in the 1983 paper. An alternateinterpretation of the structure of the disk will be presented below. In this alternative, the protein molecules (presentat a concentration of 94% by some estimates) are placed side by side in a sheet and folded to form the disk. There isno requirement for any lipid material in this configuration. The thickness of this configuration agrees well with themeasured thickness of the disks.
The Dratz & Hargrave paper cites a paper in press by Miljanich et al. that did not appear with the authors cited. Itdid appear with a similar set of authors and provides considerable information but no schematic or physical modelsof the outer disks. The dimensions of the molecules found in the individual disks, and the reason for the originalcitation, do not appear. It does describe the liquid crystalline form of the materials forming these disks, along withtheir denaturing temperatures. In the published Miljanich et al121. paper, they appear to assert “opsin” is the excitedform of the light sensitive rhodopsin molecule.
In a 1979 paper, Miljanich, Sklar et al122. provide additional information on the composition of the phospholipids ofthe disks of the outer segments. “Thin-layer chromatography was used to separate the major phospholipidheadgroup classes of the rod outer segment disk membrane into subfractions which differ markedly in fatty acidcomposition.

64 Processes in Biological Vision
123Dratz, E. & Hargrave, P. (1983) The structure of rhodopsin and the rod outer segment disk membrane. TIBS,pp 128-131
The Hargrave, Dratz & Hargrave and Miljanich et al. papers were prepared by physical chemists; they do not use theconventional language of vision researchers. This makes it difficult to precisely interpret their data. They also usedwell homogenized samples taken from bovine eyes. It is sometimes difficult to determine whether they adequatelydetermined the molecular content of some of their material. “At least 18% of the rod outer segmentphosphatidylcholine must contain two saturated fatty acids. Furthermore, two unsaturated fatty acids are found in atleast 43% of the phosphatidylserine, 24% of the phosphatidylcholine, and 24% of the phosphatidylethanolamine.The unsaturated acids are predominantly polyunsaturated in all cases. A similar separation, but with less resolution,was achieved with silicic acid column chromatography.” These materials are found in the outer lemma of sensoryneurons and not normally in the individual disks of the outer segment. The Dratz & Hargrave paper calculates theabsorption cross-section of the rhodopsin molecule as about 22% of the effective surface area of the disks. However, they do not demonstrate that this absorption cross-section is related to the absorption cross-section of themuch smaller retinoid within each rhodopsin molecule. In either case, this low percentage would be surprising in abiological system that is usually optimally designed.
4.3.5.2.2 Conflict between crystallographers,microscopist and physical chemists
There appears to be significant conflict between the material of the crystallographers in the above section and theresults presented by Nilsson in Section 4.3.4.4. It is important to distill the situation addressed by the two groups. Nilsson presented a high magnification (transmission) electron-micrograph of the cross section of an intact frog disk. His resolution was limited to 20 Angstrom and he did not discuss the material shown as electron dense areas withinthe layers of the disks or compare that material with the material causing similar contrast areas external to the disks. He showed two rows of electron dense areas within each disk layer with the two rows of high electron densityaligned into columns. He provided considerable statistical data based on his experiments. The imagery does notsuggest an orthorhombic crystalline lattice within the individual layers.
Corless, et. al., on the other hand, present mathematically reconstructed images of the crystalline structure within areconstituted single (and folded) planar film of putative rhodopsin (possibly only opsin). The reconstituted film wascrystallized onto a non polar substrate by painting with a fluid mixture containing the solubilized protein. Theresults were critically dependent on the concentration of the detergent (Tween 80) in the fluid mixture. The resultantmonolayer of liquid crystalline material exhibited an orthorhombic unit cell consisting of molecules described asdimeric. The dimeric characteristic suggested that the underlying molecules were amphiphilic. The thickness of theindividual layers given by Nilsson agrees quite well with the molecular length of the material given by Corless, et.al.
Dratz & Hargrave have presented a quite different picture based on low-angle x-ray crystallography123. Theysuggest the individual layers of the disk are about one half as thick as the above authors while giving a slightly largerdisk spacing for the frog rod Outer Segment. Based on a single reference to Miljanich, they also provide a set ofcomputed values with regard to the physical spacing of the constituents of the individual layer. It is hard to followthe calculations provided and it appears they are not consistent with the caricature provided (which is labeledarbitrary but follows the conventional wisdom). The caricature shows the rhodopsin molecules widely spaced. However the numerics given are for a surface area of the rhodopsin molecule (assumed to be only opsin in this work)of 3400 sq. Angstrom (radius 68 Angstrom) and a most probable distance between neighboring rhodopsin moleculesof 56 Angstrom. These numbers suggest the layer is composed entirely of rhodopsin with no room for other lipids.
Section 5.5.3 of this work reviews the knowledge base relevant to liquid crystals. An important fact is that liquidcrystalline materials are polymorphic. The precise crystalline form of a liquid crystal is highly dependent on theenvironment in which it is precipitated. Both the temperature, the solvent and the substrate are critical parameters. Most biological materials are amphiphilic and very sensitive to the substrate upon which they crystallize. It appearsthat the results of Corless, et. al. concerning the unit cell would be different if the material had been precipitated on apolar substrate. Precipitation at an air-water interface would probably have resulted in a crystalline structure inagreement with Nilsson’s imagery. In this case, the chromophoric material would be found in the smectic type Aliquid crystalline formation. Such a crystal could be imbedded and sectioned to provide an electron micrographvery similar to that of Nilsson.
Future investigators may need a more refined model to use in experiment design. Nilsson was unable to resolve thechromophores proposed here. Corless, et. al. probably discarded the chromophores in their selective purification
The Photoreceptor Cell 4- 65
124Schertler, G. (1998) Structure of rhodopsin. Eye, vol. 12, pp. 504-510
process. Dratz & Hargrave appear to have only considered the substrate on the assumption, from the commonwisdom, that it contained the chromophore within the protein. It appears that the imagery of Nilsson presented theprotein material as black with white areas of high electron density usually associated with heavy atoms. TheCorless, et. al. imagery shows the protein molecules as white on a black background with no internal detailindicative of heavy atoms.
The large amount of imagery in Nilsson show an extremely well ordered substrate lattice. Although there areoccasional dislocations, there are no signs of any inclusions or “gates” passing through these lattices. Ungerdiscusses the potential locations of the carboxyl and amidic terminal of the proteins but does not demonstrate thenature of the high electron density regions of the lattice shown by Nilsson. He does state that these regions cannotbe interpreted in terms of trans-membrane helices. Schertler124 has recently provided a review. While this authordisagrees with a majority of the background material in this review, Schertler does describe a ribbon diagram for theprotein that might suggest that the high electron density regions are due to observing helices #4 and #7 head on. However, this interpretation would require that Nilsson’s imagery fortuitously recorded all of the lattices from thesame angle relative to the orientation of the protein molecules. In some recent papers, each protein molecule of thesingle disk layer has been assumed to contain a “gate” between certain of the helices. This interpretation wouldallow for the presence of gates in the absence of other lipids. However, the mechanism of gate operation remainsundefined and a gate mechanism is not required by this work.
In summary, the predominant element of the disk is the folded layer of the passive material opsin. Opsin is found tobe in the liquid crystalline state of matter and to be amphiphilic. The hydrophobic terminals of the opsin moleculesare found facing each other on the inside of the folded structure. The exact nature of the space between the twomolecular layers is not known but appears to be unimportant to the operation of vision. The hydrophilic terminalsare facing outward and form a surface compatible with the hydrophilic character of the chromophores. One of thechromophores of vision forms a film on the surface of each disk. All of the disks in a single Outer Segment arecoated with the same chromophore. The choice of specific chromophore may be determined at an initial “seeding”of the disk stack during incubation of the fetus. This seeding may be temperature sensitive and account for thenormal, and possibly abnormal, distribution of the specific chromophores within the retina. Alternately it may becontrolled by or supported by the material found within the inter-disk matrix, IDM. The complete disk stack isimmersed in a material that differs sufficiently from the IPM to cause a distinct boundary to be observable along theoutside perimeter of the disk stack. This boundary has frequently been defined as a plasma membrane in the generalvision literature. The assumption being that this boundary is part of the plasma membrane of the photoreceptor cell. However, there is no substantiation for this designation in the cytological literature. Beyond the fiftieth disk in thestack from the Inner Segment, there is no published record of a biological membrane surrounding the OuterSegment.
4.3.5.3 Other characteristics of the disks
There are many characteristics of the disks that do not relate to the physical arrangement of the substrate, opsin. These include the molecular, quantum mechanical and semiconductive properties associated with the chromophoresand their relationship to the microtubules (dendrites) of the photoreceptor cell.
Table 4.3.5-1 provides a summary of the dimensions associated with the disks. While this figure is compatible withthe Hogan and Nilsson figures, it provides considerable more detail that illuminates the overall operation of theOuter Segment.

66 Processes in Biological Vision
125Livrea, M. & Packer, L. (1993) Retinoids. NY: Marcel Dekker, pg 24
TABLE 4.3.5-1
NOMINAL DIMENSION OF HUMAN DISKS & DISK STACK
Overall dimensions of a disk stack
Length 50 microns, nominalDiameter 2 microns, nominalNumber of furrows in stack 9Furrow depth in disk stack 0.5 microns, from periphery, (~50% of the radius)
Overall Dimensions of disksDiameter 2.0 micronsDepth of furrows 0.5 micronsThickness
At fold 220 AngstromAt center 160 Angstrom
Disk to disk spacing 250 Angstrom
Disk velocity along stack 300 nm/hr. (7.2 microns/day)Nominal disk lifetime 7 days/ 1 weekNominal disk formation rate 10-12/hr/cell
Associated DendritesLength 50 microns max. Length is variable & unknownDiameter of dendroplasm 250 AngstromDiameter of reticulum 100 Angstrom Also called microfilaments
Dimensions of liquid crystal monolayersElement Thickness “a” vector “b” vector
Protein (Opsin) lattice 64 Angstrom 47 Angstrom 47 Angstrommolecule 64 Angstrom 28 Angstrom 39 Angstromfeature spacing
Chromophore (Rhodonine) latticemolecule 15 Angstrom ~5 Angstrom ~5 Angstromauxochrome spacing ~3-12 Ang.(variable)**
* The relationship between the “a” & “b” vectors of lattices and those of molecules are not known** based on peak absorption wavelength divided by ratio of speed of light to slow wave velocity: 250. The spacing isasymmetrical with respect to the length of the molecule.
4.3.5.3.1 Arrangement of the disks at the molecular level from the literature
Livrea & Packer made an observation in 1993 based on the conventional wisdom. “Studies of the details of thepositioning of retinoids within lipid bilayers and the specific interactions of retinoids with the various lipids that comprisebiological membranes are scarce125.” This is understandable in the light of this work. The retinoids comprising thechromophores of vision are not found in association with lipids. They are intimately associated with the protein doublelayer forming the disks.
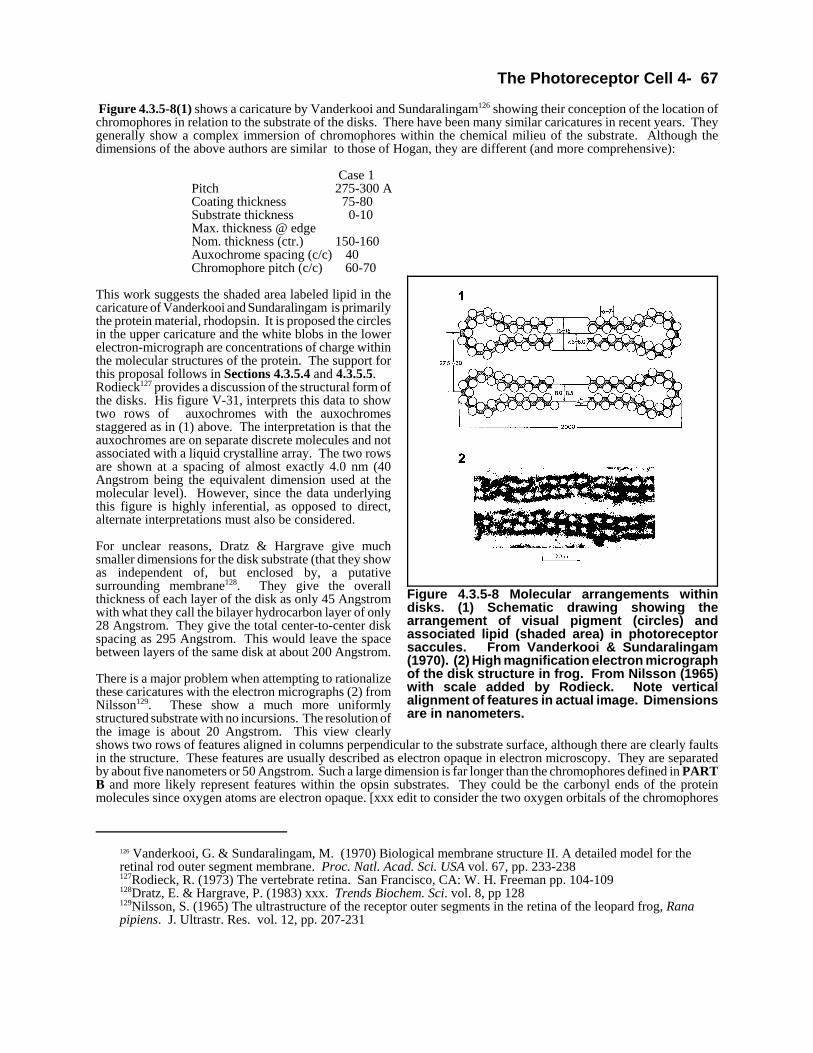
The Photoreceptor Cell 4- 67
126 Vanderkooi, G. & Sundaralingam, M. (1970) Biological membrane structure II. A detailed model for theretinal rod outer segment membrane. Proc. Natl. Acad. Sci. USA vol. 67, pp. 233-238127Rodieck, R. (1973) The vertebrate retina. San Francisco, CA: W. H. Freeman pp. 104-109128Dratz, E. & Hargrave, P. (1983) xxx. Trends Biochem. Sci. vol. 8, pp 128129Nilsson, S. (1965) The ultrastructure of the receptor outer segments in the retina of the leopard frog, Ranapipiens. J. Ultrastr. Res. vol. 12, pp. 207-231
Figure 4.3.5-8 Molecular arrangements withindisks. (1) Schematic drawing showing thearrangement of visual pigment (circles) andassociated lipid (shaded area) in photoreceptorsaccules. From Vanderkooi & Sundaralingam(1970). (2) High magnification electron micrographof the disk structure in frog. From Nilsson (1965)with scale added by Rodieck. Note verticalalignment of features in actual image. Dimensionsare in nanometers.
Figure 4.3.5-8(1) shows a caricature by Vanderkooi and Sundaralingam126 showing their conception of the location ofchromophores in relation to the substrate of the disks. There have been many similar caricatures in recent years. Theygenerally show a complex immersion of chromophores within the chemical milieu of the substrate. Although thedimensions of the above authors are similar to those of Hogan, they are different (and more comprehensive):
Case 1Pitch 275-300 ACoating thickness 75-80Substrate thickness 0-10Max. thickness @ edgeNom. thickness (ctr.) 150-160Auxochrome spacing (c/c) 40Chromophore pitch (c/c) 60-70
This work suggests the shaded area labeled lipid in thecaricature of Vanderkooi and Sundaralingam is primarilythe protein material, rhodopsin. It is proposed the circlesin the upper caricature and the white blobs in the lowerelectron-micrograph are concentrations of charge withinthe molecular structures of the protein. The support forthis proposal follows in Sections 4.3.5.4 and 4.3.5.5.Rodieck127 provides a discussion of the structural form ofthe disks. His figure V-31, interprets this data to showtwo rows of auxochromes with the auxochromesstaggered as in (1) above. The interpretation is that theauxochromes are on separate discrete molecules and notassociated with a liquid crystalline array. The two rowsare shown at a spacing of almost exactly 4.0 nm (40Angstrom being the equivalent dimension used at themolecular level). However, since the data underlyingthis figure is highly inferential, as opposed to direct,alternate interpretations must also be considered.
For unclear reasons, Dratz & Hargrave give muchsmaller dimensions for the disk substrate (that they showas independent of, but enclosed by, a putativesurrounding membrane128. They give the overallthickness of each layer of the disk as only 45 Angstromwith what they call the bilayer hydrocarbon layer of only28 Angstrom. They give the total center-to-center diskspacing as 295 Angstrom. This would leave the spacebetween layers of the same disk at about 200 Angstrom.
There is a major problem when attempting to rationalizethese caricatures with the electron micrographs (2) fromNilsson129. These show a much more uniformlystructured substrate with no incursions. The resolution ofthe image is about 20 Angstrom. This view clearlyshows two rows of features aligned in columns perpendicular to the substrate surface, although there are clearly faultsin the structure. These features are usually described as electron opaque in electron microscopy. They are separatedby about five nanometers or 50 Angstrom. Such a large dimension is far longer than the chromophores defined in PARTB and more likely represent features within the opsin substrates. They could be the carbonyl ends of the proteinmolecules since oxygen atoms are electron opaque. [xxx edit to consider the two oxygen orbitals of the chromophores
68 Processes in Biological Vision
130Blasie, J. Worthington, C. & Dewey, M. (1969) Molecular localization of frog retinal receptor photopigmentby electron microscopy and low-angle x-ray diffraction. J. Mol. Biol. vol 39, pp. 407-416131Blasie, J. & Worthington, C. (1969) Planar liquid-like arrangement of photopigment molecules in frog retinalreceptor disk membranes. J. Mol. Bio. vol. 39, pp. 417-439
without any proteins ]
Rodieck’s discussion highlights the fact that the spacing between the rows is a variable among different investigators.Values of four, five and seven nm have been given by different sources.
It is clear that there are two prominent areas of high electron density separated by about 40-50 angstroms and alignedperpendicular to the surface of the substrate. It is also clear that the intervening space between the substrates is occupiedby an electron opaque material. It is proposed that it is this area that contains the actual chromophores and chromogensof vision.
Vandrkooi & Sundaralingam give 40 Angstrom as the nominal spacing of the electron opaque concentrations whileNilsson gives 50 Angstroms for this same dimension. The measurements may be for different conformations of thesubstrate material or relative to different locations on poorly resolved features.
It should be noted that the orderly lattice structure recorded by Nilsson does not support many of the caricatures showinga highly convoluted series of helices of rhodopsin interdigitated among the molecules of a lipid comprising the surfaceof a disk. These caricatures generally trace back to a proposed model of a disk by Hargrave. Similar models frequentlyappear in relation to the putative gates in the putative plasma membrane surrounding the Outer Segments.
4.3.5.3.2 Molecular level characteristics based on radiography
Blasie, et. al130,131. have studied the structure of the disks in some detail using both electron-microscopy and low-anglex-ray diffraction. The title of their second article is informative. They found the photopigments to be arranged in aplanar, liquid-like arrangement. An array of molecules that is liquid-like is now known as a liquid crystal. Althoughthey frequently describe the pigment molecules as within the membrane, at other times they use the expression withinthe disk structure (which more easily accommodates the concept of a liquid-like array on the surface of the diskmembrane). It is this latter interpretation that is more consistent with the high resolution electron-micrographs of Nilsson(1965). Their findings that: the individual particles “have a core of uniform electron density 38-40 Angstrom in diameterwith a total diameter of 44 to 46 Angstrom, and occur in a planar or two-dimensional liquid-like arrangement withinthe wet frog retinal receptor disk membranes.” is completely consistent with this work if the word structures replacesthe word membranes. Their paper describes these particles as ~40 Angstrom in diameter with a unit cell side of ~70Angstrom. These numbers are completely consistent with the previous discussion. Since they were working at theresolution limit of their electron-microscope and the taking of Fourier Transforms of X-ray diffraction patterns does notgive precise dimensional data, it is not clear that the term ~40 Angstrom should be considered the dimension of aspherical particle. It could just as well be considered the mean diameter of a highly ellipsoidal particle. The Blasiearticles provide their original imagery. Their estimates of the molecular weight of these particles is entirely dependenton their assumption that the particles are either lipid or protein. The values were determined based on the bulk densitiesof these materials and the use of the 40 Angstrom number as if it was a non quantum-mechanical, hard, value. It isexpected that the molecular weight based on the gross density of a long chain resonant retinoid such as the Rhodoninesin a planar lattice with a cell side of ~70 Angstrom would be quite different. They conclude: “If our interpretation ofthe low-angle patterns are correct, the 40 to 50 Angstrom particle is not a spherical lipid micelle.”
4.3.5.3.3 Quantum level characteristics
The arrangement of the chromophores in a liquid crystalline film on the surface of the opsin substrate has a profoundimpact on the quantum mechanical properties of the chromophores. The energy levels of the individual molecules areshared and thereby broadened. This accounts for the broadened and anisotropic spectral absorption of the structurecompared to that of the chromophores in dilute solution. This subject will be discussed in detail in Chapter 5.
4.3.5.3.4 Solid state characteristics
The outer segment does not appear to have a known analog elsewhere in the animal body. There is an underlying simileto a hair follicle and there may be similes to the outer structure of the taste buds. Its proposed properties are all familiar
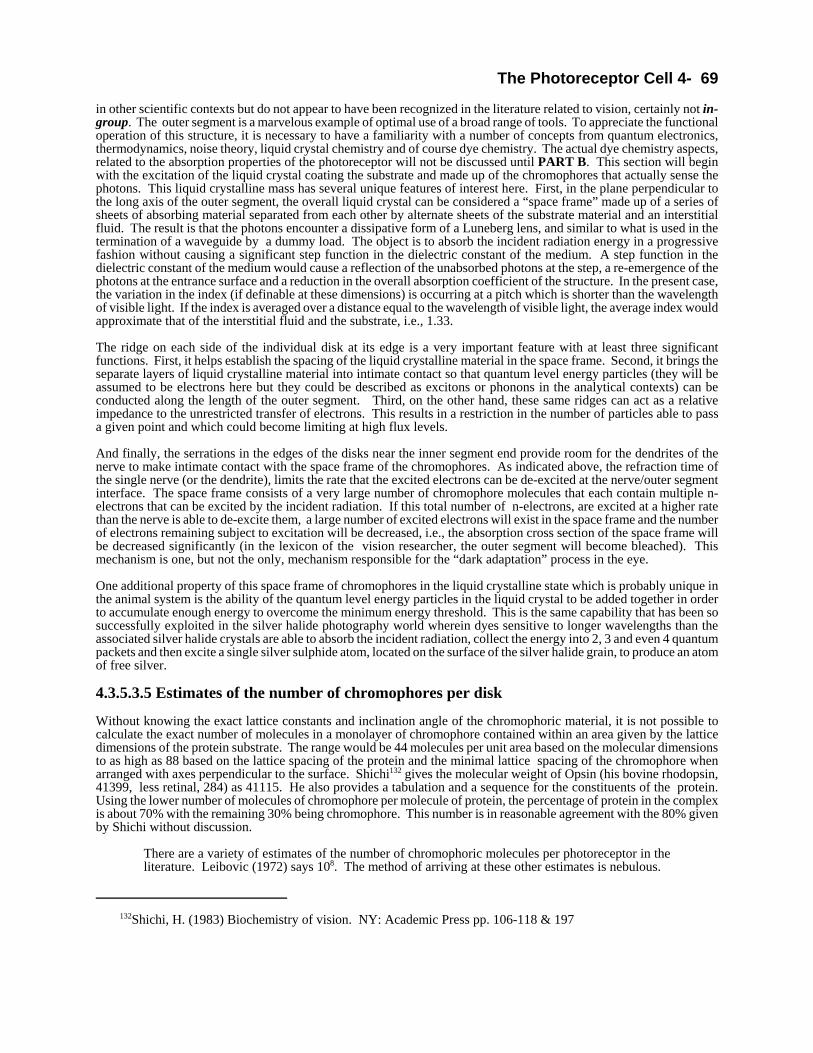
The Photoreceptor Cell 4- 69
132Shichi, H. (1983) Biochemistry of vision. NY: Academic Press pp. 106-118 & 197
in other scientific contexts but do not appear to have been recognized in the literature related to vision, certainly not in-group. The outer segment is a marvelous example of optimal use of a broad range of tools. To appreciate the functionaloperation of this structure, it is necessary to have a familiarity with a number of concepts from quantum electronics,thermodynamics, noise theory, liquid crystal chemistry and of course dye chemistry. The actual dye chemistry aspects,related to the absorption properties of the photoreceptor will not be discussed until PART B. This section will beginwith the excitation of the liquid crystal coating the substrate and made up of the chromophores that actually sense thephotons. This liquid crystalline mass has several unique features of interest here. First, in the plane perpendicular tothe long axis of the outer segment, the overall liquid crystal can be considered a “space frame” made up of a series ofsheets of absorbing material separated from each other by alternate sheets of the substrate material and an interstitialfluid. The result is that the photons encounter a dissipative form of a Luneberg lens, and similar to what is used in thetermination of a waveguide by a dummy load. The object is to absorb the incident radiation energy in a progressivefashion without causing a significant step function in the dielectric constant of the medium. A step function in thedielectric constant of the medium would cause a reflection of the unabsorbed photons at the step, a re-emergence of thephotons at the entrance surface and a reduction in the overall absorption coefficient of the structure. In the present case,the variation in the index (if definable at these dimensions) is occurring at a pitch which is shorter than the wavelengthof visible light. If the index is averaged over a distance equal to the wavelength of visible light, the average index wouldapproximate that of the interstitial fluid and the substrate, i.e., 1.33.
The ridge on each side of the individual disk at its edge is a very important feature with at least three significantfunctions. First, it helps establish the spacing of the liquid crystalline material in the space frame. Second, it brings theseparate layers of liquid crystalline material into intimate contact so that quantum level energy particles (they will beassumed to be electrons here but they could be described as excitons or phonons in the analytical contexts) can beconducted along the length of the outer segment. Third, on the other hand, these same ridges can act as a relativeimpedance to the unrestricted transfer of electrons. This results in a restriction in the number of particles able to passa given point and which could become limiting at high flux levels.
And finally, the serrations in the edges of the disks near the inner segment end provide room for the dendrites of thenerve to make intimate contact with the space frame of the chromophores. As indicated above, the refraction time ofthe single nerve (or the dendrite), limits the rate that the excited electrons can be de-excited at the nerve/outer segmentinterface. The space frame consists of a very large number of chromophore molecules that each contain multiple n-electrons that can be excited by the incident radiation. If this total number of n-electrons, are excited at a higher ratethan the nerve is able to de-excite them, a large number of excited electrons will exist in the space frame and the numberof electrons remaining subject to excitation will be decreased, i.e., the absorption cross section of the space frame willbe decreased significantly (in the lexicon of the vision researcher, the outer segment will become bleached). Thismechanism is one, but not the only, mechanism responsible for the “dark adaptation” process in the eye.
One additional property of this space frame of chromophores in the liquid crystalline state which is probably unique inthe animal system is the ability of the quantum level energy particles in the liquid crystal to be added together in orderto accumulate enough energy to overcome the minimum energy threshold. This is the same capability that has been sosuccessfully exploited in the silver halide photography world wherein dyes sensitive to longer wavelengths than theassociated silver halide crystals are able to absorb the incident radiation, collect the energy into 2, 3 and even 4 quantumpackets and then excite a single silver sulphide atom, located on the surface of the silver halide grain, to produce an atomof free silver.
4.3.5.3.5 Estimates of the number of chromophores per disk
Without knowing the exact lattice constants and inclination angle of the chromophoric material, it is not possible tocalculate the exact number of molecules in a monolayer of chromophore contained within an area given by the latticedimensions of the protein substrate. The range would be 44 molecules per unit area based on the molecular dimensionsto as high as 88 based on the lattice spacing of the protein and the minimal lattice spacing of the chromophore whenarranged with axes perpendicular to the surface. Shichi132 gives the molecular weight of Opsin (his bovine rhodopsin,41399, less retinal, 284) as 41115. He also provides a tabulation and a sequence for the constituents of the protein.Using the lower number of molecules of chromophore per molecule of protein, the percentage of protein in the complexis about 70% with the remaining 30% being chromophore. This number is in reasonable agreement with the 80% givenby Shichi without discussion.
There are a variety of estimates of the number of chromophoric molecules per photoreceptor in theliterature. Leibovic (1972) says 108. The method of arriving at these other estimates is nebulous.

70 Processes in Biological Vision
133Oyster, C. (1999) Op. Cit. footnote on pg. 564134Heller, J. (1968) Structure of Visual Pigments, Biochem. vol. 7, pp 2906-2920
Using bulk sizes, Oyster has given a number of 150,000 molecules of the chromophore covering both sides of each two-micron diameter disk133. He comes to the interesting conclusion that without regeneration of the chromophores, theywould all be bleached away in about 2.5 minutes in bright ambient sunlight. How the excited molecules are removedfrom the disk and recirculated to the RPE and back in less than a fraction of 2.5 minutes, as called for in his figure 13.29and featured in the conventional wisdom of the literature, is not addressed.
Based on the above analyses, and the orientation of the chromophore molecule axes as perpendicular to the surface ofthe disk, each of the sheets of absorbing material, taken as 2.0 microns in diameter contains approximately 10 to the 7thpower of chromophore molecules (considerably more than calculated by Oyster), each with at least 3 n-electrons subjectto excitation. The overall mass of chromophore available in a single Outer Segment of 50 microns length is thereforeon the order of 4 times 10 to the 10th power of chromophore molecules, each with multiple n-electrons available.
4.3.5.4 Sequencing and mapping of the structural protein Opsin
[XXX consolidate with 5.5.10.6 or reference. one section applies to the substrate and cell, the other to the chromophores]It is an early day in the sequencing and mapping of proteins like opsin. Rarely, if ever, do two investigators report thesame sequence for even part of the presumed same opsin molecule. Dratz & Hargrave provided the first completesequence of a putative rhodopsin in 1983. Rarely do they agree on the exact constituent structures and, to date, noinvestigator has found any retinoid as a ligand in their residues. As the rules related to polymorphism have become betterknown, some of these differences have become understandable.
4.3.5.4.1 Sequencing of Opsin
Section 5.5.2.1 reviews the search for the chemical connection between opsin and a retinene in the putative compound,rhodopsin. This section will review the sequencing of various proteins in the context of opsin being only a structuralprotein. Rhodonine is deposited on this protein as a liquid crystal. The two materials are only joined by hydrogen bonds.In this sense, the two materials form a composite and not a compound.
Without any retinoid being found in a residue of the putative rhodopsin, the materials investigated will be assumed tobe only opsin.
Heller described opsin as a structural protein consisting of 235 amino acid residues with a molecular weight of 26,400. He said that 118 of those residues had nonpolar side chains134. He performed an exquisite set of experiments, based onthe knowledge-base of the era. They were designed to overcome some of the compromises of earlier work. At that time,he was unable to determine the terminal amino groups of what he described as bovine visual pigment. However, hecould explore all of the protein fragments comprising opsin (consistent with a yield of 70-90%).
Heller was unable to purify native visual pigment as a complex based on gel filtration. However, good results wereobtained using liquid chromatography and other techniques. He stressed that native visual pigment and the denaturedapoprotein displayed different signatures using chromatography.
Heller made several points: “The term ‘native’ is somewhat ambiguous and ill defined. It is usedgenerally in the sense that, as far as can be determined experimentally, the protein under considerationhas the same conformation and the same properties it had in situ. However, if a rigorous proof isasked for the native state for proteins that are part of an assembled complex, it turns out in many casesthat this is more of an assumption than of a proven fact.”
The native material showed peaks at 500 and at 280 nm. Although he anticipated a peak at 350 nm based on earlier Walddata, it was not found. This work suggests the so-called β-peak at 350 nm was due to the presence of a pure retinoid suchas retinol in the earlier work. Heller was unable to determine either the amino or carboxyl terminal residues in the 1968time period. However, he did establish the general composition of the protein. His data reported the presence of 0-2%phospholipids and evidence of carbohydrates in the form of sugar. He subsequently described the material as aglycoprotein. He did not observe any residue containing a retinoid. However, he did present a proposal on page 2917that perpetuated the Schiff-base proposal of earlier workers. He proposed the linkage was a protonated Schiff-base (he
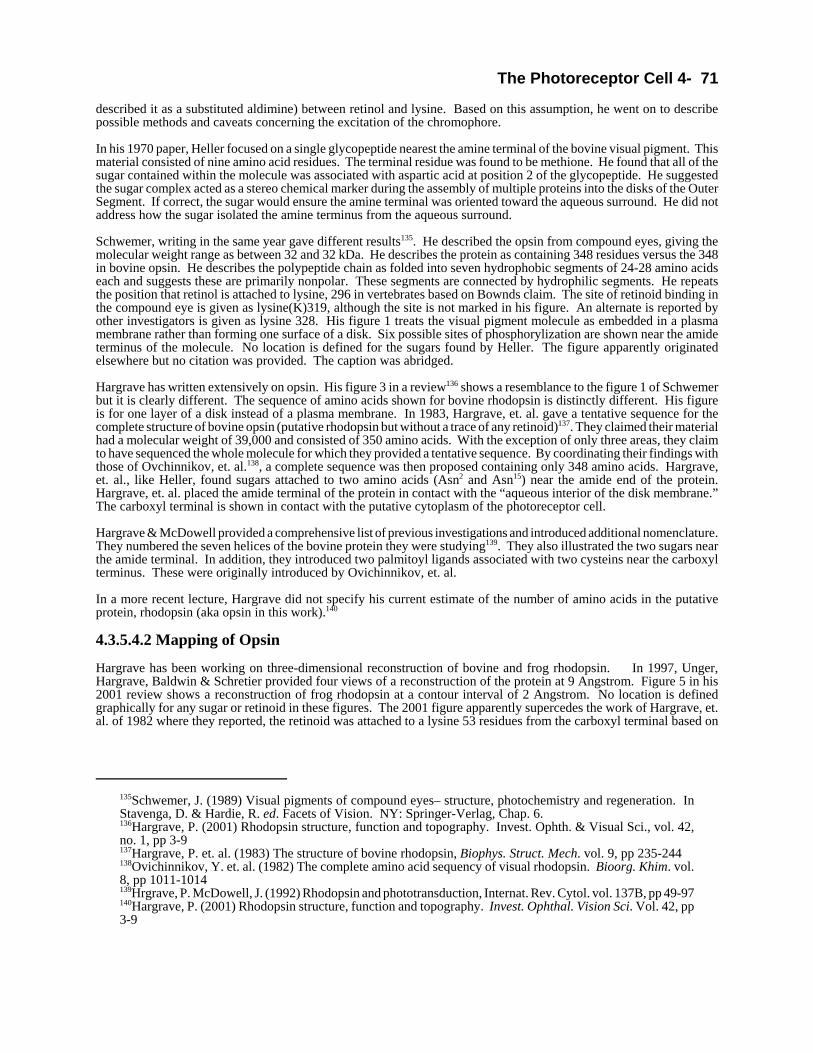
The Photoreceptor Cell 4- 71
135Schwemer, J. (1989) Visual pigments of compound eyes– structure, photochemistry and regeneration. InStavenga, D. & Hardie, R. ed. Facets of Vision. NY: Springer-Verlag, Chap. 6.136Hargrave, P. (2001) Rhodopsin structure, function and topography. Invest. Ophth. & Visual Sci., vol. 42,no. 1, pp 3-9137Hargrave, P. et. al. (1983) The structure of bovine rhodopsin, Biophys. Struct. Mech. vol. 9, pp 235-244138Ovichinnikov, Y. et. al. (1982) The complete amino acid sequency of visual rhodopsin. Bioorg. Khim. vol.8, pp 1011-1014 139Hrgrave, P. McDowell, J. (1992) Rhodopsin and phototransduction, Internat. Rev. Cytol. vol. 137B, pp 49-97140Hargrave, P. (2001) Rhodopsin structure, function and topography. Invest. Ophthal. Vision Sci. Vol. 42, pp3-9
described it as a substituted aldimine) between retinol and lysine. Based on this assumption, he went on to describepossible methods and caveats concerning the excitation of the chromophore.
In his 1970 paper, Heller focused on a single glycopeptide nearest the amine terminal of the bovine visual pigment. Thismaterial consisted of nine amino acid residues. The terminal residue was found to be methione. He found that all of thesugar contained within the molecule was associated with aspartic acid at position 2 of the glycopeptide. He suggestedthe sugar complex acted as a stereo chemical marker during the assembly of multiple proteins into the disks of the OuterSegment. If correct, the sugar would ensure the amine terminal was oriented toward the aqueous surround. He did notaddress how the sugar isolated the amine terminus from the aqueous surround.
Schwemer, writing in the same year gave different results135. He described the opsin from compound eyes, giving themolecular weight range as between 32 and 32 kDa. He describes the protein as containing 348 residues versus the 348in bovine opsin. He describes the polypeptide chain as folded into seven hydrophobic segments of 24-28 amino acidseach and suggests these are primarily nonpolar. These segments are connected by hydrophilic segments. He repeatsthe position that retinol is attached to lysine, 296 in vertebrates based on Bownds claim. The site of retinoid binding inthe compound eye is given as lysine(K)319, although the site is not marked in his figure. An alternate is reported byother investigators is given as lysine 328. His figure 1 treats the visual pigment molecule as embedded in a plasmamembrane rather than forming one surface of a disk. Six possible sites of phosphorylization are shown near the amideterminus of the molecule. No location is defined for the sugars found by Heller. The figure apparently originatedelsewhere but no citation was provided. The caption was abridged.
Hargrave has written extensively on opsin. His figure 3 in a review136 shows a resemblance to the figure 1 of Schwemerbut it is clearly different. The sequence of amino acids shown for bovine rhodopsin is distinctly different. His figureis for one layer of a disk instead of a plasma membrane. In 1983, Hargrave, et. al. gave a tentative sequence for thecomplete structure of bovine opsin (putative rhodopsin but without a trace of any retinoid)137. They claimed their materialhad a molecular weight of 39,000 and consisted of 350 amino acids. With the exception of only three areas, they claimto have sequenced the whole molecule for which they provided a tentative sequence. By coordinating their findings withthose of Ovchinnikov, et. al.138, a complete sequence was then proposed containing only 348 amino acids. Hargrave,et. al., like Heller, found sugars attached to two amino acids (Asn2 and Asn15) near the amide end of the protein.Hargrave, et. al. placed the amide terminal of the protein in contact with the “aqueous interior of the disk membrane.”The carboxyl terminal is shown in contact with the putative cytoplasm of the photoreceptor cell.
Hargrave & McDowell provided a comprehensive list of previous investigations and introduced additional nomenclature.They numbered the seven helices of the bovine protein they were studying139. They also illustrated the two sugars nearthe amide terminal. In addition, they introduced two palmitoyl ligands associated with two cysteins near the carboxylterminus. These were originally introduced by Ovichinnikov, et. al.
In a more recent lecture, Hargrave did not specify his current estimate of the number of amino acids in the putativeprotein, rhodopsin (aka opsin in this work).140
4.3.5.4.2 Mapping of Opsin
Hargrave has been working on three-dimensional reconstruction of bovine and frog rhodopsin. In 1997, Unger,Hargrave, Baldwin & Schretier provided four views of a reconstruction of the protein at 9 Angstrom. Figure 5 in his2001 review shows a reconstruction of frog rhodopsin at a contour interval of 2 Angstrom. No location is definedgraphically for any sugar or retinoid in these figures. The 2001 figure apparently supercedes the work of Hargrave, et.al. of 1982 where they reported, the retinoid was attached to a lysine 53 residues from the carboxyl terminal based on

72 Processes in Biological Vision
141Hargrave, P. et. al. (1982) The carboxyl-terminal one-third of bovine rhodopsin: its structure and function.Vision Res. vol. 22, pp 1429-1438.
Figure 4.3.5-9 A reconstruction of the surface of adisk based on replicating the mid-section energydensity profiles of Unger, et. al. The numbersidentify the seven helices of the protein. The circlerepresents a 56 Angstrom diameter.
a partial sequencing of the protein141. At that time, they suggested this was the same site proposed by Bownds. The frogrhodopsin reconstruction in 2001 followed it’s extraction with a weak detergent, crystallization, electron micrographyand then optical diffraction of the electron micrographs. The maps show the molecules filling a space frame of nominally28 x 39 Angstrom with a height of 64 Angstrom. Using the earlier calculation of the average protein molecule spacingby Hargrave, 56 Angstrom, it is seen that the molecules are very close to each other (depending on the exact array factorand measurement criteria). Using the square root of the sum of the squares, the above molecule has a diameter of 48Angstrom.
Based on the above numbers, and assuming the protein is free of any retinoid, the surface of a disk can be described bya surface as shown in Figure 4.3.5-9 that is 64 Angstrom thick. The view is created by replicating the energy-densityprofile presented by Unger, et. al. assuming a simple rectangular molecular array. The circle is 56 Angstrom in diameter.Note how little space is left for any other molecular species. If the average spacing of 47 Angstrom, given by Corless,et. al. (see next section), were used the circle would be smaller and the opsin molecules would need to be brought evencloser together. It should be noted that no space is provided for any phosphorylization of the molecule. Neither is anyspace provided for a ligand of sugar attached to the molecule. This representation is quite different from the commonlyreproduced caricature of the surface as a sparse array of protein embedded in a continuum of lipid material (Example,fig. 2 of Dratz & Hargrave, TIBS, April 1983).
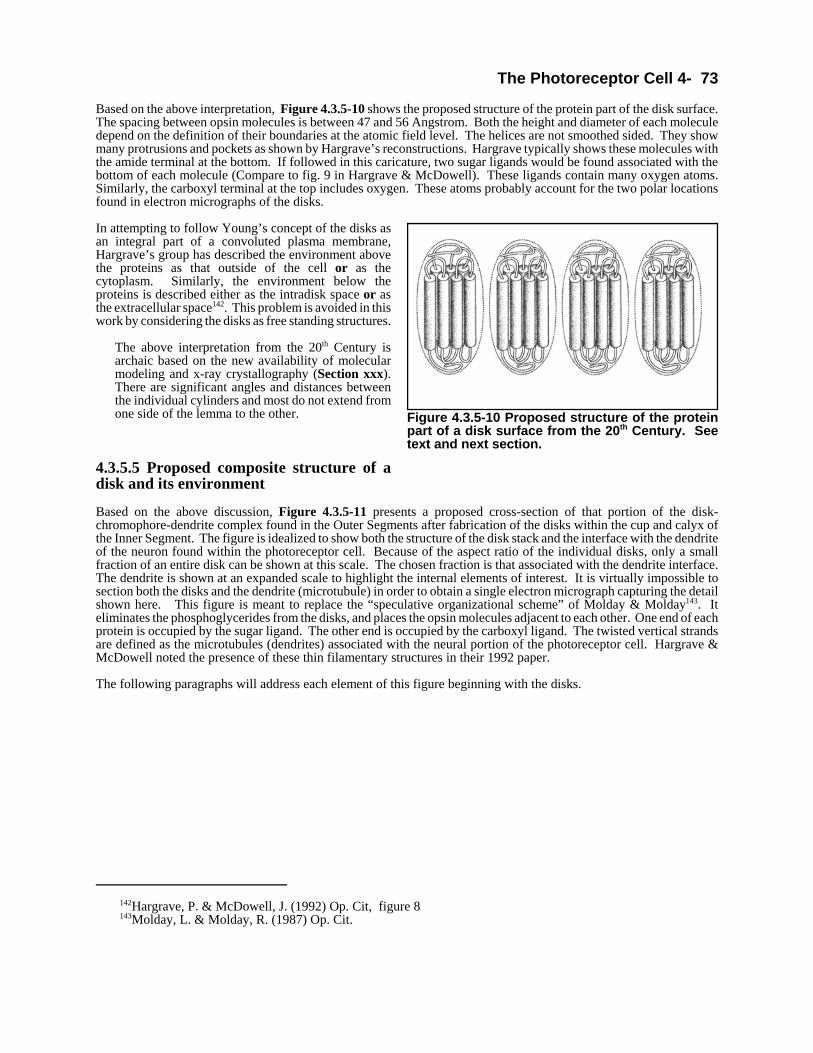
The Photoreceptor Cell 4- 73
142Hargrave, P. & McDowell, J. (1992) Op. Cit, figure 8143Molday, L. & Molday, R. (1987) Op. Cit.
Figure 4.3.5-10 Proposed structure of the proteinpart of a disk surface from the 20th Century. Seetext and next section.
Based on the above interpretation, Figure 4.3.5-10 shows the proposed structure of the protein part of the disk surface.The spacing between opsin molecules is between 47 and 56 Angstrom. Both the height and diameter of each moleculedepend on the definition of their boundaries at the atomic field level. The helices are not smoothed sided. They showmany protrusions and pockets as shown by Hargrave’s reconstructions. Hargrave typically shows these molecules withthe amide terminal at the bottom. If followed in this caricature, two sugar ligands would be found associated with thebottom of each molecule (Compare to fig. 9 in Hargrave & McDowell). These ligands contain many oxygen atoms.Similarly, the carboxyl terminal at the top includes oxygen. These atoms probably account for the two polar locationsfound in electron micrographs of the disks.
In attempting to follow Young’s concept of the disks asan integral part of a convoluted plasma membrane,Hargrave’s group has described the environment abovethe proteins as that outside of the cell or as thecytoplasm. Similarly, the environment below theproteins is described either as the intradisk space or asthe extracellular space142. This problem is avoided in thiswork by considering the disks as free standing structures.
The above interpretation from the 20th Century isarchaic based on the new availability of molecularmodeling and x-ray crystallography (Section xxx).There are significant angles and distances betweenthe individual cylinders and most do not extend fromone side of the lemma to the other.
4.3.5.5 Proposed composite structure of adisk and its environment
Based on the above discussion, Figure 4.3.5-11 presents a proposed cross-section of that portion of the disk-chromophore-dendrite complex found in the Outer Segments after fabrication of the disks within the cup and calyx ofthe Inner Segment. The figure is idealized to show both the structure of the disk stack and the interface with the dendriteof the neuron found within the photoreceptor cell. Because of the aspect ratio of the individual disks, only a smallfraction of an entire disk can be shown at this scale. The chosen fraction is that associated with the dendrite interface.The dendrite is shown at an expanded scale to highlight the internal elements of interest. It is virtually impossible tosection both the disks and the dendrite (microtubule) in order to obtain a single electron micrograph capturing the detailshown here. This figure is meant to replace the “speculative organizational scheme” of Molday & Molday143. Iteliminates the phosphoglycerides from the disks, and places the opsin molecules adjacent to each other. One end of eachprotein is occupied by the sugar ligand. The other end is occupied by the carboxyl ligand. The twisted vertical strandsare defined as the microtubules (dendrites) associated with the neural portion of the photoreceptor cell. Hargrave &McDowell noted the presence of these thin filamentary structures in their 1992 paper.
The following paragraphs will address each element of this figure beginning with the disks.
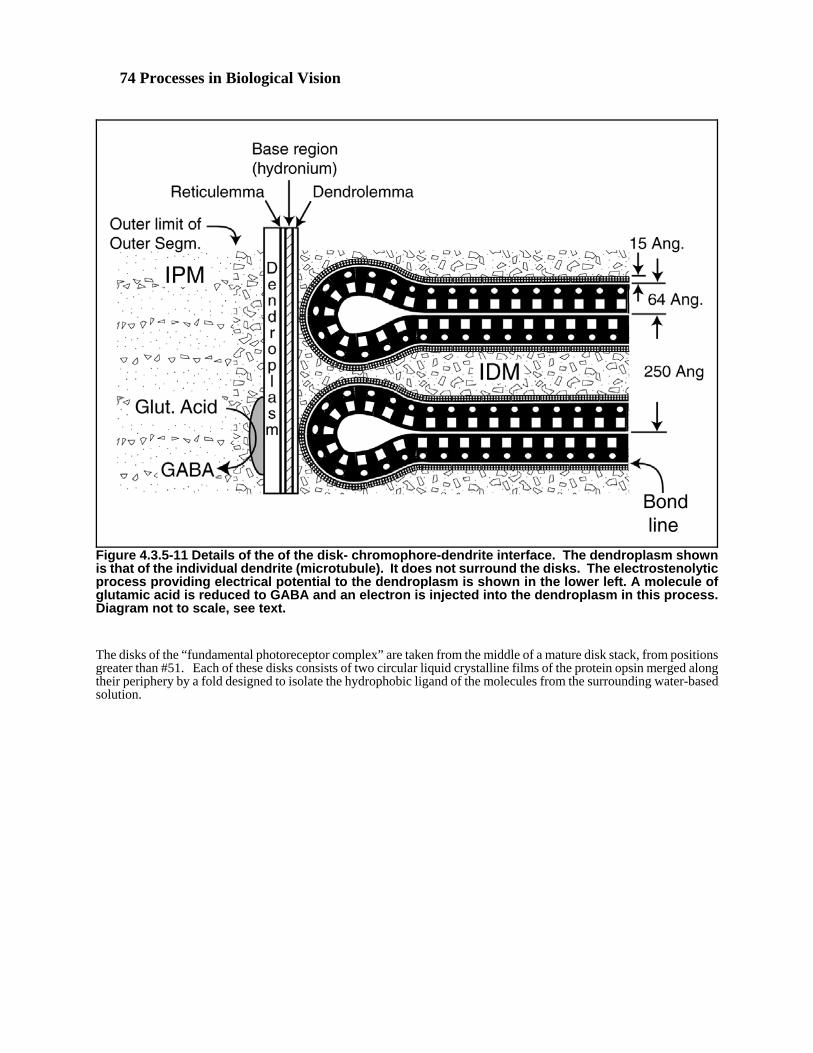
74 Processes in Biological Vision
Figure 4.3.5-11 Details of the of the disk- chromophore-dendrite interface. The dendroplasm shownis that of the individual dendrite (microtubule). It does not surround the disks. The electrostenolyticprocess providing electrical potential to the dendroplasm is shown in the lower left. A molecule ofglutamic acid is reduced to GABA and an electron is injected into the dendroplasm in this process.Diagram not to scale, see text.
The disks of the “fundamental photoreceptor complex” are taken from the middle of a mature disk stack, from positionsgreater than #51. Each of these disks consists of two circular liquid crystalline films of the protein opsin merged alongtheir periphery by a fold designed to isolate the hydrophobic ligand of the molecules from the surrounding water-basedsolution.

The Photoreceptor Cell 4- 75
Cross sections of disks shortly after formation and/or before shaping by the calyx frequently showedges of the two films of opsin that are not connected by a fold. These appear to be the characteristicsof an immature disk. It was frequently claimed in the literature during the 1960-70's that these freeedges are contiguous with the exterior plasma membrane of the Outer Segment. However, no electronmicrographs have been found of sufficient resolution to demonstrate there was in fact a plasmamembrane surrounding the Outer Segment. It is more likely that the free edges temporarily terminatenear the transition between the IPM and IDM to be discussed below.
It is also likely that the two films form a fold along the edges of the fissures created in the disks bythe calyx.
The opsin film is shown in the figure as a regular liquid crystalline monolayer with a hydrophilic ligand, shown by thelarge white circles, and an associated hydrophobic ligand, shown by the large white squares. It may be that sugar ligandsare located quite close to the hydrophobic terminal. The shape of these molecules are distorted in the area of the fold.It would be expected that the liquid crystal would also be distorted in this area. The lattice spacing of the opsinmonolayer is probably similar to that given by Corless, et. al. for a different crystalline form of opsin, 47 Angstrom.Each opsin molecule has a mean length transverse to the surface of the film of about 64 Angstrom. In the plane of thefilm, the dimensions of the molecule are believed to be 28 by 39 Angstrom. The assumed crystalline form of themonolayer is type A smectic as expected from a monolayer formed by sliding along a smooth hydrophilic surface.Alternately, it could be formed by sliding along a hydrophobic surface with a hydrophilic solution on the other side ofthe film. It is not the form found by Corless, et. al. for deposition on a non polar substrate. The bilayer substrate isformed by folding the monolayer leaving two hydrophilic surfaces exposed. The upper and lower exposed hydrophobicedges turn inward and the outer hydrophilic surfaces join. This action results in a disk-shaped micelle with a raised edgealong the periphery and an exterior that is totally hydrophilic. The resulting bilayer can be considered as of the smectic-cholesteric type with an angle between the two crystalline planes of either 0 or +/-120 degrees. In this figure, as in thatof Nilsson, the white areas are proposed to be areas of high electron density. The circular area would logically beassociated with the carboxylic group and the square would be associated with the amidic group of the native protein.The apparent width of the space between the two hydrophobic surfaces is less than a few Angstroms. Nilsson gives thetransverse length of each molecule as 63 angstroms, the thickness of the overall bilayer as 123 Angstrom. And thedistance between the uncoated hydrophilic surfaces of adjacent disks (neglecting the folds) as 114 Angstrom. The 123and 114 numbers are slightly smaller than the analogous numbers given by Hogan (see Section 4.3.5).
Nilsson indicates that a precision of two places after the decimal (frequently four or five decimalplaces in total) was carried in his calculations. A statistical error analysis would show that the resultsdiscussed in this Section are good to a maximum accuracy of two digits. The number ofmeasurements is small and, in some cases, data from different species were averaged. In this theory,the specimens described as cones by Nilsson are considered immature or malformed photodetectorsthat should be discarded. Note that a cone shaped outer Segment cannot be sustained by the disk stackgrowth process for more than 7-20 days depending on species.
The folded substrate formed by the protein is coated on the outside by a liquid crystal monolayer film of one of the fourpossible chromophores, Rhodonine(n). This is the active photodetection layer of vision. This layer can be as thick as15 Angstrom if of the type A smectic form (as shown) or as thin as 10 Angstrom if of the type C smectic form. It isbelieved that the material is type C. If the angle associated with type C is 45 degrees, the diagram would still show thehigh electron density areas aligned perpendicular to the substrate surface. In both cases, the nominal diameter of thechromophore molecules is five Angstrom. This diameter is well below the resolution of Nilsson’s imagery and absentfrom the reconstituted material of Corless, et. al.). The electron micrographs of Nilsson (1964)and Robertson (seeNilsson, 1964) may have shown the faint pattern on the surface of the disks due to this liquid crystalline coating. Thereorderly arrangement may also account for the extensive Moire Patterns usually seen in similar but lower resolutionmicrographs of the surface of a disk.
It is the liquid crystalline material of the chromophores that is in quantum contact with the dendritic structure of thephotoreceptor cell. At higher resolution, it is predicted that this coating will be resolved into a rectilinear array similarto the high electron energy locations in the protein crystal of the disk substrates. However, the two high electron energylocations in each molecule of the liquid crystalline coating will correspond to one of the heavy atoms of oxygen formingthe resonant conjugated structure that is sensitive to light. These two atoms will be separated by a distance that will varywith the chromophore. The distances between the auxochromes of the four chromophores of vision will be in the ratioof 4:5:7:9 depending on the chromophores present, UV:S:M:L. The chromophore molecules are shown with their longaxis perpendicular to the surface of the disks. In the actual situation, they are probably formed at a more acute angle tothe surface as is typically found in the chromophores of photography (10 to 20 degrees from perpendicular).
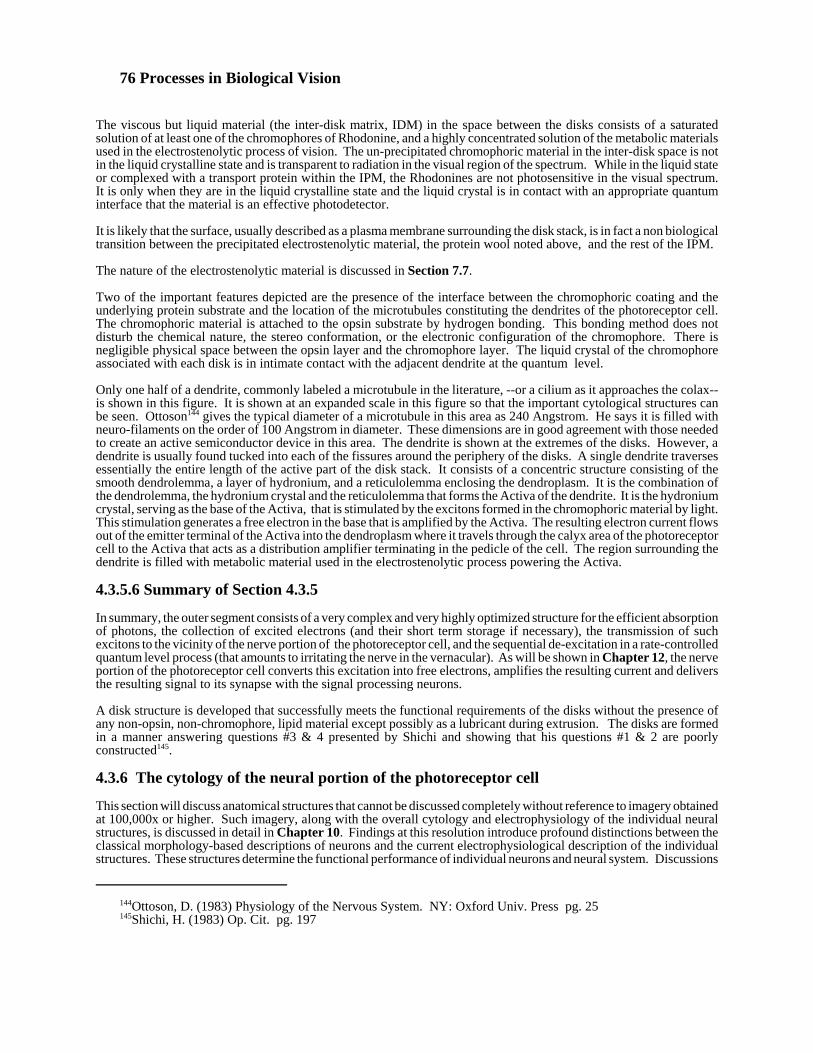
76 Processes in Biological Vision
144Ottoson, D. (1983) Physiology of the Nervous System. NY: Oxford Univ. Press pg. 25145Shichi, H. (1983) Op. Cit. pg. 197
The viscous but liquid material (the inter-disk matrix, IDM) in the space between the disks consists of a saturatedsolution of at least one of the chromophores of Rhodonine, and a highly concentrated solution of the metabolic materialsused in the electrostenolytic process of vision. The un-precipitated chromophoric material in the inter-disk space is notin the liquid crystalline state and is transparent to radiation in the visual region of the spectrum. While in the liquid stateor complexed with a transport protein within the IPM, the Rhodonines are not photosensitive in the visual spectrum.It is only when they are in the liquid crystalline state and the liquid crystal is in contact with an appropriate quantuminterface that the material is an effective photodetector.
It is likely that the surface, usually described as a plasma membrane surrounding the disk stack, is in fact a non biologicaltransition between the precipitated electrostenolytic material, the protein wool noted above, and the rest of the IPM.
The nature of the electrostenolytic material is discussed in Section 7.7.
Two of the important features depicted are the presence of the interface between the chromophoric coating and theunderlying protein substrate and the location of the microtubules constituting the dendrites of the photoreceptor cell.The chromophoric material is attached to the opsin substrate by hydrogen bonding. This bonding method does notdisturb the chemical nature, the stereo conformation, or the electronic configuration of the chromophore. There isnegligible physical space between the opsin layer and the chromophore layer. The liquid crystal of the chromophoreassociated with each disk is in intimate contact with the adjacent dendrite at the quantum level.
Only one half of a dendrite, commonly labeled a microtubule in the literature, --or a cilium as it approaches the colax--is shown in this figure. It is shown at an expanded scale in this figure so that the important cytological structures canbe seen. Ottoson144 gives the typical diameter of a microtubule in this area as 240 Angstrom. He says it is filled withneuro-filaments on the order of 100 Angstrom in diameter. These dimensions are in good agreement with those neededto create an active semiconductor device in this area. The dendrite is shown at the extremes of the disks. However, adendrite is usually found tucked into each of the fissures around the periphery of the disks. A single dendrite traversesessentially the entire length of the active part of the disk stack. It consists of a concentric structure consisting of thesmooth dendrolemma, a layer of hydronium, and a reticulolemma enclosing the dendroplasm. It is the combination ofthe dendrolemma, the hydronium crystal and the reticulolemma that forms the Activa of the dendrite. It is the hydroniumcrystal, serving as the base of the Activa, that is stimulated by the excitons formed in the chromophoric material by light.This stimulation generates a free electron in the base that is amplified by the Activa. The resulting electron current flowsout of the emitter terminal of the Activa into the dendroplasm where it travels through the calyx area of the photoreceptorcell to the Activa that acts as a distribution amplifier terminating in the pedicle of the cell. The region surrounding thedendrite is filled with metabolic material used in the electrostenolytic process powering the Activa.
4.3.5.6 Summary of Section 4.3.5
In summary, the outer segment consists of a very complex and very highly optimized structure for the efficient absorptionof photons, the collection of excited electrons (and their short term storage if necessary), the transmission of suchexcitons to the vicinity of the nerve portion of the photoreceptor cell, and the sequential de-excitation in a rate-controlledquantum level process (that amounts to irritating the nerve in the vernacular). As will be shown in Chapter 12, the nerveportion of the photoreceptor cell converts this excitation into free electrons, amplifies the resulting current and deliversthe resulting signal to its synapse with the signal processing neurons.
A disk structure is developed that successfully meets the functional requirements of the disks without the presence ofany non-opsin, non-chromophore, lipid material except possibly as a lubricant during extrusion. The disks are formedin a manner answering questions #3 & 4 presented by Shichi and showing that his questions #1 & 2 are poorlyconstructed145.
4.3.6 The cytology of the neural portion of the photoreceptor cell
This section will discuss anatomical structures that cannot be discussed completely without reference to imagery obtainedat 100,000x or higher. Such imagery, along with the overall cytology and electrophysiology of the individual neuralstructures, is discussed in detail in Chapter 10. Findings at this resolution introduce profound distinctions between theclassical morphology-based descriptions of neurons and the current electrophysiological description of the individualstructures. These structures determine the functional performance of individual neurons and neural system. Discussions
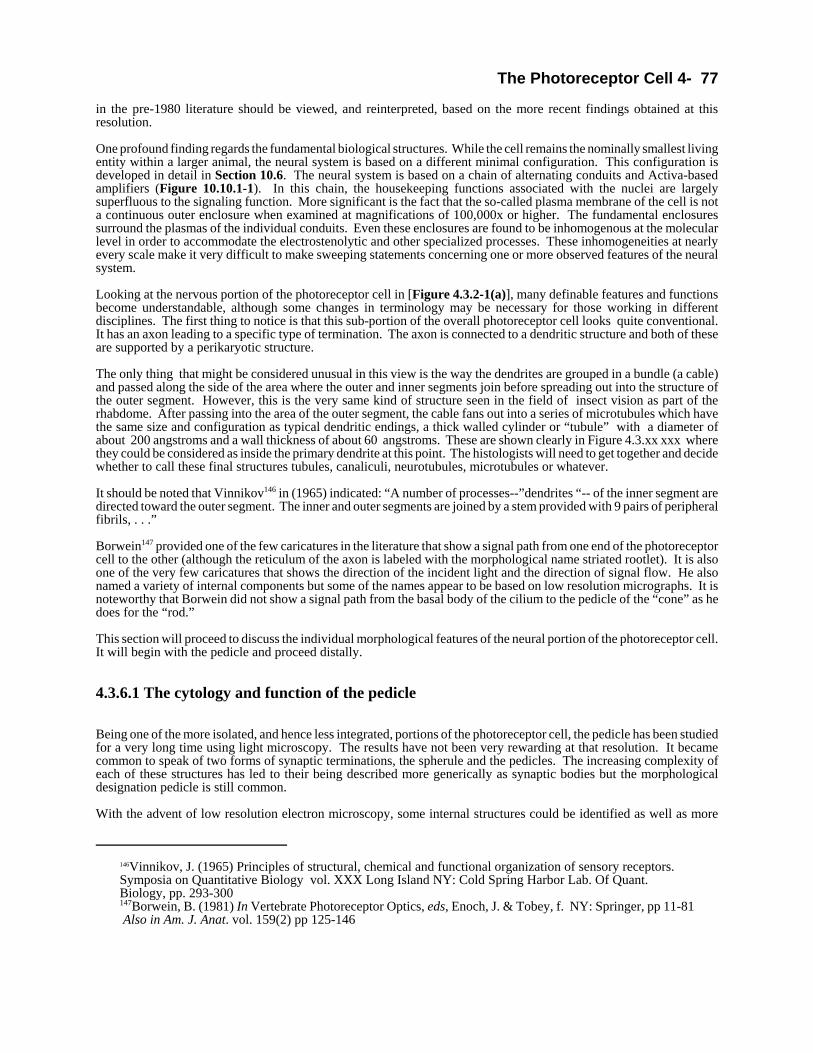
The Photoreceptor Cell 4- 77
146Vinnikov, J. (1965) Principles of structural, chemical and functional organization of sensory receptors.Symposia on Quantitative Biology vol. XXX Long Island NY: Cold Spring Harbor Lab. Of Quant.Biology, pp. 293-300147Borwein, B. (1981) In Vertebrate Photoreceptor Optics, eds, Enoch, J. & Tobey, f. NY: Springer, pp 11-81 Also in Am. J. Anat. vol. 159(2) pp 125-146
in the pre-1980 literature should be viewed, and reinterpreted, based on the more recent findings obtained at thisresolution.
One profound finding regards the fundamental biological structures. While the cell remains the nominally smallest livingentity within a larger animal, the neural system is based on a different minimal configuration. This configuration isdeveloped in detail in Section 10.6. The neural system is based on a chain of alternating conduits and Activa-basedamplifiers (Figure 10.10.1-1). In this chain, the housekeeping functions associated with the nuclei are largelysuperfluous to the signaling function. More significant is the fact that the so-called plasma membrane of the cell is nota continuous outer enclosure when examined at magnifications of 100,000x or higher. The fundamental enclosuressurround the plasmas of the individual conduits. Even these enclosures are found to be inhomogenous at the molecularlevel in order to accommodate the electrostenolytic and other specialized processes. These inhomogeneities at nearlyevery scale make it very difficult to make sweeping statements concerning one or more observed features of the neuralsystem.
Looking at the nervous portion of the photoreceptor cell in [Figure 4.3.2-1(a)], many definable features and functionsbecome understandable, although some changes in terminology may be necessary for those working in differentdisciplines. The first thing to notice is that this sub-portion of the overall photoreceptor cell looks quite conventional.It has an axon leading to a specific type of termination. The axon is connected to a dendritic structure and both of theseare supported by a perikaryotic structure.
The only thing that might be considered unusual in this view is the way the dendrites are grouped in a bundle (a cable)and passed along the side of the area where the outer and inner segments join before spreading out into the structure ofthe outer segment. However, this is the very same kind of structure seen in the field of insect vision as part of therhabdome. After passing into the area of the outer segment, the cable fans out into a series of microtubules which havethe same size and configuration as typical dendritic endings, a thick walled cylinder or “tubule” with a diameter ofabout 200 angstroms and a wall thickness of about 60 angstroms. These are shown clearly in Figure 4.3.xx xxx wherethey could be considered as inside the primary dendrite at this point. The histologists will need to get together and decidewhether to call these final structures tubules, canaliculi, neurotubules, microtubules or whatever.
It should be noted that Vinnikov146 in (1965) indicated: “A number of processes--”dendrites “-- of the inner segment aredirected toward the outer segment. The inner and outer segments are joined by a stem provided with 9 pairs of peripheralfibrils, . . .”
Borwein147 provided one of the few caricatures in the literature that show a signal path from one end of the photoreceptorcell to the other (although the reticulum of the axon is labeled with the morphological name striated rootlet). It is alsoone of the very few caricatures that shows the direction of the incident light and the direction of signal flow. He alsonamed a variety of internal components but some of the names appear to be based on low resolution micrographs. It isnoteworthy that Borwein did not show a signal path from the basal body of the cilium to the pedicle of the “cone” as hedoes for the “rod.”
This section will proceed to discuss the individual morphological features of the neural portion of the photoreceptor cell.It will begin with the pedicle and proceed distally.
4.3.6.1 The cytology and function of the pedicle
Being one of the more isolated, and hence less integrated, portions of the photoreceptor cell, the pedicle has been studiedfor a very long time using light microscopy. The results have not been very rewarding at that resolution. It becamecommon to speak of two forms of synaptic terminations, the spherule and the pedicles. The increasing complexity ofeach of these structures has led to their being described more generically as synaptic bodies but the morphologicaldesignation pedicle is still common.
With the advent of low resolution electron microscopy, some internal structures could be identified as well as more

78 Processes in Biological Vision
148Boycott, B. & Kolb, H. (1973) The connexions between bipolar cells and photoreceptors in the retina of thedomestic cat. J. Comp. Neurol. vol 148, pp 91-114149Schein, S. (2001) Blue OFF midget and two kinds of BY ganglion cells in macaque fovea, OSA Annual Mtg.at Univ. Calif. Irvine.150Vardi, N. Morigiwa, K. Wang, T-L. Shi, Y-J. & Sterling, P. (1998) Neurochemistry of the mammalian cone‘synaptic complex’ Vision Res. Vol. 38, pp 1359-1369151Rodieck, R. (1998) The First Steps in Seeing. Sunderland, MA: Sinauer Associates, Inc. pg 100152Saito, T. Kujiraoka, T. & Yonaha, T. (1983) Connections between photoreceptors and horseradishperoxidase-injected bipolar cells in the carp retina. Vision Res. vol. 23, no. 4. pp 353-362
details related to invaginations along the periphery. Boycott & Kolb provided a widely reproduced caricature of thespherule and pedicle in 1973148. They displayed the “synaptic ribbon” connecting the interior of the axon to the surfaceof the synaptic body. They also showed a scattering of vesicles within the axon terminal and a variety of largelyconceptual interfaces with bipolar and horizontal cells.
Only analysis of a set of higher resolution electron micrographs taken from a variety of planes could clarify the abovesituation. With the availability of computerized tomography, this has now been done. The work of Schein will bediscussed below.
4.3.6.1.1 The structure of the pedicle and the associated synaptic complex
A number of researchers have recently provided high resolution microimages of the pedicles and their interaction withthe dendrites of the subsequent bipolar and horizontal cells. They show a maturing of knowledge in this area.
Schein has recently prepared a series of tomographic reconstructions of complete synaptic complexes associated witha single pedicle in the fovea of macaque149. The images are stereographic and in color. His work demonstrates that atypical pedicle;
+may be 5 microns across (2.5 times the diameter of the typical Outer Segment),
+contains about twenty individual “ribbons,”
+may have as many as 400 individual basal contacts with neurite spines,
+ may make many individual basal contacts with spines that converge into a single dendrite.
His data reflects at least one type of “ON-cone” interfacing with about 125 ON-midget bipolar neurons. He describesthese as all of the Blue-ON type. This data is indicative of the degree of spatial encoding relative to the scene anddispersive encoding relative to the passage of signals along the optic nerve that can be expected in macaque. This latterencoding will be discussed in Chapter 13.
It is likely, based on this work, that the number of spines converging into a single dendrite from a single pedicle is anindication of the net impedance of that connection as represented by the coefficients in the fundamental equations ofvision to be presented in Chapter 16.
Vardi, et. al. have provided an excellent caricature of a simplified synaptic complex (only one ribbon and only in oneplane) with various notations based strictly on the conventional view of the synaptic junction as a (possibly electricallydriven) chemical signal transfer device150. Rodieck has recently provided a caricature of a simplified pedicle in twoorthogonal planes151. However, based on Shein’s work, it is primarily of value in pedagogy. Vardi, et. al. obtained alarge number of individual images based on 50-100 micron thick sections and examined them at a magnification of upto 42,000x. This is not sufficient magnification for drawing many conclusions. However, it is one of the early studiesreporting the “electron dense” regions of tissue near or including the plasma membranes. The lower portion of theirfigure suggests that all signal processing neurons approach the junction axially. Saito, et. al. show caricatures of thissynaptic complex at similar magnification but with the dendrites intertwined with the pedicle in a more three-dimensionalconfiguration152. The dendrites approach the junction perpendicular to the synaptic ribbon. A detailed comparison ofthe two papers is useful. Saito’s OFF-B type bipolar cell would correspond to the central bipolar shown in Vardi’sfigure and the following illustration. This cell exhibits its reverse polarity because of its connection to an amercine typeof horizontal cell. Their ON-B(II) bipolar would correspond to a bipolar contacting the axon of the photoreceptordirectly. Their work did not discuss or illustrate electron dense areas but they did provide data on the size of the
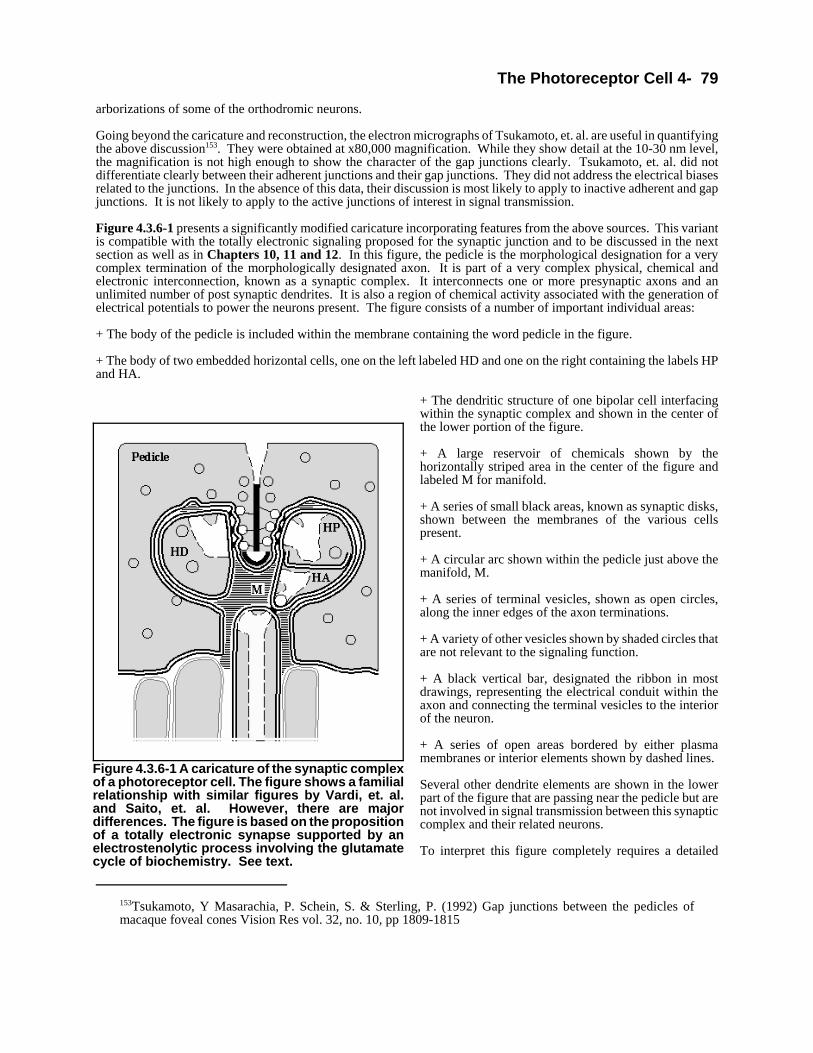
The Photoreceptor Cell 4- 79
153Tsukamoto, Y Masarachia, P. Schein, S. & Sterling, P. (1992) Gap junctions between the pedicles ofmacaque foveal cones Vision Res vol. 32, no. 10, pp 1809-1815
Figure 4.3.6-1 A caricature of the synaptic complexof a photoreceptor cell. The figure shows a familialrelationship with similar figures by Vardi, et. al.and Saito, et. al. However, there are majordifferences. The figure is based on the propositionof a totally electronic synapse supported by anelectrostenolytic process involving the glutamatecycle of biochemistry. See text.
arborizations of some of the orthodromic neurons.
Going beyond the caricature and reconstruction, the electron micrographs of Tsukamoto, et. al. are useful in quantifyingthe above discussion153. They were obtained at x80,000 magnification. While they show detail at the 10-30 nm level,the magnification is not high enough to show the character of the gap junctions clearly. Tsukamoto, et. al. did notdifferentiate clearly between their adherent junctions and their gap junctions. They did not address the electrical biasesrelated to the junctions. In the absence of this data, their discussion is most likely to apply to inactive adherent and gapjunctions. It is not likely to apply to the active junctions of interest in signal transmission.
Figure 4.3.6-1 presents a significantly modified caricature incorporating features from the above sources. This variantis compatible with the totally electronic signaling proposed for the synaptic junction and to be discussed in the nextsection as well as in Chapters 10, 11 and 12. In this figure, the pedicle is the morphological designation for a verycomplex termination of the morphologically designated axon. It is part of a very complex physical, chemical andelectronic interconnection, known as a synaptic complex. It interconnects one or more presynaptic axons and anunlimited number of post synaptic dendrites. It is also a region of chemical activity associated with the generation ofelectrical potentials to power the neurons present. The figure consists of a number of important individual areas:
+ The body of the pedicle is included within the membrane containing the word pedicle in the figure.
+ The body of two embedded horizontal cells, one on the left labeled HD and one on the right containing the labels HPand HA.
+ The dendritic structure of one bipolar cell interfacingwithin the synaptic complex and shown in the center ofthe lower portion of the figure.
+ A large reservoir of chemicals shown by thehorizontally striped area in the center of the figure andlabeled M for manifold.
+ A series of small black areas, known as synaptic disks,shown between the membranes of the various cellspresent.
+ A circular arc shown within the pedicle just above themanifold, M.
+ A series of terminal vesicles, shown as open circles,along the inner edges of the axon terminations.
+ A variety of other vesicles shown by shaded circles thatare not relevant to the signaling function.
+ A black vertical bar, designated the ribbon in mostdrawings, representing the electrical conduit within theaxon and connecting the terminal vesicles to the interiorof the neuron.
+ A series of open areas bordered by either plasmamembranes or interior elements shown by dashed lines.
Several other dendrite elements are shown in the lowerpart of the figure that are passing near the pedicle but arenot involved in signal transmission between this synapticcomplex and their related neurons.
To interpret this figure completely requires a detailed
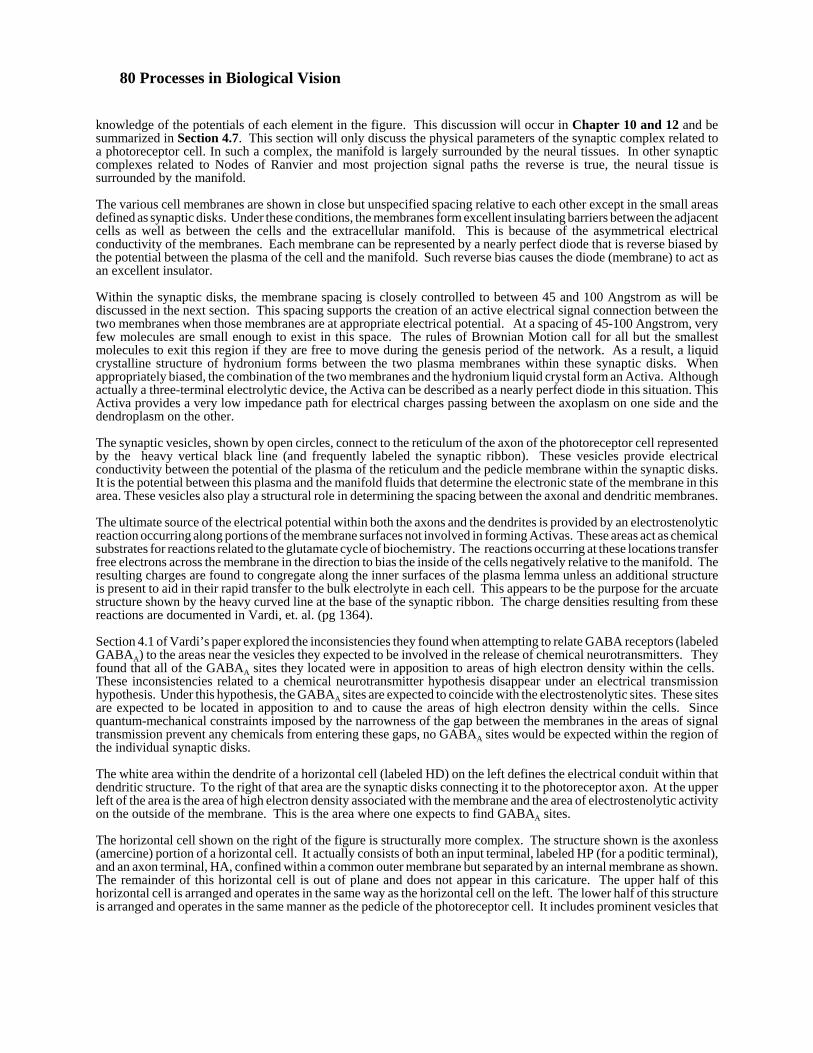
80 Processes in Biological Vision
knowledge of the potentials of each element in the figure. This discussion will occur in Chapter 10 and 12 and besummarized in Section 4.7. This section will only discuss the physical parameters of the synaptic complex related toa photoreceptor cell. In such a complex, the manifold is largely surrounded by the neural tissues. In other synapticcomplexes related to Nodes of Ranvier and most projection signal paths the reverse is true, the neural tissue issurrounded by the manifold.
The various cell membranes are shown in close but unspecified spacing relative to each other except in the small areasdefined as synaptic disks. Under these conditions, the membranes form excellent insulating barriers between the adjacentcells as well as between the cells and the extracellular manifold. This is because of the asymmetrical electricalconductivity of the membranes. Each membrane can be represented by a nearly perfect diode that is reverse biased bythe potential between the plasma of the cell and the manifold. Such reverse bias causes the diode (membrane) to act asan excellent insulator.
Within the synaptic disks, the membrane spacing is closely controlled to between 45 and 100 Angstrom as will bediscussed in the next section. This spacing supports the creation of an active electrical signal connection between thetwo membranes when those membranes are at appropriate electrical potential. At a spacing of 45-100 Angstrom, veryfew molecules are small enough to exist in this space. The rules of Brownian Motion call for all but the smallestmolecules to exit this region if they are free to move during the genesis period of the network. As a result, a liquidcrystalline structure of hydronium forms between the two plasma membranes within these synaptic disks. Whenappropriately biased, the combination of the two membranes and the hydronium liquid crystal form an Activa. Althoughactually a three-terminal electrolytic device, the Activa can be described as a nearly perfect diode in this situation. ThisActiva provides a very low impedance path for electrical charges passing between the axoplasm on one side and thedendroplasm on the other.
The synaptic vesicles, shown by open circles, connect to the reticulum of the axon of the photoreceptor cell representedby the heavy vertical black line (and frequently labeled the synaptic ribbon). These vesicles provide electricalconductivity between the potential of the plasma of the reticulum and the pedicle membrane within the synaptic disks.It is the potential between this plasma and the manifold fluids that determine the electronic state of the membrane in thisarea. These vesicles also play a structural role in determining the spacing between the axonal and dendritic membranes.
The ultimate source of the electrical potential within both the axons and the dendrites is provided by an electrostenolyticreaction occurring along portions of the membrane surfaces not involved in forming Activas. These areas act as chemicalsubstrates for reactions related to the glutamate cycle of biochemistry. The reactions occurring at these locations transferfree electrons across the membrane in the direction to bias the inside of the cells negatively relative to the manifold. Theresulting charges are found to congregate along the inner surfaces of the plasma lemma unless an additional structureis present to aid in their rapid transfer to the bulk electrolyte in each cell. This appears to be the purpose for the arcuatestructure shown by the heavy curved line at the base of the synaptic ribbon. The charge densities resulting from thesereactions are documented in Vardi, et. al. (pg 1364).
Section 4.1 of Vardi’s paper explored the inconsistencies they found when attempting to relate GABA receptors (labeledGABAA) to the areas near the vesicles they expected to be involved in the release of chemical neurotransmitters. Theyfound that all of the GABAA sites they located were in apposition to areas of high electron density within the cells. These inconsistencies related to a chemical neurotransmitter hypothesis disappear under an electrical transmissionhypothesis. Under this hypothesis, the GABAA sites are expected to coincide with the electrostenolytic sites. These sitesare expected to be located in apposition to and to cause the areas of high electron density within the cells. Sincequantum-mechanical constraints imposed by the narrowness of the gap between the membranes in the areas of signaltransmission prevent any chemicals from entering these gaps, no GABAA sites would be expected within the region ofthe individual synaptic disks.
The white area within the dendrite of a horizontal cell (labeled HD) on the left defines the electrical conduit within thatdendritic structure. To the right of that area are the synaptic disks connecting it to the photoreceptor axon. At the upperleft of the area is the area of high electron density associated with the membrane and the area of electrostenolytic activityon the outside of the membrane. This is the area where one expects to find GABAA sites.
The horizontal cell shown on the right of the figure is structurally more complex. The structure shown is the axonless(amercine) portion of a horizontal cell. It actually consists of both an input terminal, labeled HP (for a poditic terminal),and an axon terminal, HA, confined within a common outer membrane but separated by an internal membrane as shown.The remainder of this horizontal cell is out of plane and does not appear in this caricature. The upper half of thishorizontal cell is arranged and operates in the same way as the horizontal cell on the left. The lower half of this structureis arranged and operates in the same manner as the pedicle of the photoreceptor cell. It includes prominent vesicles that
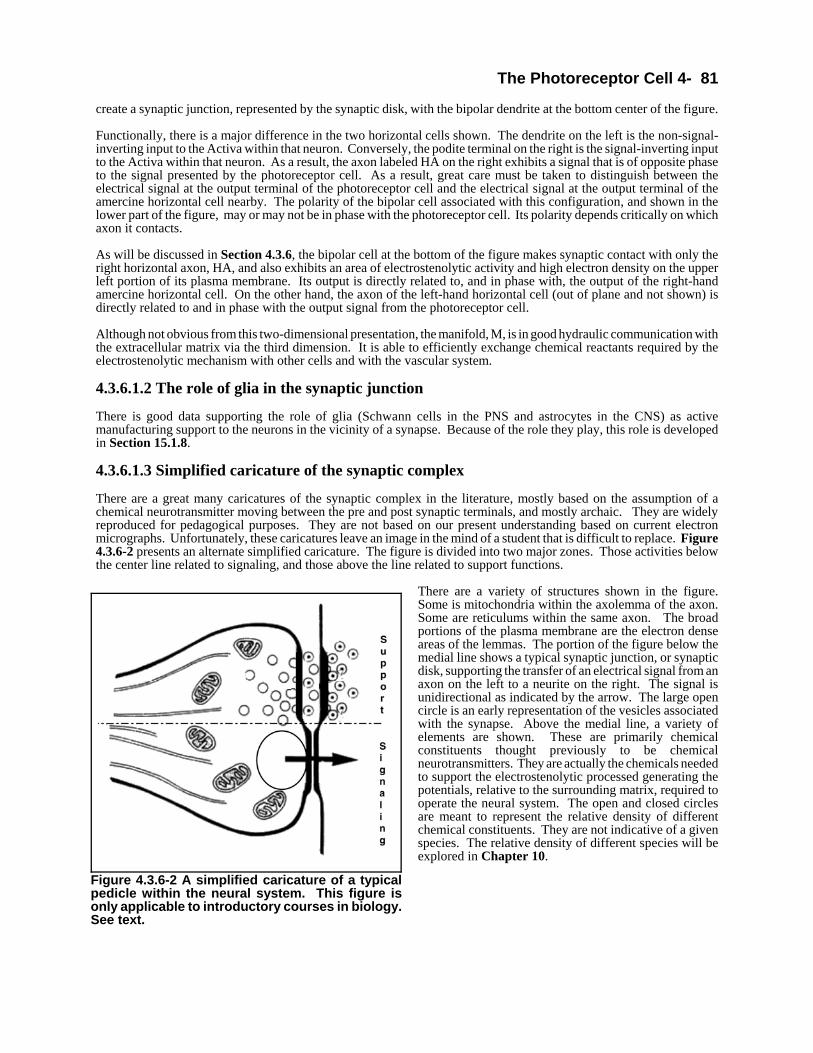
The Photoreceptor Cell 4- 81
Figure 4.3.6-2 A simplified caricature of a typicalpedicle within the neural system. This figure isonly applicable to introductory courses in biology.See text.
create a synaptic junction, represented by the synaptic disk, with the bipolar dendrite at the bottom center of the figure.
Functionally, there is a major difference in the two horizontal cells shown. The dendrite on the left is the non-signal-inverting input to the Activa within that neuron. Conversely, the podite terminal on the right is the signal-inverting inputto the Activa within that neuron. As a result, the axon labeled HA on the right exhibits a signal that is of opposite phaseto the signal presented by the photoreceptor cell. As a result, great care must be taken to distinguish between theelectrical signal at the output terminal of the photoreceptor cell and the electrical signal at the output terminal of theamercine horizontal cell nearby. The polarity of the bipolar cell associated with this configuration, and shown in thelower part of the figure, may or may not be in phase with the photoreceptor cell. Its polarity depends critically on whichaxon it contacts.
As will be discussed in Section 4.3.6, the bipolar cell at the bottom of the figure makes synaptic contact with only theright horizontal axon, HA, and also exhibits an area of electrostenolytic activity and high electron density on the upperleft portion of its plasma membrane. Its output is directly related to, and in phase with, the output of the right-handamercine horizontal cell. On the other hand, the axon of the left-hand horizontal cell (out of plane and not shown) isdirectly related to and in phase with the output signal from the photoreceptor cell.
Although not obvious from this two-dimensional presentation, the manifold, M, is in good hydraulic communication withthe extracellular matrix via the third dimension. It is able to efficiently exchange chemical reactants required by theelectrostenolytic mechanism with other cells and with the vascular system.
4.3.6.1.2 The role of glia in the synaptic junction
There is good data supporting the role of glia (Schwann cells in the PNS and astrocytes in the CNS) as activemanufacturing support to the neurons in the vicinity of a synapse. Because of the role they play, this role is developedin Section 15.1.8.
4.3.6.1.3 Simplified caricature of the synaptic complex
There are a great many caricatures of the synaptic complex in the literature, mostly based on the assumption of achemical neurotransmitter moving between the pre and post synaptic terminals, and mostly archaic. They are widelyreproduced for pedagogical purposes. They are not based on our present understanding based on current electronmicrographs. Unfortunately, these caricatures leave an image in the mind of a student that is difficult to replace. Figure4.3.6-2 presents an alternate simplified caricature. The figure is divided into two major zones. Those activities belowthe center line related to signaling, and those above the line related to support functions.
There are a variety of structures shown in the figure.Some is mitochondria within the axolemma of the axon.Some are reticulums within the same axon. The broadportions of the plasma membrane are the electron denseareas of the lemmas. The portion of the figure below themedial line shows a typical synaptic junction, or synapticdisk, supporting the transfer of an electrical signal from anaxon on the left to a neurite on the right. The signal isunidirectional as indicated by the arrow. The large opencircle is an early representation of the vesicles associatedwith the synapse. Above the medial line, a variety ofelements are shown. These are primarily chemicalconstituents thought previously to be chemicalneurotransmitters. They are actually the chemicals neededto support the electrostenolytic processed generating thepotentials, relative to the surrounding matrix, required tooperate the neural system. The open and closed circlesare meant to represent the relative density of differentchemical constituents. They are not indicative of a givenspecies. The relative density of different species will beexplored in Chapter 10.
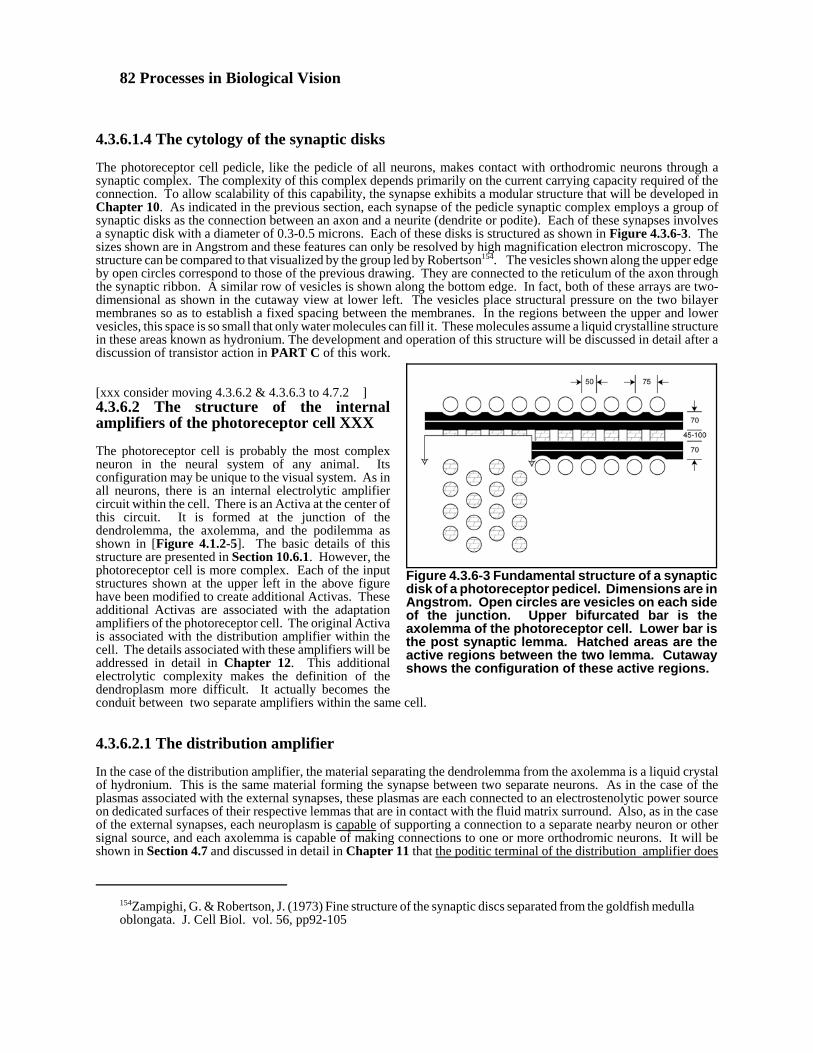
82 Processes in Biological Vision
154Zampighi, G. & Robertson, J. (1973) Fine structure of the synaptic discs separated from the goldfish medullaoblongata. J. Cell Biol. vol. 56, pp92-105
Figure 4.3.6-3 Fundamental structure of a synapticdisk of a photoreceptor pedicel. Dimensions are inAngstrom. Open circles are vesicles on each sideof the junction. Upper bifurcated bar is theaxolemma of the photoreceptor cell. Lower bar isthe post synaptic lemma. Hatched areas are theactive regions between the two lemma. Cutawayshows the configuration of these active regions.
4.3.6.1.4 The cytology of the synaptic disks
The photoreceptor cell pedicle, like the pedicle of all neurons, makes contact with orthodromic neurons through asynaptic complex. The complexity of this complex depends primarily on the current carrying capacity required of theconnection. To allow scalability of this capability, the synapse exhibits a modular structure that will be developed inChapter 10. As indicated in the previous section, each synapse of the pedicle synaptic complex employs a group ofsynaptic disks as the connection between an axon and a neurite (dendrite or podite). Each of these synapses involvesa synaptic disk with a diameter of 0.3-0.5 microns. Each of these disks is structured as shown in Figure 4.3.6-3. Thesizes shown are in Angstrom and these features can only be resolved by high magnification electron microscopy. Thestructure can be compared to that visualized by the group led by Robertson154. The vesicles shown along the upper edgeby open circles correspond to those of the previous drawing. They are connected to the reticulum of the axon throughthe synaptic ribbon. A similar row of vesicles is shown along the bottom edge. In fact, both of these arrays are two-dimensional as shown in the cutaway view at lower left. The vesicles place structural pressure on the two bilayermembranes so as to establish a fixed spacing between the membranes. In the regions between the upper and lowervesicles, this space is so small that only water molecules can fill it. These molecules assume a liquid crystalline structurein these areas known as hydronium. The development and operation of this structure will be discussed in detail after adiscussion of transistor action in PART C of this work.
[xxx consider moving 4.3.6.2 & 4.3.6.3 to 4.7.2 ]4.3.6.2 The structure of the internalamplifiers of the photoreceptor cell XXX
The photoreceptor cell is probably the most complexneuron in the neural system of any animal. Itsconfiguration may be unique to the visual system. As inall neurons, there is an internal electrolytic amplifiercircuit within the cell. There is an Activa at the center ofthis circuit. It is formed at the junction of thedendrolemma, the axolemma, and the podilemma asshown in [Figure 4.1.2-5]. The basic details of thisstructure are presented in Section 10.6.1. However, thephotoreceptor cell is more complex. Each of the inputstructures shown at the upper left in the above figurehave been modified to create additional Activas. Theseadditional Activas are associated with the adaptationamplifiers of the photoreceptor cell. The original Activais associated with the distribution amplifier within thecell. The details associated with these amplifiers will beaddressed in detail in Chapter 12. This additionalelectrolytic complexity makes the definition of thedendroplasm more difficult. It actually becomes theconduit between two separate amplifiers within the same cell.
4.3.6.2.1 The distribution amplifier
In the case of the distribution amplifier, the material separating the dendrolemma from the axolemma is a liquid crystalof hydronium. This is the same material forming the synapse between two separate neurons. As in the case of theplasmas associated with the external synapses, these plasmas are each connected to an electrostenolytic power sourceon dedicated surfaces of their respective lemmas that are in contact with the fluid matrix surround. Also, as in the caseof the external synapses, each neuroplasm is capable of supporting a connection to a separate nearby neuron or othersignal source, and each axolemma is capable of making connections to one or more orthodromic neurons. It will beshown in Section 4.7 and discussed in detail in Chapter 11 that the poditic terminal of the distribution amplifier does
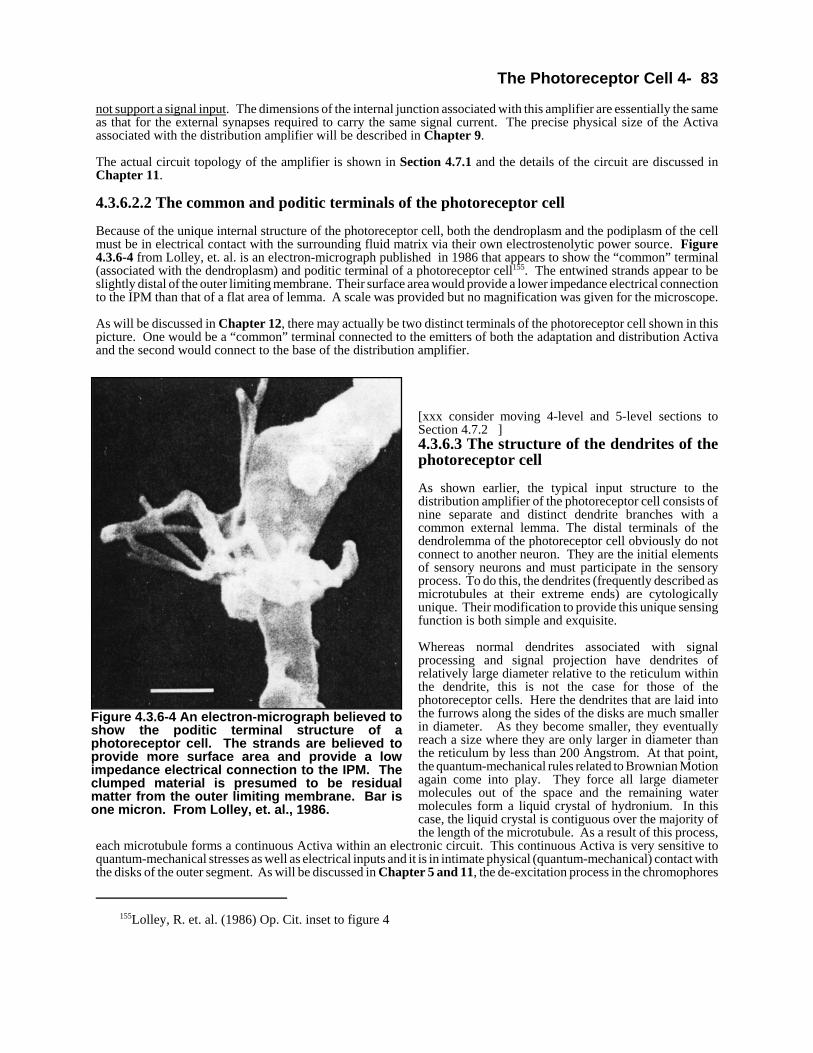
The Photoreceptor Cell 4- 83
155Lolley, R. et. al. (1986) Op. Cit. inset to figure 4
Figure 4.3.6-4 An electron-micrograph believed toshow the poditic terminal structure of aphotoreceptor cell. The strands are believed toprovide more surface area and provide a lowimpedance electrical connection to the IPM. Theclumped material is presumed to be residualmatter from the outer limiting membrane. Bar isone micron. From Lolley, et. al., 1986.
not support a signal input. The dimensions of the internal junction associated with this amplifier are essentially the sameas that for the external synapses required to carry the same signal current. The precise physical size of the Activaassociated with the distribution amplifier will be described in Chapter 9.
The actual circuit topology of the amplifier is shown in Section 4.7.1 and the details of the circuit are discussed inChapter 11.
4.3.6.2.2 The common and poditic terminals of the photoreceptor cell
Because of the unique internal structure of the photoreceptor cell, both the dendroplasm and the podiplasm of the cellmust be in electrical contact with the surrounding fluid matrix via their own electrostenolytic power source. Figure4.3.6-4 from Lolley, et. al. is an electron-micrograph published in 1986 that appears to show the “common” terminal(associated with the dendroplasm) and poditic terminal of a photoreceptor cell155. The entwined strands appear to beslightly distal of the outer limiting membrane. Their surface area would provide a lower impedance electrical connectionto the IPM than that of a flat area of lemma. A scale was provided but no magnification was given for the microscope.
As will be discussed in Chapter 12, there may actually be two distinct terminals of the photoreceptor cell shown in thispicture. One would be a “common” terminal connected to the emitters of both the adaptation and distribution Activaand the second would connect to the base of the distribution amplifier.
[xxx consider moving 4-level and 5-level sections toSection 4.7.2 ]4.3.6.3 The structure of the dendrites of thephotoreceptor cell
As shown earlier, the typical input structure to thedistribution amplifier of the photoreceptor cell consists ofnine separate and distinct dendrite branches with acommon external lemma. The distal terminals of thedendrolemma of the photoreceptor cell obviously do notconnect to another neuron. They are the initial elementsof sensory neurons and must participate in the sensoryprocess. To do this, the dendrites (frequently described asmicrotubules at their extreme ends) are cytologicallyunique. Their modification to provide this unique sensingfunction is both simple and exquisite.
Whereas normal dendrites associated with signalprocessing and signal projection have dendrites ofrelatively large diameter relative to the reticulum withinthe dendrite, this is not the case for those of thephotoreceptor cells. Here the dendrites that are laid intothe furrows along the sides of the disks are much smallerin diameter. As they become smaller, they eventuallyreach a size where they are only larger in diameter thanthe reticulum by less than 200 Angstrom. At that point,the quantum-mechanical rules related to Brownian Motionagain come into play. They force all large diametermolecules out of the space and the remaining watermolecules form a liquid crystal of hydronium. In thiscase, the liquid crystal is contiguous over the majority ofthe length of the microtubule. As a result of this process,
each microtubule forms a continuous Activa within an electronic circuit. This continuous Activa is very sensitive toquantum-mechanical stresses as well as electrical inputs and it is in intimate physical (quantum-mechanical) contact withthe disks of the outer segment. As will be discussed in Chapter 5 and 11, the de-excitation process in the chromophores
84 Processes in Biological Vision
156— (1992) Fundamentals and Principles of Ophthalmology, section 2 in Basic and Clinical Science Course.San Francisco, CA: American Academy of Ophthalmology pp 198-203
of vision creates a quantum-mechanical energy packet that can stimulate this Activa. This is the method of electricalsignal generation in the photoreceptor cells of vision.
4.3.6.3.1 The source of the adaptation mechanism
The light stimulating the chromophoric material of the outer segment of each PC generates excitons within the liquidcrystal formed by that material. As a result, the chromophoric material becomes slightly transparent (is bleached) witheach exciton created. These excitons in turn are de-excited by a quantum mechanical transfer of energy to the dendriticstructure of the inner segment of the same PC. This transfer involves a symmetrical process. Each de-excited excitonrequires the generation of a free electron generated within the inner segment. If enough electrons are not available inthe dendritic (base) lead of the first Activa (see Section 4.7.2), the chromophoric material is not completely de-excited.This mechanism is the source of the adaptation mechanism associated with vision. See Section 7.2.4.
4.3.7 The RPE cell
The RPE cells are not neurons. They are highly specialized cells designed to extract the chromogens of vision from theblood stream, process them further, store them if needed and transfer them to the IPM in conjunction with a specializedgroup of transport proteins. The so-called pigment granules of these cells are multicolored and are locations ofchromophore storage. The cells are pressed together in a layer in order to provide both a hydraulic and a electricallyinsulating barrier between the IPM and the choro-vascular system of the eye. The American Academy of Ophthalmologyhas provided a brief description of the functions of the RPE156. It clearly recognizes the role of the RPE in the “uptake,transport, storage, metabolism, and isomerization of vitamin A.” The operation of the RPE cells will be addressed indetail in Section 7.1.2.
4.3.8 Environment between the photoreceptor and RPE cells
The environment surrounding the photoreceptor cells is required to meet a variety of requirements. Because of this, thephotoreceptors are positioned uniquely with respect to the other structures of the retina. To satisfy the requirement toprotect the chromophores of vision from any oxidizing chemicals, the outer segments and most of the inner segmentsare located within the Inter-Photoreceptor-Matrix, IPM, located between the layer of RPE cells and the Outer LimitingMembrane, OLM. While protecting the operational disks from oxidizing chemicals, the IPM also provides an avenuefor the chromophores to be transported from the RPE cells to the extrusion cup where they are initially deposited on thedisks. The remaining part of the inner segments, all of the nuclei and the axons of the photoreceptor cells are locatedwithin the Inter-Neural Matrix, INM.
The portions of the photoreceptor cells within the IPM and the INM must both be surrounded by fluids with a reasonabledegree of electrical conductivity. These fluids provide both the electrical return path for the electrical currents resultingfrom the operation of the amplifiers and the electrostenolytic processes supporting this operation. It is worth noting thatthe OLM is both a chemical barrier and an electrical barrier. It is a good insulator. It is this insulating property thatdefines many of the electrical waveforms measured by both external ERG techniques and local ERG techniques basedon an invasive probe. This mechanism will be developed more completely in Section 4.7.4.
4.3.8.1 The electrical performance of the fluid surround
The environment surrounding the photoreceptor is divided into two different zones by the Outer Limiting Membrane.Some authors show this membrane as actually consisting of a great number of Muller Cells packed in between the InnerSegments of the photoreceptor cells. In either case, there is a barrier at this location that forms two zones. There are two different fluids surrounding the photoreceptors. The IPM surrounding the Outer Segment and the distalpart of the Inner Segment, and the fluid found saturating the neural laminate. These materials play distinctly differentroles.
The Outer Segment and most (if not all) of the Inner Segment are immersed in the Inter-Photoreceptor Matrix, IPM. TheIPM is confined between the Outer Limiting Membrane and the surface of the RPE. The IPM may play several roles.
The Photoreceptor Cell 4- 85
157Korschen, H. et. al. (1999) Interaction of glutamic-acid-rich-proteins with the cGMP signaling pathway inrod photoreceptors Nature, vol. 400, pp 761-766 158Sterling, P. (1983) Microcircuitry of the cat retina. Ann. Rev. Neurosci. vol. 6, pp. 149-185
It plays a major role in transporting the chromophoric material from the RPE to the disks of the OS. It also plays a majorelectrical role in providing a return path for the electrons emanating from the dendrites along the sides of the disks. Italso appears to provide a metabolic role by supporting the transport of metabolites from the RPE to the surface of thedisk stack. At this location, they can provide the electromotive force (voltage) needed to sustain the operation of theActiva(s) located in the dendritic structure. It also appears to provide similar support to the poda region of thephotoreceptor cell located on the surface of the IS. As indicated earlier, the fact that these metabolic materials candiffuse through the IPM between the poda terminal of the IS and dendritic terminal of the OS contributes to the veryefficient energy conservation properties of the eye.
The nucleus and axon of the photoreceptor cell reside in the neural laminate on the other side of the Outer LimitingMembrane from the remainder of the cell. This laminate plays much the same role as the IPM except it does not supportthe transport of chromophores. Metabolites are provided to the photoreceptor cell wall near the axon terminal. And,as in the case of the IPM, the metabolites are able to diffuse between the various electrical terminals of the neurons tosupport the recovery and reuse of chemical energy by the various batteries. The actual conductivity of the neural fluidmay be lower than that of the IPM since most of the current flow in the area is within the neural conduits of the variousneurons. This lower conductivity may support a higher electrical breakdown potential for the medium which would inturn allow higher packing density for the neurons.
4.3.8.2 The chemical performance of the fluid surround
There are a number of materials found in high concentration on the surface of the photoreceptor cells, near the OuterSegments, near the inner segment within the IPM and along the cell membrane in the neural laminate. A series ofglutamic-acid-rich-proteins, GARP, are found along the length of the microtubules of the photoreceptor cells157. Theseappear to be the source of the glutamic acid found at these locations. GABA (γ−aminobutyric acid), glycine and glutamicacid are generally found at high endogenous levels along with the presence of GABA synthetic enzyme, glutamic aciddecarboxylase and calcium158. The conventional view is that some of these materials are the chemical messengerstraveling between neurons. The rest of the materials facilitate the process.
Recently, the same materials have been assigned a role in the interface between the disks and the IPM. The assumptionbeing that since they are there, they probably control the permeability of the putative membrane wall surrounding theOuter Segment.
This work takes a different approach and assigns these materials to the function of providing electromotive force, avoltage, between the surrounding fluid and the inside of the membrane wall of the neurons. This is accomplished viaan electrostenolytic process. Based on this model, these materials do not directly participate in the signaling functionof the neural system. The voltage generated is a function of the specific chemistry of these materials, the characteristicsof the membranes involved and the chemistry of the fluid surround. The voltage generated is generally in the range of20-150 millivolts and may vary between the dendritic, poditic and axonal plasmas of the same cell. See Section 7.7.2.
4.3.9 Correlation of old names with actual functions (see 4.xx at end)
Referring again to the exploded view of the baseline photoreceptor “cell,” each of the cell portions can be examinedindependently at the histological level. Because the entire model has yet to be quantified in this work, several nominalvalues will be specified in this section which are only for illustrative purposes.
The big surprise is of course the fact that the outer segment is not an integral part of the “cell.” The outer segment isnot living material and in its fully formed configuration is actually a kind of piezo-photo-electric transducer. Theincident photons excite the liquid crystal layer of the chromophore and the energy is transmitted through the crystal tothe area of the nerve cell dendrites. At that site, the energy is transferred to the dendrite at a quantum level. This is animportant criterion because the noise performance of a nerve cell is critically dependent on there being a specificthreshold below which it will not respond. Alternately, the energy received from a photon is distinctly limited. In thiscase, the threshold level is in the vicinity of 1.9 electron volts, a very small but critical parameter.
The next important property of the photoreceptor cell is that it exhibits two distinctly different characters.The remainder of the photoreceptor cell is functionally divided into two parts; a nerve portion of relatively conventionalfunction and a gland function which is also relatively conventional but may have a few special features if it in fact creates

86 Processes in Biological Vision
159Bloom, xxx [not in files ]160Snyder, A. & Menzel, R. (1975) Photoreceptor optics. NY: Springer-Verlag.
and exudes two different and distinct organic molecules. If it only exudes one molecular species, it would be considereda relatively ordinary exocrine gland.
Looking at the nerve portion first, the irritation of the nerve by the outer segment results in a signal which is transferredby the nerve cell to its foot where it interfaces with one or more nerve cells of the inner nuclear layer. The nerve portionof the cell appears quite ordinary. However, it is important to determine how fast this type of nerve can transmitinformation and what refractory time is associated with this type of cell. This will be discussed later after a morecomplete signaling model is available. This model will allow the available data to be interpreted properly and provideguidance and/or data to quantify these characteristics of the photoreceptor class of cells. As a typical case, the nerve isable to transmit this signal at a velocity of about 10 meters/sec and at a rate of about 100 samples per second. Theseproperties may vary significantly with the size of the cells and possibly with their position in the retina independent ofsize, due to the metabolic parameters of the INM in the local area.
The foot of the nerve portion of the cell (the pedicle) is believed to transmit its information to the first signal processinggroup of nerves by electrical means. This proposition which will be defended later is chosen because of the unusual andpossibly unique nature of the signal processing nerves of the retina. They are known to operate in an analog, as opposedto a binary--all or nothing, mode. This is almost surely an electronic mode which does not rely on chemical changes.The literature presents many signals that are offered as analog in nature and as emanating from the photoreceptor cells.
The gland like portion of the photoreceptor cell is relatively conventional once its function is accepted. Its overallpurpose is to assimilate materials and secrete them into the IPM space. Since this space is independent of the bloodstream, this type of secretion is known as exocrine secretion. The secreted material is formed into a continuous stripof material which can be easily configured into the disks of the outer segment. Bloom presents a figure attributable toJ. Gross showing a glandular cell producing molecules which after emiocytosis form up into a higher level structure.In this case, tropocollagen molecules aggregate extracelluarly into collagen fibrils159. The words presumed and believedare used liberally in the original caption for Bloom’s figures. However, the nomenclature appears appropriate to theoperation of the glandular part of the photoreceptor cell.
The above description may appear superficial at this stage because enough details of the overall model have not beenpresented to justify it completely. This will occur below and allow further specific characteristics of the photoreceptorsand their functions to be quantified.
4.4 Functional Description of components at the cytological level and beyond
The housekeeping functions (the only functions usually discussed in the anatomical literature) will not be discussed here.It is the neural and glandular functions that are important in signaling. The nerve portion and the gland portion of thephotoreceptor cell operate at and below the cytological level much as other body cells do. Their functionalcharacteristics will be reviewed after discussing the outer segment.
4.4.1 Outer segment
4.4.1.1 Overview
Snyder & Menzel provided an important and comprehensive series of papers on the performance of the Outer Segmentfrom the perspective of electromagnetic wave theory160. About one-half of the material applies to Arthropoda and willnot be discussed here. Some of the papers relied upon the conventional wisdom of the time that the orientation of themajor axis of the chromophores were randomly arranged on the surface of the disks. This assumption does not conformwith the present current wisdom that the chromophores form a ligand located deep within the opsin molecule. Nor isit consistent with the proposal of this work that the chromophores are located on the surface but with their major axisof the chromophores aligned with the long axis of the Outer Segment. Other papers are very useful in quantifying theoptical performance of the Outer Segments.
An interesting conjecture appears in Liebman on page 203 of Snyder & Menzel. He finds that lipids and proteins makeup 85-90% of the dry mass of the Outer Segments and speculates on what makes up the other 10-15%. He does notdiscriminate between soluble and insoluble lipids and proteins. In this work, the actual chromophores account for that
The Photoreceptor Cell 4- 87
missing mass. They are an easily disturbed liquid crystalline coating on the disks that is frequently washed away afterbeing attacked by a detergent. When in-vivo, they exhibit unusual electronic properties similar to those described byLiebman.
In another paper in Snyder & Menzel, Fischer & Rohler discuss the light absorption properties of an idealizedphotoreceptor on the basis of waveguide theory. They treat the Outer Segment as a cylinder of homogeneous dielectricmaterial surrounded by another homogeneous material. The third paragraph of their theory explains how their modelis unrealistic and how they had to violate the boundary conditions associated with the application of Maxwell’s Laws.This work avoids this problem by removing any assumption of homogeneity and introducing instead, the concept of aspaceframe. In both works, the conclusions are the same. The waveguide properties of the Outer Segments are key tothe absorption of light by the photoreceptors. The Outer Segments act like directional antennas. The properties of theseantennas are developed in detail beginning on page 38 of Snyder & Menzel.
4.4.1.2 Growth cycle
See Section 4.6.2 & 7.6.
4.4.1.3 Physical analog of the Outer Segment at “human scale”
The imagery of the previous section doesn’t give a very good perspective to the reader concerning the relative geometryof the Outer Segment and the disks of which it is composed. The following brief sections are meant to give a perspectiveto the size and geometry of the Outer Segment and its components.
4.4.1.3.1 The Outer Segment as an Assembly
If the typical Outer Segment is taken to be 2.0 microns in diameter and 50 microns long, it has an aspect ratio of 25:1;a long thin (and in fact, fragile) rod--rod because it is in the form of a solid cylinder. The inside of this space is filledwith a stack of essentially planar disks which are extremely thin and have a lip around the outside edge. Ignoring thelip for the moment, the individual disk is approximately 165 angstroms, or 16.5 nanometers, thick with a diameter of 2.0microns. This disk has an aspect ratio of about 120:1. Until recently, it was difficult to find something in everyday lifewith this high an aspect ratio. A compact disk (CD) is very close to this aspect ratio; it is 1.0 millimeters thick and 120millimeters in diameter, an aspect ratio of 120:1. Therefore an “optical disk” of the retina could be represented by a“compact disk” which is of coarse an optical disk of a different technology. To complete the emulation, each of theseCD disks would have to be made with a lip at the outside edge which was symmetrical in height and width and raisedabout 1/3 the thickness of the disk on both top and bottom. In addition, the disks should exhibit an edge resembling achrysanthemum of nine petals, which would provide space for the dendrites of the inner segment to establish intimatecontact with these disks. This feature results in incisions into each disk which are approximately 30-50% of the diskdiameter. The source of this feature is almost surely the Calyx which acts as an extrusion die.
To emulate a typical outer segment, of 50 microns length, would require that a group of these CD disks, each with a totalthickness including the lips of 1.66 millimeters, be stacked about 2000 units high--for a height of about 3.3 meters or11 feet. This stack is considerably higher than the 8-foot ceiling in an average room.
Note that the above stack is not solid, the lips cause the body of the disks to be separated by about 2/3 of their basicthickness. Only about 66% of the space within the stack is occupied by the material of the disks. The remaining spaceis filled with a fluid. In the actual Outer Segment, this space is almost certainly occupied by the interstitial fluid, knownas the Inter-Photoreceptor Matrix or IPM, surrounding the Outer Segment. If this space was actually empty, i.e., a void,it would have a very deleterious effect on the index of refraction of the stack. A truly empty space has an index ofrefraction of 1.00. To be an effective photon absorber, the index of refraction of the stack should remain essentiallyconstant throughout its length; where constant is interpreted to mean variations no greater than 5%, within distances ofa few wavelengths of light.
4.4.1.3.2 The Disk as a Component
Continuing the above analogy, the individual disk is 1.0 mm in thickness and 120 mm in diameter with a symmetricallip around and including the outer edge definable as a torus of 0.8 mm radius. The planar portion of the disk is madeup of a stiff transparent sheet that is glazed with a film on each side. The sheet is actually a laminate of two 0.5 mmthick sheets corresponding to the individual opsin layers.
4.4.1.3.3 The Chromophore as a Coating
88 Processes in Biological Vision
161Papermaster, D. Schneider, B. & Besharse, J. (1985) Op. Cit.
The substrate defined above is glazed on all sides (including the torus) by a film with the thickness of about one quarterof that of the individual sheet. This very thin film is equivalent to the chromophore material. It is approximately 0.1mm. thick. The films are in fact one single layer which is continuous around the torus at the edge of the substrate. Thedisks are separated and supported by a thin layer of fluid, basically gelatinized water. This glaze is highly structured,as might be produced by a chemical deposition process as opposed to a painting process, and provides an attractiveappearance due to its specular scattering of light of certain colors. The film is a liquid crystal. It is quite soft.
4.4.1.3.4 The neural connections
The disks in the above stack are aligned so that the incisions in each disk form nine nominally vertical furrows alongthe stack. Within each of these furrows is an electrical cable approximately 1.5 mm in diameter. These cables representthe microtubules (dendrites) of the photoreceptor cell.
4.4.1.3.5 The Overall analogy
The resulting analogy of an Outer Segment is a stack of highly colored CD like disks stacked about 11 feet high andseparated by a thin film of gelatinized water. The disks are physically supported in two ways. Both the bottom and topof the stack are covered by a tight fitting sleeve about three inches long. The sleeves are nailed to the floor and ceiling.In between the sleeves, the disk stack is primarily supported by the proximity of similar stacks and the fact the interstitialspace is also filled with a viscous material. The stack is dynamic. Every five minutes, a new disk is introduced at thebottom of the stack and one is removed at the top. The resulting disk stack slides up relative to the nominally stationarymicrotubule “cage” surrounding the disks.
4.4.2 Inner segment
There are two major functional mechanisms related to the inner segment. The easiest to understand are the chemicalaspects associated with the routine generation of the opsin used as a substrate in the disks and the formation of thesedisks. The second is the electrical performance of the structure based on its inclusion of the first electronic amplifiersof the neural signal paths.
In discussing the chemistry of the segment, little can be added regarding fabrication of the disks to the work ofPapermaster, et. al. As indicated earlier, the terms myoid and ellipsoid should be dropped from their figure 1as beingextraneous161. Furthermore, it should be noted that their description concerns the fabrication of a protein, opsin, that isin no way associated with any chromophore or chromogen of vision.
The discussion of the electrical performance of the inner segment of the photoreceptor cells is one of the most importantareas in vision. However, it cannot be developed based on morphological and cytological studies. It will be postponedto PART B, Chapters 8 & 9 where it will be developed in detail.
4.5 The complete Photoreceptor-IPM-RPE Complex
The individual photoreceptors described above are assembled into a complex structure designed to support thecontinuous operation of the photodetection function. This photoreceptor/IPM/RPE complex both provides and maintainsthe chromophores of vision and also supports the electrical performance of the operating system. Figure 4.5.1-1provides a composite view of this interface showing a variety of cells. It attempts to highlight a variety of conditionsfound within this complex. These conditions will be discussed individually by reference to the cell number along theleft margin.
A critically important feature of this figure is its dynamic character. As indicated at the bottom, the disks movecontinually toward the RPE cells at a rate of about 300 nm/hr. With a disk pitch of about 250 Angstrom, this ratesuggests a disk generation rate of ten disks per hour per disk. At this rate, each disk stack is completely replaced weeklyin humans. The generation of new disks at a rate of ten per hour per cell suggests a prodigious manufacturing capabilityfor each photoreceptor cell and a prodigious phagocytotic capability for the RPE cells. The RPE cells on the right areshown storing a variety of chromophores in so-called color granules. Those marked U represent stores of the ultravioletchromophore, Rhodonine(11). The other granules represent the observed color of the granules, which are thecomplements of the absorption spectra of the individual chromophores. These granules are formed as a result of the
The Photoreceptor Cell 4- 89
162Hogan, et. al. (1971) Op. Cit. pp 425-426163Steinberg, R. (1973) Op. Cit. pg 454164Hogan, et. al. (1971) Op. Cit. pg 435
absorption of the chromophores of vision at the interface of the RPE cells and the vascular matrix adjacent to the choroid.
The disks of the outer segment continue to be shown without an enclosing membrane. This condition can be seenrelatively clearly in a micrograph at 36,000x in Hogan, et. al162 and in the other micrographs of Section 4.3.5. Theplasma membrane of the inner segment has clearly folded back on the left and does not continue to enshroud the outersegment. The caption, arrows and text clearly indicate that the membrane folds back on both sides. However, theadditional structure associated with the dendrites emanating from the cilium make this less obvious on the right. Theouter segment does remain shrouded by a barrier of limited integrity. It is proposed that this is not a biologicalmembrane but a chemical density difference.
Nilsson provided a caricature in 1964 that is in agreement with this interpretation. He showed the Outer Segmentwithout a plasma membrane associated with the photoreceptor cell. However, in some figures within that caricature,he showed the calyx of the inner segment extending nearly to the end of the Outer Segment and the “processes” of theRPE cells extending beyond the Outer Segments to enclose parts of the Inner Segments. In other figures within thecaricature, the calyx is shown extended only along one side of the Outer Segment. Steinberg chose to de-emphasize therole of the “processes” in his reproduction of the figure163.
Bruch’s membrane is shown explicitly near the RPE cells. Also shown explicitly are the cells located between the RPEcells and known variously as zonulae occludens, terminal bars, and Verhoeff’s membrane. This barrier is known toprevent passage of all proteins and may add to the electrical isolation of the inner and outer segments of thephotoreceptors.
Also shown explicitly, but less obviously, is the Outer Limiting Membrane (OLM). This membrane is represented bythe black rectangles between the inner segments of the photoreceptor cells. The OLM is sometimes labeled the ExternalLimiting Membrane (ELM) or as formed from zonulae adherentes. The rectangles are shown long enough to alsoaccommodate a variety of Mueller Cells in the space between the photoreceptor cells. Hogan presents a figure at 24,000xshowing major components (baskets) of the Mueller cells located on the IPM side of the OLM164. These two membranesprovide both chemical and electrical isolation between the IPM and the INM and between the IPM and the vascularmatrix. Both the dendrites and the poditic terminal of the photoreceptor cells are in electrical contact with the IPM whilethe axon connects electrically with the INM and other elements within the INM. This difference plays an important rolein the electrical waveforms generated by the visual system.
Cell 1 is shown in partial detail and stressing its generation of the raw disks. These disks are formed from the secretedprotein, opsin, at the location represented by the black dot. The material is shaped into disks within the extrusion cupand calyx of the inner segment. The disks are pushed toward the RPE cells by the secretion of subsequent proteinmaterial. Upon reaching the RPE, the disks are phagocytized as shown.
Cell 2 is drawn in more detail. It shows the cell creating the disk stack within the extrusion cup and calyx. However,it also shows the presence of the IPM in the space between the plane of the inner segments and the plane of the RPEcells. This matrix is saturated with chromophoric material being transported by the IRPBs. In cell 2, it is assumed thismaterial corresponds to the ultraviolet sensitive chromophore. It is shown as transparent. The material is shown ascoating both sides of each disk formed as in Cell 1. Such a cell coated with Rhodonine(11) may not be found, or maybe only residual, in the human retina.
Cell 3 repeats much of the detail of cell 2 while assuming the chromophore coating the disks corresponds to the longwavelength chromophore, Rhodonine(5). This material appears azure by reflected light but absorbs maximally at 625nm. An additional feature is shown in this view. This is the presence of a concentration of material near the disk stack.This material contains both excess chromophore present in low concentration within the vicinity of the disk stack andthe materials needed to provide electrostenolytic power to the dendrites to be discussed in conjunction with Cell 4. Thereis no cell membrane shown surrounding any of the disk stacks in this figure.
It should be noted that the functional (anisotropic) absorption spectrum of the chromophoreswhen deposited on the disks can only be observed by light applied axially to the disk stacks. Iftransverse illumination is applied to a disk stack, the peak absorption will always occur at theisotropic absorption peak of the Rhodonines at 500 nm regardless of the chromophore present.This phenomenon is due to the molecular alignment of the liquid crystalline chromophores on
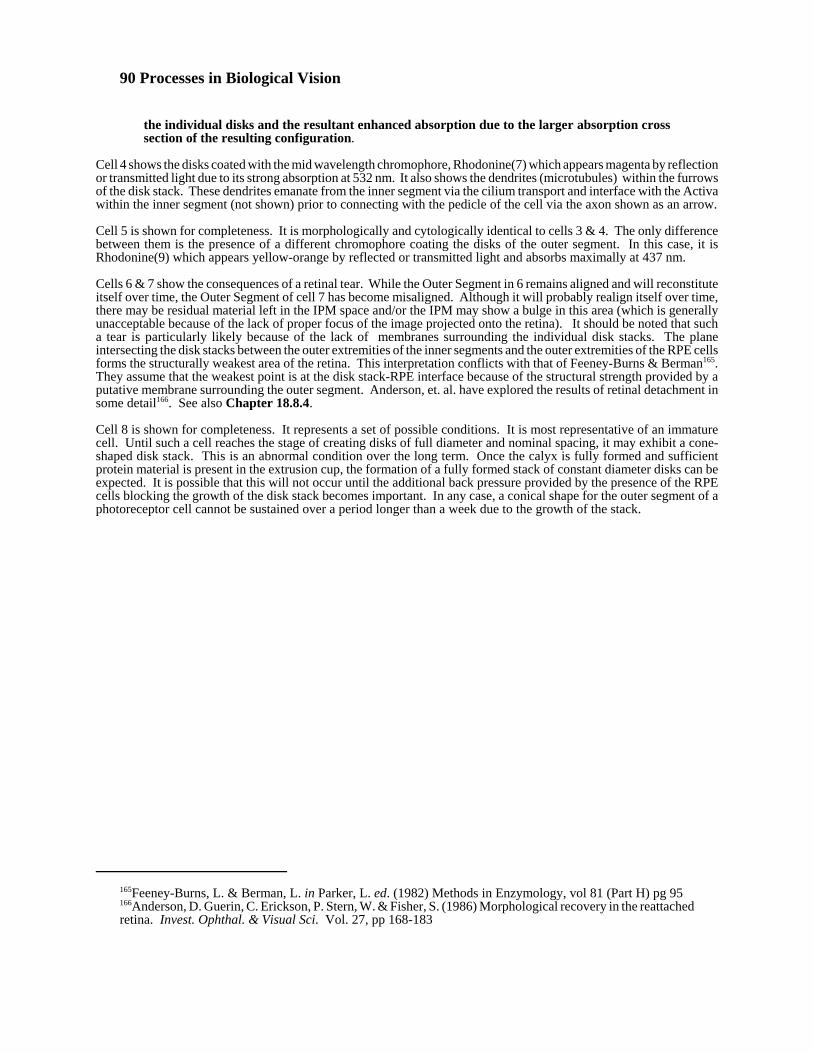
90 Processes in Biological Vision
165Feeney-Burns, L. & Berman, L. in Parker, L. ed. (1982) Methods in Enzymology, vol 81 (Part H) pg 95166Anderson, D. Guerin, C. Erickson, P. Stern, W. & Fisher, S. (1986) Morphological recovery in the reattachedretina. Invest. Ophthal. & Visual Sci. Vol. 27, pp 168-183
the individual disks and the resultant enhanced absorption due to the larger absorption crosssection of the resulting configuration.
Cell 4 shows the disks coated with the mid wavelength chromophore, Rhodonine(7) which appears magenta by reflectionor transmitted light due to its strong absorption at 532 nm. It also shows the dendrites (microtubules) within the furrowsof the disk stack. These dendrites emanate from the inner segment via the cilium transport and interface with the Activawithin the inner segment (not shown) prior to connecting with the pedicle of the cell via the axon shown as an arrow.
Cell 5 is shown for completeness. It is morphologically and cytologically identical to cells 3 & 4. The only differencebetween them is the presence of a different chromophore coating the disks of the outer segment. In this case, it isRhodonine(9) which appears yellow-orange by reflected or transmitted light and absorbs maximally at 437 nm.
Cells 6 & 7 show the consequences of a retinal tear. While the Outer Segment in 6 remains aligned and will reconstituteitself over time, the Outer Segment of cell 7 has become misaligned. Although it will probably realign itself over time,there may be residual material left in the IPM space and/or the IPM may show a bulge in this area (which is generallyunacceptable because of the lack of proper focus of the image projected onto the retina). It should be noted that sucha tear is particularly likely because of the lack of membranes surrounding the individual disk stacks. The planeintersecting the disk stacks between the outer extremities of the inner segments and the outer extremities of the RPE cellsforms the structurally weakest area of the retina. This interpretation conflicts with that of Feeney-Burns & Berman165.They assume that the weakest point is at the disk stack-RPE interface because of the structural strength provided by aputative membrane surrounding the outer segment. Anderson, et. al. have explored the results of retinal detachment insome detail166. See also Chapter 18.8.4.
Cell 8 is shown for completeness. It represents a set of possible conditions. It is most representative of an immaturecell. Until such a cell reaches the stage of creating disks of full diameter and nominal spacing, it may exhibit a cone-shaped disk stack. This is an abnormal condition over the long term. Once the calyx is fully formed and sufficientprotein material is present in the extrusion cup, the formation of a fully formed stack of constant diameter disks can beexpected. It is possible that this will not occur until the additional back pressure provided by the presence of the RPEcells blocking the growth of the disk stack becomes important. In any case, a conical shape for the outer segment of aphotoreceptor cell cannot be sustained over a period longer than a week due to the growth of the stack.
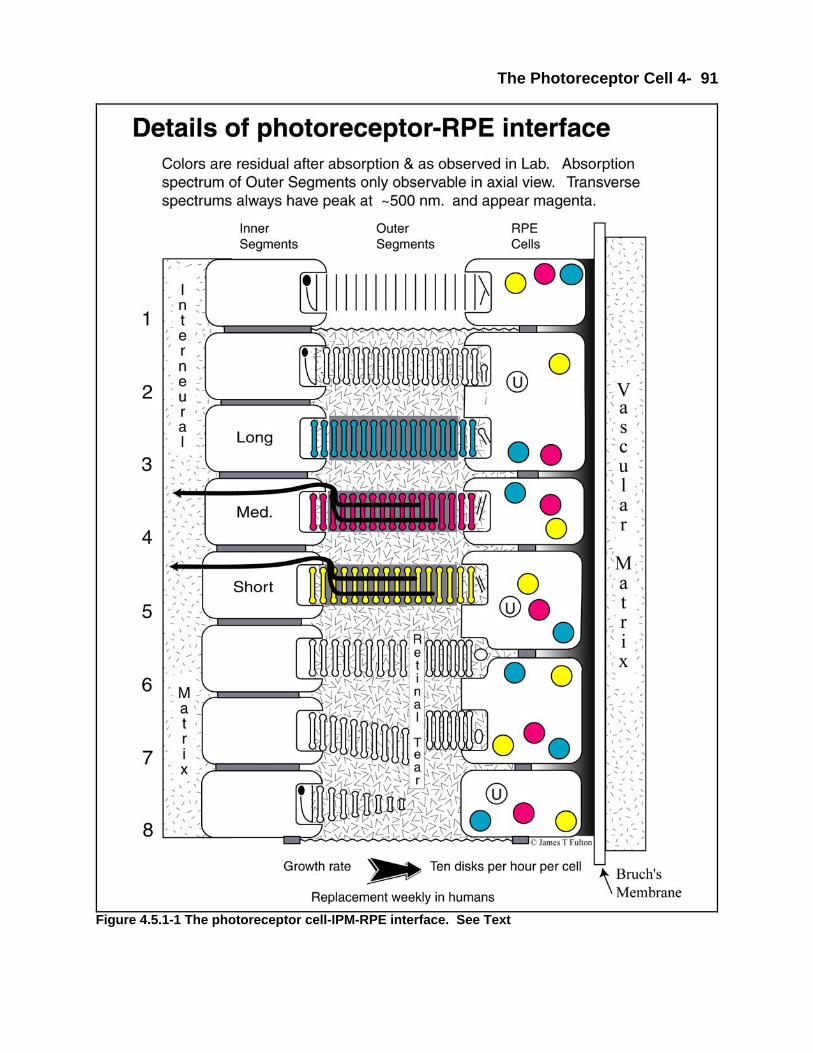
The Photoreceptor Cell 4- 91
Figure 4.5.1-1 The photoreceptor cell-IPM-RPE interface. See Text
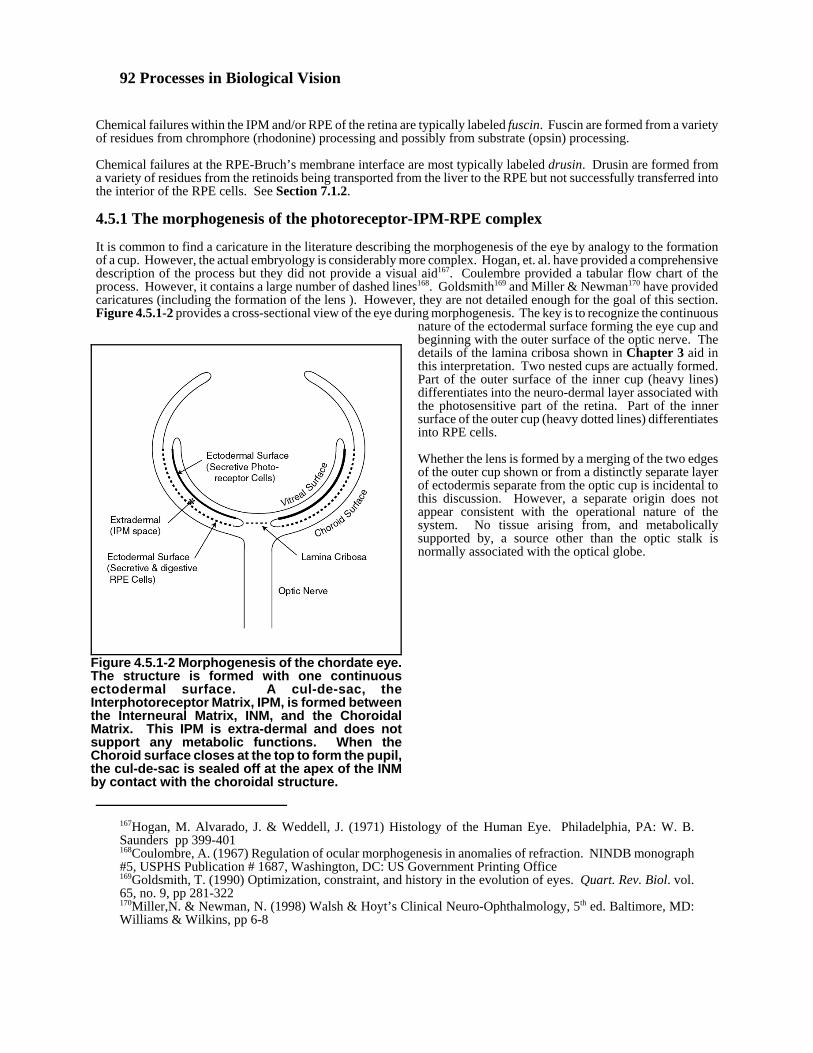
92 Processes in Biological Vision
167Hogan, M. Alvarado, J. & Weddell, J. (1971) Histology of the Human Eye. Philadelphia, PA: W. B.Saunders pp 399-401168Coulombre, A. (1967) Regulation of ocular morphogenesis in anomalies of refraction. NINDB monograph#5, USPHS Publication # 1687, Washington, DC: US Government Printing Office169Goldsmith, T. (1990) Optimization, constraint, and history in the evolution of eyes. Quart. Rev. Biol. vol.65, no. 9, pp 281-322170Miller,N. & Newman, N. (1998) Walsh & Hoyt’s Clinical Neuro-Ophthalmology, 5th ed. Baltimore, MD:Williams & Wilkins, pp 6-8
Figure 4.5.1-2 Morphogenesis of the chordate eye.The structure is formed with one continuousectodermal surface. A cul-de-sac, theInterphotoreceptor Matrix, IPM, is formed betweenthe Interneural Matrix, INM, and the ChoroidalMatrix. This IPM is extra-dermal and does notsupport any metabolic functions. When theChoroid surface closes at the top to form the pupil,the cul-de-sac is sealed off at the apex of the INMby contact with the choroidal structure.
Chemical failures within the IPM and/or RPE of the retina are typically labeled fuscin. Fuscin are formed from a varietyof residues from chromphore (rhodonine) processing and possibly from substrate (opsin) processing.
Chemical failures at the RPE-Bruch’s membrane interface are most typically labeled drusin. Drusin are formed froma variety of residues from the retinoids being transported from the liver to the RPE but not successfully transferred intothe interior of the RPE cells. See Section 7.1.2.
4.5.1 The morphogenesis of the photoreceptor-IPM-RPE complex
It is common to find a caricature in the literature describing the morphogenesis of the eye by analogy to the formationof a cup. However, the actual embryology is considerably more complex. Hogan, et. al. have provided a comprehensivedescription of the process but they did not provide a visual aid167. Coulembre provided a tabular flow chart of theprocess. However, it contains a large number of dashed lines168. Goldsmith169 and Miller & Newman170 have providedcaricatures (including the formation of the lens ). However, they are not detailed enough for the goal of this section.Figure 4.5.1-2 provides a cross-sectional view of the eye during morphogenesis. The key is to recognize the continuous
nature of the ectodermal surface forming the eye cup andbeginning with the outer surface of the optic nerve. Thedetails of the lamina cribosa shown in Chapter 3 aid inthis interpretation. Two nested cups are actually formed.Part of the outer surface of the inner cup (heavy lines)differentiates into the neuro-dermal layer associated withthe photosensitive part of the retina. Part of the innersurface of the outer cup (heavy dotted lines) differentiatesinto RPE cells.
Whether the lens is formed by a merging of the two edgesof the outer cup shown or from a distinctly separate layerof ectodermis separate from the optic cup is incidental tothis discussion. However, a separate origin does notappear consistent with the operational nature of thesystem. No tissue arising from, and metabolicallysupported by, a source other than the optic stalk isnormally associated with the optical globe.
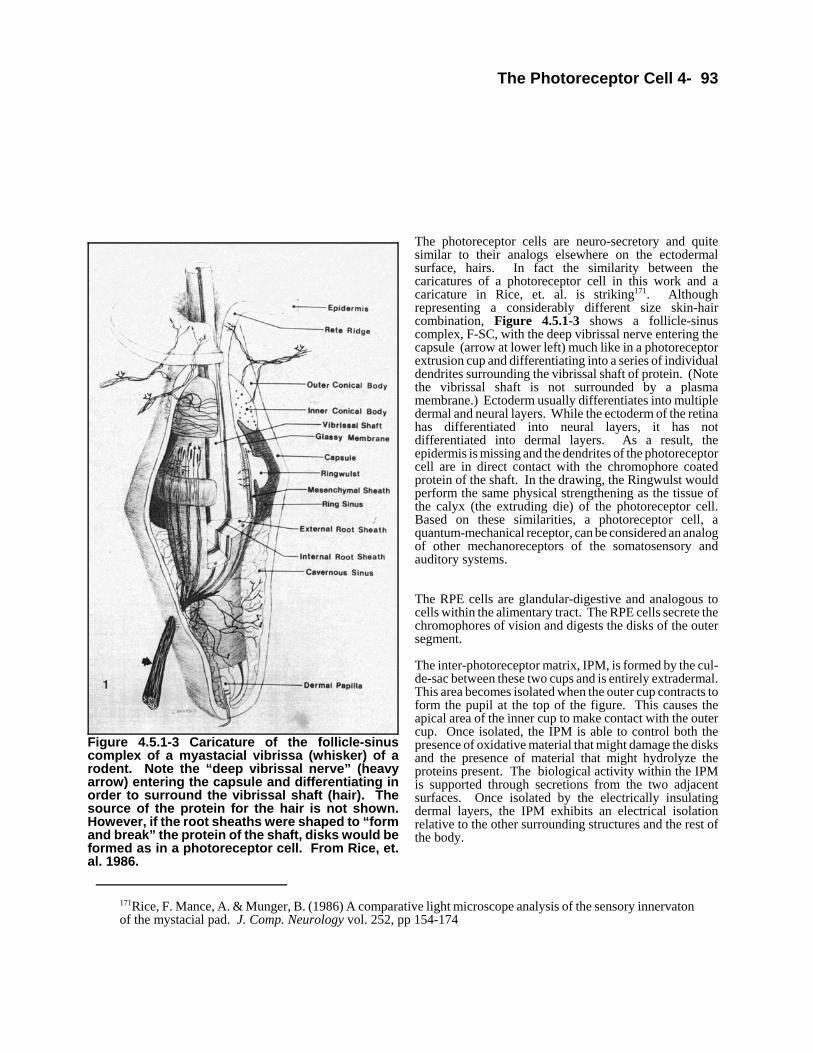
The Photoreceptor Cell 4- 93
171Rice, F. Mance, A. & Munger, B. (1986) A comparative light microscope analysis of the sensory innervatonof the mystacial pad. J. Comp. Neurology vol. 252, pp 154-174
Figure 4.5.1-3 Caricature of the follicle-sinuscomplex of a myastacial vibrissa (whisker) of arodent. Note the “deep vibrissal nerve” (heavyarrow) entering the capsule and differentiating inorder to surround the vibrissal shaft (hair). Thesource of the protein for the hair is not shown.However, if the root sheaths were shaped to “formand break” the protein of the shaft, disks would beformed as in a photoreceptor cell. From Rice, et.al. 1986.
The photoreceptor cells are neuro-secretory and quitesimilar to their analogs elsewhere on the ectodermalsurface, hairs. In fact the similarity between thecaricatures of a photoreceptor cell in this work and acaricature in Rice, et. al. is striking171. Althoughrepresenting a considerably different size skin-haircombination, Figure 4.5.1-3 shows a follicle-sinuscomplex, F-SC, with the deep vibrissal nerve entering thecapsule (arrow at lower left) much like in a photoreceptorextrusion cup and differentiating into a series of individualdendrites surrounding the vibrissal shaft of protein. (Notethe vibrissal shaft is not surrounded by a plasmamembrane.) Ectoderm usually differentiates into multipledermal and neural layers. While the ectoderm of the retinahas differentiated into neural layers, it has notdifferentiated into dermal layers. As a result, theepidermis is missing and the dendrites of the photoreceptorcell are in direct contact with the chromophore coatedprotein of the shaft. In the drawing, the Ringwulst wouldperform the same physical strengthening as the tissue ofthe calyx (the extruding die) of the photoreceptor cell.Based on these similarities, a photoreceptor cell, aquantum-mechanical receptor, can be considered an analogof other mechanoreceptors of the somatosensory andauditory systems.
The RPE cells are glandular-digestive and analogous tocells within the alimentary tract. The RPE cells secrete thechromophores of vision and digests the disks of the outersegment.
The inter-photoreceptor matrix, IPM, is formed by the cul-de-sac between these two cups and is entirely extradermal.This area becomes isolated when the outer cup contracts toform the pupil at the top of the figure. This causes theapical area of the inner cup to make contact with the outercup. Once isolated, the IPM is able to control both thepresence of oxidative material that might damage the disksand the presence of material that might hydrolyze theproteins present. The biological activity within the IPMis supported through secretions from the two adjacentsurfaces. Once isolated by the electrically insulatingdermal layers, the IPM exhibits an electrical isolationrelative to the other surrounding structures and the rest ofthe body.
94 Processes in Biological Vision
172Johnson, L. Hageman, G. & Blanks, J. (1986) Interphotoreceptor matrix domains ensheath vertebrate conephotoreceptor cells. Invest. Ophthalmol. & Visual Sci. vol. 27, pp 129-135173Korschen, H. et. al. (1999) Op. Cit.174Hirata, A. & Feeney-Burns, L. (1992) Autoradiographic studies of aged primate macular retinal pigmentepithelium Invest. Ophthalmol. & Visual Sci. Vol. 33, pp 2079-2090175Weiter, J. Delori, F. Wing, G. & Fitch, K. (1986) Retinal pigment epithelium lipofuscin and melanin andchoroidal melanin in human eyes. Invest. Ophthalmol. & Visual Sci. vol. 27, pp 145-152176Elder, G. Miller, G. Stark, W. & Feeney-Burns, L. (1982) Science, vol. 216, pp 757-759
4.5.2 The character and content of the Inter Photoreceptor Matrix
Johnson, et. al. have discussed the IPM172 but their introductory material is equivocal. In the abstract, they say the IPMappears to be a major route for metabolic support to the photoreceptors. Then, after saying little is known about thefunction of the IPM in the first paragraph, they say it is a major route of nutrients and metabolites. As suggested above,this work takes a more restricted view. Nearly all of the active metabolic processes of vision occur within either the INMor the choroid-RPE space. Except possibly for the diffusion of materials associated with the electrostenolytic processes,the contents of the IPM are supported exclusively by secretions from either of these two surrounding structures.Johnson, et. al. note the absence of both fibronectin and collagen from the IPM. They also indicate the soluble fractionof bovine IPM has been shown to contain a high proportion of protein and glycoprotein (98%), “a property that alsodiffers from connective tissue extracelluar matrices.”
The Johnson paper concentrates on what they define as extracellular domains within the IPM and generally foundadjacent to the disks of the outer segments. They stress the distinctness of these domains relative to the bulk of the IPM.They suggest these domains contain carbohydrates that are significantly different in composition, and concentration fromthose found elsewhere in the IPM. Although they define these domains as sheaths, they carefully differentiate them fromthe cellular sheaths adjacent to the outer segments and originating with the inner segments and with the RPE cells. Theysuggest these sheaths exhibit sufficient morphological integrity to allow their separation from the retina. While providinginteresting photomicrographs of the photoreceptor cells fluorescing, they did not resolve the character of the materialin their domains in detail. This material appears to correlate with the GARP’s found by Korshen, et. al173. They alsodiscuss the presence of the protein IRBP in the IPM and indicate it appears to concentrate directly adjacent to the surfaceof the RPE cells. This is their area of major chemical activity. However, it is not clear that they are secreted by the RPEcells. They may be secreted by the Mueller cells located between the photoreceptor cells.
The above findings are consistent with this work. It is proposed that the extracellular domains of Johnson, et. al. are thematerials associated with the electrostenolytic process supporting the electrical activity of the neural portion of thephotoreceptor cells. Under this hypothesis, these materials are primarily GABA, glycine and the glutamates associatedwith the glutamate cycle of nutrition. Unfortunately, the use of formaldehyde in the experiments of Johnson, et. al.probably obscure the presence of such materials as the aldehyde of glutamic acid. The concentration of their materialin domains near “cones,” as opposed to “rods,” is explained by the lower packing density of disk material in these areas.The electrostenolytic material is merely present in higher volume in these relative voids.
4.5.3 The character and content of the RPE layer
Considerable work has been performed to determine the character and content of the RPE layer because of its presumedinvolvement in aging. Much of it has been done using light microscopy and associated visual band fluoroscopy. Thework of the Feeney-Burns teams is particularly large with dates ranging from 1965 to 1992174. Weiter, et. al. have alsoprovided useful data175. Early work began using fluoroscopy at an excitation wavelength of 365 nm and an observationwavelength of 470 nm. This procedure has continued to be followed even though the fluorescence of the RPE is knownto exhibit a broader spectrum (Typically 430 to beyond 700 nm) with a peak in the 540-640 nm range176. The data ofElder, et. al. is based on difference spectra between old and young eyes which may introduce a problem in interpretation.Much of the work has involved integrating the fluorescent from a cross section of an entire RPE cell or row of RPE cells.Areas of 30 by 3 microns are common. Older imaging was based on tungsten illumination and is generally at 800x witha few visual observations at 2000x. This level of performance is not able to resolve the cytological activity occurringwithin the samples and fails to reflect much of the blue character of the materials. The two pigment materials normallyobserved using these techniques are lipofuscin and melanin. It is not believed that the chromophoric pigments granulesof vision present in the RPE can be observed by these techniques. The granules are quite small and the chromophoresdo not normally fluoresce due to their dipole structure. Some of the investigations employed electron microscopy whereno chromatic information can be obtained. No rigorous definition of melanin could be found in these papers nor was

The Photoreceptor Cell 4- 95
177Hogan, et. al. (1971) Op. Cit. pp 414-415178Feeney-Burns, L. Gao, C-L. Berman, E. (1988) The fate of immunoreactive opsin following phagocytosisby pigment epithelium in human and monkey retinas. Invest. Ophthalmol. & Visual Sci. Vol.29, pp 708-719179Rodieck, R. (1973) The vertebrate retina. San Francisco, CA: W. H. Freeman & Co. 180Leventhal, A. ed. (1991) The Neural Basis of Visual Function, as volume 4 of Vision and VisionDysfunction, Cronly-Dillon, J. general ed. Boca Raton, FL: CRC Press. Pg. 399181Reh, T. in Ryan, et. al. (2001) Retina, 3rd ed. Vol. One, St. Louis, MO: Mosby, Chap 1
there any discussion of whether the melanin was multicolored. The On-Line Medical Dictionary defines melanin as amixture of red, yellow and violet colored materials without defining these colors rigorously. This set does not conformto the conventional notation of either the RGB or the CMYK system. It is a mixed set. See the highlighted sentencebelow.
Hogan, et. al. provided additional information in 1971, including electron micrographs of pigment granules177. They alsoprovided a caricature suggesting that “fingers” from the RPE cells may extract the chromophores from the disks beforethe terminal group of disks are engulfed by the RPE plasma membrane. This extraction would be easier if the putativemembrane surrounding the disks, shown in their caricature, were absent as proposed here.
The 1988 paper by Feeney-Burns, et. al. provides electron microscopy of RPE and Bruch’s membrane cells ranging from16,000x to 32,000x178. This paper explores the digestion of the phagosomes, engulfed from the outer segments of thephotoreceptor cells, by lysosomes. The imagery also shows the presence of many individual granules identified onlyas “lyosomes (incipient lipofuscin granules)” in the investigation. Their introduction supported the view that most RPEphagolysosomes (combinations of phagosomes and lysosomes) are reduced to less than half their initial cross sectionwithin 16 hours after a shedding event in young animals. They also support the view that the process goes to completionleaving negligible residue. However, they propose that residues do accumulate in older eyes leading to lipofuscingranules and that some residues may accumulate in cells of Bruch’s membrane due to apoptsis, i. e., the shedding of RPEcytoplasm into Bruch’s membrane.
No reference was found in the above work to the possible presence of a variety of retinol binding proteins within the RPEspace! This seems remarkable in light of other work going on during the same time span defining the composition andconcentration of these materials in this space. Similarly, no reference could be found to the spectral properties of themelanin granules observed or whether they were all of the same color. It is interesting to note that Elder, et. al.presented a “corrected” fluorescent spectral emission curve for non polar chloroform extracts of whole humanRPE that looks remarkable similar to the photopic luminosity function of human vision (the detailed function ofthis work, not the smoothed CIE variant). It is possible the extract consisted primarily of the chromophores of visionin significant concentration. The Elder curve is a small difference between two larger functions. It may deserve moredetailed interpretation based on the procedure used to obtain it.
4.5.4 The Inner segment(EMPTY)
4.6 Development & Life Cycle of Photo-Receptors (Physical dynamics)
Other than some comparative material, this section focuses on describing the eye of Chordata. More research is neededto determine whether it is applicable to Arthropoda and Mollusca. It is likely that some similar mechanism is operablefor the longer life species in these phyla. The material applies to the tetrachromatic eye. However, the schematics aredrawn for the trichromatic eye for convenience. They can easily be extended.
There is a large amount of very valuable data in the technical literature on this subject. However, most of it has beeninterpreted differently than it is here. Rodieck179 has provided an extensive discussion and an excellent reference listup to 1973. However, there are many inconsistencies at the detail level. Stein, et. al.180, writing in 1991, provide a moreconcise discussion and additional references. The discussion addresses both disk formation and disk shedding.Lam & Bray have provided a discussion on the embryology of the various cell types in the retina181.
Very important work in this area was performed at the nucleotides during the 1980's. Those works were designed todetermine the dynamics of the disks of the outer segment of the photoreceptor cells. This work demonstrated clearlythat the opsin substrates were formed in a process entirely independent of the process that formed the chromophoricmaterial. The only conclusion is that rhodopsin is a conglomerate and not a chemical compound. It is a conglomerateof the chromophore, Rhodonine, deposited as a liquid crystalline film on an inert protein substrate, opsin. This
96 Processes in Biological Vision
182Okada, T. Le Trong, I. Fox, B. et. al. (2000) X-ray diffraction analysis of three-dimensional crystals of bovinerhodopsin obtained from mixed micelles J. Struct Biol vol. 130, pp 73-80183Young, R. & Bok, D. (1969) J. Cell Biol. vol. 42, 392184Ganguly, J. (1989) Biochemistry of Vitamin A. Boca Raton, Fl: CRC Press, Inc.185Lion, F. Rothmans, J. Daemen, F. & Bonting, S. (1975) Biochemical aspects of the visual process.Biochim. Biophys. Acta, 384, 283186Fatt, I. & Weissman, B. (1992). Physiology of the Eye (Second Edition). Boston: Butterworth-Heinmann
designation will be used here to differentiate the complete protein molecule from the chromophore, even though theprotein incorporates a retinal ligand (that does not act as a chromophore). The photosensitivity of this conglomerate tovisible light is changed greatly when the neural connections to the parent photoreceptor cell are disturbed.
More recently, detailed description of the opsin found in the disks of chordates have become available. These haveshown the precise location and structural arrangement of a N-retinoid ligand totally enclosed within the overall protein.This ligand does not appear to participate in the signaling function. However, its presence appears to explain the needto replace the disks in chordate eyes on a regular basis and at a rapid rate. Okada, T. Le Trong, et. al. have found thatsolid crystals of opsin (incorporating the non-chromophore -N-retinoid) are sensitive to, swell under, and are destroyedby visual light182. It appears that the light causes an isomerization of the retinoid and this change in structure is sufficientto damage the structural integrity of the crystal. It is not known whether a similar isomerization within a liquid-crystalof opsin would have the same effect. If it does, the damage caused to the opsin substrate by the small amount of lightabsorbed molecularly (as opposed to resonantly) by the retinoid would generate the requirement to replace the disks ona routine basis. No other reason was found in the literature for the routine replacement of the disks.
4.6.1 Overview
In the last few years, much new information has become available concerning the life cycle of the photoreceptors. It isnow possible to definitize and quantify many of the processes occurring in this regime; specifically, the rates of growth,the methods of material formation, the transport paths involved and, in a preliminary fashion, the transport mechanismsinvolved. It is also clear that there is a series of feasible experiments that could be performed to fill holes in the data.A specific group of experiments would be to repeat the work of the Young183 team and the Bridges team in theautoradiography of the photoreceptor-IPM-RPE complex discussed below.
Another important area would be to continue the work of understanding the processes of esterfication of retinoloccurring in the RPE and of understanding the details of the transport of the resultant retinoids (Rhodonines) throughthe inter-photoreceptor matrix (IPM) The recent work in these areas is summarized in Ganguly184
With the elucidation of this model, some of the ideas presented in the literature are best described using a more precisesyntax. The ideas are frequently correct but are found to utilize words which lack sufficient precision. There are alsosome inconsistencies that can be eliminated if this model is adopted.
There are a number of ideas in the literature referring to processes that occur when the retina is illuminated and othersthat occur when the retina is not illuminated. These ideas do not fully recognize the continuity of the visual process withrespect to illumination. If there was actually a process that consumed or de-activated material during illuminationwithout allowing its restoration, the eye would show fatigue effects which would actually lead to blindness undercontinuous use. This does not occur except in certain cases of fatigue related to inadequate metabolic supply from thebloodstream (i.e., transient tunnel vision) and this condition is rapidly eliminated without requiring the retina be placedin the dark. It is important to recognize that all processes in the eye operate continuously.
There are also a number of statements in the literature that speak of “oxidizing All-trans-retinol to 11-cis-retinaldehydeby the membrane-bound retinol dehydrogenase of the ROS”185 and “Used retinoids leave the photoreceptors, cross thesub-retinal space, and are stored in the RPE, where all-trans retinal is re-isomerized to 11-cis retinal.”186 Whenassociated with any model, these statements are seen to be inconsistent. These statements are inconsistent with the modelused here for several reasons. First, it is not specified which “membrane” is being discussed, the outer membranesurrounding the disks or the “membrane” forming the disks themselves. Second the model does not require and thereis no traceable evidence for a membrane surrounding the OS. Third 11-cis-retinaldehyde is not required to explain thephototransduction processes using this model. In this model, the Rhodonines are transported from the RPE to thephotoreceptor cells in all-trans form by the Interstitial Retinoid-Binding Protein (IRBP) and utilized in that

The Photoreceptor Cell 4- 97
187Heckenlively, J. (1988) Retinitis Pigmentosa. Philadelphia, PA: J. B. Lippincott pp 42-49188(1984) Bridges, C. in Sporn, et. al. (1984) Op. Cit pg. 136
configuration. The term retinoid is used in the above label instead of the conventional retinol since it has not beendemonstrated that the material transported by the protein is retinol. To be even more specific, it should be changed toRhodonine when speaking specifically of the retinoids transported to the RPE and IPM to implement vision. As shownbelow, this latter change would open a discussion on whether a single IRBP is capable of transporting three differentRhodonines or whether there are three different IRBP’s which either create or select the specific Rhodonines inconjunction with their transport.
Heckenlively has provided a caricature and an overview of pathogenesis related to the operation of the photoreceptorcell, other than the signal generating functions187. It appears his discussion is enhanced when reinterpreted in the contextof this model.
Because of the importance of relating the following discussion to the literature, quotations will frequently be used.However, this author would choose to use more precise labels in many cases. In those cases, the quotation will be usedbut a different label will be suggested by its inclusion in curved brackets immediately after the label of the originalauthor. Generally, it will be left to the reader to determine which label is more appropriate. [xxx was this technique used] 4.6.1.1 Formation of the photoreceptor cells and Outer Segments
There is a variety of data available on the formation of the animal eye and when it becomes visually functional. Fromthis data, several propositions can be drawn. There are a number of interesting questions about the eye of the humanbaby shortly after birth. Is the baby able to sense light when it first opens its eyes? Can it see colors properly at a veryearly stage? Is the signal processing function of the retina fully functional when the eyes open?
The question of signal processing and seeing colors at an early stage can be answered fairly well for various animals.It appears obvious that if a four legged ungulate (such as a deer) can get up on its feet within minutes of birth andscamper around after its mother, the signal processing function of the retina and brain must be pretty well developed.This would indicate much of the signal processing circuitry must be genetically encoded. If the geometric circuitry isgenetically encoded, it is probably true that the color sensing circuitry is also genetically encoded. If this is true, thenthe color sensitivity of the various photoreceptors must also be genetically encoded or else incorrect color informationcould be provided to the color processing circuitry. This would lead to the conclusion that there is a geneticallycontrolled mechanism in the photoreceptor that defines what retinoid will initially form a liquid crystal in the OS. Thisgenetic encoding would therefore control the specific color sensitivity of each photoreceptor in the eye as a function ofits position in the eye.
Recent autopsy data suggests that the Outer Segments may not have attained their nominal length at birth in humans butdo so within a week or so.
As we learn more about the mosaic properties of the eye, it appears likely that a clearer understanding of the initialcapability of the eye at birth will arise.
There is an interesting question about the two forms of Vitamin A. Given a choice, which form of Vitamin A will beused to form the chromogens that are eventually deposited on the disks as chromophores? Bridges188 provides aninteresting discussion that says the type of Vitamin A used is determined primarily by the environment of the animal.In migratory fish, both types are used at different times in their lives. In mixed environments, the chromophores appearto be based on a mixture of Vitamin A’s. The ratio of Vitamin A1 to Vitamin A2 can be seen to vary in the disks alongthe length of given photoreceptor Outer Segment. If measured precisely versus an abrupt change in the environment,this data could provide another avenue for determining the rate of growth of the disks. In human, only retinol associatedwith Vitamin A1 is usually found.
4.6.1.2 Initial formation of the basic structure
There are a number of tantalizing reports in the literature concerning the formation of the photoreceptors but very littlethat attempts to put the data into an overall context. It is clear that there is a wide range of conditions that can affect theformation and organization of the photoreceptors. Some of these conditions could have significant impact on the healthand operation of the photoreceptor over the long term. These include the environment during initial formation, duringmaturation and obviously during long term operation where the system is subject to damage from a number of sources.
98 Processes in Biological Vision
189Nilsson, S. (1964) Receptor cell outer segment development and ultrastructure of the disk membranes in theretina of the tadpole (Rana pipiens) J. Ultrastr. Res. vol. 11, 581-620
In reviewing this material, it became important to segregate that related to the visual system in tadpoles from that of thelater infant form of the mature animal. The data frequently suggested the 6-day-old tadpole visual system resembled thatof the intermediate tunicate form shown in [Figure 4.2.1-1] more than it did the adult form. However, it was difficultto be sure as the location of the lens was not specified. By eight days, a more conventional chordate Outer Segmentwas observed189.
The literature generally places the formation of the retina and its basic components during the seventh to fourteenthweeks of gestation in the human. There is speculation on how completely the retina and its interconnections are formedat birth. There is little data in the literature concerning humans in this respect. However, there is the interestingobservation that the ungulates and other animals who are capable of rising to their feet and running within a few minutesof birth are not known to run into things for lack of vision. In these cases, primarily relating to warm-blooded animals,it is clear that the retina is operational at birth--at least with respect to luminance information. It is also clear that theinterconnections and data reduction capability are mature enough to reduce the data acquired by the retina. This leadsto the conclusion that much if not all of the interconnections are genetically programmed. In small mammals that areborn with their eyes closed, it has been observed that their photoreceptor cells frequently lack an outer segment. Thissegment forms during the first few days of post-natal life; with the eyes opening and functioning properly only a fewdays later. Recent studies of human infants also suggest immature Outer Segments at birth.
There is data on the speed with which the outer segments are formed for some warm blooded and some cold bloodedanimals. This data indicates the growth rate is specifically related to temperature as would be expected; the warm-blooded rate being significantly higher than for the cold blooded.
No data was found related to any difference in speed of outer segment growth for different types of photoreceptors inthe same organism. No data was found relating to how the different types of photoreceptors in a given organism areformed relative to location or spectral sensitivity. It appears that these parameters, size and spectral sensitivity are relatedto their location in the retina by relatively simple geometric rules--but they have not been enunciated in the literature.
For the human, there is reason to believe that the “seeding” of the individual photoreceptors in order to determine theirspectral sensitivity is strongly influenced by the temperature of the fetus during the seventh to fourteenth weeks ofgestation. Excessive temperature of the fetus during this interval appears to correlate with abnormalities of color visionin the mature eye. This situation will be addressed more completely in the chapter on color abnormalities.
Once formed, the photoreceptor cells of the eye appear to be relatively fixed structures for the life of the animal exceptfor the outer segments; the outer segments are dynamic structures with a continual and a rather rapid cycle of renewal.The formation, operational life and destruction of a given structure of the outer segment have been investigated frommany aspects and a reasonably coherent story emerges.
The static structure and function of the outer segments have been discussed above. The interesting thing is that theindividual photoreceptor functions normally while in a structurally transient state. New disks are formed at the base ofthe outer segment nearest the inner segment and older disks are removed from the outer segment at the RPE interfacewhile the receptor is operating normally; absorbing light, transporting excitons through its structure and exciting thedendrites of the photoreceptor. It is not clear yet from a physical point of view whether the dendrites grow and movealong with the disks or whether the dendrites are of fixed length and make contact with the moving disks.
The case where the dendrites are of fixed length is simple. The dendrite-outer segment relationship can be picturedsimilarly to the small brushes used on a copier machine to remove static electricity from the paper emerging from themachine. The charge is transferred to the brush after the paper has been processed even while the paper is moving pastthe dendrites continuously.
The alternate mechanism would involve the dendrites growing in length at the same rate as the disk stack moves towardthe RPE. In this scenario, the dendrites would have a permanent contact(s) to each disk. However, the terminal end ofthe dendrites would probably be phagocytized continuously at the RPE.
4.6.1.3 Formation of the Outer Structure

The Photoreceptor Cell 4- 99
190Brown, P. Gibbons, I. & Wald, G. (1963) The visual cells and visual pigment of the mudpuppy (Necturus),J. Cell. Biol. vol. 19, pp 79-106
The formation of the outer segments cannot be easily understood from just the histological data. The process is toodynamic, both during initial formation and during the ensuing lifetime of the animal. However, combining this data withexperiments with nuclear tagged amino acids and nuclear tagged chromogens provides a very convincing story for theformation of the outer segments, both at the cytological and histological levels. The formation of the Outer Segment isbased on the fact that the photoreceptor cells are ectodermal, as shown above, and operate similarly to hair cells. Theirspecialization in Arthropoda and Mollusca appears designed to generate multiple shafts of protein from a single cell.In Chordata, it appears they are designed to convert the vibrissal shaft of protein into a series of discrete disks. Whatis not yet clear is whether this is accomplished using a series of individual secretory tubules to initially form a parallelseries of protein filaments before they are merged into the substrate of a disk.
Figure 4.6.1-1, from Dowling (1967) shows a mature photoreceptor cell from a squirrel at relatively low resolutionfor an electron-micrograph. While Dowling shows a structure surrounding the Outer Segment within and beyond thestaves of the Inner Segment clearly defined by the picture, neither structure is resolved adequately to demonstrate thatit is a plasma membrane (a bilayer membrane). It is clear from the figure that the Plasma membrane surrounding theInner Segment is not contiguous with the material surrounding the Outer Segment. The important details, which willbe demonstrated below, relating to the dynamic situation are:
+ the apparent emergence of the material forming the disks from a pocket or cup in the inner segment cell wall.+ the apparent folding of this material to form a continuous serpentine strip of material
+ the apparent transformation of this continuous strip into a series of double walled disks
+ the apparent fact that the outer segment material is extra-cellular with respect to the plasma membrane ofthe inner segment
It is not well accepted and could be considered controversial to describe the photoreceptor cell as operating at least inpart as an exocrine gland. However, this situation is:
+ quite compatible with a tissue related to nerve tissue, + the only explanation for the data showing the outer segment being formed from material provided by the inner segment+ the only logical explanation for the outer segment material congregating in the obviously crowded space of the cup formed by the calyx and staves of the inner segment.
In the above figure, the cell wall of the inner segment is seen to form a floor for the formation chamber and to extendup along the sides of the outer segment forming the calyx. Equally important, the cell wall folds back away from theouter segment to continue the wall of the calyx and become the outer wall of the inner segment itself. Brown, Gibbonsand Wald provided a caricature of this area of the photoreceptor cell which can be interpreted as showing the calyx ofthe inner segment reinforced by the staves but being entirely separate from the Outer Segment190. The jagged line alongthe outside of the outer segment is not contiguous with the cell wall associated with the inner segment and in fact doesnot appear continuous within the cup formed by the calyx. Its nature and function are not clear from these pictures. Thispicture is particularly useful since it slices through the OS/IS junction area in a plane that did not intersect with any ofthe nerve tissue associated with the Cilium. If the photoreceptor had been sliced through the Cilium area, theinterpretation of the structure would be more complex.
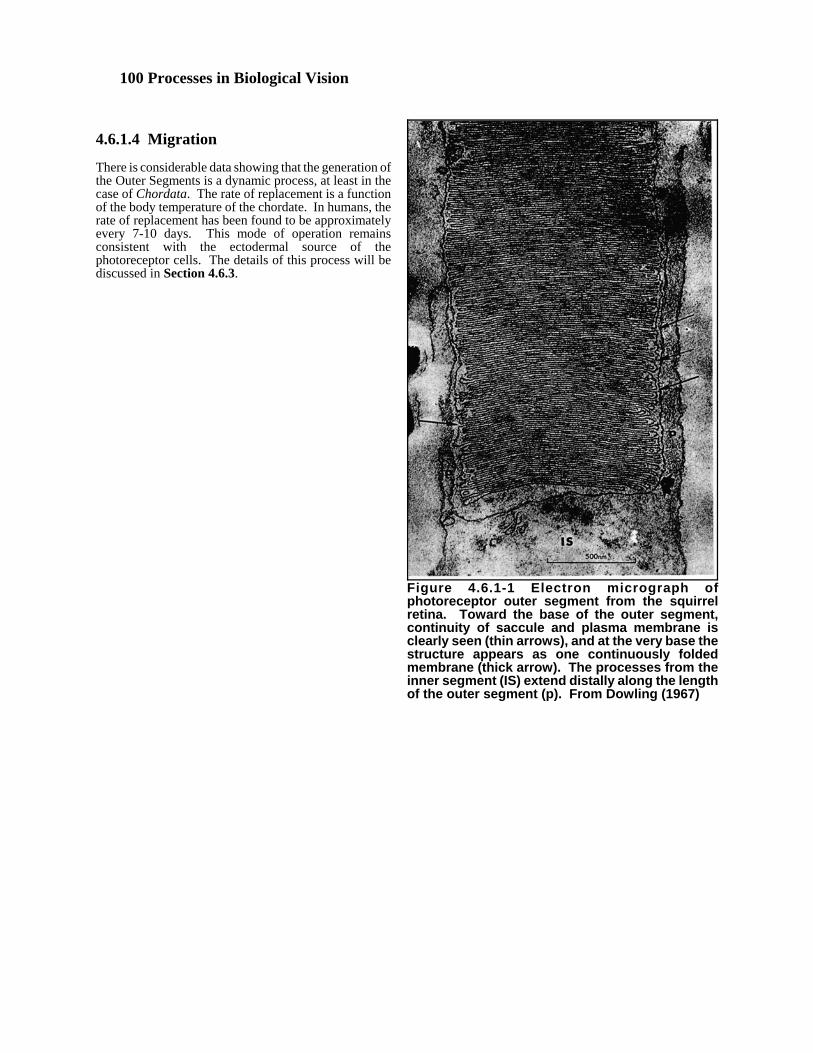
100 Processes in Biological Vision
Figure 4.6.1-1 Electron micrograph ofphotoreceptor outer segment from the squirrelretina. Toward the base of the outer segment,continuity of saccule and plasma membrane isclearly seen (thin arrows), and at the very base thestructure appears as one continuously foldedmembrane (thick arrow). The processes from theinner segment (IS) extend distally along the lengthof the outer segment (p). From Dowling (1967)
4.6.1.4 Migration
There is considerable data showing that the generation ofthe Outer Segments is a dynamic process, at least in thecase of Chordata. The rate of replacement is a functionof the body temperature of the chordate. In humans, therate of replacement has been found to be approximatelyevery 7-10 days. This mode of operation remainsconsistent with the ectodermal source of thephotoreceptor cells. The details of this process will bediscussed in Section 4.6.3.
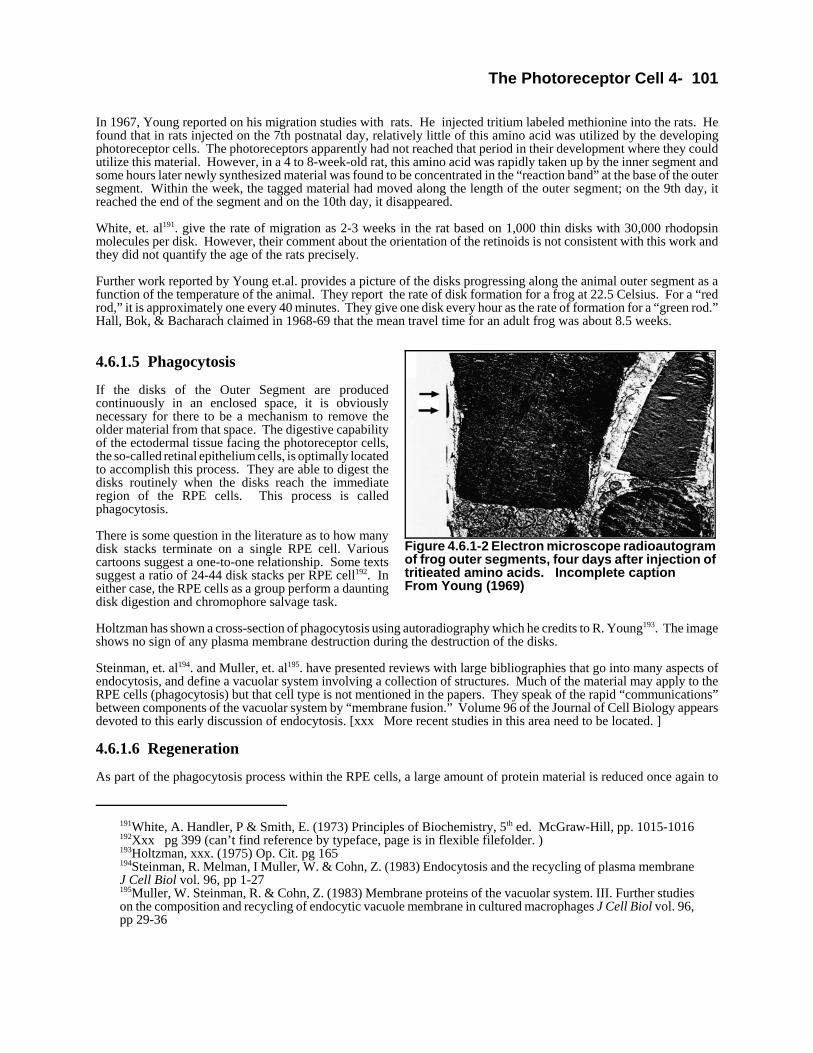
The Photoreceptor Cell 4- 101
191White, A. Handler, P & Smith, E. (1973) Principles of Biochemistry, 5th ed. McGraw-Hill, pp. 1015-1016192Xxx pg 399 (can’t find reference by typeface, page is in flexible filefolder. )193Holtzman, xxx. (1975) Op. Cit. pg 165194Steinman, R. Melman, I Muller, W. & Cohn, Z. (1983) Endocytosis and the recycling of plasma membraneJ Cell Biol vol. 96, pp 1-27195Muller, W. Steinman, R. & Cohn, Z. (1983) Membrane proteins of the vacuolar system. III. Further studieson the composition and recycling of endocytic vacuole membrane in cultured macrophages J Cell Biol vol. 96,pp 29-36
Figure 4.6.1-2 Electron microscope radioautogramof frog outer segments, four days after injection oftritieated amino acids. Incomplete caption From Young (1969)
In 1967, Young reported on his migration studies with rats. He injected tritium labeled methionine into the rats. Hefound that in rats injected on the 7th postnatal day, relatively little of this amino acid was utilized by the developingphotoreceptor cells. The photoreceptors apparently had not reached that period in their development where they couldutilize this material. However, in a 4 to 8-week-old rat, this amino acid was rapidly taken up by the inner segment andsome hours later newly synthesized material was found to be concentrated in the “reaction band” at the base of the outersegment. Within the week, the tagged material had moved along the length of the outer segment; on the 9th day, itreached the end of the segment and on the 10th day, it disappeared.
White, et. al191. give the rate of migration as 2-3 weeks in the rat based on 1,000 thin disks with 30,000 rhodopsinmolecules per disk. However, their comment about the orientation of the retinoids is not consistent with this work andthey did not quantify the age of the rats precisely.
Further work reported by Young et.al. provides a picture of the disks progressing along the animal outer segment as afunction of the temperature of the animal. They report the rate of disk formation for a frog at 22.5 Celsius. For a “redrod,” it is approximately one every 40 minutes. They give one disk every hour as the rate of formation for a “green rod.”Hall, Bok, & Bacharach claimed in 1968-69 that the mean travel time for an adult frog was about 8.5 weeks.
4.6.1.5 Phagocytosis
If the disks of the Outer Segment are producedcontinuously in an enclosed space, it is obviouslynecessary for there to be a mechanism to remove theolder material from that space. The digestive capabilityof the ectodermal tissue facing the photoreceptor cells,the so-called retinal epithelium cells, is optimally locatedto accomplish this process. They are able to digest thedisks routinely when the disks reach the immediateregion of the RPE cells. This process is calledphagocytosis.
There is some question in the literature as to how manydisk stacks terminate on a single RPE cell. Variouscartoons suggest a one-to-one relationship. Some textssuggest a ratio of 24-44 disk stacks per RPE cell192. Ineither case, the RPE cells as a group perform a dauntingdisk digestion and chromophore salvage task.
Holtzman has shown a cross-section of phagocytosis using autoradiography which he credits to R. Young193. The imageshows no sign of any plasma membrane destruction during the destruction of the disks.
Steinman, et. al194. and Muller, et. al195. have presented reviews with large bibliographies that go into many aspects ofendocytosis, and define a vacuolar system involving a collection of structures. Much of the material may apply to theRPE cells (phagocytosis) but that cell type is not mentioned in the papers. They speak of the rapid “communications”between components of the vacuolar system by “membrane fusion.” Volume 96 of the Journal of Cell Biology appearsdevoted to this early discussion of endocytosis. [xxx More recent studies in this area need to be located. ]
4.6.1.6 Regeneration
As part of the phagocytosis process within the RPE cells, a large amount of protein material is reduced once again to
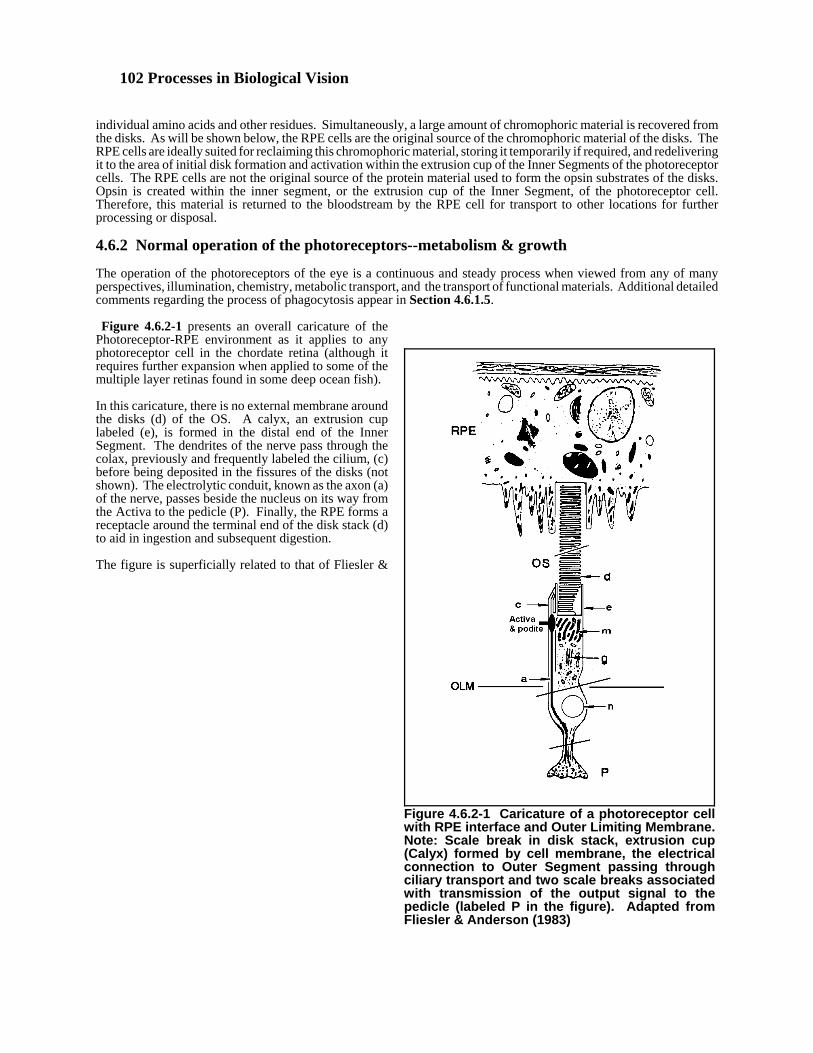
102 Processes in Biological Vision
Figure 4.6.2-1 Caricature of a photoreceptor cellwith RPE interface and Outer Limiting Membrane.Note: Scale break in disk stack, extrusion cup(Calyx) formed by cell membrane, the electricalconnection to Outer Segment passing throughciliary transport and two scale breaks associatedwith transmission of the output signal to thepedicle (labeled P in the figure). Adapted fromFliesler & Anderson (1983)
individual amino acids and other residues. Simultaneously, a large amount of chromophoric material is recovered fromthe disks. As will be shown below, the RPE cells are the original source of the chromophoric material of the disks. TheRPE cells are ideally suited for reclaiming this chromophoric material, storing it temporarily if required, and redeliveringit to the area of initial disk formation and activation within the extrusion cup of the Inner Segments of the photoreceptorcells. The RPE cells are not the original source of the protein material used to form the opsin substrates of the disks.Opsin is created within the inner segment, or the extrusion cup of the Inner Segment, of the photoreceptor cell.Therefore, this material is returned to the bloodstream by the RPE cell for transport to other locations for furtherprocessing or disposal.
4.6.2 Normal operation of the photoreceptors--metabolism & growth
The operation of the photoreceptors of the eye is a continuous and steady process when viewed from any of manyperspectives, illumination, chemistry, metabolic transport, and the transport of functional materials. Additional detailedcomments regarding the process of phagocytosis appear in Section 4.6.1.5.
Figure 4.6.2-1 presents an overall caricature of thePhotoreceptor-RPE environment as it applies to anyphotoreceptor cell in the chordate retina (although itrequires further expansion when applied to some of themultiple layer retinas found in some deep ocean fish).
In this caricature, there is no external membrane aroundthe disks (d) of the OS. A calyx, an extrusion cuplabeled (e), is formed in the distal end of the InnerSegment. The dendrites of the nerve pass through thecolax, previously and frequently labeled the cilium, (c)before being deposited in the fissures of the disks (notshown). The electrolytic conduit, known as the axon (a)of the nerve, passes beside the nucleus on its way fromthe Activa to the pedicle (P). Finally, the RPE forms areceptacle around the terminal end of the disk stack (d)to aid in ingestion and subsequent digestion.
The figure is superficially related to that of Fliesler &
The Photoreceptor Cell 4- 103
196 Fliesler, S. & Anderson. R. (1983) Prog. Lipid Res., 22, 79
197 Richardson, T. (1969) Cytoplasmic and ciliary connections between the inner and outer segments ofmammalian visual receptors. Vision Res. 9, 727-731 [V-A]198Hogan, M. & Alvarado, J. & Waddell, J. (1971) Histology of the human eye. Phila. PA: W. B. Saunderspgs. 393 & 403 & pp. 508-515
Anderson196 and shown in Ganguly. However, several differences are important. The area shown here as the extrusioncup is interpreted differently and there is no photoreceptor cell membrane enclosing the OS. In addition, the area fromthe cilium to the photoreceptor axon ending is rearranged and interpreted differently. Although not shown at this levelof detail, a feature described by Richardson197 appears relevant and interpretable. There appear to be apertures in thewall of the extrusion cup providing a hydraulic connection between the newly formed disks and the IPM.
Many of the following caricatures will not display the neural aspects of the photoreceptor since these aspects are notinvolved in the fluid and chemical dynamics of the ROS.
In several of the following schematics, the total blood flow to the retina is divided into the neural laminate portion andthe RPE laminate portion (the choro-vascular system). For orientation purposes, the total blood supply to the eye is givenby Hogan198 in the following statements:
The retinal rate of flow is estimated at 1.6 to 1.7 ml per mm per gm of the retina.
The mean retinal circulation time in man is 4.7 +/- 1.1 sec.
The mean transit time is 3 to 4 seconds.
He provides references for these statements. There is clearly a time constant associated with transient operation of theeye with a value on the order of 3-5 seconds. Hogan does not discuss the division of the blood flow between the twolaminates, concentrating primarily on the neural laminate, that is easy for the investigator to see.
4.6.2.1 Details of the OS
The OS consists of a stack of disks that are formed by extrusion from the exocrine gland portion of the photoreceptorinner segment. These disks are extracellular with respect to the IS. Although parts of the disk stack are surrounded bymembranes associated with the calyx or the RPE, they do not reside with the plasma membrane of the photoreceptor cell.The disks are in physical and electronic contact with each other and are immersed in a liquid medium defined as theinter-photoreceptor matrix (IPM). The disk stack is mechanically supported by the extrusion cup of the IS and thereceptacle cup of the RPE. This support is structurally quite adequate during almost all animal activity. However, thedisk stack is a fragile structure which can be damaged in human sports and accidents; resulting in a “separated or tornretina.” In fact, this structural weakness is used to advantage in the experimental laboratory where the retina is usuallyseparated from the RPE by shearing off all of the photoreceptors in the region of the disk stacks.
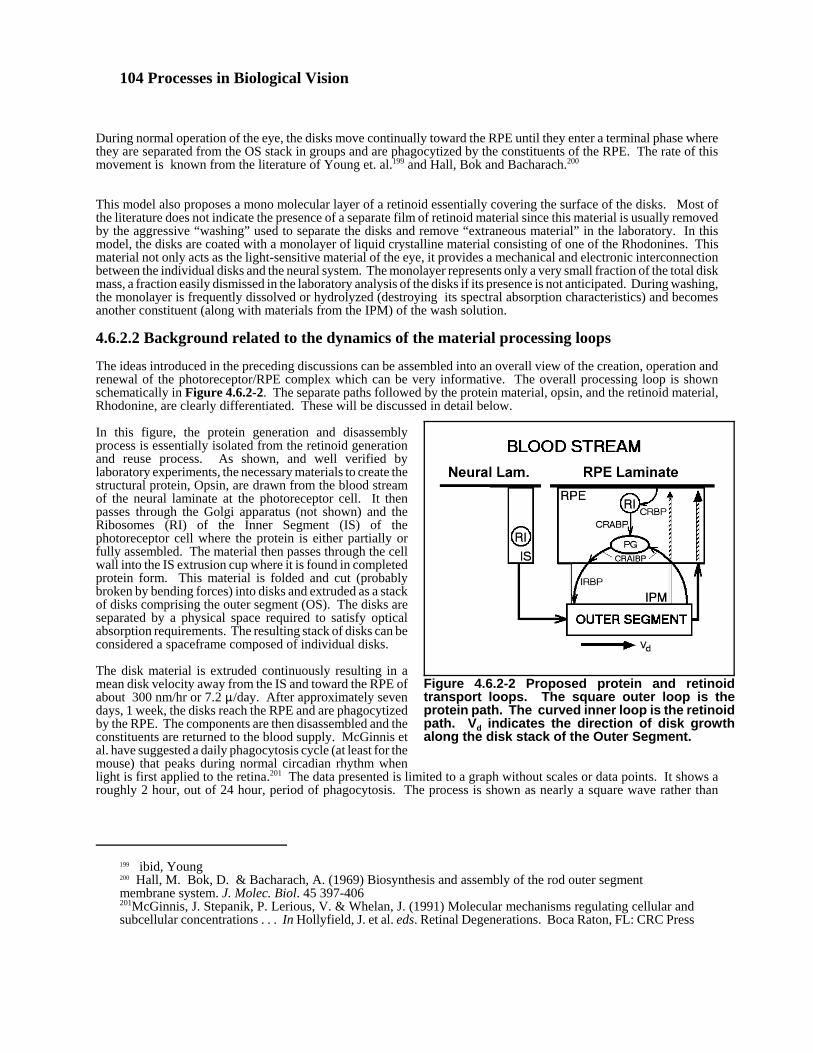
104 Processes in Biological Vision
199 ibid, Young200 Hall, M. Bok, D. & Bacharach, A. (1969) Biosynthesis and assembly of the rod outer segmentmembrane system. J. Molec. Biol. 45 397-406 201McGinnis, J. Stepanik, P. Lerious, V. & Whelan, J. (1991) Molecular mechanisms regulating cellular andsubcellular concentrations . . . In Hollyfield, J. et al. eds. Retinal Degenerations. Boca Raton, FL: CRC Press
Figure 4.6.2-2 Proposed protein and retinoidtransport loops. The square outer loop is theprotein path. The curved inner loop is the retinoidpath. Vd indicates the direction of disk growthalong the disk stack of the Outer Segment.
During normal operation of the eye, the disks move continually toward the RPE until they enter a terminal phase wherethey are separated from the OS stack in groups and are phagocytized by the constituents of the RPE. The rate of thismovement is known from the literature of Young et. al.199 and Hall, Bok and Bacharach.200
This model also proposes a mono molecular layer of a retinoid essentially covering the surface of the disks. Most ofthe literature does not indicate the presence of a separate film of retinoid material since this material is usually removedby the aggressive “washing” used to separate the disks and remove “extraneous material” in the laboratory. In thismodel, the disks are coated with a monolayer of liquid crystalline material consisting of one of the Rhodonines. Thismaterial not only acts as the light-sensitive material of the eye, it provides a mechanical and electronic interconnectionbetween the individual disks and the neural system. The monolayer represents only a very small fraction of the total diskmass, a fraction easily dismissed in the laboratory analysis of the disks if its presence is not anticipated. During washing,the monolayer is frequently dissolved or hydrolyzed (destroying its spectral absorption characteristics) and becomesanother constituent (along with materials from the IPM) of the wash solution.
4.6.2.2 Background related to the dynamics of the material processing loops
The ideas introduced in the preceding discussions can be assembled into an overall view of the creation, operation andrenewal of the photoreceptor/RPE complex which can be very informative. The overall processing loop is shownschematically in Figure 4.6.2-2. The separate paths followed by the protein material, opsin, and the retinoid material,Rhodonine, are clearly differentiated. These will be discussed in detail below.
In this figure, the protein generation and disassemblyprocess is essentially isolated from the retinoid generationand reuse process. As shown, and well verified bylaboratory experiments, the necessary materials to create thestructural protein, Opsin, are drawn from the blood streamof the neural laminate at the photoreceptor cell. It thenpasses through the Golgi apparatus (not shown) and theRibosomes (RI) of the Inner Segment (IS) of thephotoreceptor cell where the protein is either partially orfully assembled. The material then passes through the cellwall into the IS extrusion cup where it is found in completedprotein form. This material is folded and cut (probablybroken by bending forces) into disks and extruded as a stackof disks comprising the outer segment (OS). The disks areseparated by a physical space required to satisfy opticalabsorption requirements. The resulting stack of disks can beconsidered a spaceframe composed of individual disks.
The disk material is extruded continuously resulting in amean disk velocity away from the IS and toward the RPE ofabout 300 nm/hr or 7.2 :/day. After approximately sevendays, 1 week, the disks reach the RPE and are phagocytizedby the RPE. The components are then disassembled and theconstituents are returned to the blood supply. McGinnis etal. have suggested a daily phagocytosis cycle (at least for themouse) that peaks during normal circadian rhythm whenlight is first applied to the retina.201 The data presented is limited to a graph without scales or data points. It shows aroughly 2 hour, out of 24 hour, period of phagocytosis. The process is shown as nearly a square wave rather than
The Photoreceptor Cell 4- 105
202Whelan, J. & McGinnis, J. (1988) Light-dependent subcellular movement of photoreceptor proteins JNeurosci Res vol 20(2), pp 263–270,203 ibid, Ganguly, pg 156
Gaussian, etc. The graph appears to be based on an earlier paper202. However, the graph does not appear in that paper.The abstract of that paper asserts the unlikely and initiates another question, “The light-induced movements appear tobe initiated by the absorption of light by rhodopsin because red light, which does not bleach rhodopsin, does not producethis redistribution of photoreceptor proteins.” What happens in the outer segments of the other spectrally selectivephotoreceptors, including those that are sensitive to red light? Simultaneously, but separately, the chromophores of vision are prepared in the RPE cells. The retinoid material isdelivered to the RPE laminate by a serum-retinoid-transport-protein (SRBP) via the choro-vascular bloodstream. It isthen transported to the Ribosomes of the RPE cell for processing by the protein, CRBP. The material is then transportedto the pigment granules (PG) for temporary storage by the protein, CRABP. When required, the material is thentransported to the RPE/IPM interface by the protein, CRAIBP, where it is released to the protein, IRBP. IRBP thensupports the final transport of the chromophores to the disks of the Outer Segment. This process is discussed in detailin Sections 4.6.2.4 & 7.1.2.
It is likely that, after the protein material is shaped into strip form and before it exits the IS extrusion cup, it is exposedto the fluid environment known as the IPM (shown between the double barred lines) which is saturated with thechromophoric material attached to the binding (and transport) protein IRBP. The IRBP interacts with the proteinspaceframe and performs an initial coating of the protein. IRBP releases the chromophore and coats at least one surfaceof the protein with the chromophoric material. This material is deposited in a monolayer that forms a liquid crystal ofthe chromophore. The chromophoric material is probably held to the spaceframe opsin by very weak forces, typicallyVan der Waal forces or hydrogen bonds based on similar situations. As will be addressed completely in Chapter 5, theuse of a Schiff base in this situation to combine the chromophore and the protein substrate would destroy the electronicconfiguration of the chromophore necessary for its enhanced spectral performance. This initial coating is necessary toinsure the coating chromophore is the same chromophore (1 of 3 carried by the IRBP molecules in long wavelengthtrichromats) as earlier deposited for that particular photoreceptor. The chromophores are assumed to have sufficientstereo-specific properties to insure this chromatic purity in the resulting outer segment.
As the protein material is broken and formed into disks, the resulting spaceframe of protein material is still in the IPMbath and any ruptures in the initial chromophoric coating are repaired by additional deposition of chromophoricmolecules, building on the existing liquid crystal. The overall result is individual disks that are completely (or almostcompletely--only about 60% coverage is believed adequate in similar silver halide based photographic applications) withthe proper chromophore type for that particular photoreceptor. The liquid crystal even coats around the edge of theprotein disk so that the two sides are in electronic communications. The liquid crystal appears to follow the lip formedaround the edge of the disk due to a limited ability of opsin to curve around a corner. This lip effectively acts as a spacerbetween the faces of adjacent disks.
This liquid crystal material, a gel, may act as a glue and aid in holding the disks in position within the OS after extrusionis completed.
The liquid crystalline material is now in the proper condition to exhibit the necessary enhanced photo absorptionproperties and be raised to an excited state by the absorption of energy from the photons. If in close proximity toappropriate neural tissue, it can transfer that energy to the neural network. As developed in Appendix A, this cycle ofexcitation and de-excitation, described by the Photoexcitation/De-excitation Equation, occurs continuously throughoutthe life of the disk at rates measured in microseconds to milliseconds depending on the capability of the neural systemto absorb the energy.
As the disks of the outer segment pass into the receptacle of the RPE, they leave the saturated solution environment ofthe IPM and enter an environment which is conducive to the solvation of the liquid crystal. The chromophoric materialmay be treated as a particle and participate in the process of phagocytosis or it may be treated as a solute and beabsorbed through the wall of the RPE cells. In either case, the material is bound to the binding protein CRAIBP andtransported back to one of the pigment granules appropriate for that chromophore. This same binding protein is alsoresponsible for transporting the chromophores to the RPE cell boundary for acquisition by the IRBP, thus completingthe “loop” for the retinoid materials. Ganguly203 says it in another way, “The retinol, whether it enters the RPE cells fromthe blood plasma or whether it comes from the retina . . . , is esterfied in the RPE cells.” It is proposed that retinol shouldbe broadened to retinoids in the above statements, and probably changed to refer to the Rhodonines.
106 Processes in Biological Vision
It is possible that some of the chromophoric material is damaged during its existence on a disk. If this happens, theCRAIBP will not be able to bind to it; it will be excreted back into the blood supply. To account for this loss, themanufacturing facilities of the RPE cell are able to produce new chromophoric material by extracting all trans-retinolfrom the blood stream and processing it into the Rhodonines that are the actual chromophoric materials. The retinol istransported to the manufacturing area by CRBP which is specific for all trans-retinoid material. After manufacture andbefore use, chromophoric material is transported to the pigment granules by CRABP which is believed to be capableof binding to the “conjugated retinoid acid” although this is yet to be demonstrated in the literature. Alternately,CRAIBP could also perform this function. However, it appears that CRAIBP is specifically designed to attach to onlyone end of the chromophore so that it can perform a handshaking operation with both the palmitic (stearic) acid foundin the pigment granules and the IRBP at the cell boundary. See Section 4.6.2.3.3.
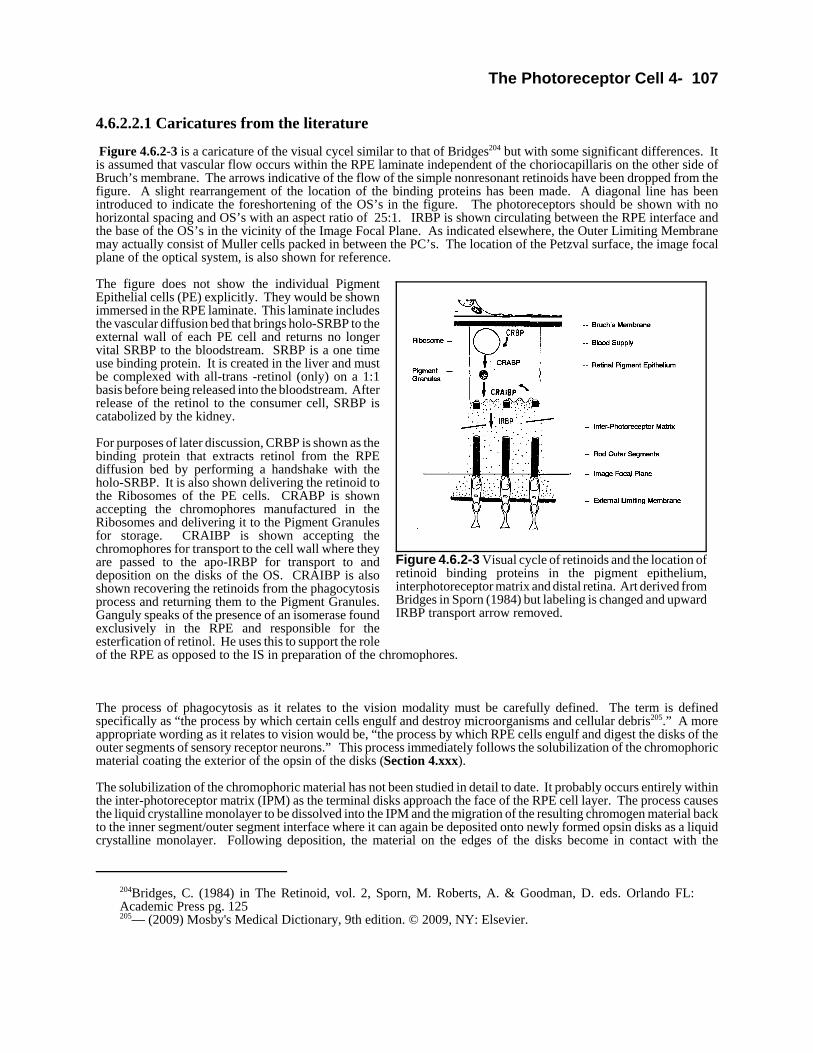
The Photoreceptor Cell 4- 107
204Bridges, C. (1984) in The Retinoid, vol. 2, Sporn, M. Roberts, A. & Goodman, D. eds. Orlando FL:Academic Press pg. 125205— (2009) Mosby's Medical Dictionary, 9th edition. © 2009, NY: Elsevier.
Figure 4.6.2-3 Visual cycle of retinoids and the location ofretinoid binding proteins in the pigment epithelium,interphotoreceptor matrix and distal retina. Art derived fromBridges in Sporn (1984) but labeling is changed and upwardIRBP transport arrow removed.
4.6.2.2.1 Caricatures from the literature
Figure 4.6.2-3 is a caricature of the visual cycel similar to that of Bridges204 but with some significant differences. Itis assumed that vascular flow occurs within the RPE laminate independent of the choriocapillaris on the other side ofBruch’s membrane. The arrows indicative of the flow of the simple nonresonant retinoids have been dropped from thefigure. A slight rearrangement of the location of the binding proteins has been made. A diagonal line has beenintroduced to indicate the foreshortening of the OS’s in the figure. The photoreceptors should be shown with nohorizontal spacing and OS’s with an aspect ratio of 25:1. IRBP is shown circulating between the RPE interface andthe base of the OS’s in the vicinity of the Image Focal Plane. As indicated elsewhere, the Outer Limiting Membranemay actually consist of Muller cells packed in between the PC’s. The location of the Petzval surface, the image focalplane of the optical system, is also shown for reference.
The figure does not show the individual PigmentEpithelial cells (PE) explicitly. They would be shownimmersed in the RPE laminate. This laminate includesthe vascular diffusion bed that brings holo-SRBP to theexternal wall of each PE cell and returns no longervital SRBP to the bloodstream. SRBP is a one timeuse binding protein. It is created in the liver and mustbe complexed with all-trans -retinol (only) on a 1:1basis before being released into the bloodstream. Afterrelease of the retinol to the consumer cell, SRBP iscatabolized by the kidney.
For purposes of later discussion, CRBP is shown as thebinding protein that extracts retinol from the RPEdiffusion bed by performing a handshake with theholo-SRBP. It is also shown delivering the retinoid tothe Ribosomes of the PE cells. CRABP is shownaccepting the chromophores manufactured in theRibosomes and delivering it to the Pigment Granulesfor storage. CRAIBP is shown accepting thechromophores for transport to the cell wall where theyare passed to the apo-IRBP for transport to anddeposition on the disks of the OS. CRAIBP is alsoshown recovering the retinoids from the phagocytosisprocess and returning them to the Pigment Granules.Ganguly speaks of the presence of an isomerase foundexclusively in the RPE and responsible for theesterfication of retinol. He uses this to support the roleof the RPE as opposed to the IS in preparation of the chromophores.
The process of phagocytosis as it relates to the vision modality must be carefully defined. The term is definedspecifically as “the process by which certain cells engulf and destroy microorganisms and cellular debris205.” A moreappropriate wording as it relates to vision would be, “the process by which RPE cells engulf and digest the disks of theouter segments of sensory receptor neurons.” This process immediately follows the solubilization of the chromophoricmaterial coating the exterior of the opsin of the disks (Section 4.xxx).
The solubilization of the chromophoric material has not been studied in detail to date. It probably occurs entirely withinthe inter-photoreceptor matrix (IPM) as the terminal disks approach the face of the RPE cell layer. The process causesthe liquid crystalline monolayer to be dissolved into the IPM and the migration of the resulting chromogen material backto the inner segment/outer segment interface where it can again be deposited onto newly formed opsin disks as a liquidcrystalline monolayer. Following deposition, the material on the edges of the disks become in contact with the
108 Processes in Biological Vision
microtubules of the neural portion of the sensory receptor neurons in order to stimulate the neural system when thechromophores are stimulated by light of appropriate wavelength. The denuded disks are now subject to phagocytosis(from the Greek; phagein + kytos + osis: one that eats + cells+condition. The term phage is most frequently used as asuffix, -phage, rather than as a prefix as here. The term bacteriophage originated in the microbiology of bacteria wherea virus was found to enter the bacteria and consume critical parts, sometimes replacing the DNA of the bacteria with acopy of its own DNA.
The process of phagocytosis as accomplished by the RPE is usually described as involving five steps;
(1) invagination, (2) engulfment, (3) internalization and formation of the phagocyte vacuole, (4) fusing of lysosomes to digest the phagocytosed material, (5) release of digested microbial products, and(0) the return of the RPE cell to its functionally ready state to repeat the process.
These steps are illustrated in Figure 4.6.2-4. This is a recent caricature of the phagocytosis of a disk expanded to suggestthe process of solubilizing the chromophores coating the individual disk before the start of formal endocytosis by theRPE. [xxx be sure figure is edited to show solubilization. The terminology of Monahan et al. varies slightly from theabove listing. [Xxx Change bacteria label to disk and change hairs to the chromophore layer before the disks enter theRPE Add notation]
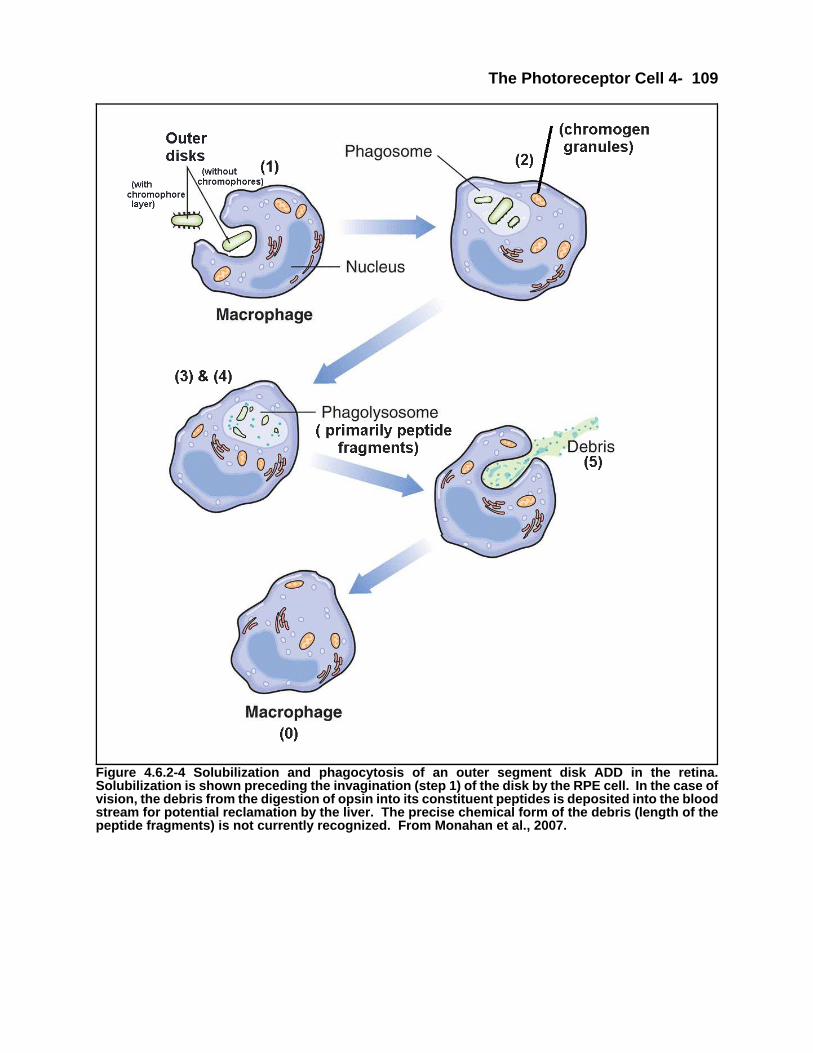
The Photoreceptor Cell 4- 109
Figure 4.6.2-4 Solubilization and phagocytosis of an outer segment disk ADD in the retina.Solubilization is shown preceding the invagination (step 1) of the disk by the RPE cell. In the case ofvision, the debris from the digestion of opsin into its constituent peptides is deposited into the bloodstream for potential reclamation by the liver. The precise chemical form of the debris (length of thepeptide fragments) is not currently recognized. From Monahan et al., 2007.
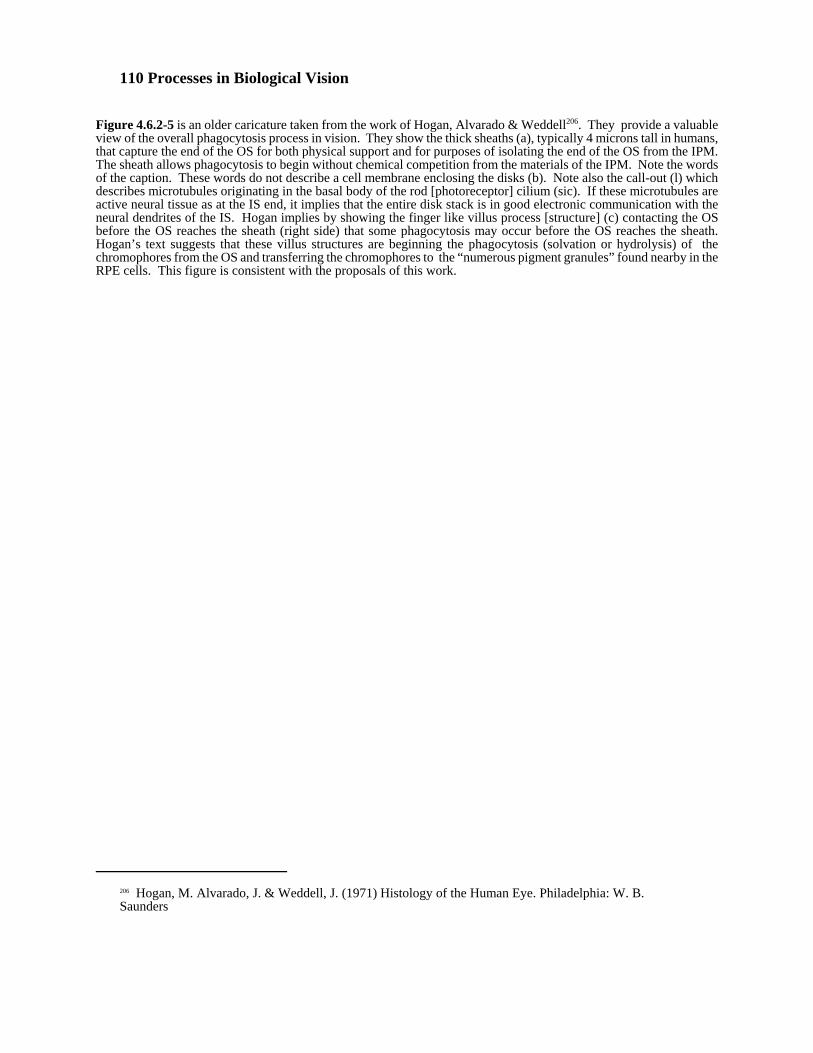
110 Processes in Biological Vision
206 Hogan, M. Alvarado, J. & Weddell, J. (1971) Histology of the Human Eye. Philadelphia: W. B.Saunders
Figure 4.6.2-5 is an older caricature taken from the work of Hogan, Alvarado & Weddell206. They provide a valuableview of the overall phagocytosis process in vision. They show the thick sheaths (a), typically 4 microns tall in humans,that capture the end of the OS for both physical support and for purposes of isolating the end of the OS from the IPM.The sheath allows phagocytosis to begin without chemical competition from the materials of the IPM. Note the wordsof the caption. These words do not describe a cell membrane enclosing the disks (b). Note also the call-out (l) whichdescribes microtubules originating in the basal body of the rod [photoreceptor] cilium (sic). If these microtubules areactive neural tissue as at the IS end, it implies that the entire disk stack is in good electronic communication with theneural dendrites of the IS. Hogan implies by showing the finger like villus process [structure] (c) contacting the OSbefore the OS reaches the sheath (right side) that some phagocytosis may occur before the OS reaches the sheath.Hogan’s text suggests that these villus structures are beginning the phagocytosis (solvation or hydrolysis) of thechromophores from the OS and transferring the chromophores to the “numerous pigment granules” found nearby in theRPE cells. This figure is consistent with the proposals of this work.
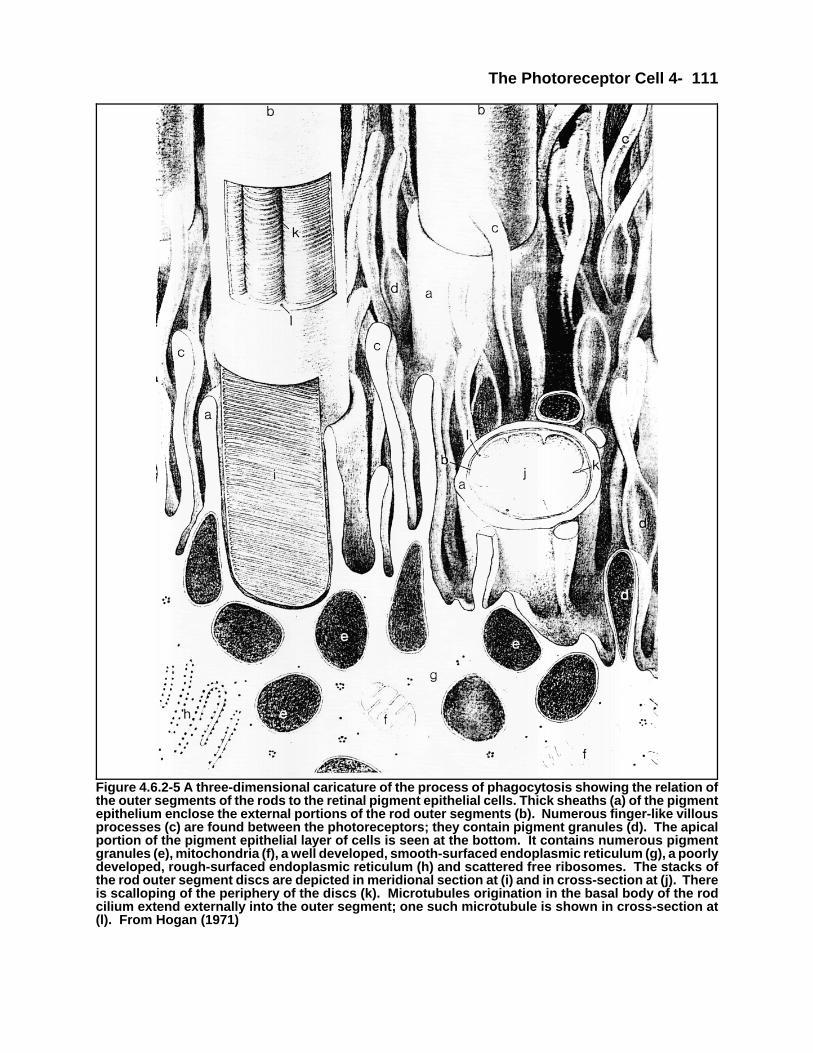
The Photoreceptor Cell 4- 111
Figure 4.6.2-5 A three-dimensional caricature of the process of phagocytosis showing the relation ofthe outer segments of the rods to the retinal pigment epithelial cells. Thick sheaths (a) of the pigmentepithelium enclose the external portions of the rod outer segments (b). Numerous finger-like villousprocesses (c) are found between the photoreceptors; they contain pigment granules (d). The apicalportion of the pigment epithelial layer of cells is seen at the bottom. It contains numerous pigmentgranules (e), mitochondria (f), a well developed, smooth-surfaced endoplasmic reticulum (g), a poorlydeveloped, rough-surfaced endoplasmic reticulum (h) and scattered free ribosomes. The stacks ofthe rod outer segment discs are depicted in meridional section at (i) and in cross-section at (j). Thereis scalloping of the periphery of the discs (k). Microtubules origination in the basal body of the rodcilium extend externally into the outer segment; one such microtubule is shown in cross-section at(l). From Hogan (1971)
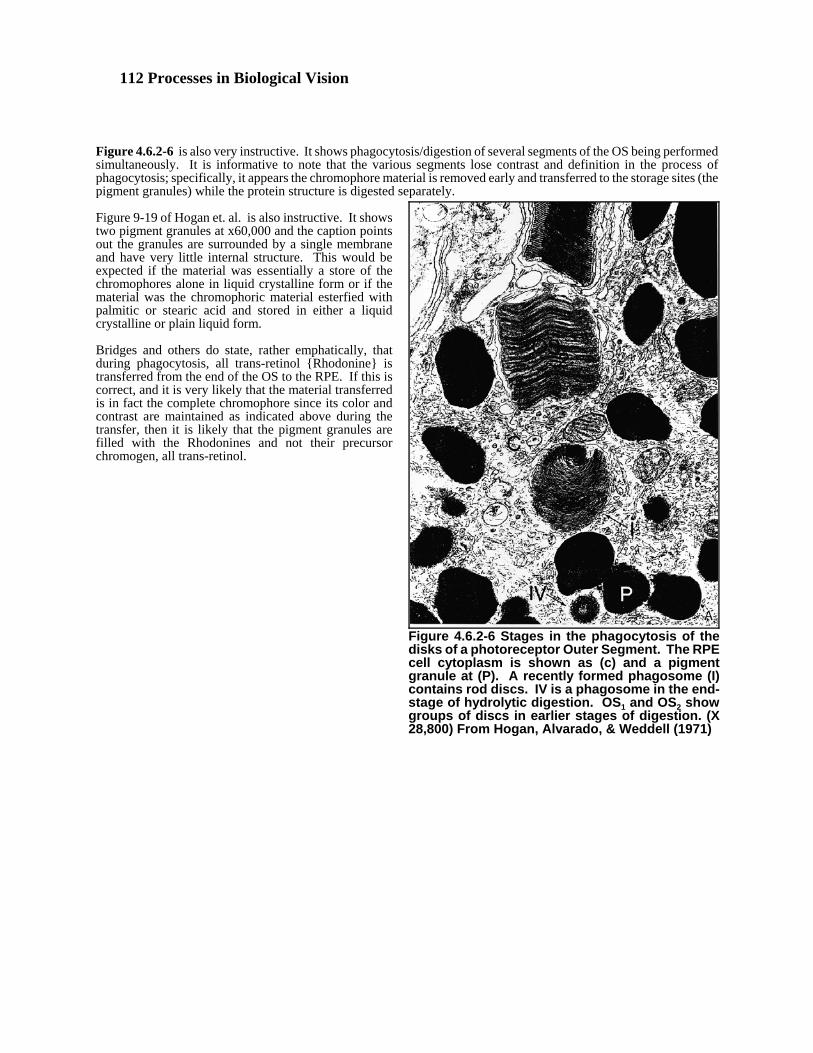
112 Processes in Biological Vision
Figure 4.6.2-6 Stages in the phagocytosis of thedisks of a photoreceptor Outer Segment. The RPEcell cytoplasm is shown as (c) and a pigmentgranule at (P). A recently formed phagosome (I)contains rod discs. IV is a phagosome in the end-stage of hydrolytic digestion. OS1 and OS2 showgroups of discs in earlier stages of digestion. (X28,800) From Hogan, Alvarado, & Weddell (1971)
Figure 4.6.2-6 is also very instructive. It shows phagocytosis/digestion of several segments of the OS being performedsimultaneously. It is informative to note that the various segments lose contrast and definition in the process ofphagocytosis; specifically, it appears the chromophore material is removed early and transferred to the storage sites (thepigment granules) while the protein structure is digested separately.
Figure 9-19 of Hogan et. al. is also instructive. It showstwo pigment granules at x60,000 and the caption pointsout the granules are surrounded by a single membraneand have very little internal structure. This would beexpected if the material was essentially a store of thechromophores alone in liquid crystalline form or if thematerial was the chromophoric material esterfied withpalmitic or stearic acid and stored in either a liquidcrystalline or plain liquid form.
Bridges and others do state, rather emphatically, thatduring phagocytosis, all trans-retinol {Rhodonine} istransferred from the end of the OS to the RPE. If this iscorrect, and it is very likely that the material transferredis in fact the complete chromophore since its color andcontrast are maintained as indicated above during thetransfer, then it is likely that the pigment granules arefilled with the Rhodonines and not their precursorchromogen, all trans-retinol.
The Photoreceptor Cell 4- 113
207 Fong, S. Liou, G Landers R. Alvarez, R. & Bridges, C. (1984) Purification and characterization of aretinol-binding glycoprotein synthesized and secreted by bovine neural retina J. Biol. Chem. 259, 6534
It is also clear that an all-trans form of a retinoid is transported by the Interstitial Retinol-Binding Protein (IRBP) fromthe RPE to the vicinity of the newly formed OS disks. IRBP is found only in the eye--and only within the IPM of theeye. It is believed to only transport the all-trans form of retinoids. Fong et. al.207 have provided two data points. Theyhave determined that IRBP binds with 2.2 molecules of all trans-retinol {Rhodonine}--apparently measured on darkadapted eyes. In the light-exposed eyes, the value was only 0.6 molecules of retinoid per molecule of IRBP. It is notclear how these data points should be interpreted since light exposure should not have a major affect on the IRBPtransport rate.
4.6.2.2.2 Unique chemistry of the retinoids of vision
Retinol is easily converted into retinoic acid; a structure with a functional end group containing a single atom of carbonassociated with an oxygen atom through a double bond (a carbonyl group)and an OH group through a single bond (ahydroxyl group). Thus, the overall molecule has many properties of both an alcohol and an aldehyde. In a simple esterof retinoic acid, the functional end group contains a single atom of carbon associated with an oxygen atom through adouble bond (a carbonyl group)and an OR’ group through a single bond.
The resonant retinoids proposed as the chromophores in this model contain a carboxyl ion system. This system separatesthe hydroxyl group and the aldehyde group associated with a single carbon in an organic acid. As a result, theRhodonines exhibit the properties of both an alcohol and an aldehyde simultaneously; however, the two ligands areassociated with different carbon atoms at the ends of a resonant conjugated chain. The Rhodonines can also mimicmany of the properties of retinoic acid. These features of the Rhodonines can lead to a great deal of confusion in thelaboratory environment if they are not anticipated.
114 Processes in Biological Vision
208 ibid, Ganguly, pg 153 & 156209Wolken, J. (1966) Vision. Springfield, Il: Charles C. Thomas pp 70-73210Marmor, M. (1959) xxx Surv. Ophthalmol. Vol. 4, pp 279-285211www.columbia.edu/cu/chemistry/groups/nakanishi/vision/Slide1.GIF (case sensitive address)212Ben-Shabat, S et. al. (2001) Fluorescent pigments of the retinal pigment epithelium and age-related maculardegeneration Bioorg Med Chem Lett vol 11, pp 1533-1540213Sakai, N. et. al. (1996) Ocular age pigment “A2-E”: an unprecedented pyridinium bisretinoid J Am ChemSoc vol 18, pp 1559-1560
4.6.2.2.3 Material concentrations in the OS/RPE environment
There are a variety of percentages given in the literature for the amount of opsin, chromophore, rhodopsin and othermaterials related to vision present in the various areas of the eye. Currently, the numbers do not paint a coherent andexplicit scenario of the location of all the retinoids in the eye. In general, there has been a lack of specificity with regardto the exact compound and the exact location of the material within the photoreceptor/RPE complex being discussed. Ganguly208 says “The photoreceptor cells contain about 4% of the total vitamin A of the eye . . . ” and “Excluding theretinoids present in the rhodopsin in the retina, this amount (in the RPE) represents about 87% of the total retinoids inthe eye.” It is not clear whether he includes the retinoids of the Outer Segments in his photoreceptor cells or treats themseparately. If he treats them separately, the remaining 13% of the retinoids would presumably be found in the IPM. These values indicate the ratio of retinoids in the RPE to retinoids in the OS is either about 5:1 or 20:1. He goes onto quote Bridges as “the RPE from a pair of human eyes contains on average 4.5 :g of retinol and retinyl esters. Mostof the vitamin A found in the RPE is in the form of retinyl esters and the major esters are palmitate and stearate . . . Inthe humans, the ratio of palmitate to stearate is about 5:1 . . . in human RPE cells the retinyl palmitate is present in theforms of both all-trans and 11-cis isomers.”
Based on the model of this work and the experimental results in the literature, the chromophores of vision are notprocessed within the photoreceptor cells. They are processed within the RPE cells. This situation does not support theputative description of rhodopsin as a molecule containing both opsin and retinol (buried deep within the structure ofthe protein) that is formed within the photoreceptor cell. Although this configuration was commonly shown in caricaturein the literature of the 1970s and 1980s, the work of Bridges & Yoshikami show it must be abandoned.
In the description of the retinoid processing loop presented here and the numbers in the literature, the reserves of thechromophores are so high in the RPE that the RI is only required to acquire small amounts of all trans-retinoid per dayand process it into Rhodonines. This makes radiographic confirmation of this process awkward. However, it has beenaccomplished by Bridges & Yoshikami (See Section 4.6.2.3.3). Wald employed a simpler approach based on restrictedmetabolism (under starvation conditions) to obtain useful data. It will be discussed below.
The manner in which the chromogens are stored in the RPE is well documented by Figure 4.6.2-7. There are threeclearly delineated types of globules of chromogenic if not actually chromophoric material visible in this image fromWolken209. No globule representing the L–chromophore appears in this figure. There was no discussion of the specificcolors in the original figure. It is suggested that the red globules are actually more magenta and the yellow globulescontained more green than portrayed here. The observed color of these globules is the complement of their absorptionspectra. The globules marked UV– were colorless in the original microphotograph. No dimensions were provided forthis image. Marmor has provided a similar color picture of the RPE210. More recently, Nakanishi has described the atleast one of these chromogenic globules within the RPE as the fluorescent pigment lipofuscin211. His slide was basedon two references212,213. Sakai, et. al. define a chemical structure of a material that Nakanishi associates with one of thecolored globules in the RPE. Sakai, et. al. describe the material in the title to the paper as “an unprecedented pyridiniumbisretinoid.” The chemical structure of the material appears incomplete. The material as described is almost certainlytransparent at visible wavelengths.

The Photoreceptor Cell 4- 115
214Eldred, G. & Katz, M. (1988) xxx Exp Eye Res vol 47, pp 71-86
Figure 4.6.2-7 Color picture of chromophoric globules stored in the RPE of the swamp turtle,Pseudemys scripta elegans. No scale provided. Globules indicative of three separate chromophoresare noted. Their recorded color is the complement of their peak absorption. Globules of UV–chromogens would appear transparent using normal photography and as observed with a microscope.Few color pictures of the RPE are available in the literature. From Wolken 1966.
Wolken also provided a micrograph of a chicken retina showing globules located between the outer and inner segmentsof photoreceptor cells. There are individual globules associated with individual photoreceptors. The color of a globuleis suggestive of the specific (complimentary) absorption spectrum of that photoreceptor. A scale was provided for thatpicture and the globules appear to approximate the diameter of the outer segments, about three microns. This workwould suggest that the globules photographed in the extrusion cup area were a result of in-vitro processing. In-vivo, thematerial would be expected to be in solution until deposited in ultra thin layers on the opsin substrates. These layerswould not be observable individually by the techniques available to Wolken.
Eldred & Katz214 provided a paper showing the maximum spectral sensitivity of a variety of micelles within RPE cells.Lacking a satisfactory model of the visual modality, they assert, “Aged human RPE cells are densely packed withlipofuscin granules, and physical crowding and/or influences on metabolite fluxes may alter the normal physiologicalfunctions of these cells.” Based on the model of this work, a majority of these micelles are temporary stores of thechromogens of vision before they are dispersed into the IPM for the coating of individual disks of outer segments of thesensory neurons. They are generally spherical micelles; this structural arrangement does not support the peakabsorbance expected of flat sheets of liquid crystalline chromophores as present in functional OS. In this role, the RPEshould be expected to exhibit a variety of micelles as shown by Wolken, regardless of the age of the subject. Eldred &
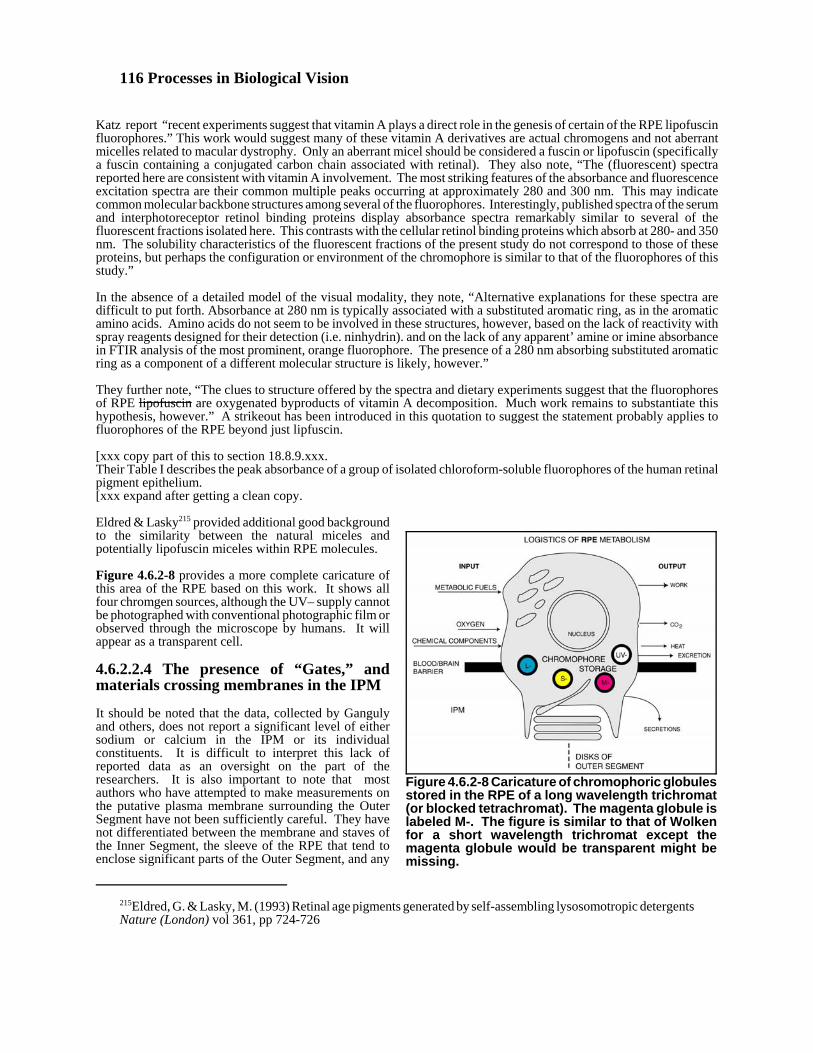
116 Processes in Biological Vision
215Eldred, G. & Lasky, M. (1993) Retinal age pigments generated by self-assembling lysosomotropic detergentsNature (London) vol 361, pp 724-726
Figure 4.6.2-8 Caricature of chromophoric globulesstored in the RPE of a long wavelength trichromat(or blocked tetrachromat). The magenta globule islabeled M-. The figure is similar to that of Wolkenfor a short wavelength trichromat except themagenta globule would be transparent might bemissing.
Katz report “recent experiments suggest that vitamin A plays a direct role in the genesis of certain of the RPE lipofuscinfluorophores.” This work would suggest many of these vitamin A derivatives are actual chromogens and not aberrantmicelles related to macular dystrophy. Only an aberrant micel should be considered a fuscin or lipofuscin (specificallya fuscin containing a conjugated carbon chain associated with retinal). They also note, “The (fluorescent) spectrareported here are consistent with vitamin A involvement. The most striking features of the absorbance and fluorescenceexcitation spectra are their common multiple peaks occurring at approximately 280 and 300 nm. This may indicatecommon molecular backbone structures among several of the fluorophores. Interestingly, published spectra of the serumand interphotoreceptor retinol binding proteins display absorbance spectra remarkably similar to several of thefluorescent fractions isolated here. This contrasts with the cellular retinol binding proteins which absorb at 280- and 350nm. The solubility characteristics of the fluorescent fractions of the present study do not correspond to those of theseproteins, but perhaps the configuration or environment of the chromophore is similar to that of the fluorophores of thisstudy.”
In the absence of a detailed model of the visual modality, they note, “Alternative explanations for these spectra aredifficult to put forth. Absorbance at 280 nm is typically associated with a substituted aromatic ring, as in the aromaticamino acids. Amino acids do not seem to be involved in these structures, however, based on the lack of reactivity withspray reagents designed for their detection (i.e. ninhydrin). and on the lack of any apparent’ amine or imine absorbancein FTIR analysis of the most prominent, orange fluorophore. The presence of a 280 nm absorbing substituted aromaticring as a component of a different molecular structure is likely, however.”
They further note, “The clues to structure offered by the spectra and dietary experiments suggest that the fluorophoresof RPE lipofuscin are oxygenated byproducts of vitamin A decomposition. Much work remains to substantiate thishypothesis, however.” A strikeout has been introduced in this quotation to suggest the statement probably applies tofluorophores of the RPE beyond just lipfuscin.
[xxx copy part of this to section 18.8.9.xxx.Their Table I describes the peak absorbance of a group of isolated chloroform-soluble fluorophores of the human retinalpigment epithelium. [xxx expand after getting a clean copy.
Eldred & Lasky215 provided additional good backgroundto the similarity between the natural miceles andpotentially lipofuscin miceles within RPE molecules.
Figure 4.6.2-8 provides a more complete caricature ofthis area of the RPE based on this work. It shows allfour chromgen sources, although the UV– supply cannotbe photographed with conventional photographic film orobserved through the microscope by humans. It willappear as a transparent cell.
4.6.2.2.4 The presence of “Gates,” andmaterials crossing membranes in the IPM
It should be noted that the data, collected by Gangulyand others, does not report a significant level of eithersodium or calcium in the IPM or its individualconstituents. It is difficult to interpret this lack ofreported data as an oversight on the part of theresearchers. It is also important to note that mostauthors who have attempted to make measurements onthe putative plasma membrane surrounding the OuterSegment have not been sufficiently careful. They havenot differentiated between the membrane and staves ofthe Inner Segment, the sleeve of the RPE that tend toenclose significant parts of the Outer Segment, and any

The Photoreceptor Cell 4- 117
216Yau, K-W. (1994) Phototransduction mechanism in retinal rods and cones. Invest. Ophthal. Vis Res. vol. 35,no. 1, pp 9-32217Yau, K-W. Raynes, L. & Nakatani, K. (1987) Study of the roles of calcium and cyclic GMP in visualtransduction. Neurosciences Res. Suppl 6, pp S45-S54218Fesenko, E. Kolesnikov, S. & Lyubarsky, A. (1985) Conductance in plasma membrane of retinal rod outersegment. Nature, vol. 313, pp 310-313219Yau, K-W. & Baylor, D. (1989) Cyclic GMP-activated conductance of retinal photoreceptor cells, Ann. Rev.Neurosci. Vol. 12, pp 289-327220Molday, R. & Molday, L. (1998) Molecular properties of the cGMP-gated channel of rod photoreceptors.Vision Res. vol. 38, pp 1315-1323221Zagotta, W. & Siegelbaum, S. (1996) Structure and function of cyclic nucleotide-gated channels. Ann. Rev.Neurosci. vol 19, pp 235-263222Kaupp, U. et. al. (1989) Primary structure and functional expression from complementary DNA of the rodphotoreceptor cyclic GMP-gated channel. Nature, vol. 342, pp762-766
putative plasma membrane surrounding only the disks. In the absence of significant quantities of calcium and/orpotassium in the IPM and the absence of any documented proof of a plasma (bilayer) membrane surrounding the diskstacks of the Outer Segment, it is difficult to give any credence to the various “gate” models of the photo-transductionprocess.
There have been two schools attempting to explain the change in potential of the axoplasm based on the assumption thatthe change is due to the physical conductance of particles through a membrane. One school has assumed the principleparticles were Ca2+ ions Minke has led this effort and presented a large number of papers over the years. Yau has beenthe main proponent of the cGMP gate model216. In this model, cGMP is the particle moving through the membrane andinterpreted as causing a change in electrical conductance. Yau, et. al217. made an interesting comment in 1987. Theysaid: “The two ideas are not necessarily mutually exclusive.” This statement could have been broadened to say, thesetwo ideas, accounting for the change in axoplasm potential, are neither mutually exclusive or exclusive of other ideas.In fact, this work shows that there is no change in membrane conductance due to ion transport. The change is entirelyaccounted for by electron transport by an entirely different mechanism, transconductance, at related to an Activa. Thefollowing paragraphs are presented in the interest of completeness.
An early paper by Fesenko, et. al. has been relied upon by later authors discussing cGMP gates218. That paper illustratesthe difficulty they encountered in obtaining the expected (desired) results. Out of a larger sample, they “obtained 136patches of material stable enough to allow changing of fluids on one side of the material. Of these, only 70 respondedto the application of cyclic GMP by an increase in conductance, while the current fluctuated in a random manner withoutany recognizable steps which could represent single-channel activity.”
As Yau notes in his comprehensive paper of 1994, there are still a variety of conflicts within individual gate models andbetween different gate models. The paper contains a large number of putative relationships, develops a number ofreversals in position with time, and continues to rely upon the existence of an undefined “Na+-Ca2+ exchanger”(apparently the still mythical ion pump of Hodgkin and Huxley). He also looks forward to the day the work in the gatefield will transition from its current conceptual level “to describe the entire phototransduction process in a quantitativeway.” In the meantime, his figure 12 continues to contain a number of question marks. These same question marksappeared in his paper of five years earlier, along with a similar list of unanswered questions about the proposal219.
His figure 14, reproduced from Lam, shows two distinctly different responses to a “single photon” by amphibian rodsand cones. He does not define the state of adaptation of the cells involved. The responses appear to be two samples ofa continuous response that is a function of the excitation state within the chromophores of vision exactly as predictedby the P/D Equation of this work. While addressing the previously held view that mammalian rods did not adapt to lightlevel, Yau concluded on page 22 that: “counter to previous belief, mammalian rods indeed adapt to light much like, forexample, amphibian rods.”
Molday & Molday have recently provided their description of the cGMP gated channel220.
It is important to note the separation between the terminology used in genetics and that used in physiology. Because ofthe order of research in reverse genetics, variants of the terms from physiology are frequently used in genetics. In thiscase, cGMP is defined as a protein that contained 690 amino acids and was first isolated in bovine221. Kaupp, et. al. firstisolated a cDNA clone for a subunit of the bovine gene associated with the putative rod cGMP-activated channel in thewall of the putative plasma membrane surrounding the Outer Segment222. This caused a flurry of activity during the1990's. The work of Sundin, et. al. and Kohl, et. al. are the latest reports on the genetic aspects of this work (See Section
118 Processes in Biological Vision
223Young, R. (1978) Visual cells, daily rhythms, and vision research. Vision Res. vol. 18, pp 573-578224Papermaster, D. Schneider, B. & Bersharse, J. (1985) Vesicular transport of newly synthzized opsin from theGolgi apparatus toward the rod outer segment. Invest. Ophthalmol Visual Sci. vol. 10, pp 1386-1404225Hall, M. Bok, D. & Bacharach, A. (1968) Visual pigment renewal in the mature frog retina. Science, vol.161pp 787-789226Bok, D. Basinger, S. & Hall, M. (1974) Autoradiographic and radiobiochemical studies on the incorporationof [6-3H]glucosamine into frog rhodopsin. Exp. Eye Res. vol 18, pp 225-240
18.8). There are now two recognized and differentiated genes of the above group associated with achromatopsia. Whereas Sundin, et. al. only associated these genes with the photoreceptor cell, Kohl, et. al. made a leap of faith andassociated these with putative cGMP gates. An alternate and more specific association is discussed in Section 18.8.
The cGMP model relies upon the putative rhodopsin activation sequence first proposed in the 1950's but not supportedhere. This foundation requires that the chromophore of vision be an integral part of the protein secreted by the innersegment. This is not the situation illustrated above and confirmed experimentally below.
The only conclusion that can be drawn from a coherent reading of the complete literature is that the Outer Segmentsassociated with the photoreceptor cells exist in extra-cellular space. It is not surrounded by a cell membrane and thereis no source of or requirement for Calcium, Sodium ions or cGMP to participate in a neural transmission event.Transduction does not rely upon an isomeric transformation of a chromophore buried within a protein and does employexciton transfer or phonon (mechanical) transfer of energy to the neuron as discussed earlier and developed in detail inChapter 11 & 12.
4.6.2.3 Details of the material processing loops of the Photoreceptor-IPM-RPE complex
This material is critical to the defense of the ideas here in Chapter 4. It eventually will be moved to Chapter 7.
The data derived from nuclear labeling in studies of the photoreceptor-IPM-RPE complex is of crucial importance to theunderstanding of the visual system and the clarification of earlier concepts.
This section will demonstrate conclusively that the classic concept of rhodopsin as a chemicalcompound formed within the cytosol of the photoreceptor cell is incorrect. It will be shown thatthe appropriate material is a structured chemical conglomerate of an active Rhodonine deposited onan inert opsin surface. This material only exists within the IPM and external to the photoreceptor cell.It only exists within the RPE during the process of phagocytosis.
Recent experiments using nuclear isotope labeled materials have provided valuable information on the operation of thephotosensitive functions of vision. The experiments have involved both in-vivo and in-vitro introduction of the isotopeslabeled materials. The in-vivo experiments have taken advantage of the extremely high level of metabolic activity withinboth the photoreceptor cells and the RPE. These levels of activity have allowed the insertion of nuclear isotopes intoan animal followed by observation of their physical concentration within the retina prior to their general distributionthroughout the animals body. Two distinctly different (classes of ) materials have been used in these experiments. Inone case, a nuclear labeled retinoid has been introduced into the system, typically all-trans-[11,12-3H]retinol. In thesecond case, a nuclear labeled amino acid has been introduced into the system, typically tritium labeled L-leucine or L-phenylalanine. The work has been dominated by the team led by R. W. Young. This team has generated a considerablebibliography in the 1967-78 period. Most of the work was exploratory as suggested by the time intervals used and thesmall sample sizes. Summaries were prepared in 1978, including a change in position relative to cones223. Most of thein-vivo work is believed to be archaic since it had not introduced the cytology of the photoreceptor cell presented byPapermaster and others in the 1980s224. This is particularly true for the assumption that opsin traveled from the innerto the outer segment via the cilium. That assumption will be countered in this work. The early work of Hall, et. al. isdiscounted for reasons that involve the awkward wording in the last paragraph of their discussion225. The completeexplanation will become obvious below.
The totally in-vitro experimental activity, such as by Bok, et. al.226, has generally been more indirect, has involved manyuncontrolled variables and hence has been more controversial. Another type of study has investigated the requirementfor fatty acids to be present in order to create photoreceptor membranes. These have taken two avenues. One involvedthe assumption that fatty acids are included in the basic disk structure. The other has involved the requirement for certain
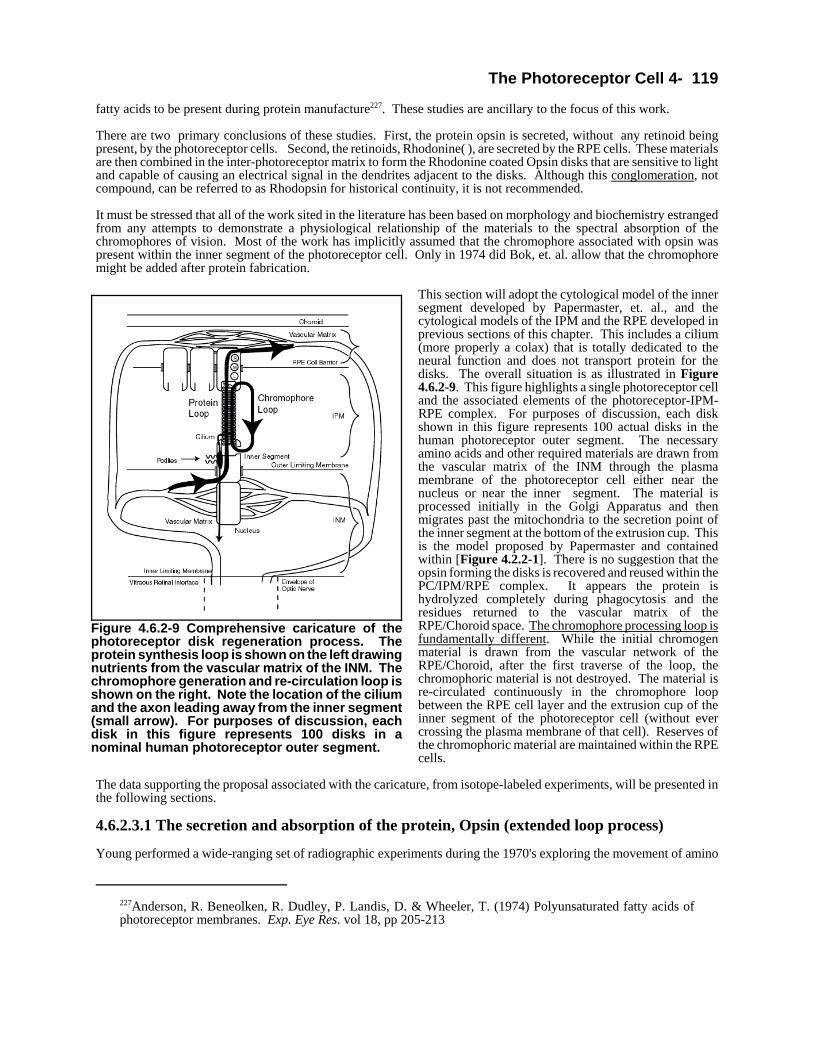
The Photoreceptor Cell 4- 119
227Anderson, R. Beneolken, R. Dudley, P. Landis, D. & Wheeler, T. (1974) Polyunsaturated fatty acids ofphotoreceptor membranes. Exp. Eye Res. vol 18, pp 205-213
Figure 4.6.2-9 Comprehensive caricature of thephotoreceptor disk regeneration process. Theprotein synthesis loop is shown on the left drawingnutrients from the vascular matrix of the INM. Thechromophore generation and re-circulation loop isshown on the right. Note the location of the ciliumand the axon leading away from the inner segment(small arrow). For purposes of discussion, eachdisk in this figure represents 100 disks in anominal human photoreceptor outer segment.
fatty acids to be present during protein manufacture227. These studies are ancillary to the focus of this work.
There are two primary conclusions of these studies. First, the protein opsin is secreted, without any retinoid beingpresent, by the photoreceptor cells. Second, the retinoids, Rhodonine( ), are secreted by the RPE cells. These materialsare then combined in the inter-photoreceptor matrix to form the Rhodonine coated Opsin disks that are sensitive to lightand capable of causing an electrical signal in the dendrites adjacent to the disks. Although this conglomeration, notcompound, can be referred to as Rhodopsin for historical continuity, it is not recommended.
It must be stressed that all of the work sited in the literature has been based on morphology and biochemistry estrangedfrom any attempts to demonstrate a physiological relationship of the materials to the spectral absorption of thechromophores of vision. Most of the work has implicitly assumed that the chromophore associated with opsin waspresent within the inner segment of the photoreceptor cell. Only in 1974 did Bok, et. al. allow that the chromophoremight be added after protein fabrication.
This section will adopt the cytological model of the innersegment developed by Papermaster, et. al., and thecytological models of the IPM and the RPE developed inprevious sections of this chapter. This includes a cilium(more properly a colax) that is totally dedicated to theneural function and does not transport protein for thedisks. The overall situation is as illustrated in Figure4.6.2-9. This figure highlights a single photoreceptor celland the associated elements of the photoreceptor-IPM-RPE complex. For purposes of discussion, each diskshown in this figure represents 100 actual disks in thehuman photoreceptor outer segment. The necessaryamino acids and other required materials are drawn fromthe vascular matrix of the INM through the plasmamembrane of the photoreceptor cell either near thenucleus or near the inner segment. The material isprocessed initially in the Golgi Apparatus and thenmigrates past the mitochondria to the secretion point ofthe inner segment at the bottom of the extrusion cup. Thisis the model proposed by Papermaster and containedwithin [Figure 4.2.2-1]. There is no suggestion that theopsin forming the disks is recovered and reused within thePC/IPM/RPE complex. It appears the protein ishydrolyzed completely during phagocytosis and theresidues returned to the vascular matrix of theRPE/Choroid space. The chromophore processing loop isfundamentally different. While the initial chromogenmaterial is drawn from the vascular network of theRPE/Choroid, after the first traverse of the loop, thechromophoric material is not destroyed. The material isre-circulated continuously in the chromophore loopbetween the RPE cell layer and the extrusion cup of theinner segment of the photoreceptor cell (without evercrossing the plasma membrane of that cell). Reserves ofthe chromophoric material are maintained within the RPEcells.
The data supporting the proposal associated with the caricature, from isotope-labeled experiments, will be presented inthe following sections.
4.6.2.3.1 The secretion and absorption of the protein, Opsin (extended loop process)
Young performed a wide-ranging set of radiographic experiments during the 1970's exploring the movement of amino
120 Processes in Biological Vision
228Papermaster, D. Schneider, B. & Besharse, J. (1985) Op. Cit. pg 1387229Young, R. (1968) Passage of newly formed protein through the connecting cilium of retinal rods in the frog.J. Ultrastructure Research, vol 23, pp 462-473
acids and proteins through the photoreceptor cell and the Outer Segment. While Young was meticulous in describinghis studies as involving the movement of amino acid nucleotides, his work has been widely interpreted as applying tothe putative compound and hence the chromophores of vision. His many caricatures have been widely reproduced.Although they changed over time, the concept of a ciliary neck transporting the protein material from the Inner to theOuter Segment has been widely adopted.
Contemporaneous radiographic tests by Bridges & Yoshikami were designed to demonstrate that retinoids passedthrough the same manufacturing channels as the tagged amino acids. However, this was not found to be the case. Theretinoid material did not pass through the photoreceptor cell. The retinoids arrived at the Outer Segments via the RPEcells. See Section 4.6.2.3.3.
Young first reported the movement of isotope-labeled amino acid material from within the inner segment to the basallocation of the disk stack in 1967. The caricatures in that paper did not illustrate a cilium. In 1968, additional data waspresented and the discussion suggested the protein material traveled from within the inner segment to the disk stack viathe cilium of the cell. This cilium had been defined morphologically in the 1953-56 time period. The technology of theday did not allow it to be characterized in detail. Young proposed that it was a channel for the transport of protein andprepared a widely reproduced caricature supporting this assumption apparently based entirely on morphology. Theassumption was based on electron microscopy at 20,000x to 40,000x. Later investigations by Papermaster reviewed thisassumption228, using newer equipment (magnification up to 74,000x) and presented the position that secretion of theprotein, opsin, occurred within the extrusion cup of the inner segment (at least in frogs). He also proposed that theassembly of opsin was not completed until the opsinogen reached the vesicles along the plasma wall inside the extrusioncup. This position was taken because no holo-opsin was found in soluble cytosol fractions.
Since the desired experiments necessarily involve injection of isotope-labeled amino acid(s) followed by sectioning ofthe retinal tissue after a prescribed period, rats, mice and frogs are favorite subjects. Cold-blooded frogs can be usedto easily explore the effects of temperature. The caricature in Figure 21 of Young’s 1967 paper shows this variation inthe location of the isotope tagged opsin disks 10 days after introduction of 3H-methionine into the blood stream. Hisdiscussion says the first band of tagged material appeared in the basal disk within 24 hours. His figure 8 shows amicrograph after the subject was given two tagged doses 96 hours apart. While each band is not a solid line due to thelow particle emission rate (half life of tritium, 12.26 years), they do exhibit a well-defined median perpendicular to theaxis of the outer segment (at least after two days). Young’s published work in 1967-68 does not show a concentrationof labeled amino acid passing through the cilium. On the contrary, figures 5 & 12 (and most likely 9) of his 1968 papershow a conspicuous absence of such material in the plane of the sectioned cilium229. In his 1968 paper with Droz, frame2C of figure 2 changed style to avoid showing a concentration of radiation activity within the cilium. The caricature inFrame 2d shows the radiation distributed uniformly across the disk at the bottom of the extrusion cup, as do theradiographs in Figures 11, 13 & 15.
It appears that the interpretation used here, based on Papermaster, is more realistic than that proposed earlier by Young.This interpretation assigns the role of the cilium to the neural role as found elsewhere in neural sensor cell biology.
Figure 4.6.2-10 presents this interpretation which will be discussed in terms of the data of the Young team. Note. Thecilium plays no role in the protein replacement loop.

The Photoreceptor Cell 4- 121
230Miller, N. & Newman, N. (1998) Walsh & Hoyt’s Clinical Neuro-Ophthalmology, 5th Ed. vol. 1. Baltimore,MD: Williams & Wilkins, pg 32231Young, R. (1976) xxx Invest. Ophthal. Vis. Sci. vol. 15(9), pp 700-725
Figure 4.6.2-10 Caricature of the replacement ofprotein disks in the outer stack using isotopetagging of the amino acids in the protein. Thecilium plays no role in the protein replacementloop. See text.
The time for a disk to travel from the point of formation tothe point of phagocytosis varies significantly by speciesand body temperature. Miller & Newman give a value of7 to 60 days230. For human, it is nominally seven days fora disk stack length of 2000 disks. This is a productionrate of about 12 disks per hour per cell. Young & Droz(1968) gave a production rate of one and one half disksper hour for frog photoreceptors at 22.5 C. Following thistime, the disks are engulfed prior to phagocytosis ingroups of 30-50 disks. Within 16 hours, the engulfedmass, a phagosome, is reduced to one half its diameter inmicrographs of sectioned material. The literature suggeststhere is virtually no observable residue following thephagocytosis. The chromophore material is placed instorage within the RPE cells and all of the protein materialis returned to the blood stream as amino acids. It appearsthe phagocytosis process is basically one of (1)hydrolyzing the protein material and (2) returning theliquid crystalline chromophore material to a state ofmatter where it can be easily transferred to pigmentgranules within the RPE cells.
Based on the work of Papermaster, a majorreinterpretation of several caricatures of Young isappropriate. Figure 4.6.2-11 employs the data ofYoung231 but does not accept his concept that all of thedisk material passes through the cilium. Instead, the rolesof the cilium as an electrical feed-through for thedendrites of the neural portion of the photoreceptor, andthe extrusion cup as the site of secretion of proteinmaterial into the IPM cell are recognized. The disks areat full diameter and grooved for dendrite insertion beforeleaving the extrusion cup (See Section 4.3.5.1.1). Withthese changes, the remainder of the Young caricature canbe used as originally portrayed.
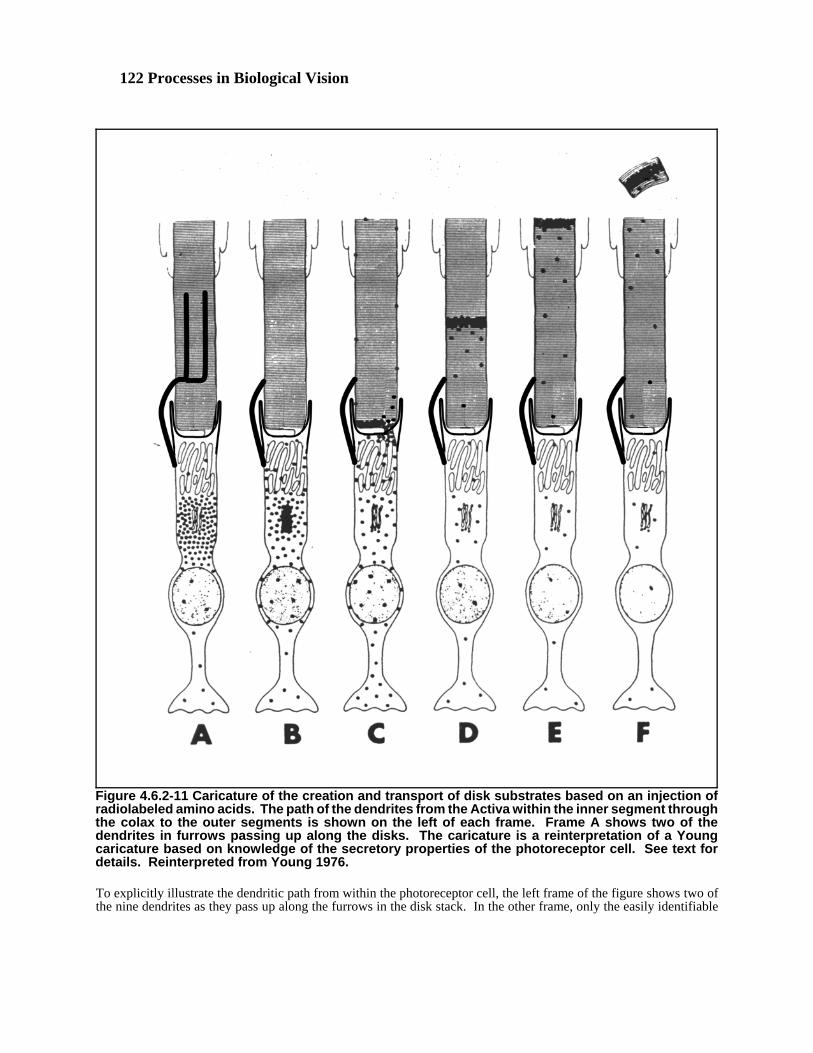
122 Processes in Biological Vision
Figure 4.6.2-11 Caricature of the creation and transport of disk substrates based on an injection ofradiolabeled amino acids. The path of the dendrites from the Activa within the inner segment throughthe colax to the outer segments is shown on the left of each frame. Frame A shows two of thedendrites in furrows passing up along the disks. The caricature is a reinterpretation of a Youngcaricature based on knowledge of the secretory properties of the photoreceptor cell. See text fordetails. Reinterpreted from Young 1976.
To explicitly illustrate the dendritic path from within the photoreceptor cell, the left frame of the figure shows two ofthe nine dendrites as they pass up along the furrows in the disk stack. In the other frame, only the easily identifiable
The Photoreceptor Cell 4- 123
dendrite bundle is shown. As shown, the disk stack is entirely external to the photoreceptor cell and, beyond the stavesand calyx of the Inner Segment, there is no membrane surrounding the stack. The heavy line surrounding the stack isa contrast edge formed by the difference in material concentrations within the stack and the IPM.
Frame A shows the presence of nucleotides scattered uniformly within much of the inner segment, except within thenucleus.
The technique of labeling certain amino acids and tracing their passage through the visualsystem is only possible because of the prodigious acquisition and consumption of these materialsby the inner segment (in the short term) in order to continually prepare the protein required bynew disks for use in the outer segment. This concentration of the nucleotide labeled amino acidis far greater than in any nearby tissue. Over the long term, the distribution of the nucleotidesbecomes uniform throughout the body tissue as shown in frame 2d of Young & Droz, 1968.
A similar technique is available using tritiated retinol. It results in the accumulation of thenucleotide material in specific locations within the RPE cells prior to its transport to the disks.The prodigious rate of processing is again the reason for the high and rapid concentration of thenucleotide labeled material.
Young differentiates between these two modes of material deposition. He defines that involving amino acids and theformation of the substrates as “membrane replacement.” He defines the action related to tritiated retinol as “molecularreplacement.” These are acceptable as long as two points are understood, the term membrane refers to the substrate ofthe disks and not a plasma membrane, and the term molecular refers to the chromophores of vision.
In frame B, the nucleotides have coalesced within the Golgi apparatus. Following preliminary processing, theneucleotides pass on to the mitochondria for final processing before being secreted into the extrusion cup as shown inframe C. It is in frame C where the protein is assembled into the substrates of the individual disks. Frame D shows thegroup of disks containing the nucleotides passing up along the length of the OS. Frames E and F show the initialengulfing of the disks in groups of about 50 and their phagocytosis within the RPE cell.
It is important to study the radiographs of Young, et. al. relative to the cilium in detail. His images represent a timesequence involving considerable time between samples. This situation makes it necessary to interpolate the position ofthe nucleotides at intermediate times. Although this author found many images showing concentrations of nucleotidesnear the cilium, no images were found in the published literature that showed a concentration of nucleotides within thecilium as shown in the caricatures of Young.
It is not clear, from the literature related to vision, exactly how the opsin or its components are passed through themembrane wall of the IS.
4.6.2.3.2 Disk formation and transport parameters
In the retina of a living animal, under constant light stimulation, a steady state must exist under which the rate at whichthe photochemicals are excited (observed as bleaching) is equal to the rate at which they are de-excited (generallydescribed as regeneration).
The data in the literature concerning cell growth is of limited precision, mostly order of magnitude estimates. However,even these estimates stress the remarkable capability of the photoreceptor cells to produce and the RPE cells tophagocytize disks. The best available estimates, based on a disk pitch of 250 Angstrom, are:
Disk formation rate 12 per hour per cell nominal / warm blooded mammalsDisk operating life 166 hrs/7 days/1 wk.Disk transport velocity 300 nm/hr--7.2 :/day
The rate of disk formation and transport result in a typical lifetime for a disk of 1 week. This lifetime is incompatiblewith the hypothesis in the isomerization theory that 11 cis-retinol is converted to all trans-retinol by light and remainsin that form until the disk containing it is phagocytized. If this were true, based on the photon fluxes involved in vision,the normal eye would consume all of the transducer material in the eye in a matter of minutes and require the completeexclusion of all light for up to 7 days to reacquire full sensitivity. Alternately, the all-trans retinol would have to beremoved from each disk after its formation, be transported to the RPE for regeneration as 11 cis-retinol, and then betransported back to the disks. It is not reasonable to expect this procedure to occur within the time constants of theadaptation process.
124 Processes in Biological Vision
232Pepperberg, D. Okajima, T. Wiggert, B. Ripps, H. Crouch, R. & Chader, G. (1993) Interphotoreceptorretinoid-binding protein (IRBP) Molecular Neurobiology, vol. 7(1), pp. 61-84233Saari, J. (1994) Retinoids in photosensitive systems. Chapter nine in Biology, chemistry and medicine, 2nd.Ed. Edited by Sporn, M. Roberts, A & Goodman, D. NY: Raven Press234Bridges, C. & Yoshikami, S. (1969) Uptake of tritiated retinaldehyde by the visual pigment of dard-adaptedrats. Nature, vol. 221, pp 275-276235Bridges, C. & Yoshikami, S. (1970) The rhodopsin-porphyropsin system in freshwater fishes–2. Vision Res.vol. 10, pp 1333-1345236Okajima, T-I, Wiggert, B. Chaders, G. & Pepperberg, D. (1994) Retinoid processing in retinal pigmentepithelium of toad (Bufo marinus). J. Biol. chem. vol. 269, no. 35, pp 21983-21989237Ganguly, J. (1989) Biochemistry of Vitamin A. Boca Raton, FL: CRC Press pg 103
Based on the literature values, the amount of retinoids stored in the RPE is between 5 and 20 times larger than that inthe outer segments. If this is correct and the mean disk operating life is one week, the human eye stores enough retinoidsto supply itself for between one and six months without requiring external resupply. This estimate is compatible withSection 4.6.3.3.
The process loop presented in this chapter may give important insights into diseases of the retina. In the case of retinitispigmentosis, it offers a number of possibilities for better understanding. Is the disease related to the buildup of debrisin the RPE due to a failure in phagocytosis or is it due to an overproduction and subsequent storage of excessive amountsof the retinoids? Optimal treatment would be quite different under these two different situations.
4.6.2.3.3 The secretion and absorption of the chromophore, Rhodonine (local loop process)
To the surprise of many, the studies of retinoid transport and of the uptake of isotope-labeled retinoids have failed toshow any appreciable amount of the retinoids entering the inner segment of the photoreceptor cells. The data isconvincing that the retinoids of vision enter the IPM via the RPE cell layer. There is no indication that a chemicalreaction involving opsin and retinol occurs in the photoreceptor cells or anywhere else in the visual system. Thisposition excludes considering hydrogen bonding a chemical reaction.
The conventional wisdom concerning Vitamin A processing into a chromophore, before the late 1980s, assumed ithappened in the IS of the photoreceptor cell. The assumption has been that it was then transferred to the OS as part ofa complex molecule of the protein, Opsin, and the chromophore.
Pepperberg, et. al232. provided a review in 1993 that began to change the emphasis toward fabrication of thechromophores in the RPE. However, lacking a working model, they continued to assume that the chromophore wasinvolved in an isomerization and required physical transport to and from the RPE via IRBP.
Saari233, has provided a good summary of the conventional view of the retinoid loop and the enzymology involved asof 1994. He presented a “parsimonious model” of retinoid transport and concluded saying: the paper “serves to bringinto focus unanswered questions and puzzling features of the cycle, and emphasize [sic] that we have merely touchedthe surface in our understanding of this complex process.”
These authors have suffered from the assumption that the Outer Segment was an internal element of the photoreceptorcell. They were not able to give convincing evidence how the chromophore entered the photoreceptor cell from the IPMor how the disks within the cell were later phagocytized without destroying the cell in the process.
The experiments of Bridges & Yoshikami, the data in Ganguly and this work have shown that the conventional wisdomdid not describe the actual case. Careful measurements following ingestion of Vitamin A showed two things. Nearlyall of the Vitamin A transported to the eye of the animal was transferred to the RPE. Only a minuscule amount wastransported to the photoreceptor cells. This was the amount of vitamin needed to support fabrication of new protein.
Bridges & Yoshikami performed the earliest isotope experiments tracking retinoids within the photoreceptor-IPM-RPEcomplex space of rats234 and freshwater fish235. In both papers, they injected all-trans-retinyl-11,12-3H2-acetate.Recently, Okajima, et. al. have examined the similar processes in the toad236. Their work was all in-vitro and used all-trans-[11,12-3H]retinol. Ganguly provided a general background on the nutrition and excretion of isotope-labeledVitamin A237.
The Photoreceptor Cell 4- 125
238Bridges, & Yoshikami, S. (1970) The rhodopsin-porphyropsin system in freshwater fishes–2. Vision Res. vol10, pp 1333-1345239Trobe, J. (2001) The Neurology of Vision. NY: Oxford University Press pg 13
In the 1969 experiments, Bridges & Yoshikami238 injected dark adapted rats with tritiated all-trans retinyl-11,12-3H2-acetate and found the radioactive content increased in the outer segments after 12 days whether the rat was kept in thelight or dark. They did not use autoradiographic techniques to locate the precise sources of the radiation. Although theirresults appear valid, the authors did not speculate on any intermediate chemical processes involving the acetate, i.e.,conversion into an aldehyde or alcohol.
More recent autoradiographic experiments have been performed to show the retinoid material believed to be thechromophores (or at least chromogens) are accumulated in the RPE, passed to the IPM and reach the newly formed disksin the area near (or in) the extrusion cup. This action strongly suggests the principal function of the protein (Opsin)extruded from the cup is that of a structural protein and not necessarily related to the photosensing and transductionprocesses at all. In the proposed model, the chromophores utilize the structural protein as a substrate only and do notinvolve it in the signal generation process.
There is an interesting side-note to the 1970 Bridges paper. While they espouse the theory that they were replacingporphyropsin (an archaic synonym for the mid wavelength visual pigment with anisotropic absorption at 532 nm) withclassical rhodopsin (peak isotropic absorption at ~500 nm exhibited by all visual chromophores), they did not specificallystate the source of their retinyl acetate. This work would argue that they were replacing the Vitamin A2 based mid-wavelength chromophores of vision associated with fresh water fish with a Vitamin A1 based mid-wavelengthchromophores of vision associated with marine fish (formed from the retinyl acetate obtained from their supplier). Theywere essentially inducing a transition encountered periodically in euryhaline fish. They did not provide any visual bandspectrographic data to support their interpretations. Their UV spectrographs did confirm the switch between commonVitamin A1 based chromophores (peak isotropic absorption at 332 nm) and Vitamin A2 based chromophores (peakisotropic absorption at 340 nm), including a transition mixture containing 68% Vitamin A2 based material (See Chapter6). Of particular interest are their comments on page 1341 concerning the “vitamins A” (quotes in the original) and theirreference to Wald’s work in 1939. This work and the Wald paper interpret the changes reported by Bridges as thereplacement of the Vitamin A2 based chromophores with Vitamin A1 based chromophores. Although not confirmedin the printed material, the change in peak absorption of the individual spectral chromophores in the visual spectral rangeshould have been negligible.
Caricatures 1, 2 & 3 in Figure 5 of Bridges, et. al. (1970) are in total graphic agreement with this work. Only theinterpretation is different. They do not show the presence of any material derived from retinyl acetate within the plasmamembrane of the inner segment. They show the orderly replacement of the chromophoric material derived from retinyl-11,12-3H2-acetate on the assumption that it is part of the rhodopsin molecule. This assumption by Bridges, thatrhodopsin is formed in the RPE, conflicts directly with the data of the Young team showing that the protein opsinoriginates in the inner segment and not the RPE, Section 4.6.2.3.1. However, the first sentence in their discussion ismore explicit. They speak of replacing the retinol-based prosthetic group of rhodopsin. If the term rhodopsin iseliminated from their nomenclature in favor of Rhodonine, the conflict is resolved. When they speak of changing theretinol-based prosthetic group, it can be interpreted as changing the prosthetic group, the auxochrome location, withinRhodonine. They use the term condense to describe the way the chromophore forms on the substrate. It is suggestedthe form is more complex and should be described as adsorption. Rhodopsin can then be used to describe theconglomerate consisting of the chromophore, Rhodonine, adsorbed on the surface of the adsorbent, opsin, as a liquidcrystal. Figure 4.6.2-12 shows this reinterpretation.
Trobe illustrates this same interpretation of chromophore flow, but including the archaic conventional view relating toother features (gates and rhodopsin activation)239.
In this work, the retinyl acetate chromogen is convertible to retinol in the liver and then converted into the chromophoresof vision during transport to the RPE cell layer. The chromophores are transferred from the RPE cells to the IRBP inthe IPM and transported to the interior of the extrusion cup. It is then adsorbed on the surface of the disks of the outersegment as shown in their figure and the figure above. The chromophore material then proceeds to move with the diskstoward the RPE cells and phagocytosis. Upon phagocytosis, the chromophore material is transferred, withoutdestruction, to the pigment granules for subsequent re-transfer to IRBP molecules and re-transport to the interior of theextrusion cup.
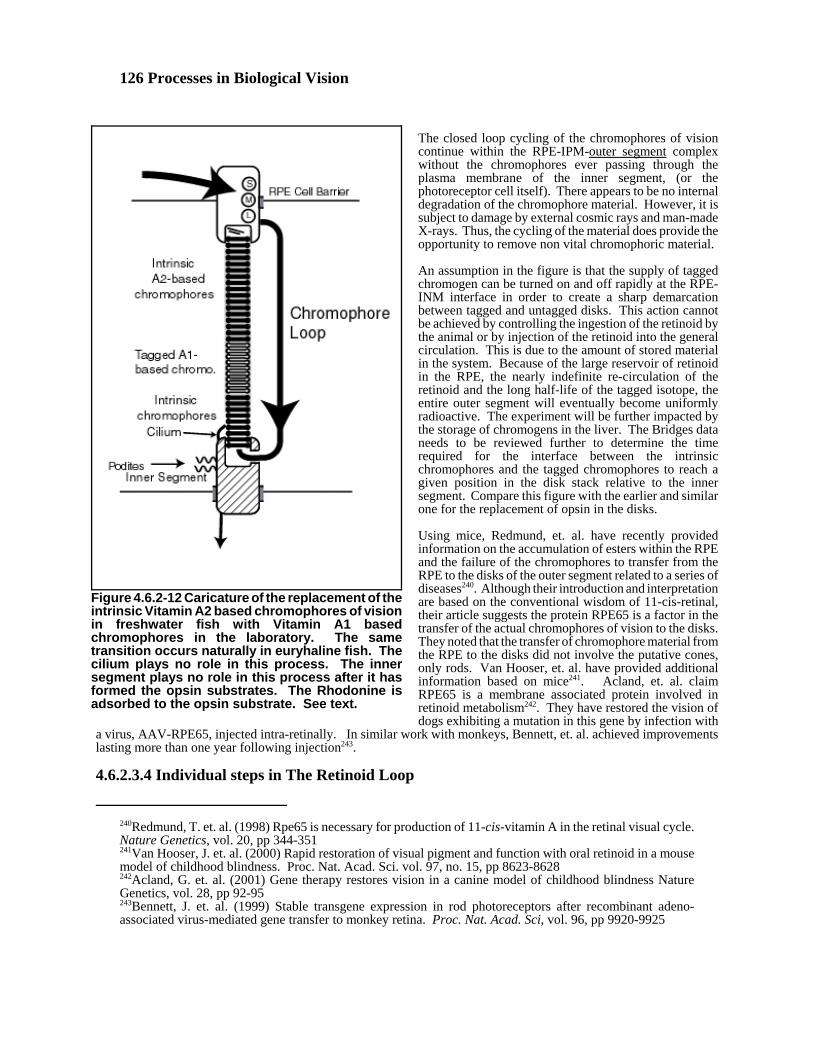
126 Processes in Biological Vision
240Redmund, T. et. al. (1998) Rpe65 is necessary for production of 11-cis-vitamin A in the retinal visual cycle.Nature Genetics, vol. 20, pp 344-351241Van Hooser, J. et. al. (2000) Rapid restoration of visual pigment and function with oral retinoid in a mousemodel of childhood blindness. Proc. Nat. Acad. Sci. vol. 97, no. 15, pp 8623-8628242Acland, G. et. al. (2001) Gene therapy restores vision in a canine model of childhood blindness NatureGenetics, vol. 28, pp 92-95243Bennett, J. et. al. (1999) Stable transgene expression in rod photoreceptors after recombinant adeno-associated virus-mediated gene transfer to monkey retina. Proc. Nat. Acad. Sci, vol. 96, pp 9920-9925
Figure 4.6.2-12 Caricature of the replacement of theintrinsic Vitamin A2 based chromophores of visionin freshwater fish with Vitamin A1 basedchromophores in the laboratory. The sametransition occurs naturally in euryhaline fish. Thecilium plays no role in this process. The innersegment plays no role in this process after it hasformed the opsin substrates. The Rhodonine isadsorbed to the opsin substrate. See text.
The closed loop cycling of the chromophores of visioncontinue within the RPE-IPM-outer segment complexwithout the chromophores ever passing through theplasma membrane of the inner segment, (or thephotoreceptor cell itself). There appears to be no internaldegradation of the chromophore material. However, it issubject to damage by external cosmic rays and man-madeX-rays. Thus, the cycling of the material does provide theopportunity to remove non vital chromophoric material.
An assumption in the figure is that the supply of taggedchromogen can be turned on and off rapidly at the RPE-INM interface in order to create a sharp demarcationbetween tagged and untagged disks. This action cannotbe achieved by controlling the ingestion of the retinoid bythe animal or by injection of the retinoid into the generalcirculation. This is due to the amount of stored materialin the system. Because of the large reservoir of retinoidin the RPE, the nearly indefinite re-circulation of theretinoid and the long half-life of the tagged isotope, theentire outer segment will eventually become uniformlyradioactive. The experiment will be further impacted bythe storage of chromogens in the liver. The Bridges dataneeds to be reviewed further to determine the timerequired for the interface between the intrinsicchromophores and the tagged chromophores to reach agiven position in the disk stack relative to the innersegment. Compare this figure with the earlier and similarone for the replacement of opsin in the disks.
Using mice, Redmund, et. al. have recently providedinformation on the accumulation of esters within the RPEand the failure of the chromophores to transfer from theRPE to the disks of the outer segment related to a series ofdiseases240. Although their introduction and interpretationare based on the conventional wisdom of 11-cis-retinal,their article suggests the protein RPE65 is a factor in thetransfer of the actual chromophores of vision to the disks.They noted that the transfer of chromophore material fromthe RPE to the disks did not involve the putative cones,only rods. Van Hooser, et. al. have provided additionalinformation based on mice241. Acland, et. al. claimRPE65 is a membrane associated protein involved inretinoid metabolism242. They have restored the vision ofdogs exhibiting a mutation in this gene by infection with
a virus, AAV-RPE65, injected intra-retinally. In similar work with monkeys, Bennett, et. al. achieved improvementslasting more than one year following injection243.
4.6.2.3.4 Individual steps in The Retinoid Loop

The Photoreceptor Cell 4- 127
244Ong, D. (1985) Vitamin A-binding proteins. Nutrition Reviews vol. 43, pp. 225-232245Ganguly, J. (1989) Biochemistry of Vitamin A. Boca Raton, FL: CRC Press
Section 4.1.2.1.1 develops some important information concerning the retinoids of vision. It shows that retinol shouldnot be considered identical to Vitamin A. The Vitamin A group now contains about 50 biologically active members.The generic name for this group is provitamin A. It also develops the fact that the retinoids play two separate roles inthe retina.
To discuss the retinoid loop related to vision, it is necessary to review the list of “binding proteins” thought to beinvolved in retinoid transport and storage within the loop. Table 4.6.2-1 based on Ong244 summarizes the retinoidbinding proteins involved in vision. The names of these materials were all developed to be self explanatory based onthe limited knowledge of the retinoids of the day. They were usually defined based on in-vitro experiments usingretinoids prepared in the laboratory. It will be shown that many of these names are not as precise as might be thought.This becomes obvious when it is recognized that the resonant character of the chromophores provides them with anambidextrous quality, exhibiting the properties of both the alcohol and aldehyde forms of the simple retinoidssimultaneously. An in-vitro laboratory test using only simple non-resonant retinoids is not conclusive of the actualbinding ability of these proteins in-vivo. Ong used a different title for this chart than shown above (from Ganguly). Heindicated these proteins bound the retinoids non-covalently. As in the previous statement, it is not clear that this earlierwork could definitively determine the actual method of chromophore binding using only non-resonant retinoids. Thecolumn labeled Endogenous Ligand has not been shown to be exclusive with relation to the complete retinoid family.
TABLE 4.6.2-1
Important retinoid-binding proteins isolated from various sourcesName Abbreviation Endogenous Primary
Ligand LocationRetinol Binding Protein (S)RBP* All-trans retinol BloodstreamLiver Retinol Binding Protein LRBP All-trans retinol LiverCellular Retinol Binding Protein CRBP All-trans retinol RPE & PC laminatesCellular Retinoic Acid Bind. Prot. CRABP All-trans retinol acid “ ” “Cellular Retinal Binding Protein CRALBP 11-cis-retinol** Specific cells of eye
Interstitial retinol Bind. Prot. IRBP All-trans & 11-cis retinol IPM of PC laminate
* More recent studies suggest that the label RBP is not sufficiently precise. There appear to be several different RBP’sin the bloodstream. Some carry all-trans retinol to all cells of the body indiscriminately for purposes of growth andmetabolism. A more specific, more sophisticated, and serum-based variety complexes with all-trans-retinol for purposesof transport to the RPE for use in vision. As discussed below in Section 4.6.3, this variety, to be labeled SRBP, operatesin conjunction with another protein labeled TTR.
** This work does not support the use of 11-cis-retinol in the visual process. In this work, CRBP, CRABP, CRALBPand IRBP all transport one of the resonant (trans) forms of retinol, the Rhodonines. These forms contain both alcoholand aldehyde ligands simultaneously, causing great difficulty in analytical testing based only on sensitivity to a specificligand.
The right-hand column of the Table needs further development. In the text associated with the same Table in Ganguly245,it was pointed out that CRBP and CRABP are retinoid binding proteins known to exist throughout the organism.CRAIBP and IRBP are similar retinoid binding proteins but are believed to occur only in the eye. CRAIBP is found inthe RPE exclusively and IRBP is found in the IPM exclusively. This suggests these materials play unique individualroles in the processing of the retinoid into chromophores within the retinoid loop of vision.
Ganguly gave only one paragraph to the description of the “Visual cycle of Vitamin A.” However, a great deal ofinformation is provided about the static conditions related to this loop. This includes the proposition that the retinoidswhen bound to CRBP are easily esterfied to the palmitate. There is also discussion concerning the transportability of theretinoids when in the alcohol, aldehyde and ester form. The likely hood that the esters are the form stored within the RPEwill be discussed below.
Ong did not approach the subject from the perspective of a loop. Near the end of his paper, he dropped the terms retinoland retinal from his discussion regarding vision in favor of the more generic retinoid. He did provide more information
128 Processes in Biological Vision
246Goodman, D. (1981) Retinoid-binding proteins in plasma and in cells. Ann. N. Y. Acad. Sci. vol. 359, pg.69
concerning the transport of retinol in the blood. Goodman246 has also provided more information concerning therelationship between the retinol to be used in vision and RBP (hereafter SRBP).
The retinoid loop will be discussed at a more detailed level than in the above works. It will also be discussed from theperspective of the four different chromophores of vision, the Rhodonines. And, it will be discussed in terms of theresonant nature of these chromophores.
The retinoid loop is a “local” loop in the sense that once retinol is delivered to the RPE from the blood stream, thechromophores manufactured there re-circulate continuously within the RPE and photoreceptor laminates. The literaturereports re-circulation times exceeding 5 weeks in white rats and 12 weeks in humans. These numbers probably refer tothe time constant of an exponential. Some of the chromophores are probably decomposed over time in which case theirremnants are catabolized in the RPE and returned to the bloodstream. No estimate of the lifetime of a chromophore couldbe deduced from the literature.
Retinol can be considered the precursor of two different families of retinoids. It is the hormonogen of the provitamin Agroup (and its most important member). It is also the chromogen of the Rhodonine group of visual chromophores. Thesefamilies are handled differently in the animal. Retinol, being insoluble in water, is complexed with a retinol bindingprotein, SRBP, in the liver to facilitate its transport via the blood stream. Other members of the provitamin A group aretransported by other means.
Every living animal cell requires a member of the provitamin A group to support its growth and general manufacturing.The cell can obtain this material from the blood stream in whatever form it is transported. In addition, the cells of theRPE require retinol for special manufacturing purposes, creating the chromophores of vision. The RPE cells are onlyable to obtain retinol from the blood stream for this purpose when it is complexed with SRBP. The consumption ofprovitamin A to support general cell metabolism will not be pursued here. The focus will be on the consumption ofretinol in the manufacture of the chromophores of vision.
The mechanics of retinol transport to the RPE will be detailed in Section 4.6.2.3.3. It involves requirements related toconformal chemistry that the other members of the provitamin A group cannot satisfy. There is a requirement that themolecule be all-trans and that the hydrogen ion in the hydroxyl ligand be very loosely bound.
The retinoid loop is quite different from the protein loop. Where the IS in the protein loop relies on the bloodstream asthe storage medium for the material to build the proteins, the RPE provides a major storage facility for the retinoids usedin vision. It is very clear that the bulk of the retinoid material in the eye is stored in the RPE and on the disks themselves;the material is transported from the RPE to the base of the OS disk stack near the extrusion region of the IS, the retinoidsare incorporated into the disk assembly, the retinoid material is then physically transported back to the RPE by thecontinuing extrusion process. When a disk reaches the RPE, it is phagocytosized and the chromophores are recoveredand returned to the pigment cells of the RPE prior to reuse. This entire process occurs within the confines of the RPE-OS-extrusion cup space. It has available the manufacturing capability of the RPE cells. It does not involve thecapabilities of the IS or penetration of the IS membrane wall. Each of the steps described above will be examined inmore detail.
4.6.2.3.5 Possible alternate paths for individual chromophores
At the present time, the model of this work can support several retinoid transport methodologies between the RPE andthe disks of the OS. The fundamental methodology was shown schematically in [Figure 4.6.2-1] and is reproduced herefor convenience as Figure 4.6.2-13. The figure is divided into two parts to emphasize the functional difference betweenthe retinoids supporting the IS and those supporting the RPE. That retinoid supporting the IS is ingested for the purposeof manufacturing the substrate protein, Opsin, and other normal cellular functions. Manufacturing is assumed to occurin the Ribosomes (RI). Following secretion of the protein, formation of the disks and following phagocytosis of thedisks, the protein is seen to be catabolized further (the square loop). Its constituents are then returned to the bloodstream.
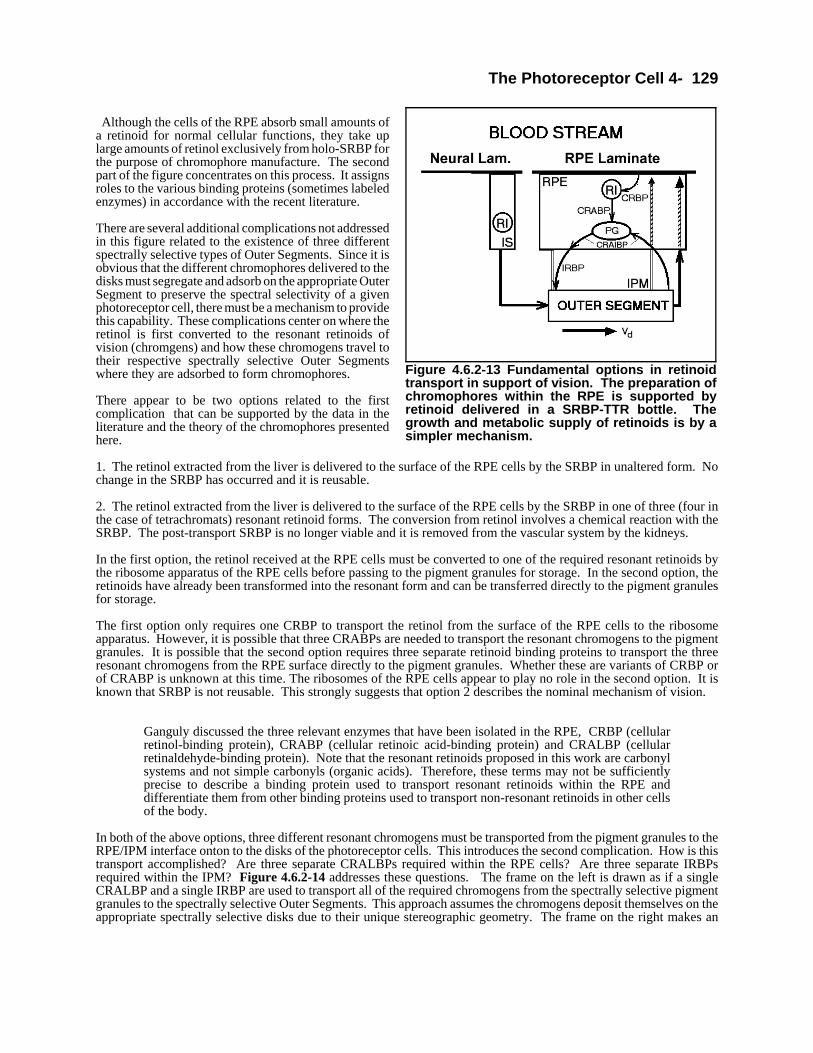
The Photoreceptor Cell 4- 129
Figure 4.6.2-13 Fundamental options in retinoidtransport in support of vision. The preparation ofchromophores within the RPE is supported byretinoid delivered in a SRBP-TTR bottle. Thegrowth and metabolic supply of retinoids is by asimpler mechanism.
Although the cells of the RPE absorb small amounts ofa retinoid for normal cellular functions, they take uplarge amounts of retinol exclusively from holo-SRBP forthe purpose of chromophore manufacture. The secondpart of the figure concentrates on this process. It assignsroles to the various binding proteins (sometimes labeledenzymes) in accordance with the recent literature.
There are several additional complications not addressedin this figure related to the existence of three differentspectrally selective types of Outer Segments. Since it isobvious that the different chromophores delivered to thedisks must segregate and adsorb on the appropriate OuterSegment to preserve the spectral selectivity of a givenphotoreceptor cell, there must be a mechanism to providethis capability. These complications center on where theretinol is first converted to the resonant retinoids ofvision (chromgens) and how these chromogens travel totheir respective spectrally selective Outer Segmentswhere they are adsorbed to form chromophores.
There appear to be two options related to the firstcomplication that can be supported by the data in theliterature and the theory of the chromophores presentedhere.
1. The retinol extracted from the liver is delivered to the surface of the RPE cells by the SRBP in unaltered form. Nochange in the SRBP has occurred and it is reusable.
2. The retinol extracted from the liver is delivered to the surface of the RPE cells by the SRBP in one of three (four inthe case of tetrachromats) resonant retinoid forms. The conversion from retinol involves a chemical reaction with theSRBP. The post-transport SRBP is no longer viable and it is removed from the vascular system by the kidneys.
In the first option, the retinol received at the RPE cells must be converted to one of the required resonant retinoids bythe ribosome apparatus of the RPE cells before passing to the pigment granules for storage. In the second option, theretinoids have already been transformed into the resonant form and can be transferred directly to the pigment granulesfor storage.
The first option only requires one CRBP to transport the retinol from the surface of the RPE cells to the ribosomeapparatus. However, it is possible that three CRABPs are needed to transport the resonant chromogens to the pigmentgranules. It is possible that the second option requires three separate retinoid binding proteins to transport the threeresonant chromogens from the RPE surface directly to the pigment granules. Whether these are variants of CRBP orof CRABP is unknown at this time. The ribosomes of the RPE cells appear to play no role in the second option. It isknown that SRBP is not reusable. This strongly suggests that option 2 describes the nominal mechanism of vision.
Ganguly discussed the three relevant enzymes that have been isolated in the RPE, CRBP (cellularretinol-binding protein), CRABP (cellular retinoic acid-binding protein) and CRALBP (cellularretinaldehyde-binding protein). Note that the resonant retinoids proposed in this work are carbonylsystems and not simple carbonyls (organic acids). Therefore, these terms may not be sufficientlyprecise to describe a binding protein used to transport resonant retinoids within the RPE anddifferentiate them from other binding proteins used to transport non-resonant retinoids in other cellsof the body.
In both of the above options, three different resonant chromogens must be transported from the pigment granules to theRPE/IPM interface onton to the disks of the photoreceptor cells. This introduces the second complication. How is thistransport accomplished? Are three separate CRALBPs required within the RPE cells? Are three separate IRBPsrequired within the IPM? Figure 4.6.2-14 addresses these questions. The frame on the left is drawn as if a singleCRALBP and a single IRBP are used to transport all of the required chromogens from the spectrally selective pigmentgranules to the spectrally selective Outer Segments. This approach assumes the chromogens deposit themselves on theappropriate spectrally selective disks due to their unique stereographic geometry. The frame on the right makes an
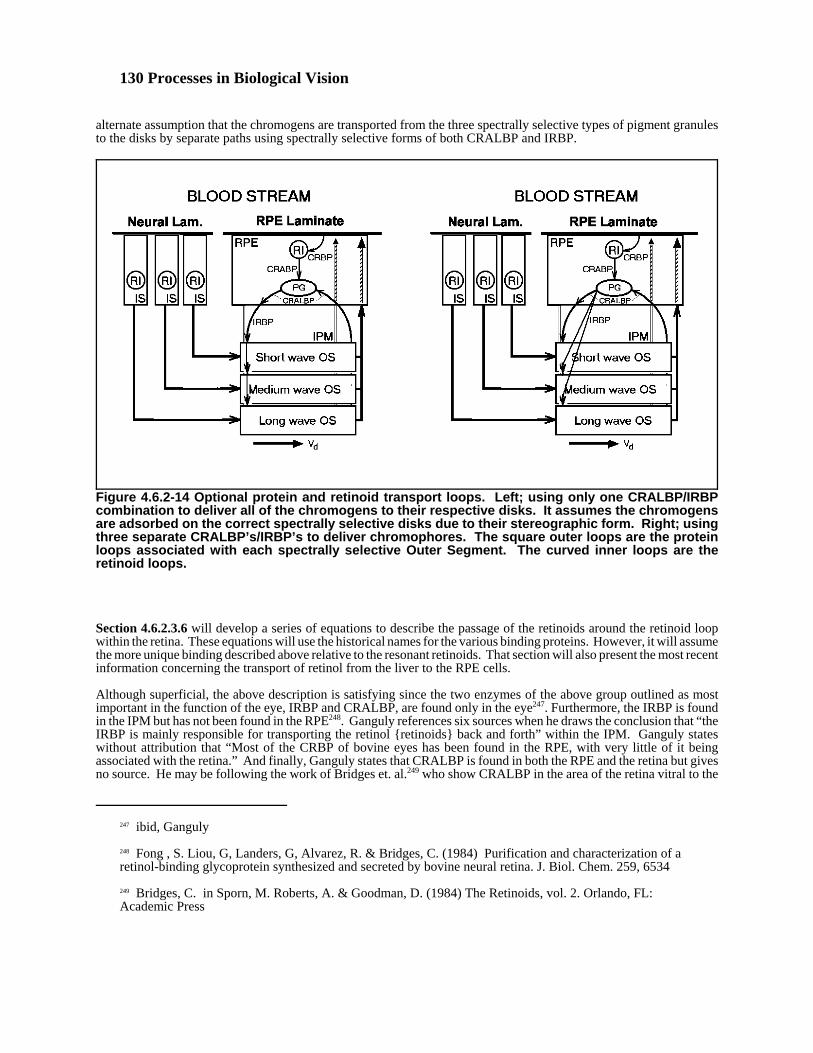
130 Processes in Biological Vision
247 ibid, Ganguly
248 Fong , S. Liou, G, Landers, G, Alvarez, R. & Bridges, C. (1984) Purification and characterization of aretinol-binding glycoprotein synthesized and secreted by bovine neural retina. J. Biol. Chem. 259, 6534
249 Bridges, C. in Sporn, M. Roberts, A. & Goodman, D. (1984) The Retinoids, vol. 2. Orlando, FL:Academic Press
Figure 4.6.2-14 Optional protein and retinoid transport loops. Left; using only one CRALBP/IRBPcombination to deliver all of the chromogens to their respective disks. It assumes the chromogensare adsorbed on the correct spectrally selective disks due to their stereographic form. Right; usingthree separate CRALBP’s/IRBP’s to deliver chromophores. The square outer loops are the proteinloops associated with each spectrally selective Outer Segment. The curved inner loops are theretinoid loops.
alternate assumption that the chromogens are transported from the three spectrally selective types of pigment granulesto the disks by separate paths using spectrally selective forms of both CRALBP and IRBP.
Section 4.6.2.3.6 will develop a series of equations to describe the passage of the retinoids around the retinoid loopwithin the retina. These equations will use the historical names for the various binding proteins. However, it will assumethe more unique binding described above relative to the resonant retinoids. That section will also present the most recentinformation concerning the transport of retinol from the liver to the RPE cells.
Although superficial, the above description is satisfying since the two enzymes of the above group outlined as mostimportant in the function of the eye, IRBP and CRALBP, are found only in the eye247. Furthermore, the IRBP is foundin the IPM but has not been found in the RPE248. Ganguly references six sources when he draws the conclusion that “theIRBP is mainly responsible for transporting the retinol {retinoids} back and forth” within the IPM. Ganguly stateswithout attribution that “Most of the CRBP of bovine eyes has been found in the RPE, with very little of it beingassociated with the retina.” And finally, Ganguly states that CRALBP is found in both the RPE and the retina but givesno source. He may be following the work of Bridges et. al.249 who show CRALBP in the area of the retina vitral to the

The Photoreceptor Cell 4- 131
250Fong, S. Liou, G Landers R. Alvarez, R. & Bridges, C. (1984) Op. Cit.251Starzak, M. (1984) The physical chemistry of membranes. NY: Academic Press. pg. 42
Figure 4.6.2-15 Proposed protein and retinoidtransport loops. The square outer loops are threesimilar protein paths to three spectrally differentOuter Segments. The curved inner loops are themultiple retinoid loops. Whether multiple forms ofCRALBP and IRBP are used to deliverchromophores to the disks remains an openquestion. However, the stereographic propertiesof the chromogens are probably adequate toinsure spectrally selective adsorption on theappropriate disks.
external limiting “membrane” in a figure that Ganguly also used in his work. CRALBP located in this remote area wouldnot significantly affect the above transport processes but it would support normal cell growth and metabolism as it doeselsewhere in the body of the organism.
4.6.2.3.6 The Retinoid Loop Model
Based on the above ideas, Figure 4.6.2-15 illustrates the most plausible overall situation for the retinoid loop. Thestorage capability of the RPE is large compared to the instantaneous needs of the OS. Therefore, the loop can operateover intervals of days to weeks without significant amounts of new material being drawn from the bloodstream in theadult animal. To maintain the necessary supply of chromophoric material to the new disks being formed, a significantportion of the available chromogens are probably stored and circulating in the IPM (that includes the inter-disk space).They are probably stored as a saturated solution of each of the three Rhodonines (probably) complexed with individualforms of IRBP Aphakic human eyes suggest that all four IRBP’s and visual chromogens/chromophores are present toat least some extent in humans but only three are used effectively due to the spectral limitations of the lens group.
It is assumed that each disk stack was initialized to acceptonly a particular Rhodonine during morphogenesis.Henceforth, only that type of Rhodonine will be depositedin a liquid crystalline monolayer on the structural proteinforming the individual disks of that stack. It is not clearwhether the monolayer is deposited on the protein frameduring initial forming, before folding and extrusion of theindividual disks, but this would be the expected situationif deposition, based on the initial seeding, is to bemaintained.
Referring to the binding capacity of IRBP as presented byFong et. al.250, the value of 2.2 is interesting if confirmablesince it would provide data on how the retinoid binds tothe IRBP and on the maximum capability of IRBP totransport retinoids in the IPM. The alternate value of 0.6would be expected if the eye was in the process of rapidbuilding of new disks or if the transport capability of thetotal IRBP in the IPM was limited to only slightly morethan the average requirement. In either case, this lowervalue would suggest that some of the IRBP haddeposited its retinoid and was returning to the RPEsurface empty-handed under the conditions observed byFong. It would be expected that the average IRBP loadwould be only a fraction of its maximum capacity.
4.6.2.3.7 The individual mechanisms ofretinoid transfer
This section appears here for continuity. It assumes the chromophores of vision are resonant retinoids,the Rhodonines, containing two atoms of oxygen separated by a conjugated carbon backbone.Justification for this assumption will be provided in Chapter 5.
It is useful to describe the topological aspects of retinol and the Rhodonines, their special characteristics in conformalchemistry and the special resonant properties of the Rhodonines. Starzak251 has addressed the problem of two differentcations attempting to bind to an organic molecule with two identical binding sites, Figure 4.6.2-16(a). The basicmolecule is shown in the center of the figure, single binding on the left, double binding on the right. The occurrence ofeach configuration is based on simple probability. In biologicals, the likelihood of occurrence is more complex.Enzymes require that a binding site have a precise topology. Furthermore, complex molecules may have a higher numberof sites. Retinol appears to have five identifiable sites. The least well defined site is the binding site of SRBP. Whenretinol is combined with SRBP, the combination is soluble. It is likely that this combination involves the hydrophobic,β−quinone, portion of the molecule. The hydroxyl ligand on the other end of the molecule makes an obvious binding

132 Processes in Biological Vision
Figure 4.6.2-16 Details of retinoid transport. (a),Different possible binding configurations when twodifferent cations, C1 & C2, compete for two identicalbinding sites. From Starzak (1984). (b) Retinol andits resonant derivatives, the Rhodonines
Figure 4.6.2-17 Steps in the transport of thechromophores from formation to point of end use.
site. In addition, each of the hydrogen and methine sites along the conjugated carbon chain can be considered anenzymatic target site. The sites at carbon #5, 7, 9 & 11 are special in that they correspond to the sites used in thechromophores of vision. These sites are compatible with extending the resonant structure of the conjugated carbon toinclude the polar atoms. Neglecting the site specific to SRBP, Figure 4.6.2-16(b) illustrates these sites. When site #15and any one of the above sites are both occupied by polar atoms, the structure becomes resonant. It is then a memberof the Rhodonine family of retinoids. These molecules are represented by the formula [O YC(YC YC)nYO]!. where thelocation of the β-quinone ring, and any non-resonant residual of the conjugated chain of retinol, is indicated by the boldbracket. The resonant bonds are indicated by the symbol Y. n indicates the number of vinylene groups present. Finally,the molecule carries a single delocalized negative charge.
In its ionized form, each of the Rhodonines is capable ofbinding with a protein at either of the polar atomlocations. The possibility that it may transition frombinding with one protein at one location to binding witha second at the other location allows for a simpledescription of the processing of retinol into thechromophores of vision. Figure 4.6.2-17 illustrates thispossibility in concept and without regard for the chargesinvolved. Addition of a hydrogen ion to either bindingsite would produce a neutral molecule.
The following conceptual equations involve the putativeproperties of the various binding proteins in-vivo, not asmeasured using a nonexclusive test procedure in-vitro.
(1) shows the resonant, but neutral, molecule. (2) showsthe Rhodonine combined with an enzyme capable oftransporting it along a diffusion gradient. (3) shows themolecule being passed from one enzyme to anothermaterial. If the second material is an organic acid, anester is formed that is easily stored. If the material is asecond enzyme on the other side of a cell wall, further transport may occur in a second diffusion gradient. Thus, (4) mayrepresent either a storage situation or a transportsituation. (5) represents the molecule in its neutral format its point of destination.
Assuming the above model of the retinoid loop and themethod of chromophore transport are correct, the partialequations in Table 4.6.2-2 are offered to explain how theloop operates. In these equations, the $-ionone ring of theretinoids is omitted for simplicity. Its presence isindicated by the bold bracket on the right of the formulas.The value of n can range from 2 to 5 and is indicative ofthe peak spectral absorption of the chromophore when inthe liquid crystalline state. 2 corresponds to the UV, 3 tothe S-, 4 to the M- and 5 to the L-channel chromophore.When n is 2 or 4, a methine, Me, on the conjugated chainof retinol has been replaced by an O; when n is 3 or 5, anH has been replaced by O. The bond symbol, Y ,indicates a resonant bond, sometimes thought of as 1.5bonds in a conjugate chain. The 1 symbol indicates ahydrogen bond or a temporary bond in transition.
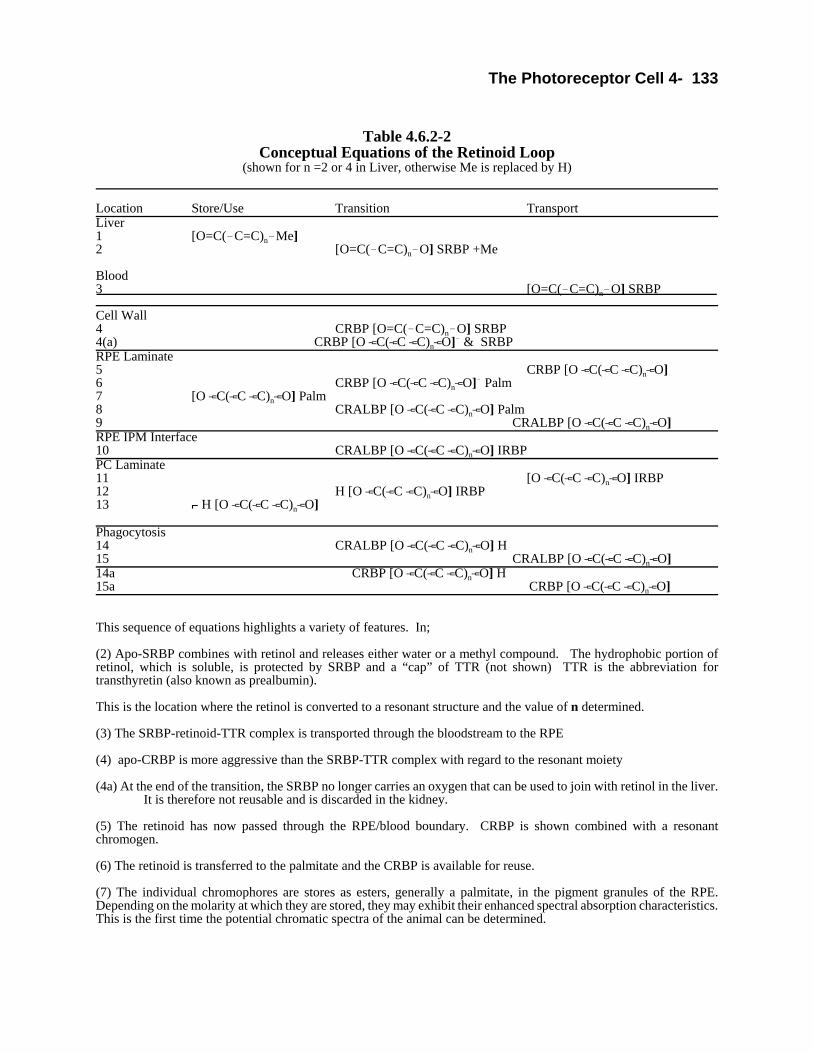
The Photoreceptor Cell 4- 133
Table 4.6.2-2Conceptual Equations of the Retinoid Loop
(shown for n =2 or 4 in Liver, otherwise Me is replaced by H)
Location Store/Use Transition TransportLiver1 [O=C(!C=C)n!Me]2 [O=C(!C=C)n!O] SRBP +Me
Blood3 [O=C(!C=C)n!O] SRBP Cell Wall4 CRBP [O=C(!C=C)n!O] SRBP 4(a) CRBP [O YC(YC YC)nYO]! & SRBP RPE Laminate5 CRBP [O YC(YC YC)nYO]6 CRBP [O YC(YC YC)nYO]! Palm7 [O YC(YC YC)nYO] Palm8 CRALBP [O YC(YC YC)nYO] Palm9 CRALBP [O YC(YC YC)nYO]RPE IPM Interface10 CRALBP [O YC(YC YC)nYO] IRBPPC Laminate11 [O YC(YC YC)nYO] IRBP12 H [O YC(YC YC)nYO] IRBP13 1 H [O YC(YC YC)nYO]
Phagocytosis14 CRALBP [O YC(YC YC)nYO] H15 CRALBP [O YC(YC YC)nYO]14a CRBP [O YC(YC YC)nYO] H15a CRBP [O YC(YC YC)nYO]
This sequence of equations highlights a variety of features. In;
(2) Apo-SRBP combines with retinol and releases either water or a methyl compound. The hydrophobic portion ofretinol, which is soluble, is protected by SRBP and a “cap” of TTR (not shown) TTR is the abbreviation fortransthyretin (also known as prealbumin).
This is the location where the retinol is converted to a resonant structure and the value of n determined.
(3) The SRBP-retinoid-TTR complex is transported through the bloodstream to the RPE
(4) apo-CRBP is more aggressive than the SRBP-TTR complex with regard to the resonant moiety
(4a) At the end of the transition, the SRBP no longer carries an oxygen that can be used to join with retinol in the liver.It is therefore not reusable and is discarded in the kidney.
(5) The retinoid has now passed through the RPE/blood boundary. CRBP is shown combined with a resonantchromogen.
(6) The retinoid is transferred to the palmitate and the CRBP is available for reuse.
(7) The individual chromophores are stores as esters, generally a palmitate, in the pigment granules of the RPE.Depending on the molarity at which they are stored, they may exhibit their enhanced spectral absorption characteristics.This is the first time the potential chromatic spectra of the animal can be determined.

134 Processes in Biological Vision
252Crouch, R. Chader, G. wiggert, B. & Pepperberg, D. (1996) Retinoids and the visual process. Photochem.& Photobiol. vol 64(4), pp. 613-621, specifically pg. 613253Morrison, R. & Boyd, R. (1971) Organic Chemistry, 2nd Ed. (tenth printing) Boston, MA: Allyn and Bacon.pg. 1046
(8) apo-CRALBP is more aggressive than the palmitate
(10) apo-IRBP is more aggressive than apo-CRALBP
(12) The chromophore is attracted to its place in the liquid crystal of the disk at the expense of IRBP.
(13) The chromophore exists on the surface of the disk in the liquid crystalline state. It is held to the substrate, opsin,by a hydrogen bond, i.e., the Van der Wall force.
(14) & (15) there are three options to deal with the chromophore during phagocytosis. (14) and (15) shows the pathwhen the material is to be used immediately by transfer to the IPM. Line (15) is identical to line (9). (14a) and (15a)shows the path when the material is to be returned to storage within the RPE. Line (15a) is identical to line (5). If thematerial is structurally damaged (possibly by UV or cosmic rays), it is no longer viable as a chromophore and it isdisposed of via the blood stream.
(14) apo-CRALBP is more aggressive than the liquid crystal.
(15) CRALBP complexed with the chromophore is ready to repeat step (10).
(14) apo-CRBP is more aggressive than the liquid crystal.
(15) CRBP complexed with the chromophore is ready to repeat step (6).
The fact that an all-trans-retinoid enters the RPE from both the IPM (at the apical surface) in step 15a and from thebloodstream (at the basal surface) in step 4a is consistent with the statement of Crouch, et. al. in 1996252. The onlydifference is that in this work, the actual material is all-trans-Rhodonine.
Crouch, et. al. presented a flow diagram that may be appropriate for a review article but is believed, based on this workand the above material, to be archaic and may lead to misinterpretations. Their figure 1 does not address many of themechanical aspects of chromogen transport and storage. It also does not address the transformation of retinol into fourseparate chromophores. Leaving this latter function to a group of four putative opsins appears unrealistic. Based onthese points, alternate flow diagrams should be considered.
This work has suggested that, for purposes of forming the chromophores of vision, there are two possible paths. Theformation of Rhodonine can occur within the RPE or it can occur within the process of transporting the retinoids to theRPE. The first method suggests elimination of a methyl or hydrogen from the retinoid and its replacement by oxygenat the RPE/bloodstream interface. This approach suggests there are at least two different forms of CRBP within the RPEand that these forms were destroyed in the process of conversion of the retinoid. The alternate approach would suggestthere are at least two different forms of SRBP within the bloodstream (possibly originating in the liver) and that theseforms were destroyed in the process of conversion of the retinoid. Since it is known that SRBP is not reused but isdecomposed in the kidney after use, it appears likely that post transport SRBP differs from the pre-transport SRBP andthis alternate approach is more likely. In this approach, the pre-transport apo-SRBP would provide an oxygen atom asthe coupling element in the process of forming the holo-SRBP. After reaching the bloodstream/RPE interface, thedecoupling would occur on the opposite side of the oxygen in the process of transferring the retinoid, now Rhodonine,to the initially apo-CRBP within the cell. The post-transport apo-SRBP is no longer viable, since it has lost an oxygenatom, and it is decomposed or excreted via the liver. This methodology is attractive if the removal of the methyl groupor hydrogen, and their replacement with an oxygen is realistic. Obviously, the replacement of the hydrogen is notdifficult. The replacement of the methyl group is more difficult. However, it is a known process among hydroaromaticcompounds such as the retinoids. Replacement of the methyl group would depend on the structure of the binding siteof the SRBP. If this site contained an oxygen, elimination of a so-called angular methyl group might be the avenue253.
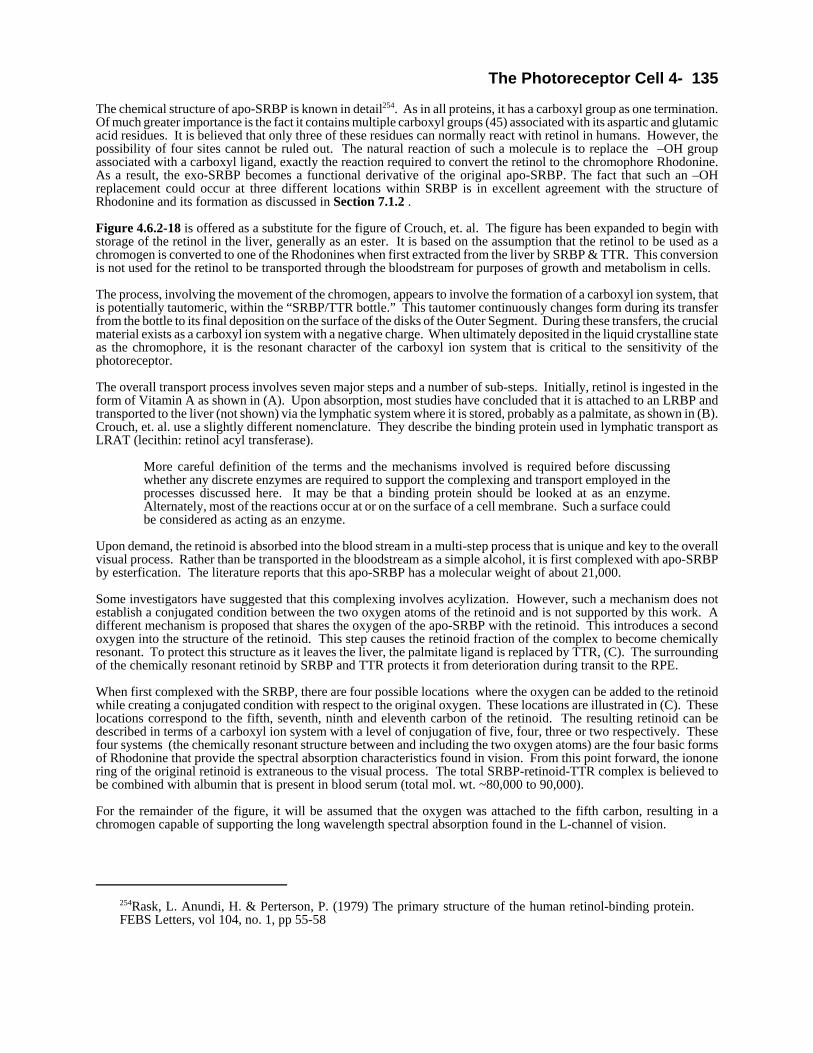
The Photoreceptor Cell 4- 135
254Rask, L. Anundi, H. & Perterson, P. (1979) The primary structure of the human retinol-binding protein.FEBS Letters, vol 104, no. 1, pp 55-58
The chemical structure of apo-SRBP is known in detail254. As in all proteins, it has a carboxyl group as one termination.Of much greater importance is the fact it contains multiple carboxyl groups (45) associated with its aspartic and glutamicacid residues. It is believed that only three of these residues can normally react with retinol in humans. However, thepossibility of four sites cannot be ruled out. The natural reaction of such a molecule is to replace the –OH groupassociated with a carboxyl ligand, exactly the reaction required to convert the retinol to the chromophore Rhodonine.As a result, the exo-SRBP becomes a functional derivative of the original apo-SRBP. The fact that such an –OHreplacement could occur at three different locations within SRBP is in excellent agreement with the structure ofRhodonine and its formation as discussed in Section 7.1.2 .
Figure 4.6.2-18 is offered as a substitute for the figure of Crouch, et. al. The figure has been expanded to begin withstorage of the retinol in the liver, generally as an ester. It is based on the assumption that the retinol to be used as achromogen is converted to one of the Rhodonines when first extracted from the liver by SRBP & TTR. This conversionis not used for the retinol to be transported through the bloodstream for purposes of growth and metabolism in cells.
The process, involving the movement of the chromogen, appears to involve the formation of a carboxyl ion system, thatis potentially tautomeric, within the “SRBP/TTR bottle.” This tautomer continuously changes form during its transferfrom the bottle to its final deposition on the surface of the disks of the Outer Segment. During these transfers, the crucialmaterial exists as a carboxyl ion system with a negative charge. When ultimately deposited in the liquid crystalline stateas the chromophore, it is the resonant character of the carboxyl ion system that is critical to the sensitivity of thephotoreceptor.
The overall transport process involves seven major steps and a number of sub-steps. Initially, retinol is ingested in theform of Vitamin A as shown in (A). Upon absorption, most studies have concluded that it is attached to an LRBP andtransported to the liver (not shown) via the lymphatic system where it is stored, probably as a palmitate, as shown in (B).Crouch, et. al. use a slightly different nomenclature. They describe the binding protein used in lymphatic transport asLRAT (lecithin: retinol acyl transferase).
More careful definition of the terms and the mechanisms involved is required before discussingwhether any discrete enzymes are required to support the complexing and transport employed in theprocesses discussed here. It may be that a binding protein should be looked at as an enzyme.Alternately, most of the reactions occur at or on the surface of a cell membrane. Such a surface couldbe considered as acting as an enzyme.
Upon demand, the retinoid is absorbed into the blood stream in a multi-step process that is unique and key to the overallvisual process. Rather than be transported in the bloodstream as a simple alcohol, it is first complexed with apo-SRBPby esterfication. The literature reports that this apo-SRBP has a molecular weight of about 21,000.
Some investigators have suggested that this complexing involves acylization. However, such a mechanism does notestablish a conjugated condition between the two oxygen atoms of the retinoid and is not supported by this work. Adifferent mechanism is proposed that shares the oxygen of the apo-SRBP with the retinoid. This introduces a secondoxygen into the structure of the retinoid. This step causes the retinoid fraction of the complex to become chemicallyresonant. To protect this structure as it leaves the liver, the palmitate ligand is replaced by TTR, (C). The surroundingof the chemically resonant retinoid by SRBP and TTR protects it from deterioration during transit to the RPE.
When first complexed with the SRBP, there are four possible locations where the oxygen can be added to the retinoidwhile creating a conjugated condition with respect to the original oxygen. These locations are illustrated in (C). Theselocations correspond to the fifth, seventh, ninth and eleventh carbon of the retinoid. The resulting retinoid can bedescribed in terms of a carboxyl ion system with a level of conjugation of five, four, three or two respectively. Thesefour systems (the chemically resonant structure between and including the two oxygen atoms) are the four basic formsof Rhodonine that provide the spectral absorption characteristics found in vision. From this point forward, the iononering of the original retinoid is extraneous to the visual process. The total SRBP-retinoid-TTR complex is believed tobe combined with albumin that is present in blood serum (total mol. wt. ~80,000 to 90,000).
For the remainder of the figure, it will be assumed that the oxygen was attached to the fifth carbon, resulting in achromogen capable of supporting the long wavelength spectral absorption found in the L-channel of vision.

136 Processes in Biological Vision
Figure 4.6.2-18 Overall scheme for retinoid transformation and transport (both chromogens andchromophores) in the visual cycle. The specific form of the retinoids participating in the process areshown on the left. In B, the oxygen of the SRBP can react at any one of four sites. The numerals inparentheses indicate the resulting individual levels of conjugation. See text for details. Compare toCrouch, et. al. (1996)
The Photoreceptor Cell 4- 137
255Edwards, R. & Adler, A. (1994) Exchange of retinol between IRBP and CRBP. Exp. Eye Res., fol. 59,pp.161-170
.
Upon arrival at the RPE interface, the TTR (on the outside of the membrane) is first released and replaced by apo-CRBPas the retinoid transitions through the RPE membrane. The SRBP is then released in a destructive manner. The oxygencontributed by the apo-SRBP stays with the retinoid as part of the carboxyl ion system. The modified material, nowdescribed as the exo-SRBP, is no longer functional and is removed from the bloodstream by the kidney. Valquist, et.al. described this exo-SRBP as lacking retinol and the normally encountered COOH-terminal amino acid and unable tobind to prealbumin (TTR). This description is consistent with this work. However, it may not be exhaustive in thatthere are such a large number of COOH ligands associated with this material (See Rask, et. al. above). Valquistdiscusses the relative concentration and production rates of these materials.
The holo-CRBP, CRBP + resonant retinoid shown in (D), now moves to one of four locations of temporary storage(the pigment granules) within the protected environment of the RPE cell. In a step that is not illustrated, the CRBPreleases the Rhodonine as it is converted into a palmitate within the granule. The CRBP is returned to a viable apo-CRBP condition for reuse.
When needed, the specific Rhodonines are extracted from the pigment granules by a binding protein known as CRALBP,a convenient name for a second RBP closely related to CRBP. The name was originally assigned based on theassumption that it preferred to bind to the aldehyde form of retinene. As indicated here, the AL in the label is essentiallymeaningless when used to describe a protein capable of binding to Rhodonine. This chromogen is a tautomer containingboth a keto- and enol- form at all times.
Crouch, et. al. discuss the relative affinity of IRBP and CRBP for all-trans retinol based on the paperof Edwards and Adler255. In the sequence developed here, IRBP and CRBP are never in competitionfor the chromogen. The chromogen of vision is no longer all-trans retinol after it leaves the liver.
By binding at C15, only one apo-CRALBP appears necessary to transport the four individual Rhodonines while withinthe RPE. At the RPE/IPM interface, a transfer is performed that is simpler than at the bloodstream/RPE interface. Atthe RPE/IPM interface, the Rhodonine is passed through the cell wall and is accepted by one of four IRBPs compatiblewith the slightly different location of the oxygen found along the backbone of the molecule nearest the ionone end ofthe molecule. This situation is shown in (E). The IRBP transports the Rhodonine( ) through the similarly protected IPMenvironment to its proper spectrally tailored Outer Segment. The complete Rhodonine molecule takes its properstereometric position as part of the liquid crystal on the surface of a newly formed disk. The IRBP is released in itsoriginal apo-IRBP form for reuse. The resultant condition of the chromophore (no longer a chromogen as a result of itsdeposition as part of a liquid crystal) is illustrated in the upper half of (F).
If IRBP is secreted by the photoreceptor cells, it is not difficult to accept the fact that eachphotoreceptor cell secretes one of four particular forms of IRBP and that form proceeds to theRPE/IPM interface and acquires a specific form of Rhodonine that it returns to the secretion cup ofits parent cell.
The most important feature of Rhodonine( ) in its stereometric configuration is the presence of the conjugated structureof the carboxyl ion system within its overall structure. When deposited on the disks in a liquid crystalline form as shownin the upper half of (F), this system is both physically resonant, and chemically resonant. As a result, the physicallyresonant structure is spectrally sensitive to a wavelength determined by the physical length of the carboxyl ion system.It can be excited by radiation with a Poynting vector parallel to the long axis of this structure. The requirement that thePoynting vector be parallel to the long axis of the chromophore is unique to the visual process. It introduces anabsorption spectrum that is highly anisotropic. This absorption spectrum peaks at a different wavelength than thatassociated with the normally isotropic absorption spectrum associated with the retinenes. In the retinenes, the nonphysically resonant structure between the ionone ring and the terminal oxygen associated with the fifteenth carbonexhibits a peak spectral wavelength at 500 nm when in the liquid crystalline condition. However, this absorptionspectrum is not usually used in the visual process. It is not the absorption spectrum responsible for the scotopicluminous efficiency function of the eye.
Besides the liquid crystalline system being both physically and chemically resonant, any electrons exited into an excited

138 Processes in Biological Vision
state of the system is highly delocalized. The excited form of the molecule when in the liquid crystalline state is shownin the lower half of (F). Upon excitation by a photon of the appropriate wavelength, an electron is excited and becomesan exciton. Furthermore, because of the nature of the liquid crystal, this exciton is delocalized and free to move withinthe physical dimensions of the excited state associated with the entire crystal. Excitons associated with dipolarchromophores of oxygen are usually very long lived because of a unique property of oxygen discussed in Chapter 5.They normally do not return to the unexcited state via fluorescence.
The unexcited n-electrons associated with a liquid crystal are also delocalized. This condition greatlyexpands the absorption cross-section of the material to radiation.
Although the above exciton will not will return to the unexcited state via fluorescence, it is easily de-excited upontransfer of its excess energy to another suitable medium. Such a transfer occurs at the dendritic surface of thephotoreceptor cell associated with the disk. As a result, the electron is instantly returned to the unexcited state withinthe overall liquid crystal and it is immediately available for re-excitation by another photon.
Several experimenters have attempted to measure the excitation time of visual chromophores. The experiment isdifficult. However, the process is known from quantum physics to occur in less than a picosecond. The de-excitationprocess is similarly rapid. The time-consuming portion of the overall process is the transfer of the exciton from itslocation of creation to its location of de-excitation. This usually takes 1-3 milliseconds at biological temperatures asdiscussed in detail in Appendix A as part of the Photoexcitation/De-excitation process. Once de-excited, the electronrejoins a large pool of unexcited n-electrons associated with the liquid crystal.
The process represented by the two halves of (F) involves no consumption of materials or physical changes of state.Every non excited electron, or n-electron, of the liquid crystal is available for excitation by a photon at any time. Onceexcited, it is normally de-excited within milliseconds and immediately available for absorption of another photon. Noisomerization or physical transport of ions is required prior to reuse of the chromophore.
The process illustrated in (F) can continue as long as the disk is viable and associated with a de-excitation mechanismsuch as provided by the dendrites of the cell. However, as part of the life cycle of the overall system, the process hasa specific limitation. After a nominal one week in the case of human, the disk containing the Rhodonine(n ) moleculeshave traveled from their point of formation in the Inner Segment extrusion cup to the RPE where phagocytosis occurs.During phagocytosis, the disks and their liquid crystalline coating are disassembled at the molecular level. TheRhodonine(n ) is recovered as illustrated in (G). A majority of the Rhodonine is recaptured by either CRBP or CRALBPdepending on whether it is to be returned to storage within the RPE or whether it is to be transferred immediately to IRBPat the RPE/IPM interface.
This alternative to the presentation of Crouch, et. al. appears to satisfy significantly more technical requirements thanaddressed in their Figure 1. It is:
+ consistent with the fact that SRBP is not reused.
+ consistent with the observation that the genetic code assigned to IRBP shows a fourfold replication that could beresponsible for four separate IRBP molecules or for one IRBP molecule with four distinct binding sites.
+ consistent with photo-chemistry in providing the correct spectral characteristics found in vision.
This alternative does not require:
+ the presence of any enzymes beyond the retinoid binding proteins themselves.
+ the re-isomerization of a molecule following its excitation and subsequent isomerization.
+ the long time period of incapacitation associated with the re-isomerization of a molecule at a location removed fromits point of initial excitation.
The above equation set does not use CRABP. In the literature, CRABP is claimed to only associate with retinoic{retinoid} acid and no retinoic acid is used in the chromophore manufacturing process.
As noted in an earlier chapter, the structure of the Rhodonines is unique. The conjugated carbon chain of the moleculewith an oxygen atom on each end has many of the properties of an acid of retinal. In the limiting case, where n=0, (and

The Photoreceptor Cell 4- 139
256 Dowling, J. & Wald, G. (1958) Proc. Natl. Acad. Sci. U.S.A. vol. 44, pg. 648257Bernstein, P. Law, W & Rando, R. (1987) Biochemical characterization of the retinoid isomerase system ofthe eye J. Biol. Chem. Vol. 262, no. 35, pp 16848-16857
ignoring the stabilizing β-ionone ring) these molecules become formic acid. In the general case, the conjugated carbonchain of the Rhodonines may be able to act much like a single carbon atom as far as forming a functional group isconcerned.
These equations are intellectually satisfying since they; + provide a consistent and simple set of formula that describes the operation of the “chemical” part of the
retinoid loop, + use the various enzymes in the portions of the loop where they are known to exist, + do not require unreasonable transport velocities for the materials in the loop+ are consistent with the findings of Dowling & Wald concerning Vitamin A deprivation256
+ involve no difficult energy problems such as those that have always plagued the all-trans- to 11 cis- conversion in the current theory of the simple retinenes, and + do not conflict with the literature if:
++ the terms used to describe the retinene family can be stretched to include one of the other subsetsof the retinoid family, the dual auxochrome molecules– the Rhodonines.++ CRABP is not needed in this loop or the capabilities of CRABP are found to include
binding to the chromophores in their “conjugated retinoid acid” form.++ the Rhodonines can be considered “conjugated retinoid acids” for the purpose of forming esters.
Bernstein, Law & Rando257 have presented results where they dual-labeled the fifteenth carbon of all-trans-retinol with14C and 3H. They came to several conclusions that appear consistent with the above discussion. They concluded:
+ The chemical manipulations they carried out did not disturb the presence of the tritiated hydrogen in the retinoidsinvolved.
+ All-trans-retinol was processed into large amounts of all-trans-retinyl palmitate in the RPE of amphibians.
+ Appreciable quantities of all detergents tested interfered with their experimental results.
+ Free all-trans-Retinaldehyde is not the substrate used by their putative isomerase.
+ All-trans-Retinyl Esters are not directly isomerized to 11-cis-Retinyl Esters.
The most interesting of their conclusions is the creation of large amounts of what they call all-trans-retinyl palmitatewithin the RPE. It is proposed that this material was actually all-trans-rhodonine palmitate (the retinoid contained twoauxochromes at this stage) in one of its four chromogenic forms prior to being transported to the Outer Segments of theretina.
4.6.3 Other aspects of metabolic dynamics of photoreceptors
This work does not recognize any chemical dynamics, such as isomeric changes, related to the photodetection process.However, there are a variety of important mechanisms and processes that do cause changes on a time scale of secondsand longer. Some of these involve physical changes and others can involve chemical kinetics. They fall into two maincategories as described above, the formation of the protein-based disk substrates and the activation of those substratesthrough the coating with a Rhodonine. Section 4.6.2.3 reviews the excellent research data available from isotopetagging. That data is consistent with the mechanisms defined in this work. In some cases, the interpretation of the datais quite different from that of the original authors.
4.6.3.1 Additional details relative to SRBP
The participation of SRBP, and the other RBPs, in the visual process appears more complicated than described in variousindividual papers. In order to understand their overall participation, considerable semantic precision is required whendiscussing the metabolites used in the retinoid loop. Clear distinctions need to be made between the holo- and apo-forms of the various transport proteins. Section 7.1.1.2.3 develops a broader framework for these terms. Section 7.1.2
140 Processes in Biological Vision
258Goodman, D. (1984) op. cit. pp. 41259Valquist, A. Peterson, P. & Wibell, L. (1973) Metabolism of the Vitamin A transporting protein complex.Europ. J. Clin. Invest. vol. 3, pp 352-362 260Bridges, C. Yoshikawa, S. (1969) Op. Cit.261O’Day, W. & Young, R. (1978) Rhythmic daily shedding of outer-segment membranes by visual cells in thegoldfish. J. Cell Biol. vol. 76, pp 593-604262Dowling, J. & Wald, G. (1958) Vitamin A deficiency and night blindness, J. Nat. Acad. Sci., vol. 44, pp. 648-661263Ganguly, J. (1989) Op. Cit.264Dowling, J. & Wald, G. (1960) Role of Vitamin A Acid in Vitamins & Hormones. In Vitamins andHormones, Edited by Harris, R. & Ingle, D. NY: Academic Press vol. 18 pp. 536-537
develops the chemistry of the SRBP much more fully than here.
The discussion regarding SRBP in Ganguly will be used as an example. In 1989, Ganguly, referencing Valquist, spokeof the biological half life of RBP (SRBP) in human as approximately 11.1 to 11.7 hours. Expanding the discussion toinclude the various conditions of RBP, it becomes clear that the above time interval applies to the life cycle of apo-SRBPafter delivery of its retinoid to the RPE cells. This material might better be labeled exo-SRBP. SRBP in this conditionhas completed its metabolic role and is subject to removal from the bloodstream by the kidney. There are four conditionsneeding analysis with regard to SRBP; pre-transport apo-SRBP, holo-SRBP without TTR and holo-SRBP with TTR andpost-transport apo-SRBP (exo-SRBP). TTR is the abbreviation for transthyretin. Goodman258 provides extensivematerial on the complete holo SRBP complex.
The SRBP-retinol- TTR combination is believed to consist of a 1:1:1 molar complex. Although Ganguly says changingthe functional end group of retinol does not affect the efficiency of binding to the apo-protein, Ong says this is only truein-vitro. He says only retinol (and only all-trans retinol) binds to SRBP in-vivo.
When released from the liver, the complete complex probably has a very long lifetime compared to apo-SRBP.Valquist259 is a source of data in this area.
Two time intervals are not well documented. First is the time required between the arrival of SRBP-R-TTR complexat the RPE cell and when a chromophore becomes available at the RPE cell IPM interface for use, or arrives at thepigment granules for long term storage. Second is the time for the chromophore to transit from the RPE cell IPMinterface to the IS/OS junction area.
This loop can operate continuously for the life of the organism without difficulty. It is completely consistent with theknown locations of the various binding proteins. CRAIBP does not appear to participate directly in the chromophoreforming process. The presence of a small amount of CRAIBP in the IS would not be surprising since it appearsthroughout the body and is widely used to support cell nutrition/metabolism.
4.6.3.2 Putative diurnal secretion and absorption by the outer segment
Both Bridges & Yoshikawa260 and O’Day & Young261 addressed the possibility that the extrusion of protein disks and/orthe coating of those disks might occur with a diurnal variation. The total available data is not large. Firm conclusionsmay not be warranted. Bridges & Yoshikawa found little evidence suggesting a diurnal variation in the rate of coatingof the disks in rats. O’Day & Young addressed the question in goldfish where they found a more statistically significantvariation. However, their definition of rods and cones was based strictly on morphology. Their figure 1 assumes aconsiderable movement of the cells by the myoid that does not appear to be compatible with the optical requirementsof the lens system of the eye. The “cone” in their figure 7 has a distinctly hour-glass shape. More experimental work,based on a stronger model, is needed in this area.
4.6.3.3 Vitamin A stress and starvation
Dowling & Wald262 provided Figure 4.6.3-1 in a day when it was thought there was only one biological form showingthe “growth factor” property associated with Vitamin A. Since then, a number of retinoids have been isolated withhormonal properties. Ganguly263 provides a comprehensive source. Dowling performed experiments that led to areinterpretation of the above figure. Dowling & Wald264 showed that animals deprived of Vitamin A but supplementedwith retinoic acid continued to develop but their vision degenerated. This was due primarily to changes in the OS. Thus,the loss of opsin in the above figure can be ameliorated by the presence of retinoic acid in the diet. However, retinoic
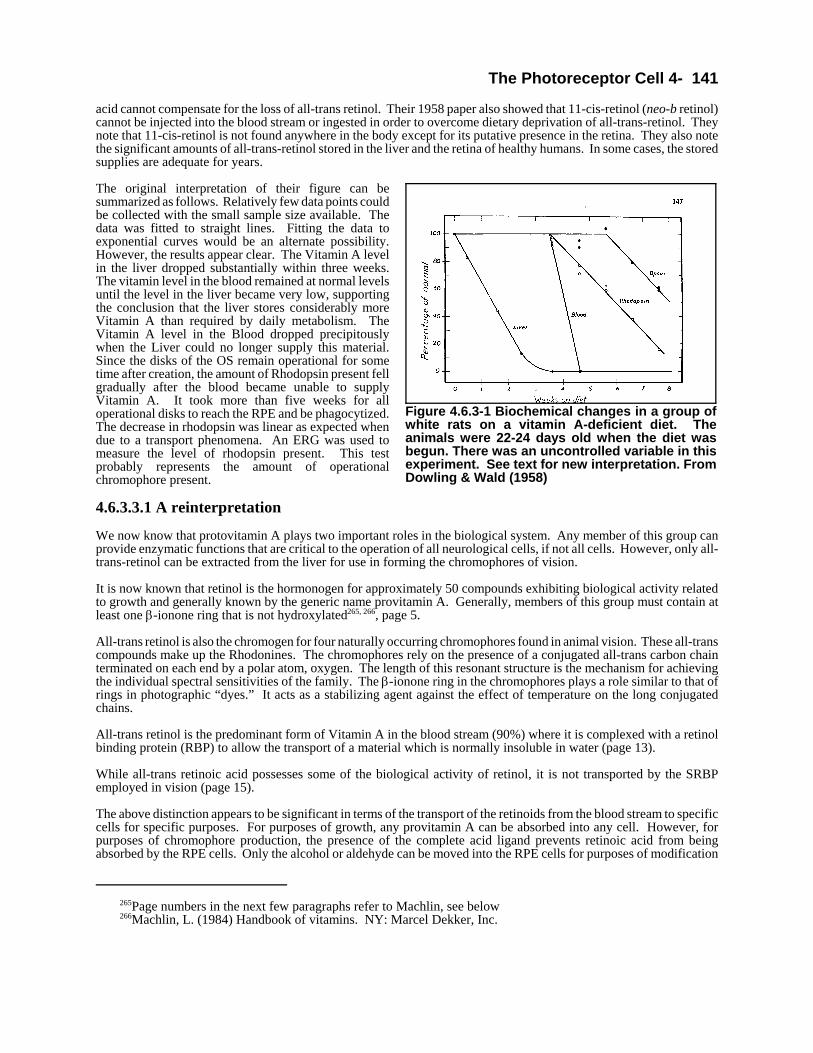
The Photoreceptor Cell 4- 141
265Page numbers in the next few paragraphs refer to Machlin, see below266Machlin, L. (1984) Handbook of vitamins. NY: Marcel Dekker, Inc.
Figure 4.6.3-1 Biochemical changes in a group ofwhite rats on a vitamin A-deficient diet. Theanimals were 22-24 days old when the diet wasbegun. There was an uncontrolled variable in thisexperiment. See text for new interpretation. FromDowling & Wald (1958)
acid cannot compensate for the loss of all-trans retinol. Their 1958 paper also showed that 11-cis-retinol (neo-b retinol)cannot be injected into the blood stream or ingested in order to overcome dietary deprivation of all-trans-retinol. Theynote that 11-cis-retinol is not found anywhere in the body except for its putative presence in the retina. They also notethe significant amounts of all-trans-retinol stored in the liver and the retina of healthy humans. In some cases, the storedsupplies are adequate for years.
The original interpretation of their figure can besummarized as follows. Relatively few data points couldbe collected with the small sample size available. Thedata was fitted to straight lines. Fitting the data toexponential curves would be an alternate possibility.However, the results appear clear. The Vitamin A levelin the liver dropped substantially within three weeks.The vitamin level in the blood remained at normal levelsuntil the level in the liver became very low, supportingthe conclusion that the liver stores considerably moreVitamin A than required by daily metabolism. TheVitamin A level in the Blood dropped precipitouslywhen the Liver could no longer supply this material.Since the disks of the OS remain operational for sometime after creation, the amount of Rhodopsin present fellgradually after the blood became unable to supplyVitamin A. It took more than five weeks for alloperational disks to reach the RPE and be phagocytized.The decrease in rhodopsin was linear as expected whendue to a transport phenomena. An ERG was used tomeasure the level of rhodopsin present. This testprobably represents the amount of operationalchromophore present.
4.6.3.3.1 A reinterpretation
We now know that protovitamin A plays two important roles in the biological system. Any member of this group canprovide enzymatic functions that are critical to the operation of all neurological cells, if not all cells. However, only all-trans-retinol can be extracted from the liver for use in forming the chromophores of vision.
It is now known that retinol is the hormonogen for approximately 50 compounds exhibiting biological activity relatedto growth and generally known by the generic name provitamin A. Generally, members of this group must contain atleast one β-ionone ring that is not hydroxylated265, 266, page 5.
All-trans retinol is also the chromogen for four naturally occurring chromophores found in animal vision. These all-transcompounds make up the Rhodonines. The chromophores rely on the presence of a conjugated all-trans carbon chainterminated on each end by a polar atom, oxygen. The length of this resonant structure is the mechanism for achievingthe individual spectral sensitivities of the family. The β-ionone ring in the chromophores plays a role similar to that ofrings in photographic “dyes.” It acts as a stabilizing agent against the effect of temperature on the long conjugatedchains.
All-trans retinol is the predominant form of Vitamin A in the blood stream (90%) where it is complexed with a retinolbinding protein (RBP) to allow the transport of a material which is normally insoluble in water (page 13).
While all-trans retinoic acid possesses some of the biological activity of retinol, it is not transported by the SRBPemployed in vision (page 15).
The above distinction appears to be significant in terms of the transport of the retinoids from the blood stream to specificcells for specific purposes. For purposes of growth, any provitamin A can be absorbed into any cell. However, forpurposes of chromophore production, the presence of the complete acid ligand prevents retinoic acid from beingabsorbed by the RPE cells. Only the alcohol or aldehyde can be moved into the RPE cells for purposes of modification
142 Processes in Biological Vision
267Ong, D. (1985) Vitamin A-binding proteins. Nutrition Reviews, vol. 43, no. 8, pg.225-230
into a chromophore.
This background supports a reinterpretation of the figure by Dowling & Wald. The original caption was not specificas to the form of Vitamin A involved. While any type of protovitamin A could lead to the levels of vitamin A in the liverand the blood shown, and could account for the amount of opsin present, this is not true for the chromophoric material.Only Vitamin A in the form of retinol can be extracted from the liver for use in the chromophores of vision. Thus, thecurve labeled rhodopsin is only a function of the amount of retinol in the diet. This curve should be renamedchromophore or Rhodonine as it is specific to the amount of chromophore present and is not directly related to theamount of opsin present. The reduction in the chromophore content was determined via an ERG. The curve is mostindicative of the inability of the RPE to extract the chromogen retinol from the blood stream (due to its low concentrationin the blood) and deliver the chromophore to the OS.
The last line, the presence of the structural protein substrate of the disks, opsin, requires careful interpretation. It iscorrect if the animals are deprived of all members of the provitamin A group. Under this condition, the photoreceptorcells are deprived of the “growth factor” provided by provitamin A and needed to produce new substrates. Thisdeprivation applies to all cells of the animal and it dies relatively quickly. Alternatively, if the animal is provided anotherprovitamin A, retinoic acid as an example, instead of retinol, the animal is able to maintain general growth and disksubstrate production. However, the animal still becomes blind because retinoic acid is not transported through the bloodby SRBP and it cannot support the production in the RPE of the chromophores required for vision.
These facts lead to the understanding that retinal and retinol, along with other retinoids like retinoic acid, play asignificant hormonal role. However, it appears that only retinol is transported to the cells of the retina, from the liver,for purposes of chromophore creation.267
4.6.4 Potential fuscin buildup leading to macular dystrophy
The RPE-photoreceptor interface is very complicated from a chemical transport perspective as well as how itaccommodates phagocytosis. The potential for debris (known as fuscin) to accumulate in this area is considerable. Suchaccumulation may lead to macular dystrophy (Section 18.8.9). It is important to differentiate between fuscin buildupin the RPE-photoreceptor interface and druscin buildup in the choroid-Bruch’s membrane interface (Section 7.1.2).
The interface between the RPE and the photoreceptors (Section 4.5) is a highly isolated region designed to preventoxidizers from the blood stream and elsewhere from entering the inter-photoreceptor matrix (IPM).
4.7 Operation of the photoreceptor in signaling (Electrical dynamics)
Based on the above histological, cytological and quantum level analysis, the operation of the photoreceptors in the visualprocess is seen to be more complicated than generally viewed. But these additional complications at the cytological levelare primarily associated with the metabolic and growth processes in and near the photoreceptor cell.
The photoreceptor cell plays a unique and uniquely integrated role in vision. The role is entirely characterized by itselectrolytic characteristics. It includes the individual functions of photosensing, signal amplification and stabilization,and current to voltage conversion. The photosensing mechanism is usually subdivided into one of transduction of lightinto excited but bound electrons followed by the conversion of these excited electrons into free electrons constitutinga current. The amplification and stabilization mechanism is designed to accept an extremely wide dynamic range inputsignal and produce a nominally constant output signal amplitude. This constancy is in terms of both the DC and ACcomponents of the signal. The current-to-voltage conversion mechanism is critical in the signal distribution role of thephotoreceptor cell. This mechanism allows the cell to distribute the signal to multiple orthodromic amplifiers withoutsharing the limited current available between them.
This work is based on the electrolytic signaling theory of vision. It does not support the biochemical signaling theoryof vision. The biochemical theory is still highly conceptual and very complex with multiple authors providing multiplechemical paths to the generation of a signal. None of these biochemical approaches provides a mathematically definedavenue to the creation of an electrical signal, much less the precise description of the luminous efficiency function orthe dark adaptation function of human vision. They remain conceptual in the absence of the electrolytic theory presented
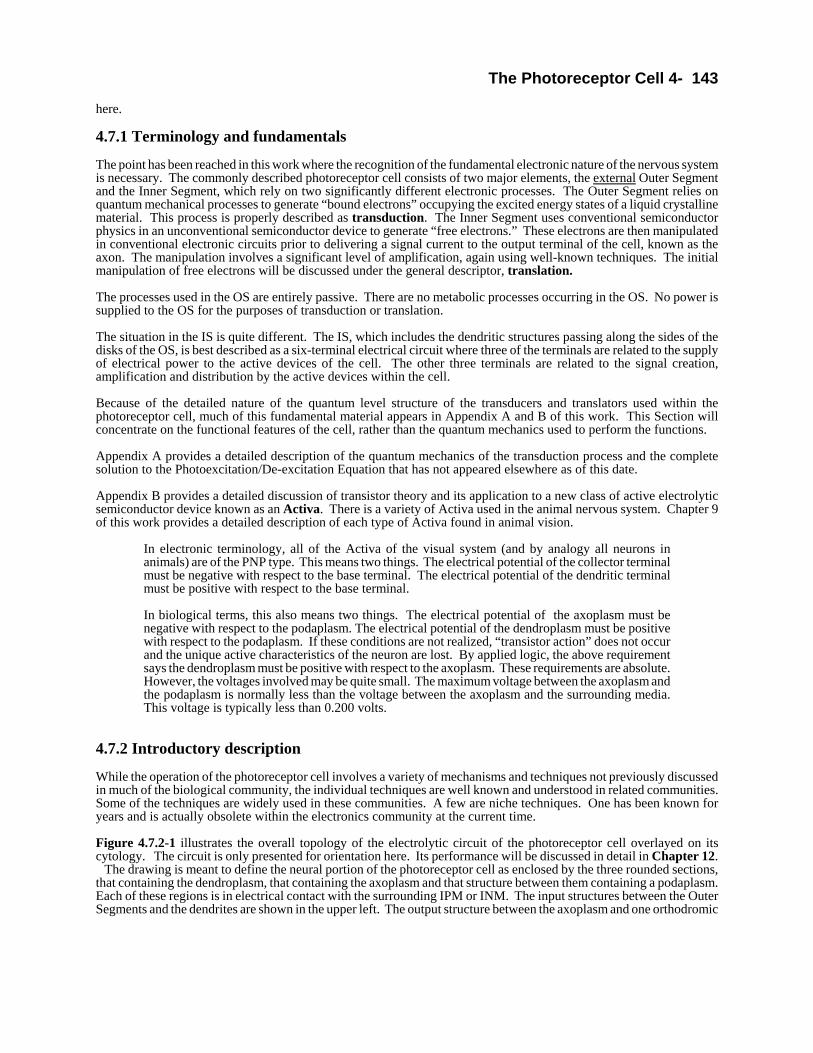
The Photoreceptor Cell 4- 143
here.
4.7.1 Terminology and fundamentals
The point has been reached in this work where the recognition of the fundamental electronic nature of the nervous systemis necessary. The commonly described photoreceptor cell consists of two major elements, the external Outer Segmentand the Inner Segment, which rely on two significantly different electronic processes. The Outer Segment relies onquantum mechanical processes to generate “bound electrons” occupying the excited energy states of a liquid crystallinematerial. This process is properly described as transduction. The Inner Segment uses conventional semiconductorphysics in an unconventional semiconductor device to generate “free electrons.” These electrons are then manipulatedin conventional electronic circuits prior to delivering a signal current to the output terminal of the cell, known as theaxon. The manipulation involves a significant level of amplification, again using well-known techniques. The initialmanipulation of free electrons will be discussed under the general descriptor, translation.
The processes used in the OS are entirely passive. There are no metabolic processes occurring in the OS. No power issupplied to the OS for the purposes of transduction or translation.
The situation in the IS is quite different. The IS, which includes the dendritic structures passing along the sides of thedisks of the OS, is best described as a six-terminal electrical circuit where three of the terminals are related to the supplyof electrical power to the active devices of the cell. The other three terminals are related to the signal creation,amplification and distribution by the active devices within the cell.
Because of the detailed nature of the quantum level structure of the transducers and translators used within thephotoreceptor cell, much of this fundamental material appears in Appendix A and B of this work. This Section willconcentrate on the functional features of the cell, rather than the quantum mechanics used to perform the functions.
Appendix A provides a detailed description of the quantum mechanics of the transduction process and the completesolution to the Photoexcitation/De-excitation Equation that has not appeared elsewhere as of this date.
Appendix B provides a detailed discussion of transistor theory and its application to a new class of active electrolyticsemiconductor device known as an Activa. There is a variety of Activa used in the animal nervous system. Chapter 9of this work provides a detailed description of each type of Activa found in animal vision.
In electronic terminology, all of the Activa of the visual system (and by analogy all neurons inanimals) are of the PNP type. This means two things. The electrical potential of the collector terminalmust be negative with respect to the base terminal. The electrical potential of the dendritic terminalmust be positive with respect to the base terminal.
In biological terms, this also means two things. The electrical potential of the axoplasm must benegative with respect to the podaplasm. The electrical potential of the dendroplasm must be positivewith respect to the podaplasm. If these conditions are not realized, “transistor action” does not occurand the unique active characteristics of the neuron are lost. By applied logic, the above requirementsays the dendroplasm must be positive with respect to the axoplasm. These requirements are absolute.However, the voltages involved may be quite small. The maximum voltage between the axoplasm andthe podaplasm is normally less than the voltage between the axoplasm and the surrounding media.This voltage is typically less than 0.200 volts.
4.7.2 Introductory description
While the operation of the photoreceptor cell involves a variety of mechanisms and techniques not previously discussedin much of the biological community, the individual techniques are well known and understood in related communities.Some of the techniques are widely used in these communities. A few are niche techniques. One has been known foryears and is actually obsolete within the electronics community at the current time.
Figure 4.7.2-1 illustrates the overall topology of the electrolytic circuit of the photoreceptor cell overlayed on itscytology. The circuit is only presented for orientation here. Its performance will be discussed in detail in Chapter 12. The drawing is meant to define the neural portion of the photoreceptor cell as enclosed by the three rounded sections,that containing the dendroplasm, that containing the axoplasm and that structure between them containing a podaplasm.Each of these regions is in electrical contact with the surrounding IPM or INM. The input structures between the OuterSegments and the dendrites are shown in the upper left. The output structure between the axoplasm and one orthodromic
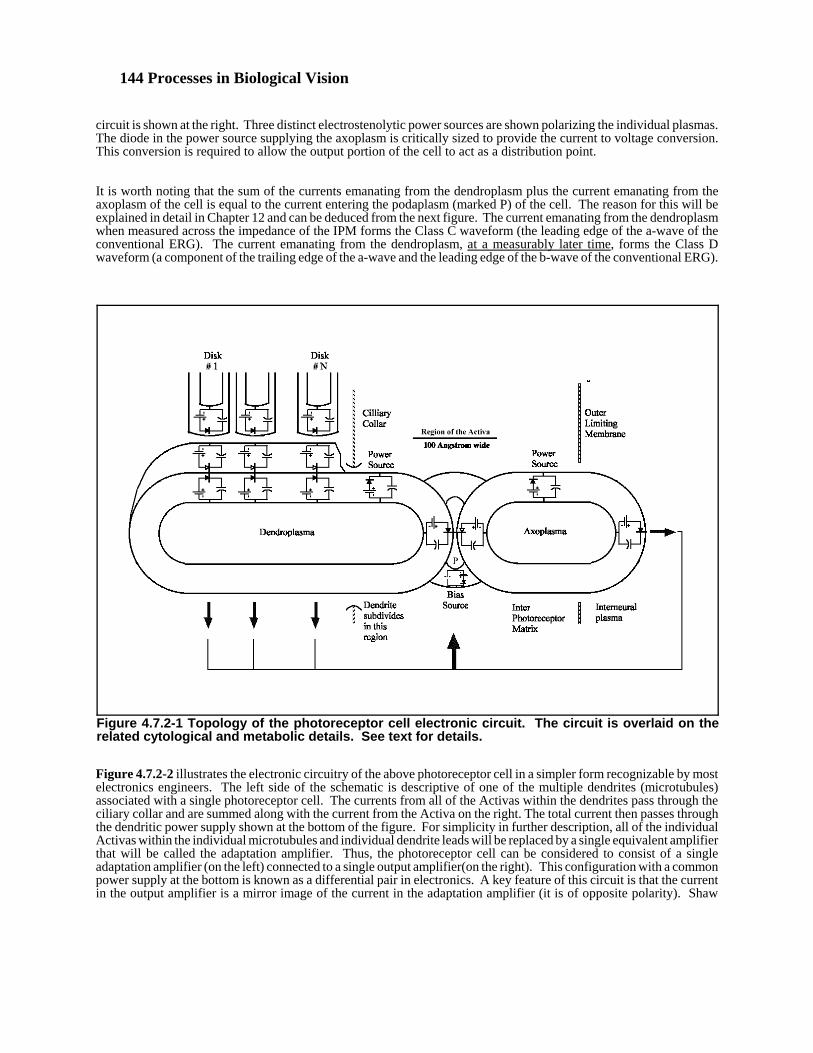
144 Processes in Biological Vision
Figure 4.7.2-1 Topology of the photoreceptor cell electronic circuit. The circuit is overlaid on therelated cytological and metabolic details. See text for details.
circuit is shown at the right. Three distinct electrostenolytic power sources are shown polarizing the individual plasmas.The diode in the power source supplying the axoplasm is critically sized to provide the current to voltage conversion.This conversion is required to allow the output portion of the cell to act as a distribution point.
It is worth noting that the sum of the currents emanating from the dendroplasm plus the current emanating from theaxoplasm of the cell is equal to the current entering the podaplasm (marked P) of the cell. The reason for this will beexplained in detail in Chapter 12 and can be deduced from the next figure. The current emanating from the dendroplasmwhen measured across the impedance of the IPM forms the Class C waveform (the leading edge of the a-wave of theconventional ERG). The current emanating from the dendroplasm, at a measurably later time, forms the Class Dwaveform (a component of the trailing edge of the a-wave and the leading edge of the b-wave of the conventional ERG).
Figure 4.7.2-2 illustrates the electronic circuitry of the above photoreceptor cell in a simpler form recognizable by mostelectronics engineers. The left side of the schematic is descriptive of one of the multiple dendrites (microtubules)associated with a single photoreceptor cell. The currents from all of the Activas within the dendrites pass through theciliary collar and are summed along with the current from the Activa on the right. The total current then passes throughthe dendritic power supply shown at the bottom of the figure. For simplicity in further description, all of the individualActivas within the individual microtubules and individual dendrite leads will be replaced by a single equivalent amplifierthat will be called the adaptation amplifier. Thus, the photoreceptor cell can be considered to consist of a singleadaptation amplifier (on the left) connected to a single output amplifier(on the right). This configuration with a commonpower supply at the bottom is known as a differential pair in electronics. A key feature of this circuit is that the currentin the output amplifier is a mirror image of the current in the adaptation amplifier (it is of opposite polarity). Shaw
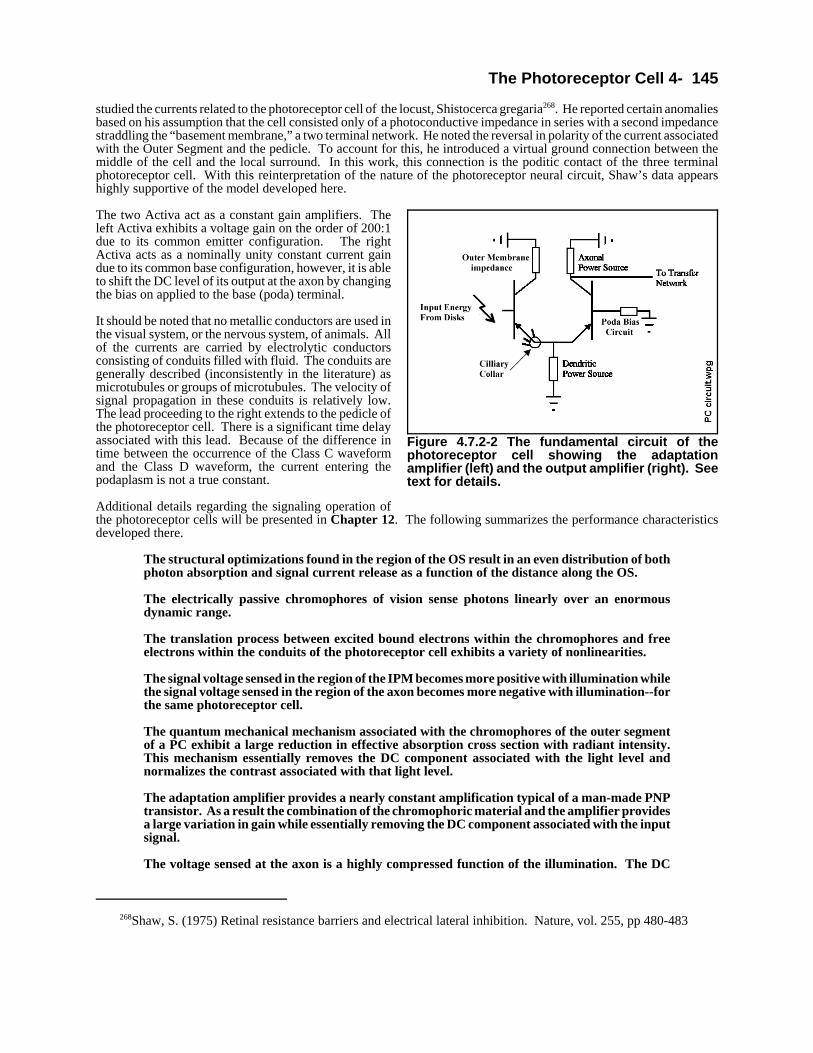
The Photoreceptor Cell 4- 145
268Shaw, S. (1975) Retinal resistance barriers and electrical lateral inhibition. Nature, vol. 255, pp 480-483
Figure 4.7.2-2 The fundamental circuit of thephotoreceptor cell showing the adaptationamplifier (left) and the output amplifier (right). Seetext for details.
studied the currents related to the photoreceptor cell of the locust, Shistocerca gregaria268. He reported certain anomaliesbased on his assumption that the cell consisted only of a photoconductive impedance in series with a second impedancestraddling the “basement membrane,” a two terminal network. He noted the reversal in polarity of the current associatedwith the Outer Segment and the pedicle. To account for this, he introduced a virtual ground connection between themiddle of the cell and the local surround. In this work, this connection is the poditic contact of the three terminalphotoreceptor cell. With this reinterpretation of the nature of the photoreceptor neural circuit, Shaw’s data appearshighly supportive of the model developed here.
The two Activa act as a constant gain amplifiers. Theleft Activa exhibits a voltage gain on the order of 200:1due to its common emitter configuration. The rightActiva acts as a nominally unity constant current gaindue to its common base configuration, however, it is ableto shift the DC level of its output at the axon by changingthe bias on applied to the base (poda) terminal.
It should be noted that no metallic conductors are used inthe visual system, or the nervous system, of animals. Allof the currents are carried by electrolytic conductorsconsisting of conduits filled with fluid. The conduits aregenerally described (inconsistently in the literature) asmicrotubules or groups of microtubules. The velocity ofsignal propagation in these conduits is relatively low.The lead proceeding to the right extends to the pedicle ofthe photoreceptor cell. There is a significant time delayassociated with this lead. Because of the difference intime between the occurrence of the Class C waveformand the Class D waveform, the current entering thepodaplasm is not a true constant.
Additional details regarding the signaling operation ofthe photoreceptor cells will be presented in Chapter 12. The following summarizes the performance characteristicsdeveloped there.
The structural optimizations found in the region of the OS result in an even distribution of bothphoton absorption and signal current release as a function of the distance along the OS.
The electrically passive chromophores of vision sense photons linearly over an enormousdynamic range.
The translation process between excited bound electrons within the chromophores and freeelectrons within the conduits of the photoreceptor cell exhibits a variety of nonlinearities.
The signal voltage sensed in the region of the IPM becomes more positive with illumination whilethe signal voltage sensed in the region of the axon becomes more negative with illumination--forthe same photoreceptor cell.
The quantum mechanical mechanism associated with the chromophores of the outer segmentof a PC exhibit a large reduction in effective absorption cross section with radiant intensity.This mechanism essentially removes the DC component associated with the light level andnormalizes the contrast associated with that light level.
The adaptation amplifier provides a nearly constant amplification typical of a man-made PNPtransistor. As a result the combination of the chromophoric material and the amplifier providesa large variation in gain while essentially removing the DC component associated with the inputsignal.
The voltage sensed at the axon is a highly compressed function of the illumination. The DC

146 Processes in Biological Vision
component of the signal is almost completely removed and the AC component is of nearlyconstant amplitude.
Both the current and the voltage at the axon conduit are functions of the illumination that areaccurately described mathematically by this model.
The neural circuits proximal to the pedicles of the photoreceptor cells operate in a constantamplitude large signal mode.
All signaling prior to the ganglion cells occurs in the analog mode. There are no actionpotentials (monopulse oscillations) associated with signal sensing or signal manipulation. Actionpotentials are introduced by the ganglion cells prior to signal projection to the brain.
4.7.3 Variations in photoreceptors
4.7.3.1 Variations related to color vision
Up to this point in the development of the model, it has not been necessary to hypothecate any variation in the operationof the photoreceptors to account for photopic, scotopic or other variations of a spectral nature in the operation of aphotoreceptor. A little ground work was laid that will have a significant impact on the performance of the longwavelength sensitive photoreceptors. This will become much clearer when the mathematical portion of this work isreached. The conclusion is that the only functional difference between the photoreceptors of animal vision relates to theparticular chromophore glazing the protein substrates of the Outer Segments. The only measurable and spectralperformance related physical difference between photoreceptors in retinas of Chordata is in the spacing between theauxochromes of the chromophores glazing the protein substrates. This difference can be measured using highmagnification electron-microscopy. Neglecting the large mass of the auxochromes, their physical spacings would beexpected to range from about five Angstrom for Rhodonine(11) operating at 342 nm in the ultraviolet to about twelveAngstrom for Rhodonine(5) operating at 625 nm. As noted in Section 4.3.4, the actual spacing between the centers ofmass is reported as 40 Angstrom for an unspecified chromophore. All other morphological differences are for purposesof efficient packaging and appropriate output signal distribution.
4.7.3.2 Variations related to routine growth
Up to this point in the development of the model, it has not been necessary to hypothecate any variation in the operationof the photoreceptors to account for photopic, scotopic or other variations of a spectral nature in the growth of aphotoreceptor. This is because the differences involved are basically related to the detailed makeup and stereo-chemistryof the chromophoric molecules.
4.7.3.3 Variations related to retinal position
There are three significant variations in photoreceptors relative to retinal position. The most significant variation is inthe shear-angle between the Outer Segment (and the adjacent portion of the Inner Segment) and the tangent to the surfaceof the retina at the RPE/choroid interface. This shear-angle is established to maintain the axis of the Outer Segmentparallel to the light emanating from the exit pupil of the objective optical group. The diameter of the Outer Segmentsdoes not vary significantly in retinas without a fovea. For foveal eyes, the variation is relatively small, about 3:1 overthe surface of the retina in a given species. The third variation associated with foveal eyes is the slight difference in thelength of Outer Segments. They are slightly longer in the foveal area to compensate for the distortion of the Petzvalsurface due to the thickness variation of the neural laminate.
4.7.3.4 Other classifiable variations in photoreceptors
The most significant variation in the photoreceptors of the eye at the histological level is in the axon endings and howthey relate to the neurons of the inner nuclear layer. This variation may not have much to do with the spectralperformance of a specific photoreceptor; but it may have an indirect relationship if the neurons of the inner nuclear layerhave specific requirements with respect to the photoreceptors sensing a specific wavelength region, i. e. if more neuronsmust connect to the mid-wavelength photoreceptors, it is plausible that these photoreceptors may develop larger feet toaccommodate the larger number of neural connections.

The Photoreceptor Cell 4- 147
4.7.4 Operation of the photoreceptors in the local environment
As eluded to in an earlier section, the individual photoreceptors in a given zone of the retina do draw their nutrients froma common reservoir provided by the local cardio-vascular mesh. Under large signal conditions, particularly when appliedto a carefully defined group of photoreceptors, the defined group may draw down more than their share of nutrients; theneighboring photoreceptors will then exhibit an impact on their performance (resulting in various edge and “zone”effects as reported by the psycho-physicist). The principal impact on their performance is represented by the well-knownadaptation curve. It describes the transient performance of the combined signal processing and metabolic processingcapability of the eye. Many of these effects will be defined and documented in PART C below.
4.7.4.1 Experimental techniques
Experimental design must carefully consider the normal operating environment of the eye and take precautions toduplicate the conditions or to note changes used in the test configuration. In-vivo experiments must take particular noteof the physical size of the probes relative to the size of the structures being examined and the surrounding fluid matrix.In-vitro experiments that do not simulate the “system environment” of the particular cell must recognize the limitedrelevance of the collected data.
The most significant problem with signal recording is the extremely high impedance level of the neuron electricalcircuits. A typical neuron will exhibit a change in voltage relative to the INM of about 40 mV for a current change ofabout 20 pA. This corresponds to a differential resistive impedance of about 2000 megohms. Most laboratory gradeoscilloscopes will exhibit a shunt resistive impedance of about 100 megohms. To maintain a bandwidth of at least 100Hertz at the 2000 megohm level, the capacitance associated with this resistive impedance must be less than about 0.4pF. This is a very small value. A typical laboratory quality oscilloscope probe cannot achieve a shunt capacitance below5.0 pF. Thus, when attempting to measure the electrical characteristics of a single neuron, the probe loads the circuitunder test considerably. It introduces a shunt impedance of about 100 megohms in parallel with a capacitance of at least5.0 pF.
Some experimenters have used a special electrometer probe. However, it is difficult to achieve the necessary operatingbandwidth with such a probe. This probe provides a direct connection to the gate of a very high input impedanceMOSFET transistor. This type of probe exhibits a resistive input impedance that can be as high as 1015 ohms or 1000megohms and a capacitance that may be as low as 0.1 pF. However, the cable connecting the probe to the subjectfrequently introduces a much higher capacitance, seldom less than 15 pF. A successful probe assembly, for purposesof interrogating a single neuron, should have the unpackaged MOSFET transistor mounted in the very tip of the probewith its gate terminal exposed to the test environment.
When designing an experiment involving a neuron, it is important to review in advance what can cause a neuron tochange operating modes. What can make it stop generating action potentials if it is or what can make it begin generatingaction potentials if it is not? This change of operating mode is commonly encountered in experiments that have not beenadequately researched and planned.
As will be shown in PART C, a neuron operating in the electrotonic mode is frequently driven into producing actionpotentials by the simple process of attaching a test set probe to the neuron. The excessive capacitance associated withthe probe and the inherent negative impedance of the Activa causes the neuron to go into oscillation. This oscillationcan be continuous or appear as intermittent action potentials.
Conversely, any electronic probe that contacts a neuron that is generating action potentials may cause those pulses tocease if the probe causes the bias conditions of the circuit to change, moving the Activa out of the negative impedancecondition.
Any voltage clamp technique is liable to introduce problems of the above types.
The waveforms generated by both classes of neurons can also be altered by disturbing the power supply serving theneuron. This can be done by introducing anoxia, removal of the bio-energetic materials such as GABA, introductionof excessive glutamates, the introduction of a wide variety of pharmaceuticals, or excessive change in the condition ofthe electrolyte external to the cell.
4.7.4.1.1 Effect of capacitive loading
The presence of a probe can affect the operation of a typical neuron in two important ways. It can limit the frequency

148 Processes in Biological Vision
Figure 4.7.4-1 Typical neuron test circuitconfiguration. See text
passband of the overall circuit. It can also change the operating mode of the overall circuit. Although the reduction inthe bandwidth of the overall circuit is seldom recognized by the investigator, it is very obvious to the trained eye in manypublished oscillograms related to vision. Of more obvious significance is the effect of the probe capacitance on theoperating mode of the neuron. This effect has caused consternation among many investigators and the assignment ofinappropriate properties to various neurons.
Although premature at this point, Figure 4.7.4-1 is taken from Chapter 10 of this work and provides a typicalexperimental situation wherein a circuit within the neurological system, containing an active device, is electricallyinterrogated. The circuit shown involves an Activa within a neuron. However, it is representative of either an Activawithin a neuron, an Activa constituting a synapse or a Node of Ranvier. As will be developed in Chapter 10, the nominalcircuit associated with a neuron, synapse or Node of Ranvier includes an active electrolytic (biological) semiconductordevice, the Activa, shown here using the standard transistor symbol modified by the addition of the letter B above thehorizontal line. The probe elements are shown separately in the lower right to emphasize their relatively independentrole.
As indicated in the previous section, the capacitanceassociated with the dendritic terminal of the activedevice, Cd, is usually less than 0.4 pF in neurons of thebipolar and lateral types. The associated resistiveimpedance is typically 2000 megohms. A typical probeand electrical test instrument are shown in the lower leftcorner. This circuit includes the resistive and capacitiveinput impedance of the instrument, Rin and Cin. It alsoincludes the obvious resistive and capacitive elements ofthe probe, Rp and Cp. What is not so obvious but alsoshown are the capacitances related to the probe cable, Cc,and the probe tip, Ct. Cp is normally made adjustable fortwo reasons. It is used to maximize the flat portion of thepassband associated with the probe and instrumentcombination and to compensate for the additionalcapacitance, Cc, due to the variable length of the cableused between the probe and the instrument. Theuncontrolled variable in this configuration is thecapacitance of the probe tip, Ct.
This circuit is very sensitive to the capacitance associated with the emitter and collector terminals of the active biologicalsemiconductor device. There are four situations to consider based on the total capacitance in shunt with the resistiveimpedance shown at the emitter terminal.
The total shunt capacitance is small. In this case, the circuit acts as a wide band amplifier capable ofmanipulating the applied signal without distortion.
The total shunt capacitance is larger but still small. The output of the circuit can now exhibit twodifferent output conditions depending on the electrotonic conditions present at the other terminals ofthe Activa. It can will exhibit ringing due to the high frequency peaking introduced into the passbandof the amplifier circuit. It can also exhibit a lower than normal passband for signals applied to oneof the two input terminals of the Activa, the emitter and the base.
The total shunt capacitance is still larger. The output of the circuit may now exhibit one or more“action potentials” that are a function of the electrotonic signal level applied to the emitter terminal.
The total shunt capacitance is excessively large. The output of the circuit will exhibit oscillationswhich resemble a continuous series of “action potentials.”
The above conditions describe the operation of a single neural circuit as a function of the capacitive loading of theemitter and/or collector circuit. This variation accounts for much of the versatility of the neuron. It simultaneouslyexplains the frequent references in the literature to “oscillations” recorded within the signal processing circuits of theretina distal to the ganglion cells. The mere contact of a lead, representing a significant shunt capacitance, with anindividual neuron can impact the operation of that circuit significantly.
The Photoreceptor Cell 4- 149
269Penn, R. & Hagins, W. (1969) Signal transmission along retinal rods and the origin of theelectroretinographic a-wave. Nature, vol. 223, July pp. 201-205
4.7.4.1.2 Signal recorded in-vivo
When recording signals in-vivo, the above discussion indicates how critical it is that the experiment is carefully planned.Is the intent to interrogate a single active circuit, i.e., a single neuron or a single synapse, which involves a very highimpedance level? Or, is the intent to interrogate a group of neural circuits in parallel, which lowers the impedance levelof the overall test circuit drastically and may avoid many extraneous recorded measurements? It is extremely importantto define exactly what the intent of the experiment is and what the actual accomplishments were. This can be done bydescribing the impedance conditions involved in the experiments explicitly.
4.7.4.1.3 Signal recorded in-vitro
Where in-vivo electrophysiological tests normally involve compromises with respect to physical dimensions (probes tento one hundred times larger than the targeted elements) and impedance mismatches, in-vitro tests frequently do notincorporate the entire circuit environment in the test design.
Whereas in-vivo signal recording causes minimal disruption of the local signal environment, this is not normally truein in-vitro recording. Care must be taken to preserve all of the functional circuit elements involved in the in-vivosituation. Otherwise, the experimental results will be corrupted. Clearly, the fluids surrounding the photoreceptor cellmust be of the same relative impedance as the in-vivo situation, including the effect of the outer limiting membrane onthe signal path length. The data of Penn and Hagins269 is very useful. However, their procedures do not maintain theoperating integrity of the photoreceptor cells. Their data does not show any electrical activity near the pedicel of thephotoreceptors.
If the photoreceptor cell is washed, the chemicals on the surface of the cell will probably be removed or disturbed. Thiswill immediately change the electrostenolytic conditions and thereby change the voltages applied to the circuits of thecell in a generally unappreciated way. What is more important, washing will remove the bio-energetic chemicalssupplying energy to the cell and its performance will degrade rapidly with time (seconds to minutes).
Current attempts to lengthen the functional life of in-vitro neurons involve the use of a variety of solutions, such asglucose in water and various Ringer’s solutions. These attempts may also involve perfusion of the solutions with oxygenand/or carbon dioxide. Consideration should be given to the provision of, and maintaining the balance in the bio-energetics used by the electrostenolytic process, generally those of the glutamate cycle.
The separation of the RPE from the photoreceptor cell does not seriously impact the short term operation of the cell.However, over a period of days, its absence would become apparent.
4.7.4.1.4 Signal recorded by the ERG
[ xxx limit the discussion here to the Class C and Class D waveforms of the ERG. This seems to duplicate an earlierparagraph]
The ERG will be discussed in detail in Chapter 17. It will become clear at that time that there are two separate anddistinct electrical waveforms that are directly associated with the photoreceptor cells. However, these do not correlatedirectly with the so-called a-wave and b-wave. The first waveform relates to a current emanating from the dendriticstructure of each cell. This waveform is labeled the Class C waveform and corresponds to the early photoreceptorpotential of the literature. The second waveform emanates from the axon structure of the cell. It is defined as a ClassD waveform in this work and corresponds to the “generator potential” of the literature. These two waveforms are verysimilar in shape but occur at two different times due to the finite transit velocity of current passing through the cell anddown the length of the axon. How these waveforms contribute to the ERG is addressed in Section 4.7.2.
150 Processes in Biological Vision
Chapter 4 Table of Contents 4/30/17
4. The Photo-Receptor/IPM/RPE complex of the Chordate Eye . . . . . . . . . . . . . . . . . . . . . . . . . . . . . . . . . . . . . . . . 14.1 Introduction . . . . . . . . . . . . . . . . . . . . . . . . . . . . . . . . . . . . . . . . . . . . . . . . . . . . . . . . . . . . . . . . . . . . . . 1
4.1.1 A roadmap of the photoreceptor/IPM/RPE complex . . . . . . . . . . . . . . . . . . . . . . . . . . . . . . 44.1.1.1 The role of the RPE . . . . . . . . . . . . . . . . . . . . . . . . . . . . . . . . . . . . . . . . . . . . . . . 54.1.1.2 The role of Mueller and other glial cells . . . . . . . . . . . . . . . . . . . . . . . . . . . . . . . 5
4.1.2 Terminology . . . . . . . . . . . . . . . . . . . . . . . . . . . . . . . . . . . . . . . . . . . . . . . . . . . . . . . . . . . . 54.1.2.1 Relevant biochemistry of lipids and proteins . . . . . . . . . . . . . . . . . . . . . . . . . . . . 5
4.1.2.1.1 The lipids . . . . . . . . . . . . . . . . . . . . . . . . . . . . . . . . . . . . . . . . . . . . . . 54.1.2.1.2 The proteins . . . . . . . . . . . . . . . . . . . . . . . . . . . . . . . . . . . . . . . . . . . . 74.1.2.1.3 The G-proteins . . . . . . . . . . . . . . . . . . . . . . . . . . . . . . . . . . . . . . . . . 74.1.2.1.4 The specific lipids and proteins of photodetection . . . . . . . . . . . . . . . 8
4.1.2.2 Membranes, films and coatings . . . . . . . . . . . . . . . . . . . . . . . . . . . . . . . . . . . . . 104.1.2.2.1 Membranes as exterior cell walls . . . . . . . . . . . . . . . . . . . . . . . . . . . 104.1.2.2.2 Juxtaposition of two membranes . . . . . . . . . . . . . . . . . . . . . . . . . . . 114.1.2.2.3 Electrical power derived from a coating on a membrane . . . . . . . . . 134.1.2.2.4 Structural properties of liquid crystalline films/membranes . . . . . . . 134.1.2.2.4 Deposited films/membranes . . . . . . . . . . . . . . . . . . . . . . . . . . . . . . . 15
4.1.2.3 Cells, micelles, & protocells . . . . . . . . . . . . . . . . . . . . . . . . . . . . . . . . . . . . . . . 154.1.2.3.1 Establishing the potential across a biological membrane . . . . . . . . . 174.1.2.3.2 Coated membranes as electrical elements . . . . . . . . . . . . . . . . . . . . 17
4.1.2.4 Cilia, flagella, villi and rhabdomere . . . . . . . . . . . . . . . . . . . . . . . . . . . . . . . . . 174.1.2.5 Morphogenesis through phagocytosis . . . . . . . . . . . . . . . . . . . . . . . . . . . . . . . . 184.1.2.6 Electrical currents, terminals and devices . . . . . . . . . . . . . . . . . . . . . . . . . . . . . 18
4.1.2.6.1 Current versus electron flow . . . . . . . . . . . . . . . . . . . . . . . . . . . . . . 184.1.2.6.2 Terminals of relevant devices . . . . . . . . . . . . . . . . . . . . . . . . . . . . . . 20
4.1.2.7 Locations of Activa within the neural system . . . . . . . . . . . . . . . . . . . . . . . . . . 214.1.2.8 Thermal dissipation in neurological circuits. . . . . . . . . . . . . . . . . . . . . . . . . . . . 224.1.2.9 Diffusion versus electrostenolysis . . . . . . . . . . . . . . . . . . . . . . . . . . . . . . . . . . . 224.1.2.10 Definition of the OS/IS interface . . . . . . . . . . . . . . . . . . . . . . . . . . . . . . . . . . . 234.1.2.11 Dimensions at the atomic and molecular level . . . . . . . . . . . . . . . . . . . . . . . . 23
4.1.3 Additional glossary entries . . . . . . . . . . . . . . . . . . . . . . . . . . . . . . . . . . . . . . . . . . . . . . . . . 234.2 Typical morphology of a photoreceptor (using light microscopy) . . . . . . . . . . . . . . . . . . . . . . . . . . . 24
4.2.1 Photoreceptors of Chordata versus those of Arthropoda and Mollusca . . . . . . . . . . . . . . . 254.2.1.1 Morphological differences . . . . . . . . . . . . . . . . . . . . . . . . . . . . . . . . . . . . . . . . . 25
4.2.1.1.1 Formation of the Outer Segments of Mollusca & Arthropoda . . . . . 274.2.1.1.2 Polarization sensitivities of the photoreceptors . . . . . . . . . . . . . . . . 28
4.2.1.2 Physiological differences . . . . . . . . . . . . . . . . . . . . . . . . . . . . . . . . . . . . . . . . . . 284.2.2 Typical photoreceptor of Chordata . . . . . . . . . . . . . . . . . . . . . . . . . . . . . . . . . . . . . . . . . . . 29
4.2.2.1 The Outer Segment . . . . . . . . . . . . . . . . . . . . . . . . . . . . . . . . . . . . . . . . . . . . . . 324.2.2.2 The Inner Segment . . . . . . . . . . . . . . . . . . . . . . . . . . . . . . . . . . . . . . . . . . . . . . 32
4.2.2.2.1. Motion of the Inner Segment relative to the nucleus . . . . . . . . . . . . 334.2.2.3 The Junction of the Outer & Inner Segment . . . . . . . . . . . . . . . . . . . . . . . . . . . 334.2.2.4 The Junction of the Inner Segment and the soma EMPTY XXX . . . . . . . . . . . 334.2.2.5 The proximal terminal of the photoreceptor cell . . . . . . . . . . . . . . . . . . . . . . . . 33
4.2.3 Other cells in the photoreceptor laminate . . . . . . . . . . . . . . . . . . . . . . . . . . . . . . . . . . . . . . 344.3 Histology of photoreceptor and RPE cells (Introducing electron microscopy) . . . . . . . . . . . . . . . . . . 34
4.3.1 Recent morphology based, chronology of the view of a photoreceptor cell . . . . . . . . . . . . 344.3.2 Proposed internal organization of the photoreceptor cell . . . . . . . . . . . . . . . . . . . . . . . . . . 384.3.3 An overview of the structure of the Inner Segment . . . . . . . . . . . . . . . . . . . . . . . . . . . . . . 41
4.3.3.1 The electrolytic circuit associated with the inner segment . . . . . . . . . . . . . . . . 414.3.3.2 The glandular function associated with the inner segment . . . . . . . . . . . . . . . . 43
4.3.4 Gross structure of the outer segment . . . . . . . . . . . . . . . . . . . . . . . . . . . . . . . . . . . . . . . . . . 454.3.4.1 The Outer Segment as a passive element . . . . . . . . . . . . . . . . . . . . . . . . . . . . . . 454.3.4.2 The Outer Segment from a light wave perspective . . . . . . . . . . . . . . . . . . . . . . 45
4.3.4.2.1 The Outer Segment as a waveguide . . . . . . . . . . . . . . . . . . . . . . . . . 474.3.4.3 The chemical composition of the outer segment . . . . . . . . . . . . . . . . . . . . . . . . 494.3.4.4 Summary of the Outer Segment Histology . . . . . . . . . . . . . . . . . . . . . . . . . . . . 49

The Photoreceptor Cell 4- 151
4.3.5 Detailed structure of the Outer Segment . . . . . . . . . . . . . . . . . . . . . . . . . . . . . . . . . . . . . . . 504.3.5.1 Mechanical formation of the disk stack (EXTRUSION AND COATING) . . . . 50
4.3.5.1.1 Electron micrographs of the Outer Segment . . . . . . . . . . . . . . . . . . 544.3.5.2 Physical characteristics of the disks . . . . . . . . . . . . . . . . . . . . . . . . . . . . . . . . . 61
4.3.5.2.1 Structure of the disk substrates based on the literature . . . . . . . . . . . 624.3.5.2.2 Conflict between crystallographers,microscopist and physical chemists
. . . . . . . . . . . . . . . . . . . . . . . . . . . . . . . . . . . . . . . . . . . . . . . . . . . . . 644.3.5.3 Other characteristics of the disks . . . . . . . . . . . . . . . . . . . . . . . . . . . . . . . . . . . . 65
4.3.5.3.1 Arrangement of the disks at the molecular level from the literature . 664.3.5.3.2 Molecular level characteristics based on radiography . . . . . . . . . . . 684.3.5.3.3 Quantum level characteristics . . . . . . . . . . . . . . . . . . . . . . . . . . . . . 684.3.5.3.4 Solid state characteristics . . . . . . . . . . . . . . . . . . . . . . . . . . . . . . . . . 684.3.5.3.5 Estimates of the number of chromophores per disk . . . . . . . . . . . . . 69
4.3.5.4 Sequencing and mapping of the structural protein Opsin . . . . . . . . . . . . . . . . . 704.3.5.4.1 Sequencing of Opsin . . . . . . . . . . . . . . . . . . . . . . . . . . . . . . . . . . . . 704.3.5.4.2 Mapping of Opsin . . . . . . . . . . . . . . . . . . . . . . . . . . . . . . . . . . . . . . 71
4.3.5.5 Proposed composite structure of a disk and its environment . . . . . . . . . . . . . . . 734.3.5.6 Summary of Section 4.3.5 . . . . . . . . . . . . . . . . . . . . . . . . . . . . . . . . . . . . . . . . . 76
4.3.6 The cytology of the neural portion of the photoreceptor cell . . . . . . . . . . . . . . . . . . . . . . . 764.3.6.1 The cytology and function of the pedicle . . . . . . . . . . . . . . . . . . . . . . . . . . . . . 77
4.3.6.1.1 The structure of the pedicle and the associated synaptic complex . . 784.3.6.1.2 The role of glia in the synaptic junction . . . . . . . . . . . . . . . . . . . . . . 814.3.6.1.3 Simplified caricature of the synaptic complex . . . . . . . . . . . . . . . . . 81
4.3.6.2 The structure of the internal amplifiers of the photoreceptor cell XXX . . . . . . 824.3.6.2.1 The distribution amplifier . . . . . . . . . . . . . . . . . . . . . . . . . . . . . . . . . 824.3.6.2.2 The common and poditic terminals of the photoreceptor cell . . . . . 83
4.3.6.3 The structure of the dendrites of the photoreceptor cell . . . . . . . . . . . . . . . . . . 834.3.6.3.1 The source of the adaptation mechanism . . . . . . . . . . . . . . . . . . . . . 84
4.3.7 The RPE cell . . . . . . . . . . . . . . . . . . . . . . . . . . . . . . . . . . . . . . . . . . . . . . . . . . . . . . . . . . . . 844.3.8 Environment between the photoreceptor and RPE cells . . . . . . . . . . . . . . . . . . . . . . . . . . . 84
4.3.8.1 The electrical performance of the fluid surround . . . . . . . . . . . . . . . . . . . . . . . . 844.3.8.2 The chemical performance of the fluid surround . . . . . . . . . . . . . . . . . . . . . . . 85
4.3.9 Correlation of old names with actual functions (see 4.xx at end) . . . . . . . . . . . . . . . . . . . . 854.4 Functional Description of components at the cytological level and beyond . . . . . . . . . . . . . . . . . . . . 86
4.4.1 Outer segment . . . . . . . . . . . . . . . . . . . . . . . . . . . . . . . . . . . . . . . . . . . . . . . . . . . . . . . . . . 864.4.1.1 Overview . . . . . . . . . . . . . . . . . . . . . . . . . . . . . . . . . . . . . . . . . . . . . . . . . . . . . . 864.4.1.2 Growth cycle . . . . . . . . . . . . . . . . . . . . . . . . . . . . . . . . . . . . . . . . . . . . . . . . . . . 874.4.1.3 Physical analog of the Outer Segment at “human scale” . . . . . . . . . . . . . . . . . . 87
4.4.1.3.1 The Outer Segment as an Assembly . . . . . . . . . . . . . . . . . . . . . . . . 874.4.1.3.2 The Disk as a Component . . . . . . . . . . . . . . . . . . . . . . . . . . . . . . . . 874.4.1.3.3 The Chromophore as a Coating . . . . . . . . . . . . . . . . . . . . . . . . . . . . 874.4.1.3.4 The neural connections . . . . . . . . . . . . . . . . . . . . . . . . . . . . . . . . . . . 884.4.1.3.5 The Overall analogy . . . . . . . . . . . . . . . . . . . . . . . . . . . . . . . . . . . . . 88
4.4.2 Inner segment . . . . . . . . . . . . . . . . . . . . . . . . . . . . . . . . . . . . . . . . . . . . . . . . . . . . . . . . . . . 884.5 The complete Photoreceptor-IPM-RPE Complex . . . . . . . . . . . . . . . . . . . . . . . . . . . . . . . . . . . . . . . . 88
4.5.1 The morphogenesis of the photoreceptor-IPM-RPE complex . . . . . . . . . . . . . . . . . . . . . . 924.5.2 The character and content of the Inter Photoreceptor Matrix . . . . . . . . . . . . . . . . . . . . . . . 944.5.3 The character and content of the RPE layer . . . . . . . . . . . . . . . . . . . . . . . . . . . . . . . . . . . . 944.5.4 The Inner segment(EMPTY) . . . . . . . . . . . . . . . . . . . . . . . . . . . . . . . . . . . . . . . . . . . . . . . 95
4.6 Development & Life Cycle of Photo-Receptors (Physical dynamics) . . . . . . . . . . . . . . . . . . . . . . . . 954.6.1 Overview . . . . . . . . . . . . . . . . . . . . . . . . . . . . . . . . . . . . . . . . . . . . . . . . . . . . . . . . . . . . . . 96
4.6.1.1 Formation of the photoreceptor cells and Outer Segments . . . . . . . . . . . . . . . . 974.6.1.2 Initial formation of the basic structure . . . . . . . . . . . . . . . . . . . . . . . . . . . . . . . . 974.6.1.3 Formation of the Outer Structure . . . . . . . . . . . . . . . . . . . . . . . . . . . . . . . . . . . 984.6.1.4 Migration . . . . . . . . . . . . . . . . . . . . . . . . . . . . . . . . . . . . . . . . . . . . . . . . . . . . 1004.6.1.5 Phagocytosis . . . . . . . . . . . . . . . . . . . . . . . . . . . . . . . . . . . . . . . . . . . . . . . . . . 1014.6.1.6 Regeneration . . . . . . . . . . . . . . . . . . . . . . . . . . . . . . . . . . . . . . . . . . . . . . . . . . 101
4.6.2 Normal operation of the photoreceptors--metabolism & growth . . . . . . . . . . . . . . . . . . . 1024.6.2.1 Details of the OS . . . . . . . . . . . . . . . . . . . . . . . . . . . . . . . . . . . . . . . . . . . . . . . 1034.6.2.2 Background related to the dynamics of the material processing loops . . . . . . 104
4.6.2.2.1 Caricatures from the literature . . . . . . . . . . . . . . . . . . . . . . . . . . . . 1074.6.2.2.2 Unique chemistry of the retinoids of vision . . . . . . . . . . . . . . . . . . 113
152 Processes in Biological Vision
4.6.2.2.3 Material concentrations in the OS/RPE environment . . . . . . . . . . . 1144.6.2.2.4 The presence of “Gates,” and materials crossing membranes in the IPM
. . . . . . . . . . . . . . . . . . . . . . . . . . . . . . . . . . . . . . . . . . . . . . . . . . . . 1164.6.2.3 Details of the material processing loops of the Photoreceptor-IPM-RPE complex
. . . . . . . . . . . . . . . . . . . . . . . . . . . . . . . . . . . . . . . . . . . . . . . . . . . . . . . . . . . 1184.6.2.3.1 The secretion and absorption of the protein, Opsin (extended loop
process) . . . . . . . . . . . . . . . . . . . . . . . . . . . . . . . . . . . . . . . . . . . . . . 1194.6.2.3.2 Disk formation and transport parameters . . . . . . . . . . . . . . . . . . . . 1234.6.2.3.3 The secretion and absorption of the chromophore, Rhodonine (local loop
process) . . . . . . . . . . . . . . . . . . . . . . . . . . . . . . . . . . . . . . . . . . . . . . 1244.6.2.3.4 Individual steps in The Retinoid Loop . . . . . . . . . . . . . . . . . . . . . . 1264.6.2.3.5 Possible alternate paths for individual chromophores . . . . . . . . . . 1284.6.2.3.6 The Retinoid Loop Model . . . . . . . . . . . . . . . . . . . . . . . . . . . . . . . 1314.6.2.3.7 The individual mechanisms of retinoid transfer . . . . . . . . . . . . . . . 131
4.6.3 Other aspects of metabolic dynamics of photoreceptors . . . . . . . . . . . . . . . . . . . . . . . . . . 1394.6.3.1 Additional details relative to SRBP . . . . . . . . . . . . . . . . . . . . . . . . . . . . . . . . . 1394.6.3.2 Putative diurnal secretion and absorption by the outer segment . . . . . . . . . . . 1404.6.3.3 Vitamin A stress and starvation . . . . . . . . . . . . . . . . . . . . . . . . . . . . . . . . . . . 140
4.6.3.3.1 A reinterpretation . . . . . . . . . . . . . . . . . . . . . . . . . . . . . . . . . . . . . . 1414.6.4 Potential fuscin buildup leading to macular dystrophy . . . . . . . . . . . . . . . . . . . . . . . . . . . 142
4.7 Operation of the photoreceptor in signaling (Electrical dynamics) . . . . . . . . . . . . . . . . . . . . . . . . . . 1424.7.1 Terminology and fundamentals . . . . . . . . . . . . . . . . . . . . . . . . . . . . . . . . . . . . . . . . . . . . 1434.7.2 Introductory description . . . . . . . . . . . . . . . . . . . . . . . . . . . . . . . . . . . . . . . . . . . . . . . . . . 1434.7.3 Variations in photoreceptors . . . . . . . . . . . . . . . . . . . . . . . . . . . . . . . . . . . . . . . . . . . . . . . 146
4.7.3.1 Variations related to color vision . . . . . . . . . . . . . . . . . . . . . . . . . . . . . . . . . . 1464.7.3.2 Variations related to routine growth . . . . . . . . . . . . . . . . . . . . . . . . . . . . . . . . 1464.7.3.3 Variations related to retinal position . . . . . . . . . . . . . . . . . . . . . . . . . . . . . . . . 1464.7.3.4 Other classifiable variations in photoreceptors . . . . . . . . . . . . . . . . . . . . . . . . 146
4.7.4 Operation of the photoreceptors in the local environment . . . . . . . . . . . . . . . . . . . . . . . . 1474.7.4.1 Experimental techniques . . . . . . . . . . . . . . . . . . . . . . . . . . . . . . . . . . . . . . . . . 147
4.7.4.1.1 Effect of capacitive loading . . . . . . . . . . . . . . . . . . . . . . . . . . . . . . 1474.7.4.1.2 Signal recorded in-vivo . . . . . . . . . . . . . . . . . . . . . . . . . . . . . . . . . 1494.7.4.1.3 Signal recorded in-vitro . . . . . . . . . . . . . . . . . . . . . . . . . . . . . . . . . 1494.7.4.1.4 Signal recorded by the ERG . . . . . . . . . . . . . . . . . . . . . . . . . . . . . . 149
The Photoreceptor Cell 4- 153
List of Figures
Figure 4.1.2-1 Major classes and subclasses within the lipids and their relationships to vision . . . . . . . . . . . . . . . . 6Figure 4.1.2-2 Bilayer lipid membrane configurations . . . . . . . . . . . . . . . . . . . . . . . . . . . . . . . . . . . . . . . . . . . . . . 11Figure 4.1.2-3 Electrochemical description of two bilayer membranes in close proximity . . . . . . . . . . . . . . . . . . . 11Figure 4.1.2-4 The structure of the Activa at the atomic level . . . . . . . . . . . . . . . . . . . . . . . . . . . . . . . . . . . . . . . . 13Figure 4.1.2-5 A biological liquid crystal state diagram . . . . . . . . . . . . . . . . . . . . . . . . . . . . . . . . . . . . . . . . . . . . . 14Figure 4.1.2-6 Cell membrane models . . . . . . . . . . . . . . . . . . . . . . . . . . . . . . . . . . . . . . . . . . . . . . . . . . . . . . . . . . . 17Figure 4.1.2-7 Definition of currents and electron flows . . . . . . . . . . . . . . . . . . . . . . . . . . . . . . . . . . . . . . . . . . . . . 19Figure 4.1.2-8 The six terminals of a fundamental neuron . . . . . . . . . . . . . . . . . . . . . . . . . . . . . . . . . . . . . . . . . . . 21Figure 4.1.2-9 Electronmicrograph of the Activa within a Node of Ranvier. . . . . . . . . . . . . . . . . . . . . . . . . . . . . . 22Figure 4.2.1-1 Major differences between the photoreceptor cells of Chordata and Mollusca . . . . . . . . . . . . . . . . 26Figure 4.2.2-1 Caricature of a photoreceptor cell with RPE interface and Outer Limiting Membrane . . . . . . . . . . 31Figure 4.3.1-1 Two perspectives on chordate photoreceptor cells . . . . . . . . . . . . . . . . . . . . . . . . . . . . . . . . . . . . . . 36Figure 4.3.1-3 Electron micrograph showing the poditic arbor of a photoreceptor cell . . . . . . . . . . . . . . . . . . . . . 38Figure 4.3.2-1 An exploded view of the baseline photoreceptor cell . . . . . . . . . . . . . . . . . . . . . . . . . . . . . . . . . . . 40Figure 4.3.3-1 Composite caricature of the inner segment . . . . . . . . . . . . . . . . . . . . . . . . . . . . . . . . . . . . . . . . . . . 42Figure 4.3.3-2 The detailed structure of the protein manufacturing portion of the inner segment . . . . . . . . . . . . . . 44Figure 4.3.4-1 Slow wave structure nomograph . . . . . . . . . . . . . . . . . . . . . . . . . . . . . . . . . . . . . . . . . . . . . . . . . . . 46Figure 4.3.4-2 Caricature of OS showing the coating of the disks . . . . . . . . . . . . . . . . . . . . . . . . . . . . . . . . . . . . . 47Figure 4.3.5-1 Formation of new disks at the OS/IS junction . . . . . . . . . . . . . . . . . . . . . . . . . . . . . . . . . . . . . . . . . 52Figure 4.3.5-2 Disks during different stages of development . . . . . . . . . . . . . . . . . . . . . . . . . . . . . . . . . . . . . . . . . 53Figure 4.3.5-3 Electronmicrograph of a human disk in plan view. . . . . . . . . . . . . . . . . . . . . . . . . . . . . . . . . . . . . . 54Figure 4.3.5-4 A collage of photoreceptor Outer Segments . . . . . . . . . . . . . . . . . . . . . . . . . . . . . . . . . . . . . . . . . . 55Figure 4.3.5-5 The disks of the photoreceptor outer segment at 30,000 & 300,000x . . . . . . . . . . . . . . . . . . . . . . . 57Figure 4.3.5-6 Frog ROS and interdisc filaments . . . . . . . . . . . . . . . . . . . . . . . . . . . . . . . . . . . . . . . . . . . . . . . . . . 59Figure 4.3.5-7 Drawing of two different sets of photoreceptor disk dimensions . . . . . . . . . . . . . . . . . . . . . . . . . . . 60Figure 4.3.5-8 Molecular arrangements within disks . . . . . . . . . . . . . . . . . . . . . . . . . . . . . . . . . . . . . . . . . . . . . . . 67Figure 4.3.5-9 A reconstruction of the surface of a disk . . . . . . . . . . . . . . . . . . . . . . . . . . . . . . . . . . . . . . . . . . . . . 72Figure 4.3.5-10 Proposed structure of the protein part of a disk surface from the 20th Century . . . . . . . . . . . . . . . 73Figure 4.3.5-11 Details of the of the disk- chromophore-dendrite interface . . . . . . . . . . . . . . . . . . . . . . . . . . . . . . 74Figure 4.3.6-1 A caricature of the synaptic complex of a photoreceptor cell. . . . . . . . . . . . . . . . . . . . . . . . . . . . . 79Figure 4.3.6-2 A simplified caricature of a typical pedicle within the neural system. . . . . . . . . . . . . . . . . . . . . . . 81Figure 4.3.6-3 Fundamental structure of a synaptic disk of a photoreceptor pedicel. . . . . . . . . . . . . . . . . . . . . . . 82Figure 4.5.1-1 The photoreceptor cell-IPM-RPE interface . . . . . . . . . . . . . . . . . . . . . . . . . . . . . . . . . . . . . . . . . . . 91Figure 4.5.1-2 Morphogenesis of the chordate eye . . . . . . . . . . . . . . . . . . . . . . . . . . . . . . . . . . . . . . . . . . . . . . . . . 92Figure 4.5.1-3 Caricature of the follicle-sinus complex of a myastacial vibrissa (whisker) . . . . . . . . . . . . . . . . . . 93Figure 4.6.1-1 Electron micrograph of photoreceptor outer segment from the squirrel retina . . . . . . . . . . . . . . . . . 99Figure 4.6.1-2 Electron microscope radioautogram of frog outer segments . . . . . . . . . . . . . . . . . . . . . . . . . . . . . 101Figure 4.6.2-1 Caricature of a photoreceptor cell with RPE interface . . . . . . . . . . . . . . . . . . . . . . . . . . . . . . . . . 102Figure 4.6.2-2 Proposed protein and retinoid transport loops . . . . . . . . . . . . . . . . . . . . . . . . . . . . . . . . . . . . . . . . 104Figure 4.6.2-3 Visual cycle of retinoids and the location of retinoid binding proteins . . . . . . . . . . . . . . . . . . . . . 107Figure 4.6.2-4 Solubilization and phagocytosis of an outer segment disk ADD . . . . . . . . . . . . . . . . . . . . . . . . . . 109Figure 4.6.2-5 A three-dimensional caricature of the process of phagocytosis . . . . . . . . . . . . . . . . . . . . . . . . . . 111Figure 4.6.2-6 Stages in the phagocytosis of the disks of a photoreceptor . . . . . . . . . . . . . . . . . . . . . . . . . . . . . . 112Figure 4.6.2-7 Color picture of chromophoric globules stored in the RPE of the swamp turtle . . . . . . . . . . . . . . 115Figure 4.6.2-8 Caricature of chromophoric globules stored in the RPE . . . . . . . . . . . . . . . . . . . . . . . . . . . . . . . . 116Figure 4.6.2-9 Comprehensive caricature of the photoreceptor disk regeneration process . . . . . . . . . . . . . . . . . . 119Figure 4.6.2-10 Caricature of the replacement of protein disks in the outer stack . . . . . . . . . . . . . . . . . . . . . . . . 120Figure 4.6.2-12 Caricature of the replacement of the intrinsic Vitamin A2 based chromophores . . . . . . . . . . . . 125Figure 4.6.2-13 Fundamental options in retinoid transport in support of vision. . . . . . . . . . . . . . . . . . . . . . . . . . 128Figure 4.6.2-14 Optional protein and retinoid transport loops. . . . . . . . . . . . . . . . . . . . . . . . . . . . . . . . . . . . . . . 130Figure 4.6.2-15 Proposed protein and retinoid transport loops. . . . . . . . . . . . . . . . . . . . . . . . . . . . . . . . . . . . . . . 131Figure 4.6.2-16 Details of retinoid transport . . . . . . . . . . . . . . . . . . . . . . . . . . . . . . . . . . . . . . . . . . . . . . . . . . . . . 132Figure 4.6.2-17 Steps in the transport of the chromophores . . . . . . . . . . . . . . . . . . . . . . . . . . . . . . . . . . . . . . . . . 132Figure 4.6.2-18 Overall scheme for retinoid transformation and transport . . . . . . . . . . . . . . . . . . . . . . . . . . . . . . 136Figure 4.6.3-1 Biochemical changes in a group of white rats on a vitamin A-deficient diet . . . . . . . . . . . . . . . . . 141Figure 4.7.2-1 Topology of the photoreceptor cell electronic circuit . . . . . . . . . . . . . . . . . . . . . . . . . . . . . . . . . . 144Figure 4.7.2-2 The fundamental circuit of the photoreceptor cell . . . . . . . . . . . . . . . . . . . . . . . . . . . . . . . . . . . . 145Figure 4.7.4-1 Typical neuron test circuit configuration . . . . . . . . . . . . . . . . . . . . . . . . . . . . . . . . . . . . . . . . . . . . 148
154 Processes in Biological Vision
(Active) SUBJECT INDEX (using advanced indexing option) for Chapter 4
95% . . . . . . . . . . . . . . . . . . . . . . . . . . . . . . . . . . . . . . . . . . . . . . . . . . . . . . . . . . . . . . . . . . . . . . . . . . . . . . . . . . . . 8, 998% . . . . . . . . . . . . . . . . . . . . . . . . . . . . . . . . . . . . . . . . . . . . . . . . . . . . . . . . . . . . . . . . . . . . . . . . . . . . . . . . . . . . . 94actin . . . . . . . . . . . . . . . . . . . . . . . . . . . . . . . . . . . . . . . . . . . . . . . . . . . . . . . . . . . . . . . . . . . . . . . . . . . . . . . . . . . . . 38action potential . . . . . . . . . . . . . . . . . . . . . . . . . . . . . . . . . . . . . . . . . . . . . . . . . . . . . . . . . . . . . . . . . . . . . . . . . . . . . 22Activa . . . . . . . . . . . . . . . . 2-4, 11, 13, 20-23, 31, 35, 38-41, 43, 76, 77, 80-85, 90, 102, 117, 122, 143-145, 147, 148activa at the atomic level . . . . . . . . . . . . . . . . . . . . . . . . . . . . . . . . . . . . . . . . . . . . . . . . . . . . . . . . . . . . . . . . . . . . . 13adaptation . . . . . . . . . . . . . . . . . . . . . . . . . . . . . . . . . . . . . . . . 28, 29, 38-40, 69, 82-84, 117, 123, 142, 144, 145, 147adaptation amplifier . . . . . . . . . . . . . . . . . . . . . . . . . . . . . . . . . . . . . . . . . . . . . . . . . . . . . . . . . . . . 29, 39, 40, 144, 145adrenergic . . . . . . . . . . . . . . . . . . . . . . . . . . . . . . . . . . . . . . . . . . . . . . . . . . . . . . . . . . . . . . . . . . . . . . . . . . . . . . . . . . 7amplification . . . . . . . . . . . . . . . . . . . . . . . . . . . . . . . . . . . . . . . . . . . . . . . . . . . . . . . . . . . . . . . . 12, 20, 142, 143, 145arborization . . . . . . . . . . . . . . . . . . . . . . . . . . . . . . . . . . . . . . . . . . . . . . . . . . . . . . . . . . . . . . . . . . . . . . . . . . . . . . . 38attention . . . . . . . . . . . . . . . . . . . . . . . . . . . . . . . . . . . . . . . . . . . . . . . . . . . . . . . . . . . . . . . . . . . . . . . . . . . . . . . . . . 37axon segment . . . . . . . . . . . . . . . . . . . . . . . . . . . . . . . . . . . . . . . . . . . . . . . . . . . . . . . . . . . . . . . . . . . . . . . . . . . . . . 29axoplasm . . . . . . . . . . . . . . . . . . . . . . . . . . . . . . . . . . . . . . . . . . . . . . . . . . . . . . . . . . . . . 12, 13, 43, 80, 117, 143, 144a-wave . . . . . . . . . . . . . . . . . . . . . . . . . . . . . . . . . . . . . . . . . . . . . . . . . . . . . . . . . . . . . . . . . . . . . . . . . . . . . . 144, 149bilayer . . . . . . . . . . . . . . . . . . . . . . . . . . . . . . . . . . . . 7, 9-13, 15-17, 24, 34, 44, 50, 56-59, 61-63, 67, 75, 82, 99, 117bilayer membrane . . . . . . . . . . . . . . . . . . . . . . . . . . . . . . . . . . . . . . . . . . . . . . . . . . . . . . . . . . 11, 12, 17, 24, 56, 58, 99bleach . . . . . . . . . . . . . . . . . . . . . . . . . . . . . . . . . . . . . . . . . . . . . . . . . . . . . . . . . . . . . . . . . . . . . . . . . . . . . . . . 17, 105bleaching . . . . . . . . . . . . . . . . . . . . . . . . . . . . . . . . . . . . . . . . . . . . . . . . . . . . . . . . . . . . . . . . . . . . . . . . . . . . . . . . 123BOLD . . . . . . . . . . . . . . . . . . . . . . . . . . . . . . . . . . . . . . . . . . . . . . . . . . . . . . . . . . . . . . . . . . . . . . . . . . . . . . . . . . . 132bray . . . . . . . . . . . . . . . . . . . . . . . . . . . . . . . . . . . . . . . . . . . . . . . . . . . . . . . . . . . . . . . . . . . . . . . . . . . . . . . . . . . . . 95Brownian motion . . . . . . . . . . . . . . . . . . . . . . . . . . . . . . . . . . . . . . . . . . . . . . . . . . . . . . . . . . . . . . . . . . . . . . . . 80, 83b-wave . . . . . . . . . . . . . . . . . . . . . . . . . . . . . . . . . . . . . . . . . . . . . . . . . . . . . . . . . . . . . . . . . . . . . . . . . . . . . . 144, 149carboxylic-ion . . . . . . . . . . . . . . . . . . . . . . . . . . . . . . . . . . . . . . . . . . . . . . . . . . . . . . . . . . . . . . . . . . . . . . . . . . . . . 46cGMP . . . . . . . . . . . . . . . . . . . . . . . . . . . . . . . . . . . . . . . . . . . . . . . . . . . . . . . . . . . . . . . . . . . . . . . . . . . . 85, 117, 118CIE . . . . . . . . . . . . . . . . . . . . . . . . . . . . . . . . . . . . . . . . . . . . . . . . . . . . . . . . . . . . . . . . . . . . . . . . . . . . . . . . . . . . . . 95cis- . . . . . . . . . . . . . . . . . . . . . . . . . . . . . . . . . . . . . . . . . . . . . . . . . . . . . . . . . . . . . . . . 46, 96, 123, 126, 127, 139, 141complex neurons . . . . . . . . . . . . . . . . . . . . . . . . . . . . . . . . . . . . . . . . . . . . . . . . . . . . . . . . . . . . . . . . . . . . . . . . . . . 38compound eye . . . . . . . . . . . . . . . . . . . . . . . . . . . . . . . . . . . . . . . . . . . . . . . . . . . . . . . . . . . . . . . . . . . . . . . . . . 22, 71confirmation . . . . . . . . . . . . . . . . . . . . . . . . . . . . . . . . . . . . . . . . . . . . . . . . . . . . . . . . . . . . . . . . . . . . . . . . . . . . . . 114continuum . . . . . . . . . . . . . . . . . . . . . . . . . . . . . . . . . . . . . . . . . . . . . . . . . . . . . . . . . . . . . . . . . . . . . . . . . . . . . . . . . 72cross section . . . . . . . . . . . . . . . . . . . . . . . . . . . . . . . . . . . . . . . . . . . . . . . . . . . . 10, 19, 37, 43, 64, 69, 90, 94, 95, 145cross-section . . . . . . . . . . . . . . . . . . . . . . . . . . . . . . . . . . . . . . . . . . . . . . . . . . . . . . . . . . . . . . . . . 64, 73, 101, 111, 138dark adaptation . . . . . . . . . . . . . . . . . . . . . . . . . . . . . . . . . . . . . . . . . . . . . . . . . . . . . . . . . . . . . . . . . . . . . . . . . 69, 142dendrolemma . . . . . . . . . . . . . . . . . . . . . . . . . . . . . . . . . . . . . . . . . . . . . . . . . . . . . . . . . . . . . . . . . . . . . . . . 76, 82, 83diode . . . . . . . . . . . . . . . . . . . . . . . . . . . . . . . . . . . . . . . . . . . . . . . . . . . . . . . . . . . . . . . . . . . 10-12, 17, 20, 45, 80, 144DNA . . . . . . . . . . . . . . . . . . . . . . . . . . . . . . . . . . . . . . . . . . . . . . . . . . . . . . . . . . . . . . . . . . . . . . . . . . . . . . . . 108, 117double layer . . . . . . . . . . . . . . . . . . . . . . . . . . . . . . . . . . . . . . . . . . . . . . . . . . . . . . . . . . . . . . . . . . . . . . . . . . . . . . . 66Duplex Theory . . . . . . . . . . . . . . . . . . . . . . . . . . . . . . . . . . . . . . . . . . . . . . . . . . . . . . . . . . . . . . . . . . . . . . . . . . . . . . 2dynamic range . . . . . . . . . . . . . . . . . . . . . . . . . . . . . . . . . . . . . . . . . . . . . . . . . . . . . . . . . . . . . . . . . . . . . . . . 142, 145electrometer . . . . . . . . . . . . . . . . . . . . . . . . . . . . . . . . . . . . . . . . . . . . . . . . . . . . . . . . . . . . . . . . . . . . . . . . . . . . . . 147electrostenolytic process . . . . . . . . . . . . . . . . . . . . . . . . . . . . . . . . . . . . . . . . . . . . . . . . . . . 17, 74, 76, 79, 85, 94, 149ERG . . . . . . . . . . . . . . . . . . . . . . . . . . . . . . . . . . . . . . . . . . . . . . . . . . . . . . . . . . . . . . . . . . . . . . 84, 141, 142, 144, 149evolution . . . . . . . . . . . . . . . . . . . . . . . . . . . . . . . . . . . . . . . . . . . . . . . . . . . . . . . . . . . . . . . . . . . . . . . . . 18, 25, 54, 92exocytosis . . . . . . . . . . . . . . . . . . . . . . . . . . . . . . . . . . . . . . . . . . . . . . . . . . . . . . . . . . . . . . . . . . . . . . . . . . . . . . . . . 44expanded . . . . . . . . . . . . . . . . . . . . . . . . . . . . . . . . . . . . . . . . . . . . . . . . . . . . . . . . . . . . . . . . . . . . 42, 73, 76, 108, 135fuscin . . . . . . . . . . . . . . . . . . . . . . . . . . . . . . . . . . . . . . . . . . . . . . . . . . . . . . . . . . . . . . . . . . . . . . . . . . . . 92, 116, 142GABA . . . . . . . . . . . . . . . . . . . . . . . . . . . . . . . . . . . . . . . . . . . . . . . . . . . . . . . . . . . . . . . . . . . . . 4, 74, 80, 85, 94, 147Gaussian . . . . . . . . . . . . . . . . . . . . . . . . . . . . . . . . . . . . . . . . . . . . . . . . . . . . . . . . . . . . . . . . . . . . . . . . . . . . . . . . . 105genetics . . . . . . . . . . . . . . . . . . . . . . . . . . . . . . . . . . . . . . . . . . . . . . . . . . . . . . . . . . . . . . . . . . . . . . . . . . . . . . 117, 126glia . . . . . . . . . . . . . . . . . . . . . . . . . . . . . . . . . . . . . . . . . . . . . . . . . . . . . . . . . . . . . . . . . . . . . . . . . . . . . . . . . . . . . . 81glutamate . . . . . . . . . . . . . . . . . . . . . . . . . . . . . . . . . . . . . . . . . . . . . . . . . . . . . . . . . . . . . . . 2-4, 7, 13, 79, 80, 94, 149hole . . . . . . . . . . . . . . . . . . . . . . . . . . . . . . . . . . . . . . . . . . . . . . . . . . . . . . . . . . . . . . . . . . . . . . . . . . . . . . . . 10, 17, 19homogeneous . . . . . . . . . . . . . . . . . . . . . . . . . . . . . . . . . . . . . . . . . . . . . . . . . . . . . . . . . . . . . . . . . . . . . . . . . . . 10, 87horseradish peroxidase . . . . . . . . . . . . . . . . . . . . . . . . . . . . . . . . . . . . . . . . . . . . . . . . . . . . . . . . . . . . . . . . . . . . . . . 78hydrogen bond . . . . . . . . . . . . . . . . . . . . . . . . . . . . . . . . . . . . . . . . . . . . . . . . . . . . . . . . . . . . . . . . . . . . . . . . 132, 134hydronium . . . . . . . . . . . . . . . . . . . . . . . . . . . . . . . . . . . . . . . . . . . . . . . . . . . . . . . . . . . . . . . . 4, 11-13, 76, 80, 82, 83hydronium liquid crystal . . . . . . . . . . . . . . . . . . . . . . . . . . . . . . . . . . . . . . . . . . . . . . . . . . . . . . . . . . . . . . . 11, 12, 80
The Photoreceptor Cell 4- 155
inverting . . . . . . . . . . . . . . . . . . . . . . . . . . . . . . . . . . . . . . . . . . . . . . . . . . . . . . . . . . . . . . . . . . . . . . . . . . . . . . . . . . 81ion-pump . . . . . . . . . . . . . . . . . . . . . . . . . . . . . . . . . . . . . . . . . . . . . . . . . . . . . . . . . . . . . . . . . . . . . . . . . . . . . . . . . 17light adaptation . . . . . . . . . . . . . . . . . . . . . . . . . . . . . . . . . . . . . . . . . . . . . . . . . . . . . . . . . . . . . . . . . . . . . . . . . . . . . 28Limulus . . . . . . . . . . . . . . . . . . . . . . . . . . . . . . . . . . . . . . . . . . . . . . . . . . . . . . . . . . . . . . . . . . . . . . . . . . . . . . . . . . 25lips . . . . . . . . . . . . . . . . . . . . . . . . . . . . . . . . . . . . . . . . . . . . . . . . . . . . . . . . . . . . . . . . . . . . . . . . . . . . . . . . . . . . . . 87liquid-crystal . . . . . . . . . . . . . . . . . . . . . . . . . . . . . . . . . . . . . . . . . . . . . . . . . . . . . . . . . . . . . . . . . . . . . . . . . . . . . . 96lysine . . . . . . . . . . . . . . . . . . . . . . . . . . . . . . . . . . . . . . . . . . . . . . . . . . . . . . . . . . . . . . . . . . . . . . . . . . . . . . . . . . . . 71macular degeneration . . . . . . . . . . . . . . . . . . . . . . . . . . . . . . . . . . . . . . . . . . . . . . . . . . . . . . . . . . . . . . . . . . . . . . . 114marker . . . . . . . . . . . . . . . . . . . . . . . . . . . . . . . . . . . . . . . . . . . . . . . . . . . . . . . . . . . . . . . . . . . . . . . . . . . . . . . . . . . 71metabolites . . . . . . . . . . . . . . . . . . . . . . . . . . . . . . . . . . . . . . . . . . . . . . . . . . . . . . . . . . . . . . . . . . . . . . . . . 85, 94, 139microcircuitry . . . . . . . . . . . . . . . . . . . . . . . . . . . . . . . . . . . . . . . . . . . . . . . . . . . . . . . . . . . . . . . . . . . . . . . . . . . . . . 85microtubule . . . . . . . . . . . . . . . . . . . . . . . . . . . . . . . . . . . . . . . . . . . . . . . . . . . . . . . . . . 27, 38, 73, 74, 76, 83, 88, 111microvilli . . . . . . . . . . . . . . . . . . . . . . . . . . . . . . . . . . . . . . . . . . . . . . . . . . . . . . . . . . . . . . . . . . . . . . . . . . . . . . 27, 50monopulse . . . . . . . . . . . . . . . . . . . . . . . . . . . . . . . . . . . . . . . . . . . . . . . . . . . . . . . . . . . . . . . . . . . . . . . . . . . . . . . 146morphogenesis . . . . . . . . . . . . . . . . . . . . . . . . . . . . . . . . . . . . . . . . . . . . . . . . . . . . . . . . . . . . . . . . . 9, 18, 24, 92, 131myelin . . . . . . . . . . . . . . . . . . . . . . . . . . . . . . . . . . . . . . . . . . . . . . . . . . . . . . . . . . . . . . . . . . . . . . . . . . . . . . . . . . . . 22nematic . . . . . . . . . . . . . . . . . . . . . . . . . . . . . . . . . . . . . . . . . . . . . . . . . . . . . . . . . . . . . . . . . . . . . . . . . . . . . 13, 15, 16neurite . . . . . . . . . . . . . . . . . . . . . . . . . . . . . . . . . . . . . . . . . . . . . . . . . . . . . . . . . . . . . . . . . . . . . . . . . . . . . . 78, 81, 82neurofilaments . . . . . . . . . . . . . . . . . . . . . . . . . . . . . . . . . . . . . . . . . . . . . . . . . . . . . . . . . . . . . . . . . . . . . . . . . . . . . 43neurotransmitter . . . . . . . . . . . . . . . . . . . . . . . . . . . . . . . . . . . . . . . . . . . . . . . . . . . . . . . . . . . . . . . . . . . . . . . 3, 80, 81night blindness . . . . . . . . . . . . . . . . . . . . . . . . . . . . . . . . . . . . . . . . . . . . . . . . . . . . . . . . . . . . . . . . . . . . . . . . . . . . 140Node of Ranvier . . . . . . . . . . . . . . . . . . . . . . . . . . . . . . . . . . . . . . . . . . . . . . . . . . . . . . . . . . . . . . . . . . . . . 22, 23, 148noise . . . . . . . . . . . . . . . . . . . . . . . . . . . . . . . . . . . . . . . . . . . . . . . . . . . . . . . . . . . . . . . . . . . . . . . . . . . . . . . . . . 69, 85orbitals . . . . . . . . . . . . . . . . . . . . . . . . . . . . . . . . . . . . . . . . . . . . . . . . . . . . . . . . . . . . . . . . . . . . . . . . . . . . . . . . . . . 67P/D equation . . . . . . . . . . . . . . . . . . . . . . . . . . . . . . . . . . . . . . . . . . . . . . . . . . . . . . . . . . . . . . . . . . . . . . . . . . . . . . 117phylogenic tree . . . . . . . . . . . . . . . . . . . . . . . . . . . . . . . . . . . . . . . . . . . . . . . . . . . . . . . . . . . . . . . . . . . . . . . . . . . . . 18piezoelectric . . . . . . . . . . . . . . . . . . . . . . . . . . . . . . . . . . . . . . . . . . . . . . . . . . . . . . . . . . . . . . . . . . . . . . . . . . . . . . . 45pnp . . . . . . . . . . . . . . . . . . . . . . . . . . . . . . . . . . . . . . . . . . . . . . . . . . . . . . . . . . . . . . . . . . . . . . . . . . . . . . 12, 143, 145poda . . . . . . . . . . . . . . . . . . . . . . . . . . . . . . . . . . . . . . . . . . . . . . . . . . . . . . . . . . . . . . . . . . . . . . 20, 21, 28, 29, 85, 145podites . . . . . . . . . . . . . . . . . . . . . . . . . . . . . . . . . . . . . . . . . . . . . . . . . . . . . . . . . . . . . . . . . . . . . . . . . . . . . . . . . . . . 3poditic . . . . . . . . . . . . . . . . . . . . . . . . . . . . . . . . . . . . . . . . . . . . . . . . . . . . . . 31, 35, 38, 39, 41, 80, 82, 83, 85, 89, 145quantum-mechanical . . . . . . . . . . . . . . . . . . . . . . . . . . . . . . . . . . . . . . . . . . . . . . . . . . . . . . . 18, 49, 68, 80, 83, 84, 93reading . . . . . . . . . . . . . . . . . . . . . . . . . . . . . . . . . . . . . . . . . . . . . . . . . . . . . . . . . . . . . . . . . . . . . . . . . . . . . . . . . . 118rectifier . . . . . . . . . . . . . . . . . . . . . . . . . . . . . . . . . . . . . . . . . . . . . . . . . . . . . . . . . . . . . . . . . . . . . . . . . . . . . . . . . . . 17residue . . . . . . . . . . . . . . . . . . . . . . . . . . . . . . . . . . . . . . . . . . . . . . . . . . . . . . . . . . . . . . . . . . . . . . . . . 70, 71, 95, 121resonance . . . . . . . . . . . . . . . . . . . . . . . . . . . . . . . . . . . . . . . . . . . . . . . . . . . . . . . . . . . . . . . . . . . . . . . . . . . . . . 46, 47retinitis pigmentosa . . . . . . . . . . . . . . . . . . . . . . . . . . . . . . . . . . . . . . . . . . . . . . . . . . . . . . . . . . . . . . . . . . . . . . . . . 97rhabdome . . . . . . . . . . . . . . . . . . . . . . . . . . . . . . . . . . . . . . . . . . . . . . . . . . . . . . . . . . . . . . . . . . . . . . . . . . . . . . . . . 77rhabdomere . . . . . . . . . . . . . . . . . . . . . . . . . . . . . . . . . . . . . . . . . . . . . . . . . . . . . . . . . . . . . . . . . . . . . . . 17, 18, 28, 50ringing . . . . . . . . . . . . . . . . . . . . . . . . . . . . . . . . . . . . . . . . . . . . . . . . . . . . . . . . . . . . . . . . . . . . . . . . . . . . . . . . . . 148roadmap . . . . . . . . . . . . . . . . . . . . . . . . . . . . . . . . . . . . . . . . . . . . . . . . . . . . . . . . . . . . . . . . . . . . . . . . . . . . . . . . . . . 4roughness . . . . . . . . . . . . . . . . . . . . . . . . . . . . . . . . . . . . . . . . . . . . . . . . . . . . . . . . . . . . . . . . . . . . . . . . . . . . . . . . . 54RPE65 . . . . . . . . . . . . . . . . . . . . . . . . . . . . . . . . . . . . . . . . . . . . . . . . . . . . . . . . . . . . . . . . . . . . . . . . . . . . . . . . . . 126saccule . . . . . . . . . . . . . . . . . . . . . . . . . . . . . . . . . . . . . . . . . . . . . . . . . . . . . . . . . . . . . . . . . . . . . . . . . . . . . . . . . . . 99SRBP . . . . . . . . . . . . . . . . . . . . . . . . . . . . . . . . . . . . . . . . . . . . . . . . . . . . . . . . . . . . . . . . 105, 107, 127-129, 131-142stellate . . . . . . . . . . . . . . . . . . . . . . . . . . . . . . . . . . . . . . . . . . . . . . . . . . . . . . . . . . . . . . . . . . . . . . . . . . . . . . . . . . . 23stress . . . . . . . . . . . . . . . . . . . . . . . . . . . . . . . . . . . . . . . . . . . . . . . . . . . . . . . . . . . . . . . . . . . . . . . . 1, 38, 94, 123, 140synapse . . . . . . . . . . . . . . . . . . . . . . . . . . . . . . . . . . . . . . . . . . . . . . . . . . . . . . . . . . . . . . . . 16, 76, 79, 81, 82, 148, 149threshold . . . . . . . . . . . . . . . . . . . . . . . . . . . . . . . . . . . . . . . . . . . . . . . . . . . . . . . . . . . . . . . . . . . . . . . . . . . . . . . 69, 85TMS . . . . . . . . . . . . . . . . . . . . . . . . . . . . . . . . . . . . . . . . . . . . . . . . . . . . . . . . . . . . . . . . . . . . . . . . . . . . . . . . . . . . . 7-9tomography . . . . . . . . . . . . . . . . . . . . . . . . . . . . . . . . . . . . . . . . . . . . . . . . . . . . . . . . . . . . . . . . . . . . . . . . . . . . . . . 78topography . . . . . . . . . . . . . . . . . . . . . . . . . . . . . . . . . . . . . . . . . . . . . . . . . . . . . . . . . . . . . . . . . . . . . . . . . . . . 1, 9, 71topology . . . . . . . . . . . . . . . . . . . . . . . . . . . . . . . . . . . . . . . . . . . . . . . . . . . . . . . . . . . . . . . . . . 1, 13, 83, 131, 143, 144transduction . . . . . . . . . . . . . . . . . . . . . . . . . . . . . . . . . . . . . . . . . . . . . . . . . . 8, 9, 18, 45, 50, 117, 118, 125, 142, 143transistor action . . . . . . . . . . . . . . . . . . . . . . . . . . . . . . . . . . . . . . . . . . . . . . . . . . . . . . . . . . . . . . . . . . 11, 12, 82, 143Transistor Effect . . . . . . . . . . . . . . . . . . . . . . . . . . . . . . . . . . . . . . . . . . . . . . . . . . . . . . . . . . . . . . . . . . . . . . . . . . . . 20translation . . . . . . . . . . . . . . . . . . . . . . . . . . . . . . . . . . . . . . . . . . . . . . . . . . . . . . . . . . . . . . . . . . . . . . 18, 45, 143, 145trans- . . . . . . . . . . . . . . . . . . . . . . . . . . . . . . . . . . . . . . . . 62, 65, 96, 106, 112-114, 118, 123, 124, 127, 134, 139, 141TTR . . . . . . . . . . . . . . . . . . . . . . . . . . . . . . . . . . . . . . . . . . . . . . . . . . . . . . . . . . . . . . . . . 127, 128, 133, 135, 137, 140type C . . . . . . . . . . . . . . . . . . . . . . . . . . . . . . . . . . . . . . . . . . . . . . . . . . . . . . . . . . . . . . . . . . . . . . . . . 14, 15, 46-48, 75Verhoeff’s . . . . . . . . . . . . . . . . . . . . . . . . . . . . . . . . . . . . . . . . . . . . . . . . . . . . . . . . . . . . . . . . . . . . . . . . . . . . . . . . 89vitamin A1 . . . . . . . . . . . . . . . . . . . . . . . . . . . . . . . . . . . . . . . . . . . . . . . . . . . . . . . . . . . . . . . . . . . . . . . . . . . . 97, 125
156 Processes in Biological Vision
vitamin A2 . . . . . . . . . . . . . . . . . . . . . . . . . . . . . . . . . . . . . . . . . . . . . . . . . . . . . . . . . . . . . . . . . . . . . . . . . . . . 97, 125voltage clamp . . . . . . . . . . . . . . . . . . . . . . . . . . . . . . . . . . . . . . . . . . . . . . . . . . . . . . . . . . . . . . . . . . . . . . . . . . . . . 147waveguide . . . . . . . . . . . . . . . . . . . . . . . . . . . . . . . . . . . . . . . . . . . . . . . . . . . . . . . . . . . . . . . . . . . . . . . 47, 50, 69, 87xxx . . . . . . . . . . . 8, 11, 18, 22, 25, 27-29, 33, 41, 43, 48, 50, 56, 59, 67, 73, 77, 82, 86, 101, 107, 114-116, 121, 149X-ray . . . . . . . . . . . . . . . . . . . . . . . . . . . . . . . . . . . . . . . . . . . . . . . . . . . . . . . . . . . . . . . . . . . . . . . . . . . 64, 68, 73, 96[xxx . . . . . . . . . . . . . . . . . . . . . . . . . . . . . . . . . . . . . . . . . . . . . . . . . . . . . . . . 10, 11, 67, 70, 82, 83, 97, 101, 108, 116
(Inactive) DEFINITIONS INDEX (Use individual marks)Principle of UnivarianceRetinal illuminanceTransport delay
net photoreceptor