Price convergence after the Eastern EU enlargement? Evidence from
Price Convergence after the Eastern Enlargement of the EU:
Evidence from Retail Food Prices
October 8, 2014
Andreas Lindenblatt∗, Switgard Feuerstein†
Abstract
Using detailed micro data on European retail food prices for EU15 and all
eight Central and Eastern European accession countries, we analyse price con-
vergence within the European Union after the enlargement shock in 2004.
Testing for σ-convergence, we �nd strong price convergence within EU23,
which is mainly explained by convergence between and not within the two
subgroups of the old and the new member states.
Keywords:
Price convergence · Sigma convergence · International price dispersion · Law of one price · Euro-pean Union · EU enlargement · Central and Eastern European Countries
JEL Classi�cation:
F0 · F15 · E31 · L81
Acknowledgements:
We are grateful to Paul Konijn of Eurostat for providing us with the data for our research. More-
over, we thank Peter Egger, Michael Pfa�ermayr as well as participants and discussants of the
ETSG in Copenhagen, the Annual Meeting of the Committee for International Economics of the
'Verein für Socialpolitik' in Kiel, the 11th annual GEP postgraduate conference in Nottingham
and EARIE in Rome for helpful comments.
Switgard Feuerstein gratefully acknowledges �nancial support from the Marie Curie Programme of
the European Union (Project No. 25679) for the research visit at GEP, University of Nottingham.
∗Department of Economics, University of Heidelberg, Bergheimerstr. 58, D-69115 Heidelberg, Germany, Phone: +49-6221-542909, Fax: +49-6221-543176, E-Mail:[email protected] (Corresponding Author)†Department of Economics, University of Heidelberg, Bergheimerstr. 58, D-69115 Heidelberg,
Germany, Phone: +49-6221-543170, Fax: +49-6221-543176, E-Mail: [email protected] and GEP, University of Nottingham
1 Introduction
This paper studies the e�ect of the EU enlargement in 2004 on food price conver-
gence. Using comprehensive Eurostat data1, it is the �rst study looking at price
convergence of retail prices at a disaggregate level, both for the old member states
(EU15) and the eight new Central and Eastern European member states (EU8).
The data allows us to look at price convergence for a time period that includes more
than just the initial e�ects right after the EU enlargement.
Within the single market of the European Union, large price di�erences for identical
products are well documented, which can only partly be explained by cost di�erences
or by di�ering overall price levels. In general, it was expected that these price di�er-
ences decrease over time, as ongoing market integration amounts to convergence of
prices. There are, however, also reasons why price di�erences may persist and need
not disappear. Especially in the retail sector, price di�erences for individual prod-
ucts are feasible even in competitive markets. If retailing gives a value-adding service
to consumers, arbitrage will not take place. After some adjustment, a constant level
of price dispersion may be reached. Price convergence will only be observed if this
steady state is not yet reached or if there is a new steady state due to an external
shock. It is hence an empirical question, to what extent prices converge after an
external shock like the Eastern enlargement of the EU in 2004. The results are of
political relevance, as Dreger et al. (2008) point out that, "price convergence facil-
itates the working of common economic policies". In this context, the food market
is particularly interesting. While in most sectors, trade liberalization took place
gradually over the whole decade before the accession, the agricultural sector was
only liberalized in 2004.
Until the 1990s, price convergence was thought of as β-convergence (mean reversion),
which is found in virtually all studies on European prices. However, in the recent
literature it has been widely discussed that β-convergence is not su�cient for price
convergence in the sense of a decreasing price dispersion between countries. It is
possible to observe signi�cant mean reversion, while the variance of prices increases
due to ongoing random shocks on prices. Hence, it is necessary to examine σ-
convergence, which is de�ned as a decrease of the variance over time (Barro & Sala i
Martin, 1995; Carree & Klomp, 1997). This point is further discussed in section 4.
Applying a test for σ-convergence by Egger & Pfa�ermayr (2009), we �nd price
divergence within the European Union as a whole in the lead-up to accession, but
price convergence thereafter. Furthermore, we decompose the variance of prices and
conclude that price convergence within the EU as a whole is partly driven by the
dynamics within EU8, but the main e�ect is convergence between EU8's and EU15's
prices.
The paper is organized as follows. Section 2 gives a short overview of the literature.
1We thank Paul Konijn of Eurostat for providing us with the data.
1
In sections 3 and 4, we present the data and the method used. Section 5 looks at
σ-convergence as well as its decomposition and section 6 concludes.
2 Retailing, the EU and price convergence
According to the law of one price (LOOP), on a perfectly integrated market a good
will only have one price. When the European Single Market was introduced in 1992,
it was therefore widely expected that prices would converge within the European
Union and that price di�erences between member countries would merely re�ect
remaining cost di�erences, such as transport costs or di�ering value added taxes
(Cecchini et al., 1988). Similar expectations emerged when the European Monetary
Union (EMU) started (European Commission, 1990).
There are, however, also reasons why price di�erences are observed and may persist
over time. Retail prices do not only include production costs or import prices, but
also retailing costs, which to a large extent re�ect labour costs, and pro�t margins.
Price di�erences for identical products are feasible as long as they do not exceed
arbitrage costs (which may well be higher than mere transportation costs). Taking
into account that retailing gives a value-adding service to consumers, arbitrage will
hardly take place at the level of retailing and price di�erences may persist over time
even when all trade barriers have been removed.
Price levels are in general lower in countries with a low per capita income. The
accession of the Central and Eastern European transition countries, which have
low price levels, has increased price dispersion within the EU. Dreger et al. (2008)
emphasize two countervailing e�ects on the price indices of these countries. The
integration into the internal market will increase competition and thereby lower
prices, while the process of catching up increases prices due to the Balassa-Samuelson
e�ect, i.e. due to rising wages. When the second e�ect dominates, rising labour costs
lead to rising prices. Price di�erences within the EU become smaller and thus price
convergence is observed.
However, price patterns are much more complex than just some countries having
high prices and other countries having low prices. Relative prices of pairs of goods
also vary a lot among the member states of the EU, with individual products being
relatively expensive in some countries and relatively cheep in others (see section
3). Such price di�erences may re�ect di�erent mark-ups for the same product in
di�erent countries, thus they might emerge from price setting behaviour in the retail
sector. Bliss (1988) develops a theory of retail pricing and suggests that mark-
ups to cover overhead-costs will be set according to Ramsey-taxation rules, leading
to higher mark-ups for goods with a lower elasticity of demand. Consequently,
retail prices for individual products will vary within a group of countries as long as
demand patterns � and therefore elasticities of demand � di�er, even in competitive
2
markets. Such di�erences in product-speci�c pro�t margins can explain long-run
price di�erences for individual products. MacDonald & Ricci (2005) discuss the
e�ect of the distribution sector in the context of PPP, albeit at a highly aggregate
level.
There are thus forces reducing price di�erences in integrated markets, but also rea-
sons for long-run price di�erences. These countervailing e�ects eventually balance,
and a constant level of price dispersion will be reached. Price convergence is ob-
served when this state is not reached yet, or when an external shock has changed
the steady state. It is thus an empirical question whether in a given situation prices
converge.
Empirical studies show that the law of one price does not hold within the European
Union. Large price di�erences for identical products are observed, which cannot
be explained by cost di�erences (see e.g. Cumby (1996) for Big Mac Hamburgers,
Haskel & Wolf (2001) for prices of IKEA, a furniture retailer, and Goldberg &
Verboven (2004) for cars). In view of these price di�erences, several studies looked
at σ-convergence of retail prices within the European Union. Egger et al. (2009)
�nd some signi�cant σ-convergence for tradeable but not for non-tradeable goods
for EU12 in the time period when the internal market was introduced (1990 - 1996).
Wolszczak-Derlacz & De Blander (2009) reject price convergence within EU15 and
three selected new member-states in the following ten years from 1995 - 2005, and
Parsley & Wei (2008) do not �nd price convergence for Big Macs during the time of
the Euro changeover within the countries of the European Monetary Union (EMU).
For the same time period (1995 - 2005), Fischer (2012) �nds large variation of
the prices of washing machines and even price divergence within EU15. Moreover,
EMU seems to have had no e�ect on price convergence. Only two studies have
data available for all new member states of the European Union, both using data
until 2005. While Funke & Koske (2008) only look at mean reversion and not at
σ-convergence, Dreger et al. (2008) �nd small (initial) e�ects of the EU enlargement
on convergence.
On the whole, there is hardly any evidence for price convergence within the EU. Our
paper expands the existing literature in several dimensions. By covering the EU15
and all Central and Eastern European countries, which acceded the EU in 2004, as
well as extending the period considered until 2009, it accounts for the full magnitude
of the enlargement shock. It includes not only initial, but also medium-term e�ects
on prices. Moreover, the analysis uses disaggregate data. We can thus study com-
prehensively, whether or not after the external shock of Eastern enlargement, retail
food price convergence has taken place within the new EU. Moreover, we decompose
convergence into within and between subgroups convergence.
3
3 The data
In the framework of the Eurostat-OECD Purchasing Power Parity Program (PPP),
retail prices for more than 400 narrowly de�ned food products are collected every
three years (e.g. "fresh milk, unskimmed, 1 liter, well known brand"). For every
product, employees of the respective national statistical bureau collect prices at
15-20 di�erent outlets ignoring short term price reductions such as promotional
o�ers.2 Prices are then adjusted for spatial and seasonal e�ects (e.g. for fruit, �sh,
etc.) and weighted such that for the given product the average price re�ects the
national shopping pattern (with regard to the di�erent types of outlets). As prices
are reported in their national currencies, they are converted into euro with the o�cial
Eurostat exchange rate for the given year. The data is available for the three waves
2003, 2006 and 2009 and shows that there are large price di�erences for identical
products within the EU, and also within EU15 (Eurostat, 2010). Unfortunately, not
all products can be traced over time, as the set of products has somewhat changed.
Moreover, countries only collect prices that they consider relevant, meaning that not
all countries report all prices, which results in missing data. Matching the products
of these three waves, we have compiled a data set of 147 products. For a more
detailed description of the data see European Commission (2006).
Eurostat also provides the data at a semi-aggregate level of 34 product group price
indices (also called "basic headings", e.g. fresh milk, pasta), and there are good
reasons to analyse data at this level as well. In contrast to the individual products,
there are observations for all countries for every product group and problems of
missing data do not occur. Moreover, the price indices are available for a longer
time period (1995-2009 for EU15 and 2001-2009 for EU25), allowing us to consider
price dispersion also in the period before accession. Hence, in section 5 the analysis
of price convergence is conducted both at the level of individual products and at the
level of the product groups.3
In the following analysis, we distinguish between three groups of countries. (i) the
old member countries EU15, (ii) the Central and Eastern European countries EU8,
which accessed the EU in 2004, and (iii) these two groups together as EU23.4 Since
Bulgaria and Romania only joined in 2007 and data is not available before 2006,
these two countries are left out. Moreover, we omit Malta and Cyprus. Their
situation as small island states is hardly comparable to the EU8.
Starting at the highest level of aggregation � the consumer price index food and
non-alcoholic beverages (CPI-food) � large price index di�erences within EU23 are
2For speci�ed brands, the price is collected in 5-10 outlets.3Other papers on price convergence, which are based on data from the Eurostat OECD PPP
program, look at the product group level (e.g. Egger et al., 2009) or an even more aggregate level(e.g. Dreger et al., 2008). They do not use individual product prices.
4One other group that comes directly to mind are the EMU countries. We do not report resultsfor this subgroup as these do not di�er from EU15.
4
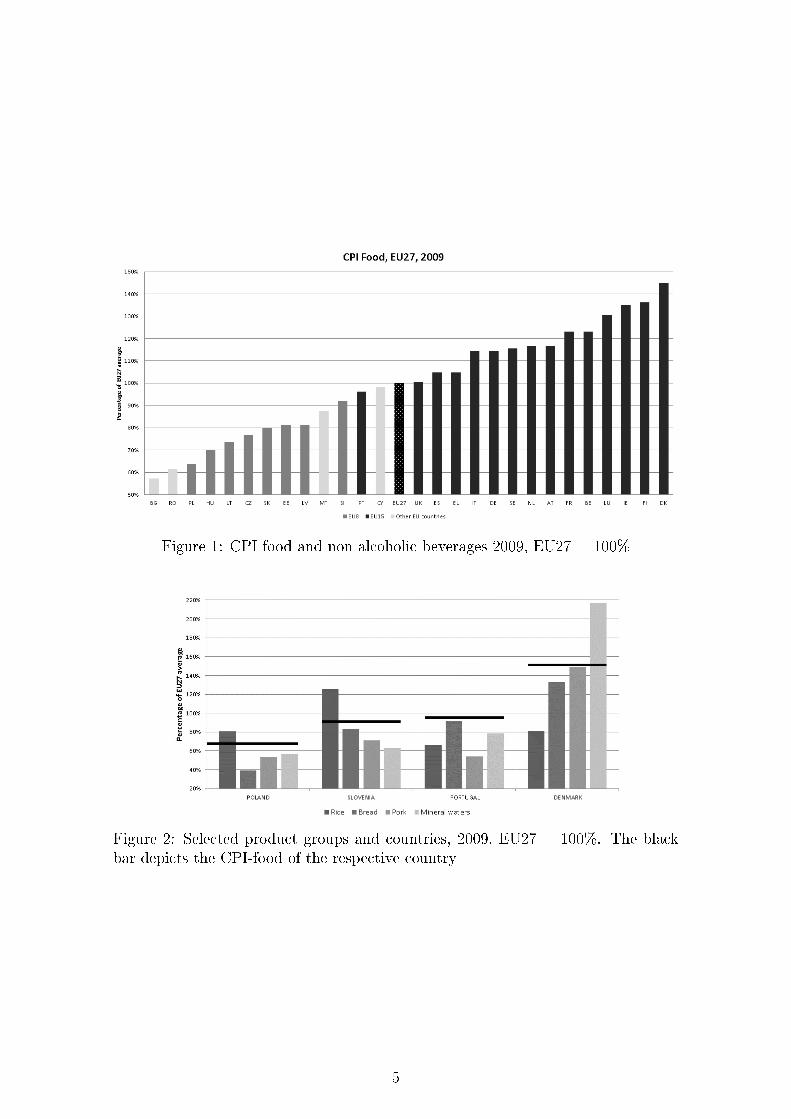
Figure 1: CPI food and non alcoholic beverages 2009, EU27 = 100%
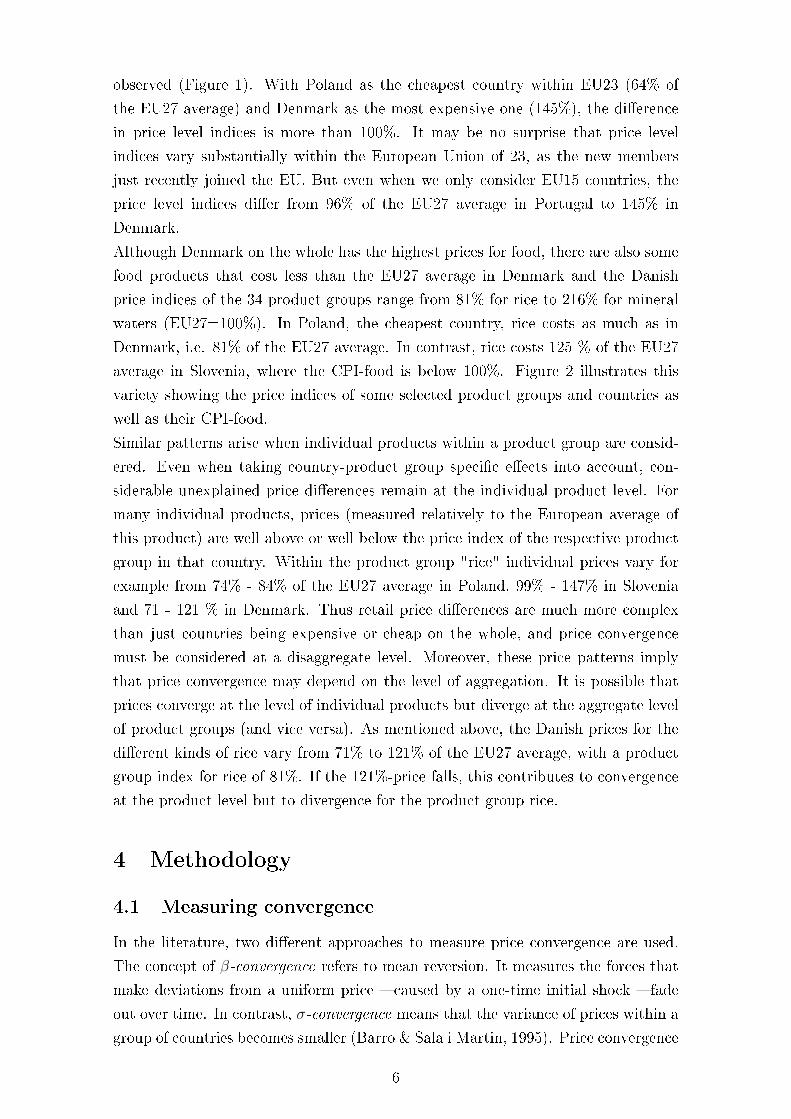
Figure 2: Selected product groups and countries, 2009, EU27 = 100%. The blackbar depicts the CPI-food of the respective country
5
observed (Figure 1). With Poland as the cheapest country within EU23 (64% of
the EU27 average) and Denmark as the most expensive one (145%), the di�erence
in price level indices is more than 100%. It may be no surprise that price level
indices vary substantially within the European Union of 23, as the new members
just recently joined the EU. But even when we only consider EU15 countries, the
price level indices di�er from 96% of the EU27 average in Portugal to 145% in
Denmark.
Although Denmark on the whole has the highest prices for food, there are also some
food products that cost less than the EU27 average in Denmark and the Danish
price indices of the 34 product groups range from 81% for rice to 216% for mineral
waters (EU27=100%). In Poland, the cheapest country, rice costs as much as in
Denmark, i.e. 81% of the EU27 average. In contrast, rice costs 125 % of the EU27
average in Slovenia, where the CPI-food is below 100%. Figure 2 illustrates this
variety showing the price indices of some selected product groups and countries as
well as their CPI-food.
Similar patterns arise when individual products within a product group are consid-
ered. Even when taking country-product group speci�c e�ects into account, con-
siderable unexplained price di�erences remain at the individual product level. For
many individual products, prices (measured relatively to the European average of
this product) are well above or well below the price index of the respective product
group in that country. Within the product group "rice" individual prices vary for
example from 74% - 84% of the EU27 average in Poland, 99% - 147% in Slovenia
and 71 - 121 % in Denmark. Thus retail price di�erences are much more complex
than just countries being expensive or cheap on the whole, and price convergence
must be considered at a disaggregate level. Moreover, these price patterns imply
that price convergence may depend on the level of aggregation. It is possible that
prices converge at the level of individual products but diverge at the aggregate level
of product groups (and vice versa). As mentioned above, the Danish prices for the
di�erent kinds of rice vary from 71% to 121% of the EU27 average, with a product
group index for rice of 81%. If the 121%-price falls, this contributes to convergence
at the product level but to divergence for the product group rice.
4 Methodology
4.1 Measuring convergence
In the literature, two di�erent approaches to measure price convergence are used.
The concept of β-convergence refers to mean reversion. It measures the forces that
make deviations from a uniform price � caused by a one-time initial shock � fade
out over time. In contrast, σ-convergence means that the variance of prices within a
group of countries becomes smaller (Barro & Sala i Martin, 1995). Price convergence
6
is only ensured if the mean reversion is strong enough to dominate the dispersion
induced by ongoing additional random shocks. To analyse σ-convergence, we apply a
Wald-test proposed by Egger & Pfa�ermayr (2009), which tests whether the variance
has declined between two points in time, t0 and t1.5 The advantage of this test is that
it neither needs long time-spans or high frequency data nor it is biased by pooling
over several points in time. The test is based on the β-convergence regression6:
pik(t1) = αk + π · pik(t0) + uikt1 (1)
pik(t1) = ln(P ik(t1)) is the natural logarithm of price P of product (or product group)
k in country i in period t1. It is regressed on pik(t0), the log price in period t0. As
the mean � i.e. the average of the log prices � towards which reversion is measured
might be product speci�c, a product �xed e�ects αk is employed. Mean reversion
measures the decrease of deviations of prices from the (product k speci�c) country
groups average. The coe�cient π can then be interpreted as the remainder of period
t0`s price deviation in period t1 and π < 1 implies mean reversion. The smaller is π,
the stronger is the mean reversion.
In addition to the mean reversion, there are random shocks captured in the error
terms uikt. Hence β-convergence does not necessarily imply that price dispersion
actually decreases.
For the Wald-test whether the variance σ2t declined over time against the null hy-
pothesis that the variance remained constant (H0 : σ2t0
= σ2t1vs. H1 : σ2
t0> σ2
t1),
Egger & Pfa�ermayr (2009) derive the following test statistic, which is χ2(1) dis-
tributed7 :
W0 =N(σ̂2
t0(π̂2 − 1) + σ̂2
u)2
4σ̂4t0σ̂
2u
∼ χ2(1) (2)
To calculate this one-sided test, the estimated variance of the regression's residuals
σ̂2u and the corresponding coe�cient π̂ as well as the number of observations N
are taken from the β-convergence regression above. In addition, we need σ̂2t0, the
5Another approach would be to look at non-parametric methods as in Quah (1996), who showsthat even without σ-convergence, "convergence clubs" may evolve. In our research we follow theparametric σ-convergence literature, as we look at how exogenously given groups evolve.
6In the literature, an equivalent formulation of the regression above exists (hence the nameβ-convergence):
∆pik(t1) = α+ β · pik(t0) + uikt1
7The same test can be used to test for divergence:
H0 : σ2t0 = σ2
t1 vs. H1 : σ2t0 < σ2
t1
7
estimated variance of prices at the initial date t0, which is de�ned as:
σ̂2t0
=1
N
K∑k=1
Ik∑i=1
(pik(t0)− p̄k(t0))2 (3)
Here K is the total number of products (or product groups), Ik is the number of
reporting countries for product (or product group) k and N =∑K
k=1 Ik is the total
number of observations. For the 34 product groups, Ik always equals 8, 15 or 23
respectively. For the individual products, Ik varies.8 Note that price convergence
is conditional on the product (but not on the country), since when calculating the
variance in equation (3), the deviation of each price pik from p̄k is used for each
product (or product group) k. Alternatively, the price data can be demeaned, i.e.
normalized such that p̄k(t) = 1Ik
∑Iki=1 p
ik(t) = 0 for t = t0, t1 and each k (Egger
& Pfa�ermayr, 2009, p. 460, footnote 5). pik(t) is then actually the deviation of
country i's price from the average price across countries (e.g. across EU15 countries).
Price indices in logs are generally demeaned by de�nition, however, for considering
the di�erent groups of countries (EU8, EU15, EU23), also price indices have to be
renormalized such that the mean of the respective country group is equal to zero.
With properly demeaned data, the product �xed e�ects αk in equation (1) will equal
zero.
The considered time period covers the years of the hike and the subsequent fall in
world market food prices in the years 2007 and 2008 and also the recession year 2009.
Insofar as these shocks a�ect prices in the countries considered equally, the e�ects
are captured in the averages p̄k and price convergence is unchanged. However, these
shocks may a�ect prices di�erently or at di�erent speed in di�erent countries, which
could then be interpreted as shocks uik counteracting price convergence.
4.2 Convergence decomposition
For the interpretation of the results on price convergence or divergence, we decom-
pose the variance of a single product group k into within-groups and between-groups
variances:9
σ2k,EU23 =
15
23· σ2
k,EU15 +8
23· σ2
k,EU8 +15
23· p̄2
k,EU15 +8
23· p̄2
k,EU8
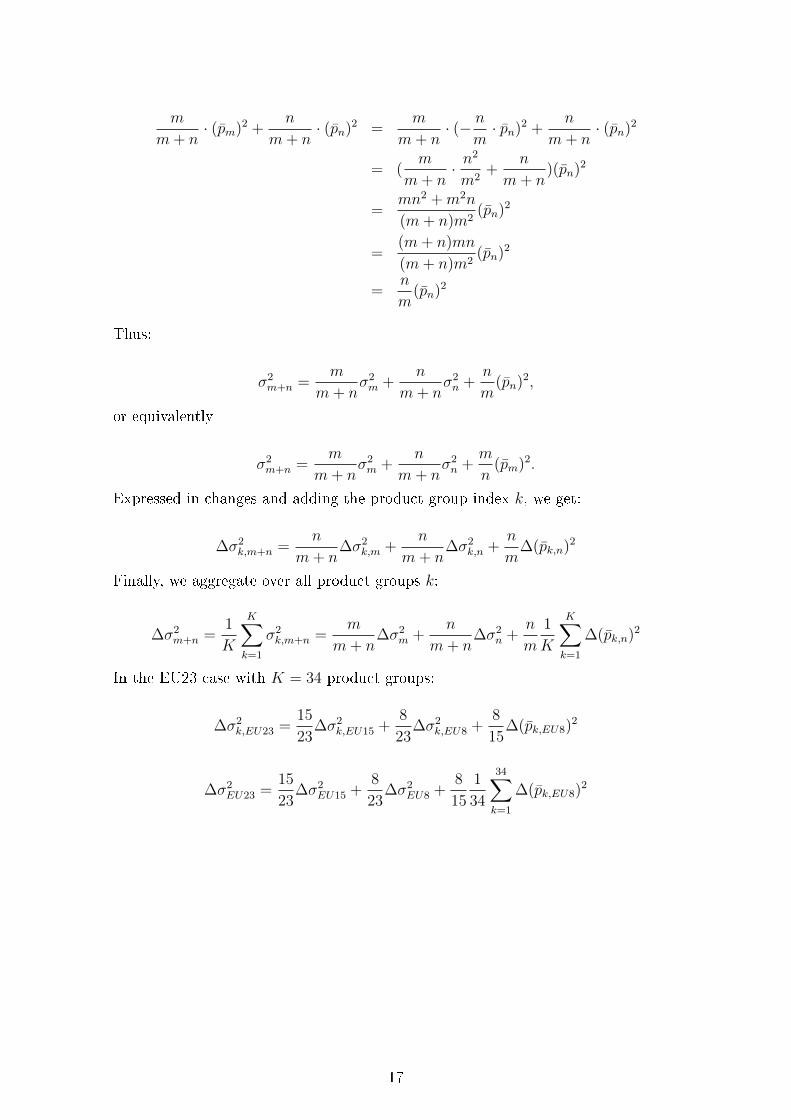
In Appendix A.1, we show that for the special case of price indices, where p̄EU23 = 0,
the decomposition can be further simpli�ed, aggregated over products groups k and
8This expression is more general than in Egger & Pfa�ermayr (2009), as it does not restrict itsuse to cases with the same number of reported observations for every observed entity (e.g. I �rmsin each of K industries).
9The basis of this decomposition is the same as in the one-way analysis of variance (ANOVA).While ANOVA then uses this decomposition to test if the subgroups' population means are thesame, we want to know to what extent the variance between or within subgroups has changed Forthe special case of only two subgroups, ANOVA is actually identical to the t-test (Rabe-Hesketh& Skrondal, 2008).
8
extended to changes (∆σ2EU23 = σ2
EU23,t − σ2EU23,t−1):
∆σ2EU23 =
15
23∆σ2
EU15 +8
23∆σ2
EU8 +8
15
1
34
34∑k=1
∆p̄2k,EU8 (4)
The estimated change of the variance within EU23 equals the weighted sum of
variance changes within the subgroups EU15 and EU8, plus a term measuring the
change of the dispersion between the two subgroups (between-groups variance). To
estimate the signi�cances of the �rst two terms, the Wald-Test proposed above is
used. The latter term's signi�cance can be estimated with a simple paired t-test or
a Wilcoxon matched-pairs signed-ranks test. Note however, that this equation only
refers to the semi-aggregate data at the product group level, as due to the missing
data at the level of individual products, the weights would di�er for the individual
products.
5 σ-convergence
In this section, we analyse σ-convergence both at the level of individual products
and of the product groups. Signi�cant β-convergence is found in all cases, i.e. both
for products and for product groups and for all time periods considered.
5.1 Convergence within country groups at a disaggregate level
- products
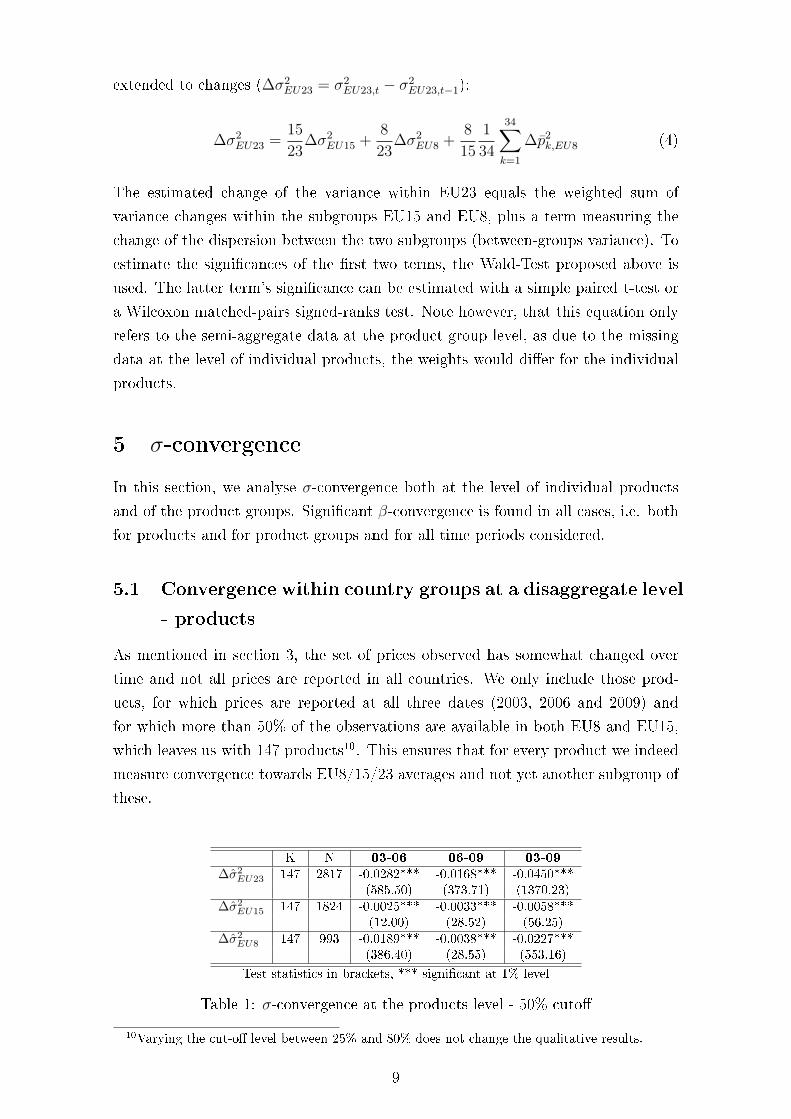
As mentioned in section 3, the set of prices observed has somewhat changed over
time and not all prices are reported in all countries. We only include those prod-
ucts, for which prices are reported at all three dates (2003, 2006 and 2009) and
for which more than 50% of the observations are available in both EU8 and EU15,
which leaves us with 147 products10. This ensures that for every product we indeed
measure convergence towards EU8/15/23 averages and not yet another subgroup of
these.
K N 03-06 06-09 03-09
∆σ̂2EU23 147 2817 -0.0282*** -0.0168*** -0.0450***
(585.50) (373.71) (1370.23)∆σ̂2
EU15 147 1824 -0.0025*** -0.0033*** -0.0058***(12.00) (28.52) (56.25)
∆σ̂2EU8 147 993 -0.0189*** -0.0038*** -0.0227***
(386.40) (28.55) (553.16)
Test statistics in brackets, *** signi�cant at 1% level
Table 1: σ-convergence at the products level - 50% cuto�
10Varying the cut-o� level between 25% and 80% does not change the qualitative results.
9
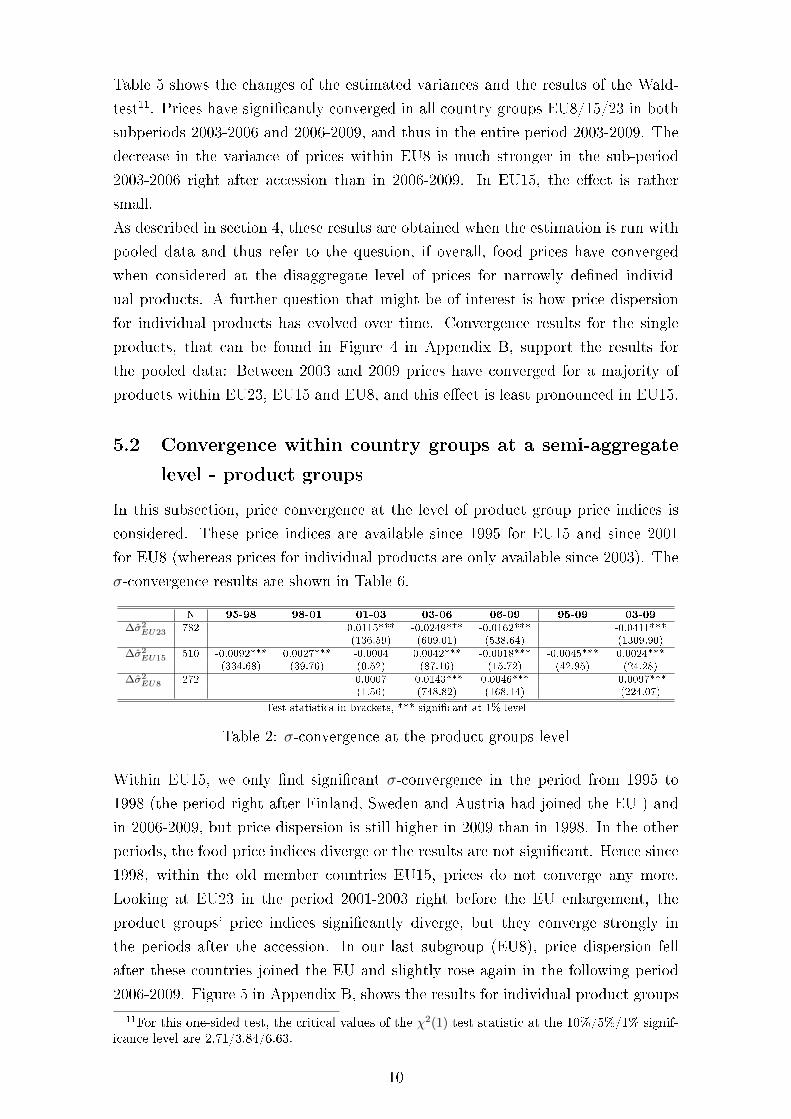
Table 5 shows the changes of the estimated variances and the results of the Wald-
test11. Prices have signi�cantly converged in all country groups EU8/15/23 in both
subperiods 2003-2006 and 2006-2009, and thus in the entire period 2003-2009. The
decrease in the variance of prices within EU8 is much stronger in the sub-period
2003-2006 right after accession than in 2006-2009. In EU15, the e�ect is rather
small.
As described in section 4, these results are obtained when the estimation is run with
pooled data and thus refer to the question, if overall, food prices have converged
when considered at the disaggregate level of prices for narrowly de�ned individ-
ual products. A further question that might be of interest is how price dispersion
for individual products has evolved over time. Convergence results for the single
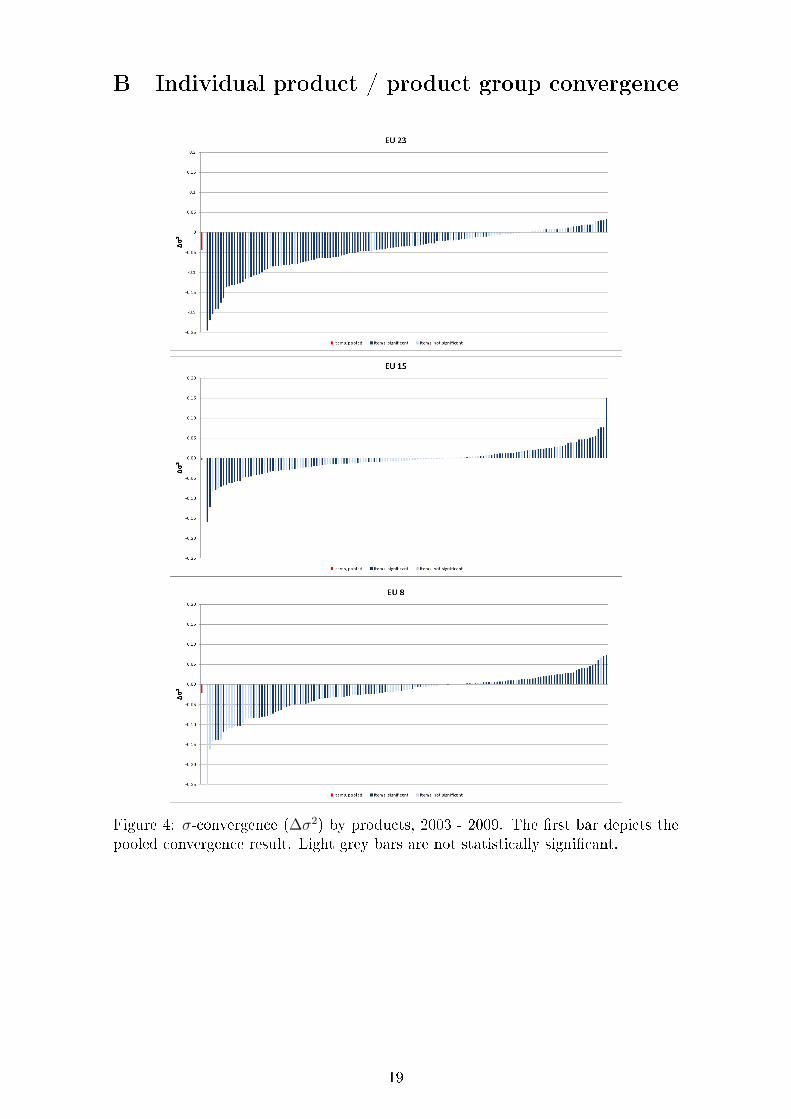
products, that can be found in Figure 4 in Appendix B, support the results for
the pooled data: Between 2003 and 2009 prices have converged for a majority of
products within EU23, EU15 and EU8, and this e�ect is least pronounced in EU15.
5.2 Convergence within country groups at a semi-aggregate
level - product groups
In this subsection, price convergence at the level of product group price indices is
considered. These price indices are available since 1995 for EU15 and since 2001
for EU8 (whereas prices for individual products are only available since 2003). The
σ-convergence results are shown in Table 6.
N 95-98 98-01 01-03 03-06 06-09 95-09 03-09
∆σ̂2EU23 782 0.0115*** -0.0249*** -0.0162*** -0.0411***
(136.59) (609.01) (538.64) (1309.90)∆σ̂2
EU15 510 -0.0092*** 0.0027*** -0.0004 0.0042*** -0.0018*** -0.0045*** 0.0024***(334.68) (39.76) (0.52) (87.16) (15.72) (42.95) (24.28)
∆σ̂2EU8 272 0.0007 -0.0143*** 0.0046*** -0.0097***
(1.56) (748.82) (168.14) (224.07)
Test statistics in brackets, *** signi�cant at 1% level
Table 2: σ-convergence at the product groups level
Within EU15, we only �nd signi�cant σ-convergence in the period from 1995 to
1998 (the period right after Finland, Sweden and Austria had joined the EU ) and
in 2006-2009, but price dispersion is still higher in 2009 than in 1998. In the other
periods, the food price indices diverge or the results are not signi�cant. Hence since
1998, within the old member countries EU15, prices do not converge any more.
Looking at EU23 in the period 2001-2003 right before the EU enlargement, the
product groups' price indices signi�cantly diverge, but they converge strongly in
the periods after the accession. In our last subgroup (EU8), price dispersion fell
after these countries joined the EU and slightly rose again in the following period
2006-2009. Figure 5 in Appendix B, shows the results for individual product groups
11For this one-sided test, the critical values of the χ2(1) test statistic at the 10%/5%/1% signif-icance level are 2.71/3.84/6.63.
10
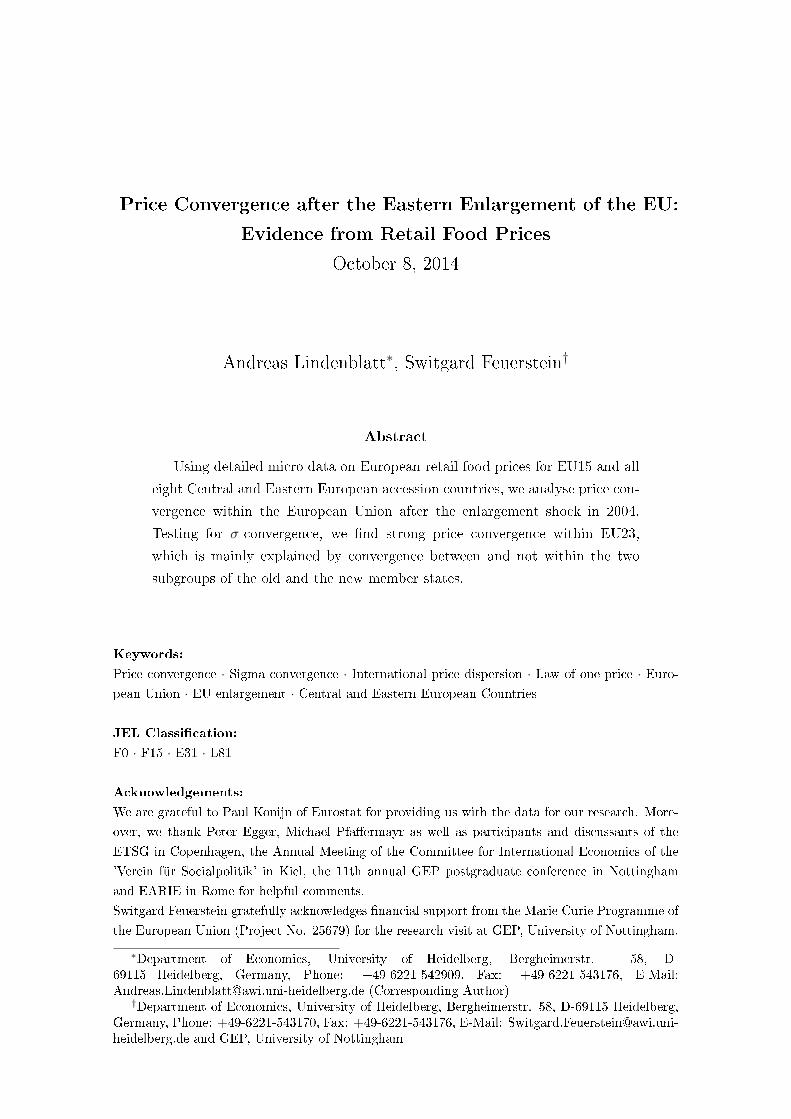
for the period 2003-2009. In EU23, only two product groups diverge, whereas price
dispersion falls for all other product groups. Price indices also converged for most
product groups in EU8. In EU15, the picture is mixed, and on the whole, price
divergence dominates.
Comparing results for individual products and for product groups
Comparing table 1 and table 2 shows, that the results for the disaggregate level of
individual products and the semi-aggregate level of product groups di�er in some
cases. Results are sensitive to the level of aggregation. While at the level of invidual
products, prices converge in all cases considered, this does not hold for the product
group indices. For EU15, product group price indices diverge in the period 2003-
2006, and this e�ect is so strong, that there is also divergence for the longer period
of 2003-2009. In the EU8, price indices diverged between 2006 and 2009, but in the
longer period of 2003-2009, this divergence is dominated by the strong convergence
in the earlier period of 2003-2006.
However, the di�ering results are not inconsistent with each other. There are several
explanations why convergence at the level of individual products may di�er from
convergence for the product groups. First, we restrict our dataset to products that
are su�ciently common (50% of EU8 as well as 50% of EU15 countries reporting
prices), which most likely di�ers from the products used in each country for product
group aggregation. These most common products might converge faster than the
other ones. Second, the products in a given basket might enter with di�erent weights.
Thirdly, when aggregating the prices from products to product groups, relatively
cheap and relatively expensive products average out. As discussed in section 3, it is
possible that a price change contributes to convergence at the product level but to
divergence at the level of product groups (and vice versa).
Note however that the result of price convergence in EU23 both in the periods 2003-
2006 and 2006-2009 is robust. When considering the long period 2003-2009 after
accession, the result of price convergence within the EU8 also holds both at the
disaggregate level of products and of product groups. In contrast, within the group
of the old member countries EU15, prices converged between 2003 and 2009 when
considered for individual products, but diverged at the product group level.
Thus it may indeed be relevant whether price convergence is considered based on
disaggregate or on semi-aggregate data. Prices for narrowly de�ned products, that
are widespread in Europe, converged in EU15 on the whole, but this is not re�ected
at the level of price indices for the product groups.
11
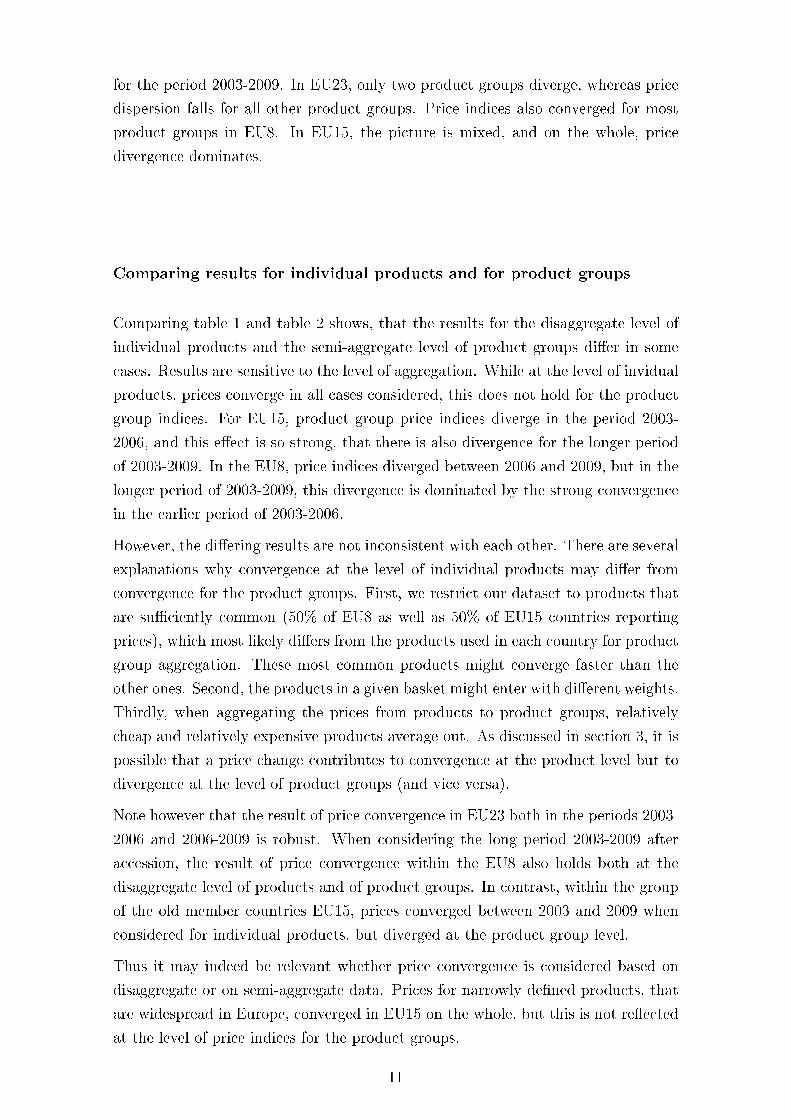
5.3 Convergence between country groups
The σ-convergence results within country groups suggest, that the strong conver-
gence within EU23 could be caused by convergence between EU15 and EU8 and
not mainly by convergence within these two subgroups. To further investigate this
point, we look at the variance decomposition at the product group level (see section
4.2). Table 3 summarizes the results.12
N 01-03 03-06 06-09 03-09
∆σ̂2EU23 782 0.0115*** -0.0249*** -0.0162*** -0.0411***
1523∆σ̂2
EU15 510 -0.0002 0.0027*** -0.0012*** 0.0015***823∆σ̂2
EU8 272 0.0002 -0.0050*** 0.0016*** -0.0034***815
1K
∑Kk=1 ∆p̄2k,EU8 272 0.0115*** -0.0227*** -0.0166*** -0.0394***
*** signi�cant at 1%-level
Table 3: σ-convergence decomposition at the product groups level
In the period before the accession (2001-2003), price dispersion both within EU8
and EU15 remained virtually unchanged. Price divergence within EU23 can be
explained by the fact that price di�erences between EU15 and EU8 increased. In
the period 2003-2009, i.e. after the enlargement shock, the decline in between-
groups variance amounts to more than 90% of the total convergence. In the last
sub-period considered (2006-2009), there would not be any convergence in EU23
without convergence between the old and new member states. Hence the driving
force behind the strong convergence within EU23 after the EU enlargement in 2004 is
not convergence within these two subgroups, but between them. In 2003, p̄EU8 (the
average of price indices of all product groups in all EU8 countries) was 33% lower
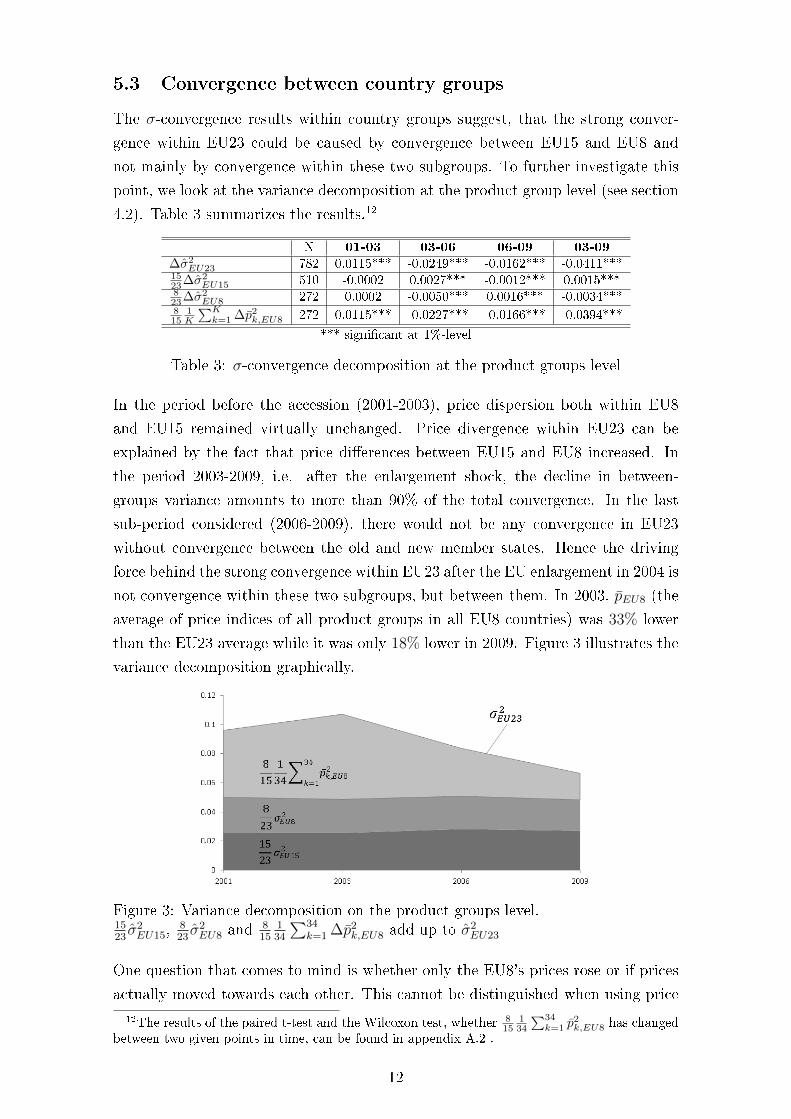
than the EU23 average while it was only 18% lower in 2009. Figure 3 illustrates the
variance decomposition graphically.
Figure 3: Variance decomposition on the product groups level.1523σ̂2EU15,
823σ̂2EU8 and
815
134
∑34k=1 ∆p̄2
k,EU8 add up to σ̂2EU23
One question that comes to mind is whether only the EU8's prices rose or if prices
actually moved towards each other. This cannot be distinguished when using price
12The results of the paired t-test and the Wilcoxon test, whether 815
134
∑34k=1 p̄
2k,EU8 has changed
between two given points in time, can be found in appendix A.2 .
12
indices. By construction, if one subgroup becomes relatively more expensive, the
mean of the whole sample changes and hence the other subgroup has to become rel-
atively less expensive. However, if we look at food prices at the individual product
level, we �nd that the average price increase per year between 2003 and 2009 within
EU15 was only 0.9%. In real terms prices then have actually moved towards each
other.
6 Conclusion
As on a perfectly integrated market, a good can only have one price, it is widely
expected that ongoing market integration leads to price convergence, thereby en-
hancing e�ciency. However, from a theoretical point of view, prices need not neces-
sarily converge, as for instance retailing services are non-tradable and arbitrage will
be reluctant to react to retail price di�erences. Nevertheless, if price convergence
occurs, this can be interpreted as an indicator of market integration, showing that
the internal market project, which aims at increasing welfare, works well. This idea
can be applied to the new Central and Eastern European member states: price con-
vergence may indicate that these countries successfully integrate into the markets
of the European Union.
Using a unique micro level data set on retail food prices from the Eurostat-OECD
PPP Program, we �nd that in the lead-up to accession (2001-2003), food prices
diverged within EU23. In contrast, price convergence has occured after 2003, in-
dicating that the enlargement had a vital e�ect on food price dispersion. Given
that price convergence is found, the underlying dynamics and subgroup behavior
is of interest. The driving force behind price convergence in the European Union
is convergence between the two groups of countries EU8 and EU15, with the dif-
ference of average prices for food products of these two groups becoming smaller.
A subsequent research question could be whether convergence clubs as described
in Quah (1996) will endogeneously emerge. The possibly evolving clubs would not
necessarily have to coincide with the exogeneously determined country groups EU8
and EU15. We leave this question to further research.
13
References
Barro, R. J., & Sala i Martin, X. (1995). Economic growth. McGraw-Hill advanced
series in economics. New York, NY [u.a.]: McGraw-Hill.
Bliss, C. (1988). A theory of retail pricing. Journal of Industrial Economics, 36(4),
375 � 391.
Carree, M., & Klomp, L. (1997). Testing the convergence hypothesis: A comment.
Review of Economics and Statistics, 79(4), 683�686.
Cecchini, P., Catinat, M., & Jacquemin, A. (1988). The European challenge, 1992:
the bene�ts of a single market. The European Challenge. Gower Publishing Co.,
Brook�eld, Vermont.
Cumby, R. (1996). Forecasting exchange rates and relative prices with the Ham-
burger Standard. NBER Working paper, (no. 5878).
Dreger, C., Kholodilin, K., Lommatzsch, K., Sla£álek, J., & Wozniak, P. (2008).
Price convergence in an enlarged internal market. Eastern European Economics,
46(5), 57�68.
Egger, P., Gruber, S., & Pfa�ermayr, M. (2009). The law of one price: A new
econometric approach and evidence from disaggregated data. Applied Economics,
41(26), 3345�3357.
Egger, P., & Pfa�ermayr, M. (2009). On testing conditional sigma-convergence.
Oxford Bulletin of Economics and Statistics, 71(4), 453�473.
European Commission (1990). One market, one money: An evaluation of the po-
tential bene�ts and costs of forming an economic and monetary union. European
Economy, (44).
European Commission (2006). Eurostat-OECD methodological manual on purchas-
ing power parities. European Commission / OECD.
Eurostat (2010). Price levels for food, beverages and tobacco across the European
market di�er signi�cantly . Statistics in Focus, (30).
Fischer, C. (2012). Price convergence in the EMU? Evidence from micro data.
European Economic Review, 56(4), 757 � 776.
Funke, K., & Koske, I. (2008). Does the Law of One Price Hold within the EU? A
Panel Analysis. International Advances in Economic Research, 14(1), 11�24.
Goldberg, P. K., & Verboven, F. (2004). Cross-country price dispersion in the euro
era: A case study of the European car market. Economic Policy 40.
14
Haskel, J., & Wolf, H. (2001). The law of one price � a case study. Scandinavian
Journal of Economics, 103(4), 545 � 558.
MacDonald, R., & Ricci, L. A. (2005). The real exchange rate and the Balassa�
Samuelson e�ect: The role of the distribution sector. Paci�c Economic Review,
10(1), 29�48.
Parsley, D., & Wei, S.-J. (2008). In search of a euro e�ect: Big lessons from a Big
Mac meal? Journal of International Money and Finance, 27(2), 260 � 276.
Quah, D. T. (1996). Empirics for economic growth and convergence. European
economic review, 40(6), 1353�1375.
Rabe-Hesketh, S., & Skrondal, A. (2008). Multilevel and longitudinal modelling
using Stata. STATA press.
Wolszczak-Derlacz, J., & De Blander, R. (2009). Price convergence in the European
Union and in the new member states. Bank i Kredyt, 40(2), 37�59.
15
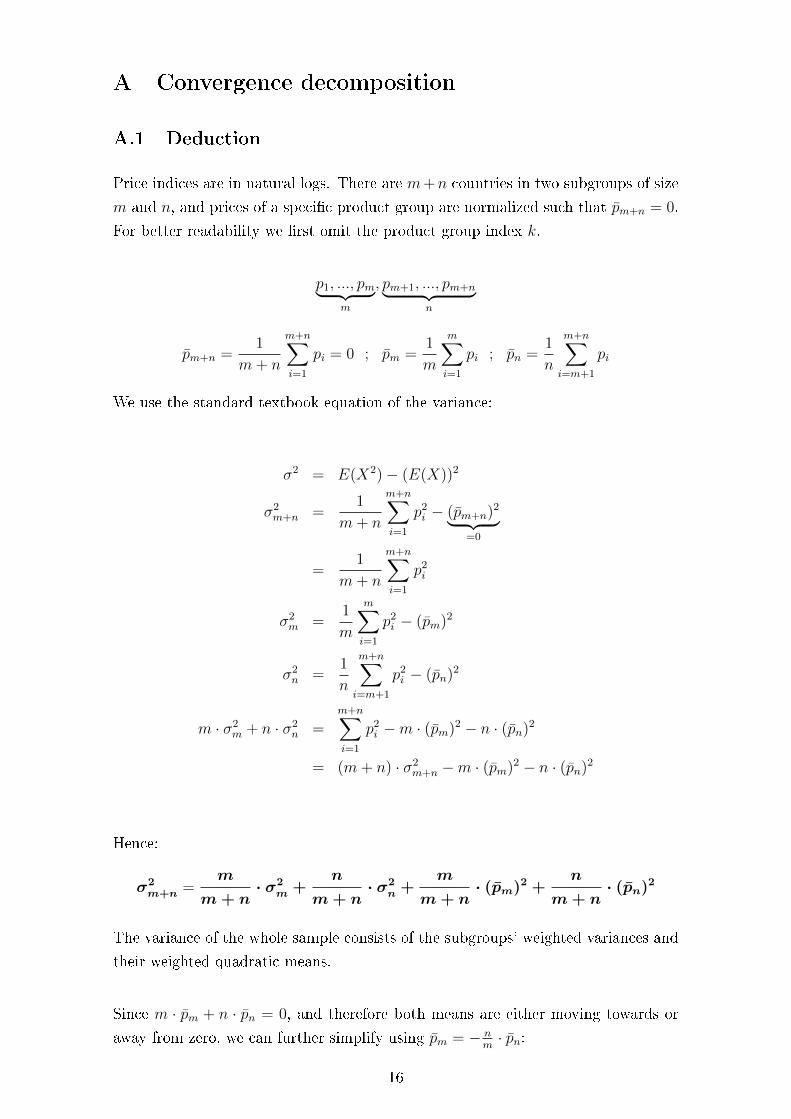
A Convergence decomposition
A.1 Deduction
Price indices are in natural logs. There are m+n countries in two subgroups of size
m and n, and prices of a speci�c product group are normalized such that p̄m+n = 0.
For better readability we �rst omit the product group index k.
p1, ..., pm︸ ︷︷ ︸m
, pm+1, ..., pm+n︸ ︷︷ ︸n
p̄m+n =1
m+ n
m+n∑i=1
pi = 0 ; p̄m =1
m
m∑i=1
pi ; p̄n =1
n
m+n∑i=m+1
pi
We use the standard textbook equation of the variance:
σ2 = E(X2)− (E(X))2
σ2m+n =
1
m+ n
m+n∑i=1
p2i − (p̄m+n)2︸ ︷︷ ︸
=0
=1
m+ n
m+n∑i=1
p2i
σ2m =
1
m
m∑i=1
p2i − (p̄m)2
σ2n =
1
n
m+n∑i=m+1
p2i − (p̄n)2
m · σ2m + n · σ2
n =m+n∑i=1
p2i −m · (p̄m)2 − n · (p̄n)2
= (m+ n) · σ2m+n −m · (p̄m)2 − n · (p̄n)2
Hence:
σ2m+n =
m
m+ n· σ2
m +n
m+ n· σ2
n +m
m+ n· (p̄m)2 +
n
m+ n· (p̄n)2
The variance of the whole sample consists of the subgroups' weighted variances and
their weighted quadratic means.
Since m · p̄m + n · p̄n = 0, and therefore both means are either moving towards or
away from zero, we can further simplify using p̄m = − nm· p̄n:
16
m
m+ n· (p̄m)2 +
n
m+ n· (p̄n)2 =
m
m+ n· (− n
m· p̄n)2 +
n
m+ n· (p̄n)2
= (m
m+ n· n
2
m2+
n
m+ n)(p̄n)2
=mn2 +m2n
(m+ n)m2(p̄n)2
=(m+ n)mn
(m+ n)m2(p̄n)2
=n
m(p̄n)2
Thus:
σ2m+n =
m
m+ nσ2m +
n
m+ nσ2n +
n
m(p̄n)2,
or equivalently
σ2m+n =
m
m+ nσ2m +
n
m+ nσ2n +
m
n(p̄m)2.
Expressed in changes and adding the product group index k, we get:
∆σ2k,m+n =
n
m+ n∆σ2
k,m +n
m+ n∆σ2
k,n +n
m∆(p̄k,n)2
Finally, we aggregate over all product groups k:
∆σ2m+n =
1
K
K∑k=1
σ2k,m+n =
m
m+ n∆σ2
m +n
m+ n∆σ2
n +n
m
1
K
K∑k=1
∆(p̄k,n)2
In the EU23 case with K = 34 product groups:
∆σ2k,EU23 =
15
23∆σ2
k,EU15 +8
23∆σ2
k,EU8 +8
15∆(p̄k,EU8)2
∆σ2EU23 =
15
23∆σ2
EU15 +8
23∆σ2
EU8 +8
15
1
34
34∑k=1
∆(p̄k,EU8)2
17
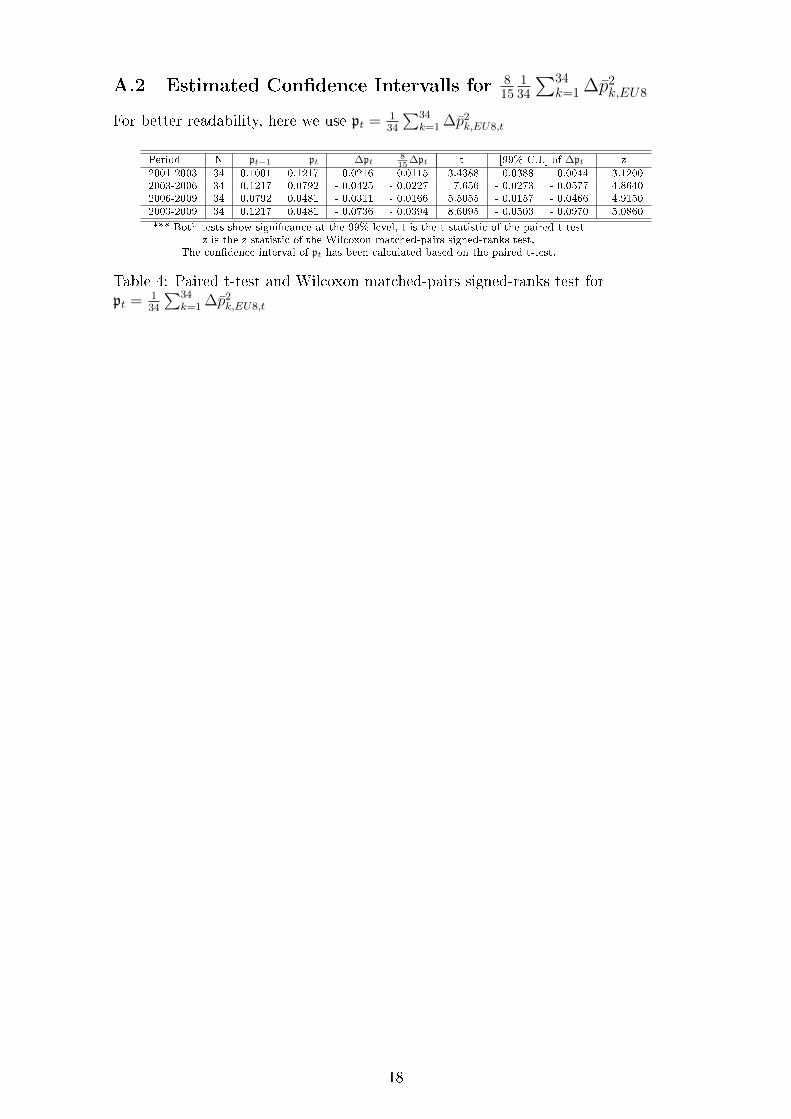
A.2 Estimated Con�dence Intervalls for 815
134
∑34k=1 ∆p̄2
k,EU8
For better readability, here we use pt = 134
∑34k=1 ∆p̄2
k,EU8,t
Period N pt−1 pt ∆pt815
∆pt t [99% C.I.] of ∆pt z
2001-2003 34 0.1001 0.1217 0.0216 0.0115 -3.4388 - 0.0388 - 0.0044 - 3.12002003-2006 34 0.1217 0.0792 - 0.0425 - 0.0227 7.656 - 0.0273 - 0.0577 4.86402006-2009 34 0.0792 0.0481 - 0.0311 - 0.0166 5.5055 - 0.0157 - 0.0466 4.91502003-2009 34 0.1217 0.0481 - 0.0736 - 0.0394 8.6095 - 0.0503 - 0.0970 5.0860
*** Both tests show signi�cance at the 99% level, t is the t statistic of the paired t-testz is the z statistic of the Wilcoxon matched-pairs signed-ranks test.
The con�dence interval of pt has been calculated based on the paired t-test.
Table 4: Paired t-test and Wilcoxon matched-pairs signed-ranks test forpt = 1
34
∑34k=1 ∆p̄2
k,EU8,t
18
B Individual product / product group convergence
Figure 4: σ-convergence (∆σ2) by products, 2003 - 2009. The �rst bar depicts thepooled convergence result. Light grey bars are not statistically signi�cant.
19
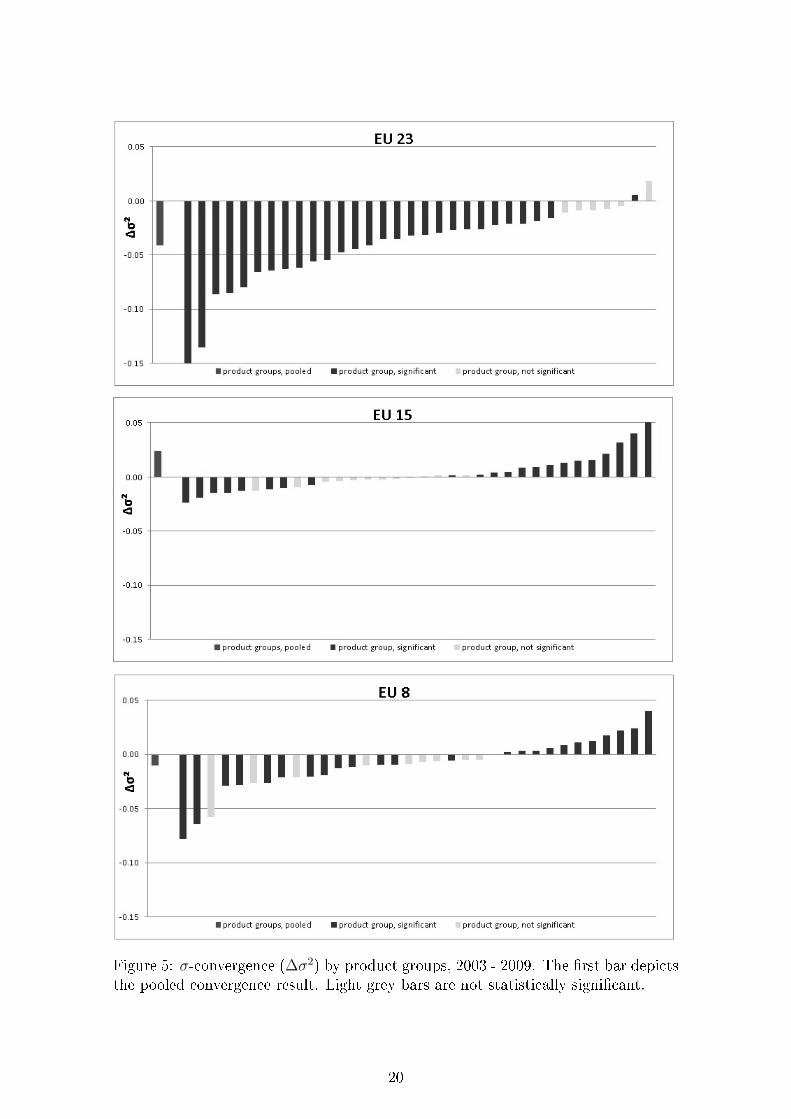
Figure 5: σ-convergence (∆σ2) by product groups, 2003 - 2009. The �rst bar depictsthe pooled convergence result. Light grey bars are not statistically signi�cant.
20
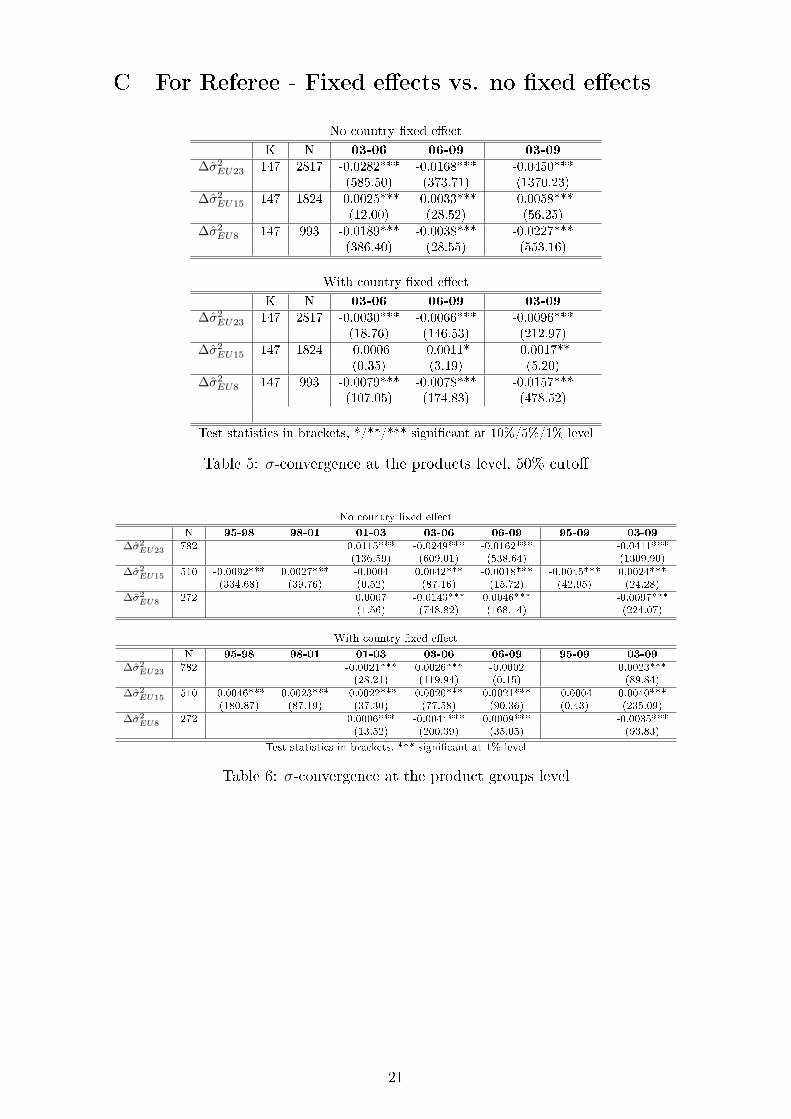
C For Referee - Fixed e�ects vs. no �xed e�ects
No country �xed e�ect
K N 03-06 06-09 03-09
∆σ̂2EU23 147 2817 -0.0282*** -0.0168*** -0.0450***
(585.50) (373.71) (1370.23)∆σ̂2
EU15 147 1824 -0.0025*** -0.0033*** -0.0058***(12.00) (28.52) (56.25)
∆σ̂2EU8 147 993 -0.0189*** -0.0038*** -0.0227***
(386.40) (28.55) (553.16)
With country �xed e�ect
K N 03-06 06-09 03-09
∆σ̂2EU23 147 2817 -0.0030*** -0.0066*** -0.0096***
(18.76) (146.53) (212.97)∆σ̂2
EU15 147 1824 -0.0006 -0.0011* -0.0017**(0.35) (3.19) (5.20)
∆σ̂2EU8 147 993 -0.0079*** -0.0078*** -0.0157***
(107.05) (174.83) (478.52)
Test statistics in brackets, */**/*** signi�cant at 10%/5%/1% level
Table 5: σ-convergence at the products level, 50% cuto�
No country �xed e�ect
N 95-98 98-01 01-03 03-06 06-09 95-09 03-09
∆σ̂2EU23 782 0.0115*** -0.0249*** -0.0162*** -0.0411***
(136.59) (609.01) (538.64) (1309.90)∆σ̂2
EU15 510 -0.0092*** 0.0027*** -0.0004 0.0042*** -0.0018*** -0.0045*** 0.0024***(334.68) (39.76) (0.52) (87.16) (15.72) (42.95) (24.28)
∆σ̂2EU8 272 0.0007 -0.0143*** 0.0046*** -0.0097***
(1.56) (748.82) (168.14) (224.07)
With country �xed e�ect
N 95-98 98-01 01-03 03-06 06-09 95-09 03-09
∆σ̂2EU23 782 -0.0021*** 0.0026*** -0.0002 0.0023***
(28.21) (119.94) (0.15) (89.84)∆σ̂2
EU15 510 -0.0046*** 0.0023*** -0.0022*** 0.0020*** 0.0021*** -0.0004 0.0040***(180.87) (87.19) (37.30) (77.58) (90.36) (0.43) (235.09)
∆σ̂2EU8 272 0.0006*** -0.0044*** 0.0009*** -0.0035***
(13.52) (200.39) (35.05) (93.83)
Test statistics in brackets, *** signi�cant at 1% level
Table 6: σ-convergence at the product groups level
21
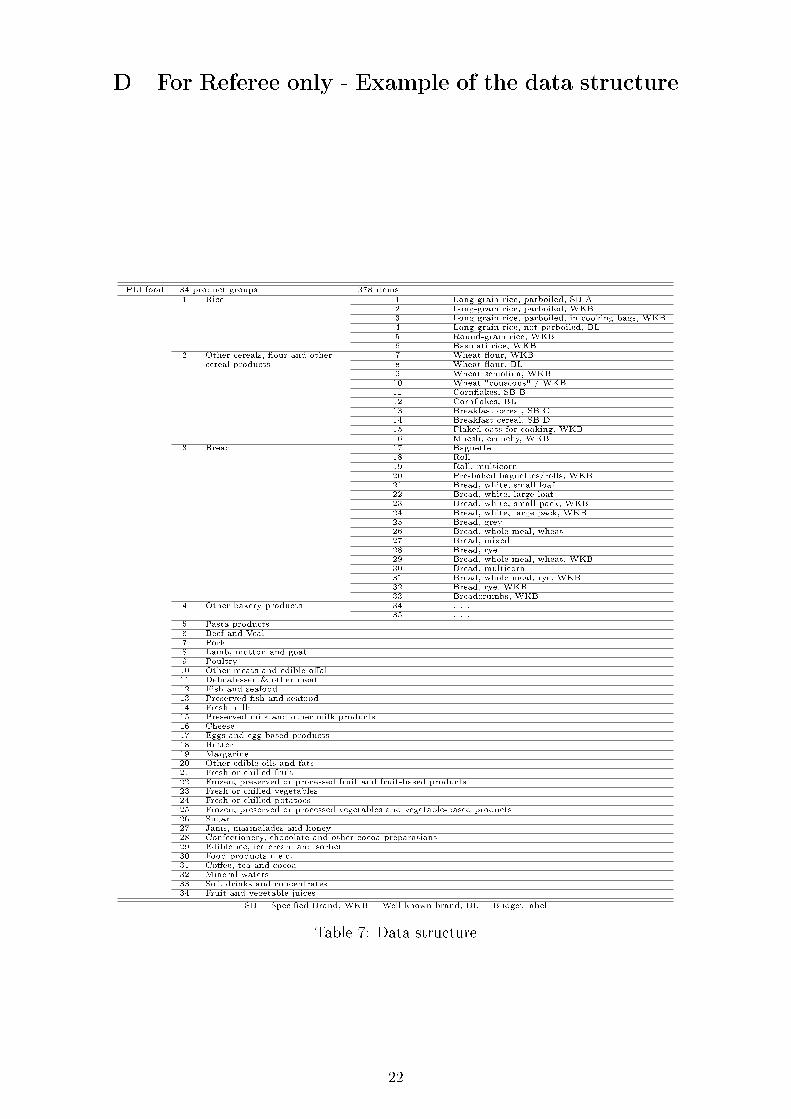
D For Referee only - Example of the data structure
PLI food 34 product groups 378 items
1 Rice 1 Long-grain rice, parboiled, SB A2 Long-grain rice, parboiled, WKB3 Long-grain rice, parboiled, in cooking bags, WKB4 Long-grain rice, not parboiled, BL5 Round-grain rice, WKB6 Basmati rice, WKB
2 Other cereals, �our and other 7 Wheat �our, WKBcereal products 8 Wheat �our, BL
9 Wheat semolina, WKB10 Wheat "couscous" / WKB11 Corn�akes, SB B12 Corn�akes, BL13 Breakfast cereal, SB C14 Breakfast cereal, SB D15 Flaked oats for cooking, WKB16 Muesli, crunchy, WKB
3 Bread 17 Baguette18 Roll19 Roll, multicorn20 Pre-baked baguettes/rolls, WKB21 Bread, white, small loaf22 Bread, white, large loaf23 Bread, white, small pack, WKB24 Bread, white, large pack, WKB25 Bread, grey26 Bread, whole meal, wheat27 Bread, mixed28 Bread, rye29 Bread, whole meal, wheat, WKB30 Bread, multicorn31 Bread, whole meal, rye, WKB32 Bread, rye, WKB33 Breadcrumbs, WKB
4 Other bakery products 34 . . .35 . . .
5 Pasta products6 Beef and Veal7 Pork8 Lamb, mutton and goat9 Poultry10 Other meats and edible o�al11 Delicatessen & other meat12 Fish and seafood13 Preserved �sh and seafood14 Fresh milk15 Preserved milk and other milk products16 Cheese17 Eggs and egg-based products18 Butter19 Margarine20 Other edible oils and fats21 Fresh or chilled fruit22 Frozen, preserved or processed fruit and fruit-based products23 Fresh or chilled vegetables24 Fresh or chilled potatoes25 Frozen, preserved or processed vegetables and vegetable-based products26 Sugar27 Jams, marmalades and honey28 Confectionery, chocolate and other cocoa preparations29 Edible ice, ice cream and sorbet30 Food products n.e.c.31 Co�ee, tea and cocoa32 Mineral waters33 Soft drinks and concentrates34 Fruit and vegetable juices
SB = Speci�ed Brand, WKB = Well known brand, BL = Budget label
Table 7: Data structure
22