Picosecond Investigation of the Collisional Deactivation of OH A ^2Σ^+(v′ = 1, N? = 4, 12) in an...
14
Picosecond investigation of the collisional deactivation of OH A 2 S 1 ~v* 5 1, N* 5 4, 12! in an atmospheric-pressure flame Paul Beaud, Peter P. Radi, Dieter Franzke, Hans-Martin Frey, Bernhard Mischler, Alexios-Paul Tzannis, and Thomas Gerber The collisional deactivation of the laser excited states A 2 S 1 ~v95 1, N95 4, 12! of OH in a flame is studied by measurement of spectrally resolved fluorescence decays in the picosecond time domain. Quenching and depolarization rates, as well as vibrational energy-transfer ~VET! and rotational energy-transfer ~RET! rates are determined. An empirical model describes the temporal evolution of the quenching and VET rates that emerge from the rotational-state relaxation. Fitting this model to the measured 1– 0 and 0 – 0 fluorescence decays yields the quenching and VET rates of the initially excited rotational state along with those that correspond to a rotationally equilibrated vibronic-state population. VET from the higher rotational state ~N95 12! shows a tendency for resonant transitions to energetic close-lying levels. RET is investigated by analysis of the temporal evolution of the 1–1 emission band. The observed RET is well described by the energy-corrected sudden-approximation theory in conjunction with a power-gap law. © 1998 Optical Society of America OCIS codes: 300.6500, 280.1740, 300.2530, 260.2160, 020.2070, 320.7150. 1. Introduction Many publications have focused on the various aspects of collisional deactivation of the OH A 2 S 1 electronic state. Besides the fundamental interest in under- standing the dynamics of molecular collisions, this large amount of attention is due to the significance of the OH radical in atmospheric and combustion chem- istry. The spectroscopic properties of OH are well known, 1,2 and the molecule is extensively used as a tracer for laser diagnostic techniques. Laser-based methods such as single-point laser-induced fluores- cence ~LIF! as well as planar laser-induced fluores- cence and four-wave mixing are well-established diagnostic tools. 3,4 Obtaining quantitative results, however, requires a detailed knowledge of the colli- sional deactivation of the excited electronic state. 4–6 Quenching, vibrational energy-transfer ~VET!, and ro- tational energy-transfer ~RET! cross sections of OH with important collision partners ~such as H 2 O, N 2 , CO 2 , CO, O 2 ,H 2 , and H! have been measured by var- ious techniques and for temperatures ranging from 300 to 2300 K. The deactivation of the electronically excited OH radical has also been studied in flames. Recently a detailed rate-equation model ~called the LASKIN code! was developed that permits the exam- ination of LIF experiments in the OH A 2 S 1 3 X 2 P~0, 0! band. 7 For a detailed discussion of collisional re- laxation of OH see Refs. 4 – 6 and references therein. Despite the large number of experimental rates pub- lished in the literature, the final aim of these studies, namely, the accurate prediction of the temporal evolu- tion of the state population on excitation, has yet to be accomplished. Unfortunately, competing processes such as quenching, VET, and RET act on a similar time scale and are therefore difficult to separate. 5 Most of the rates have been measured in low-pressure flames, for which nanosecond pulses are adequate. Time- resolved experiments in atmospheric-pressure flames, however, require picosecond resolution. In recent years several experiments have been per- formed on this time scale to determine the quenching rate of the OH A 2 S 1 ~v95 0! and ~v95 1! states in atmospheric-pressure flames. 8 –12 Here we obtain detailed information on intervibrational and intravi- brational relaxation on the picosecond time scale. The authors are with General Energy Research, Paul Scherrer Institute, CH-5232 Villigen, Switzerland. Received 1 October 1997; revised manuscript received 2 Febru- ary 1998. 0003-6935y98y153354-14$15.00y0 © 1998 Optical Society of America 3354 APPLIED OPTICS y Vol. 37, No. 15 y 20 May 1998
Transcript of Picosecond Investigation of the Collisional Deactivation of OH A ^2Σ^+(v′ = 1, N? = 4, 12) in an...

Picosecond investigation of the collisionaldeactivation of OH A 2S1~v* 5 1, N* 5 4, 12! in anatmospheric-pressure flame
Paul Beaud, Peter P. Radi, Dieter Franzke, Hans-Martin Frey, Bernhard Mischler,Alexios-Paul Tzannis, and Thomas Gerber
The collisional deactivation of the laser excited states A 2S1~v9 5 1, N9 5 4, 12! of OH in a flame is studiedby measurement of spectrally resolved fluorescence decays in the picosecond time domain. Quenchingand depolarization rates, as well as vibrational energy-transfer ~VET! and rotational energy-transfer~RET! rates are determined. An empirical model describes the temporal evolution of the quenching andVET rates that emerge from the rotational-state relaxation. Fitting this model to the measured 1–0 and0–0 fluorescence decays yields the quenching and VET rates of the initially excited rotational state alongwith those that correspond to a rotationally equilibrated vibronic-state population. VET from the higherrotational state ~N9 5 12! shows a tendency for resonant transitions to energetic close-lying levels. RETis investigated by analysis of the temporal evolution of the 1–1 emission band. The observed RET is welldescribed by the energy-corrected sudden-approximation theory in conjunction with a power-gap law.© 1998 Optical Society of America
OCIS codes: 300.6500, 280.1740, 300.2530, 260.2160, 020.2070, 320.7150.
1. Introduction
Many publications have focused on the various aspectsof collisional deactivation of the OH A 2S1 electronicstate. Besides the fundamental interest in under-standing the dynamics of molecular collisions, thislarge amount of attention is due to the significance ofthe OH radical in atmospheric and combustion chem-istry. The spectroscopic properties of OH are wellknown,1,2 and the molecule is extensively used as atracer for laser diagnostic techniques. Laser-basedmethods such as single-point laser-induced fluores-cence ~LIF! as well as planar laser-induced fluores-cence and four-wave mixing are well-establisheddiagnostic tools.3,4 Obtaining quantitative results,however, requires a detailed knowledge of the colli-sional deactivation of the excited electronic state.4–6
Quenching, vibrational energy-transfer ~VET!, and ro-tational energy-transfer ~RET! cross sections of OHwith important collision partners ~such as H2O, N2,
The authors are with General Energy Research, Paul ScherrerInstitute, CH-5232 Villigen, Switzerland.
Received 1 October 1997; revised manuscript received 2 Febru-ary 1998.
0003-6935y98y153354-14$15.00y0© 1998 Optical Society of America
3354 APPLIED OPTICS y Vol. 37, No. 15 y 20 May 1998
CO2, CO, O2, H2, and H! have been measured by var-ious techniques and for temperatures ranging from300 to 2300 K. The deactivation of the electronicallyexcited OH radical has also been studied in flames.Recently a detailed rate-equation model ~called theLASKIN code! was developed that permits the exam-ination of LIF experiments in the OH A 2S13X 2P ~0,0! band.7 For a detailed discussion of collisional re-laxation of OH see Refs. 4–6 and references therein.Despite the large number of experimental rates pub-lished in the literature, the final aim of these studies,namely, the accurate prediction of the temporal evolu-tion of the state population on excitation, has yet to beaccomplished.
Unfortunately, competing processes such asquenching, VET, and RET act on a similar time scaleand are therefore difficult to separate.5 Most of therates have been measured in low-pressure flames, forwhich nanosecond pulses are adequate. Time-resolved experiments in atmospheric-pressureflames, however, require picosecond resolution. Inrecent years several experiments have been per-formed on this time scale to determine the quenchingrate of the OH A 2S1~v9 5 0! and ~v9 5 1! states inatmospheric-pressure flames.8–12 Here we obtaindetailed information on intervibrational and intravi-brational relaxation on the picosecond time scale.

Measurements of temporally and spectrally resolvedfluorescence of the OH A 2S1~v9 5 0, 1!3 X 2P~v0 51, 0! bands on picosecond excitation of the OHA 2S1~v9 5 1, N9 5 4, 12! states are presented.These measurements permit a comprehensive inves-tigation of the collisional deactivation of the excitedmolecule, e.g., the study of LIF depolarization,quenching, VET, and RET. At early times after ex-citation, significant polarization of the OH emissionis observed that disappears subsequently as the re-sult of collisions. Estimates of the LIF depolariza-tion rates are given. An empirical model is proposedthat yields rotational state-specific quenching andVET rates although the concurrent RET process maynot be known. We achieve this result by introducingtime-dependent quenching and VET rates. Thetime dependency emerges from the thermalizationprocess of the rotational-state population followingexcitation of a single state. Fitting the model to themeasured fluorescence decays yields the quenchingand VET rates of the initially excited rotationalstates ~F14 and F112! as well as those that correspondto a rotationally equilibrated vibronic-state popu-lation. As proposed in a recent publication,13 wedescribe the observed RET by using the energy-corrected sudden approximation in combination witha power-gap law. This RET model requires threeparameters only: a single rate constant, the expo-nent of the power-gap law, and the effective interac-tion length of the collision process introduced by theadiabatic energy correction.
2. Experiment
Figure 1 shows the experimental configuration of thelaser and detection system. The laser is an ultra-short Ti:sapphire laser system that makes use of thechirped-pulse amplification technique ~CPA 1000;Clark MXR, Dexter, Mich.!. In this experiment thespectral bandwidth of the near-IR pulses is intention-ally limited to ;10 cm21, which results in a pulseduration of 1.5 ps. The maximum pulse energy is0.5 mJ at a repetition rate of 800 Hz. The laseroutput is frequency tripled with an efficiency of;10%. The spectral bandwidth of the third-harmonic pulse increases to 18 cm21, and its durationis expected to be approximately 1 ps. The spatialquality of the UV beam is significantly affected by twob-barium borate crystals used to generate the third-harmonic frequency. By comparing the measured
Fig. 1. Experimental setup: THG, third-harmonic generation;Ti:S, Ti:sapphire; KLM, Kerr-lens mode locked.
divergence of the third harmonic with the divergenceof a diffraction-limited beam we obtain an M2 value of8 6 1.5.14 In the experiment, UV pulses of typically20-mJ energy are focused with a 1-m lens into theflame under investigation. Following the propaga-tion rules for multimode laser beams,14 we estimate awaist diameter inside the flame of 630 6 50 mm,yielding a spectral intensity of 360 6 60 MWycm2
cm21.The wavelength of the third-harmonic pulse is
tuned from 282 to 286 nm to excite selected transi-tions within the OH A 2S1~v9 5 1! 4 X 2P~v0 5 0!band. The bandwidth of 18 cm21 rules out the se-lection of a single rotational transition within thedense absorption spectrum of OH. Two absorptionlines, Q14 and Q112, were chosen; they are suffi-ciently isolated that we can attribute the resultingfluorescence predominantly to the N9 5 4 and N9 5 12rotational states. The induced transitions and therotational-state distribution on laser excitation as in-ferred from the measured pulse spectrum and by as-suming a temperature of 1760 K ~see Section 4 below!are listed in Table 1. We label the transitions byusing the nomenclature of Ref. 1. Line positions androtational energies, whenever used in this paper, aretaken from Ref. 1, and the relative transition proba-bilities are taken from Ref. 2.
The UV pulses are focused with a 1-m lens into theburned gas region of a premixed laminar methane–air flame. The stoichiometric atmospheric pressureflame is stabilized on a 60-mm diameter water-cooledflat-flame burner ~McKenna Products, Pittsburgh,Pa.!. The total flow rate is 13.2 Lymin. The probevolume, 3 mm above the burner surface, is located 1cm from the edge of the flame to minimize pumpdepletion and reabsorption. However, at the rela-tively large spectral intensities focused in the flamewe must consider saturation effects. We can esti-mate the level of saturation by solving numericallythe coupled differential equations of the ground andexcited states during the excitation process. On atime scale of 1 ps, quenching and energy-transferprocesses are negligible; only absorption and stimu-lated emission have to be taken into account. Be-cause the satellite transition has the same groundstate, it is also included in the calculation. At aspectral intensity of 360 MWycm2 cm21 the popula-
Table 1. Transitions Overlapping the Bandwidth of the Laser Pulse, theCorresponding Excited States, and Their Contributions p to the Overall
Vibronic Excitation for Q14 and Q112 Excitation
N9 5 4Transition State p ~%!
N9 5 12Transition State p ~%!
Q14 F14 76.2 Q112 F112 76.9Q214 F24 11.2 P27 F26 7.5R21 F22 6.2 Q211 F211 5.1P12 F11 3.6 P17, P127 F16 3.8R213 F214 1.6 Q212, Q2112 F212 2.8R114 F113 0.5 R219 F220 2.2R212 F213 0.5 P18 F17 1.2
20 May 1998 y Vol. 37, No. 15 y APPLIED OPTICS 3355

tions of the states that are dominantly excited ~F14and F112! are reduced by approximately 12% com-pared with those in the nonsaturated absorption re-gime. At this level of saturation the rotational-statedistribution changes insignificantly compared withthe case when saturation effects are neglected. Therelative populations of the F14 and F112 states inTable 1 decrease by only ;2%.
The laser-induced OH fluorescence is imaged withF 5 5 optics through a 0.6-m monochromator onto theentrance slit of a streak camera ~Hamamatsu C2830!.The phosphor screen of the streak camera is imagedonto a slow-scan CCD. For a single shot the streakcamera has a temporal resolution of 8 ps. In thisexperiment, however, the weak fluorescence signalsare accumulated over a period of 15 min, and weselect a slower streak speed to record a time windowof 7 ns. Trigger jitter and, more importantly, theslower streak speed limit the temporal resolution to100 ps. This value is measured when the Rayleighsignal is observed in absence of the flame. The spec-tral range covered for each measurement is 8.5 nm,with a spectral resolution of 0.8 Å ~1 Å 5 0.1 nm!.The resulting two-dimensional images contain thespectral information on one axis and the temporalevolution of the OH emission on the other axis.These images are divided by a reference image tocorrect for nonuniformity of the detection system.We record the reference image by exposing the detec-tion system to a calibrated deuterium lamp. Thesame light source is used to calibrate the spectralresponse of the detection system for the wavelengthregion from 280 to 330 nm. The images are cor-rected for spatial image distortion that is due to thestreak tube and for the nonlinearity of the streaksweep, which we measured carefully by using twolaser pulses separated by a fixed time delay.
3. Laser-Induced Fluorescence Polarization andDepolarization Rates
The fluorescence emitted by the laser-excited OHmolecules is polarized and nonisotropic at early timesafter excitation.15 Subsequently the LIF polariza-tion is randomized by collisions. Neglecting the de-polarization process of the measured LIF signalssignificantly affects the rates determined from thetime evolution of the LIF signals.16 In the coordi-nate system shown in Fig. 1 the laser beam propa-gates parallel to the x axis and the detector collectsfluorescence emitted along the y axis. Consider firsta laser polarization along the z axis. The measuredfluorescence ~In! can then be separated into its com-ponents polarized perpendicular ~I'! and parallel ~I\!to the polarization of the incident laser beam: Iv 5I' 1 I\. For the laser polarization set parallel to ythe detected fluorescence ~Ih! is polarized perpendic-ular to the laser polarization, e.g., Ih 5 2I'. Thedegree of polarization P of the fluorescence is thendefined by15
P 5I\ 2 I'
I\ 1 I'
;Iv 2 Ih
Iv. (1)
3356 APPLIED OPTICS y Vol. 37, No. 15 y 20 May 1998
In Section 5 below we use the following relation toobtain unpolarized fluorescence spectra correspond-ing to the fully isotropic situation16:
Iiso , I\ 1 2I' ; Iv 1 ~Ihy2!. (2)
The indices h and v denote the polarization of theincoming laser pulse horizontally or vertically, re-spectively, to the optical table ~see Fig. 1!.
We have chosen the 1–1 emission band to study thefluorescence anisotropy. The detection system ~in-cluding the grating of the spectrometer! is measuredto be polarization independent in the wavelength re-gion from 310 to 325 nm within 63%. In the exper-iment the fluorescence is collected with a half-coneangle u of 6 deg, which might affect the measuredfluorescence polarization. However, considering theworst case, in which a ray propagates at the outeredge of this cone, the maximum error is sin2 u andthus of the order of 1%. The UV laser beam is lin-early polarized with a ratio of better than 50:1. Fig-ures 2~a! and 2~b! show the time evolution of themeasured LIF spectra following excitation of the F14and the F112 rotational states, respectively. Thesolid curves represent data obtained with verticallaser polarization and the dashed curves show dataobtained with horizontal laser polarization. We nor-malize the spectra by taking into account the tempo-rally and spectrally integrated 0–0 emission band.The v9 5 0 state is populated by VET, which depo-larizes the OH molecules.16 Only transitions that
Fig. 2. Measured temporal evolution of the 1–1 LIF emissionspectrum for vertical ~solid curves! and horizontal ~dashed curves!laser polarization for ~a! N9 5 4 and ~b! N9 5 12 excitation.

originate from the dominantly excited rotationalstates are labeled in Fig. 2. Additional lines recog-nizable at t 5 0 are either weakly excited transitionswithin the laser bandwidth or close-lying states pop-ulated by RET within the temporal resolution. Fig-ure 2 demonstrates the significant initial anisotropyof the OH fluorescence. With progressing time theLIF anisotropy diminishes. As predicted by theo-ry,16 the Q lines are polarized perpendicularly to theR and P transitions. In addition, the polarization ofsatellites is orthogonal to the corresponding spin-conserving transition. Depolarization is signifi-cantly faster for the lower rotational state ~N9 5 4!,and the polarization anisotropy is only partially re-moved by RET. Obviously, the depolarization is sig-nificantly slower than RET.
From the temporal evolution of the spectra shownin Fig. 2, the rates for inelastic depolarizing collisionscan be determined. The temporal evolution of polar-ization P is shown in Fig. 3 for the Q1 and P1 lines ofthe laser-excited state and for the spectrally inte-grated 1–1 band emission. All curves decay towardzero with increasing time, proving the correct nor-malization of the data obtained for both laser polar-izations, which justifies the above assumption thatthe polarization of OH molecules undergoing VET issimultaneously randomized and confirms previousobservations for which nanosecond pulses wereused.16 Depolarizing rates obtained by fitting expo-
Fig. 3. LIF polarization versus time of the Q and P lines emittedfrom the laser-excited rotational state and of the spectrally inte-grated 1–1 emission band following ~a! Q14 and ~b! Q112 excitation.The thin solid curves show the exponential fit to the data.
nential decays are summarized in Table 2. The sta-tistical error of the measured rates is large because weobtained the depolarization measurements shown inFig. 3 by dividing two signals, which both decreaserapidly in time. Also included in Table 2 are the linepolarizations at t 5 0 that result from the fit. A com-parison with the collision-free case16 yields good agree-ment for the P and Q lines. The initial polarization ofthe spectrally integrated band emission is smallerthan calculated for several reasons: First, in additionto the Q1 excitation, several P, R, and Q12 transitionsoverlap the laser pulse and lead to a different LIFpolarization. Second, the satellite lines ~not includedin Ref. 16! are orthogonally polarized to the spin-maintaining transitions. Third, collisions within thetime resolution of our experiment induce RET, whichsimultaneously tends to depolarize the molecules.
4. Quenching and Vibrational Energy Transfer
A. Model Equations
In the limit of complete rotational thermalization andneglecting transfer to higher vibrational levels, thetemporal evolution of the populations, n1 and n0, oflevels v9 5 1 and v9 5 0 of the excited electronic stateare described by17
dn1
dt5 2~Q1 1 A1 1 v10!n1 1 v01n0 1 Ed~t!, (3a)
dn0
dt5 2~Q0 1 A0 1 v01!n0 1 v10n1, (3b)
where ni and Qi denote the population and thequenching, respectively, for the v9 5 i vibrationallevel and v01 and v10 are the upward and downwardVET rate coefficients, respectively. The spontaneous-emission rates Ai can be neglected because they are ofthe order of 106 s21.18 These values are much smallerthan typical quenching rates of approximately 5 3 108
s21 in atmospheric-pressure flames.8–10 The termEd~t! describes the excitation by the pump pulse, whichis infinitely short compared with the experimental res-olution.
The assumption of a thermalized rotational-statedistribution within the excited v9 5 1 vibrationallevel does not apply to our experiment. Initially, one
Table 2. Depolarization Ratesa
ExcitedState
DetectedTransition
kdep
~108 s21!
P~t 5 0!
Experiment Theoryb
F14 Q14 20 6 3 0.47 6 0.02 0.49P15 38 6 14 20.26 6 0.05 20.241–1 band 39 6 15 0.06 6 0.02 0.15
F112 Q112 8 6 2 0.48 6 0.02 0.50P113 9 6 5 20.28 6 0.04 20.291–1 band 17 6 8 0.05 6 0.03 0.14
aThe experimentally determined LIF polarization P at time zerois compared with that calculated for the collision-free case.
bRef. 16.
20 May 1998 y Vol. 37, No. 15 y APPLIED OPTICS 3357
single rotational state is preferably excited. RET, asubstantially faster process than quenching andVET, redistributes the rotational-state populationwithin the excited vibronic state, which eventuallyequilibrates. As quenching and VET are rotational-state dependent,19–26 the observed overall quenchingand VET of the excited vibronic state will change intime. At early times after excitation, the observeddecay of the excited v9 5 1 level and the populationincrease of the v9 5 0 state will be given by thestate-specific quenching and VET rates of the excitedrotational state.
One can determine these state-specific rates by fit-ting a time-dependent rate model to the experimentaldata. Its boundary conditions are as follows: ~i! Attime zero, only the initially excited rotational state ispopulated and ~ii! at infinitely long times therotational-state population within the v9 5 1 vibra-tional level is equilibrated because of RET.22,26,27
The quenching and VET rates at time zero are therates for the laser-excited rotational state N9 and arereferred to as Q1~t 5 0! 5 Q1
N9 and v10~t 5 0! 5 v10N9.
The rates after an infinitely long time interval willcorrespond to those of an equilibrated ensemble andare denoted Q1~t3 `! 5 Q1
th and v10~t3 `! 5 v10th.
Even though the final rotational-state distributionmight be different from a thermal population,5 forsimplicity we refer to the rates of a rotationally re-laxed state distribution as thermal rates. The tran-sition between the boundaries is modeled by anexponential function
Q1~t! 5 Q1th 1 ~Q1
N9 2 Q1th!exp~2kQ t!, (4a)
v10~t! 5 v10th 1 ~v10
N9 2 v10th!exp~2kv t! (4b)
and describes the thermalization of the rotational-state population at the rates kQ and kv, respectively.The choice of an exponential is purely empirical.The boundary conditions discussed above can be ra-tionalized by experimental evidence. Figure 4shows, on a logarithmic scale, the temporal decay ofthe 1–0 emission for the N9 5 4 ~solid curve! and theN9 5 12 ~dashed curve! excitation. The slopes of the
Fig. 4. A 2S1 2 X 2P ~1, 0! band emission on a logarithmic scaleversus time following Q14 ~solid curve! and Q112 ~dashed curve!excitation. With progressing time the two curves converge to acommon slope, which is indicated by the straight line.
3358 APPLIED OPTICS y Vol. 37, No. 15 y 20 May 1998
two curves converge after a few nanoseconds to avalue of approximately 109 s21.
We assume an equilibrated rotational distributionwithin the v9 5 0 vibrational level that is populatedthrough VET from the laser excited v9 5 1 vibronicstate. Hence Q0 and v01 are time independent, ex-hibiting the rates of a rotationally equilibrated state.The following relation for the upward and downwardVET rates then applies17:
v10th
v015
fB~v9 5 0!
fB~v9 5 1!, (5)
which is purely a function of temperature. fB is theBoltzmann population fraction. As we show below,the assumption of rotationally equilibrated moleculesin v9 5 0 after VET from v9 5 1 proves correct forexcitation to N9 5 4 and less correct for N9 5 12.
B. Determination of v9 5 1 and v9 5 0 State Populations
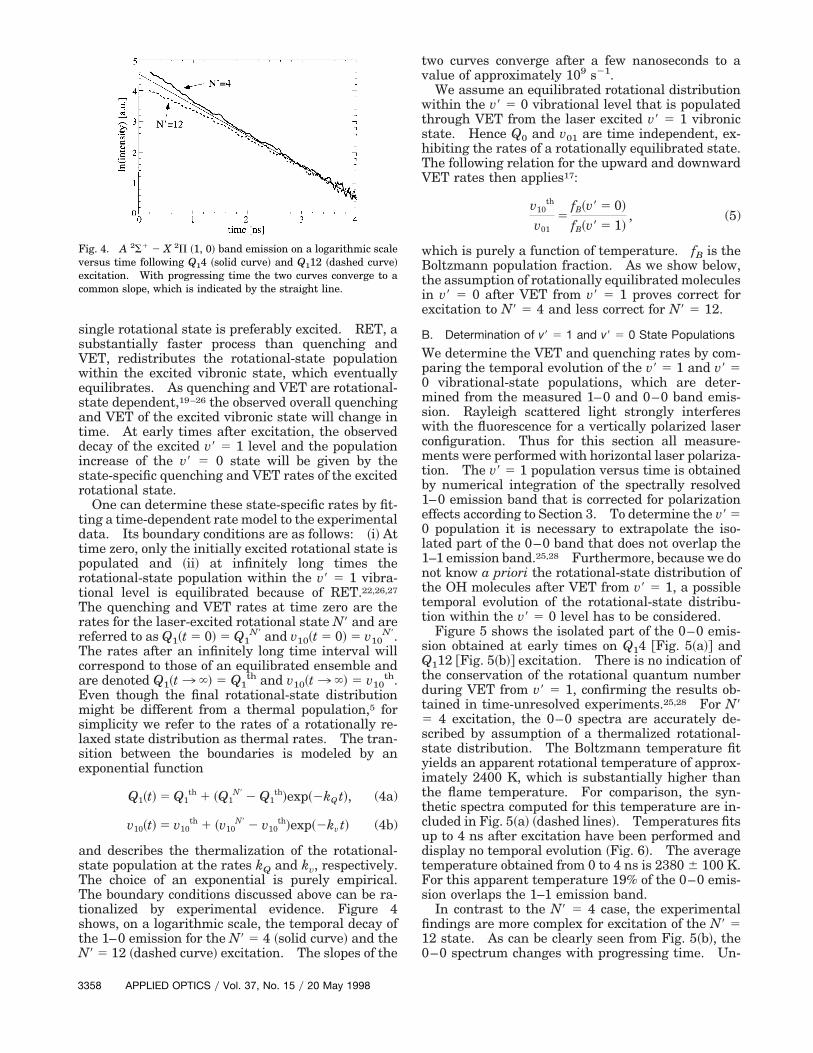
We determine the VET and quenching rates by com-paring the temporal evolution of the v9 5 1 and v9 50 vibrational-state populations, which are deter-mined from the measured 1–0 and 0–0 band emis-sion. Rayleigh scattered light strongly interfereswith the fluorescence for a vertically polarized laserconfiguration. Thus for this section all measure-ments were performed with horizontal laser polariza-tion. The v9 5 1 population versus time is obtainedby numerical integration of the spectrally resolved1–0 emission band that is corrected for polarizationeffects according to Section 3. To determine the v9 50 population it is necessary to extrapolate the iso-lated part of the 0–0 band that does not overlap the1–1 emission band.25,28 Furthermore, because we donot know a priori the rotational-state distribution ofthe OH molecules after VET from v9 5 1, a possibletemporal evolution of the rotational-state distribu-tion within the v9 5 0 level has to be considered.
Figure 5 shows the isolated part of the 0–0 emis-sion obtained at early times on Q14 @Fig. 5~a!# andQ112 @Fig. 5~b!# excitation. There is no indication ofthe conservation of the rotational quantum numberduring VET from v9 5 1, confirming the results ob-tained in time-unresolved experiments.25,28 For N95 4 excitation, the 0–0 spectra are accurately de-scribed by assumption of a thermalized rotational-state distribution. The Boltzmann temperature fityields an apparent rotational temperature of approx-imately 2400 K, which is substantially higher thanthe flame temperature. For comparison, the syn-thetic spectra computed for this temperature are in-cluded in Fig. 5~a! ~dashed lines!. Temperatures fitsup to 4 ns after excitation have been performed anddisplay no temporal evolution ~Fig. 6!. The averagetemperature obtained from 0 to 4 ns is 2380 6 100 K.For this apparent temperature 19% of the 0–0 emis-sion overlaps the 1–1 emission band.
In contrast to the N9 5 4 case, the experimentalfindings are more complex for excitation of the N9 512 state. As can be clearly seen from Fig. 5~b!, the0–0 spectrum changes with progressing time. Un-

fortunately, the noise is greater because of less effi-cient pumping and substantially weaker VET thanfor the N9 5 4 measurement. Nevertheless, at earlytimes considerable transfer to high rotational statesbetween N9 5 16 and N9 5 20 is observed. Theposition of the corresponding R-branch transitions isindicated in Fig. 5~b!. The substantial population ofthese states yields a higher Boltzmann temperature.As shown in Fig. 6, the fitted temperatures decreasewith time from initially 4900 K to approximately2400 K, the temperature found for the Q14 excitation.The large error bars on the fitted temperatures are
Fig. 5. Temporal evolution of the isolated part of the 0–0 emis-sion band ~solid curves! and the corresponding temperature fits~dashed curves! following ~a! Q14 and ~b! Q112 excitation. Eachspectrum is averaged over 500 ps.
Fig. 6. Apparent rotational temperature of the v9 5 0 vibrationallevel versus time obtained from single temperature fits.
partly due to the large amount of noise. But, moreimportantly, they arise from the fact that the Boltz-mann fits @dashed curves in Fig. 5~b!# do not describeaccurately the spectra at early times after excitation.Similar distinct VET effects for low- ~N9 5 1, 2, 5, 10!and high- ~N9 5 13, 15! lying rotational states havebeen observed with nanosecond pulse excitation.25,28
We rationalize our experimental observations asfollows: OH molecules prepared in the N9 5 12 statewithin the v9 5 1 band display a significant proba-bility of promotion to a high rotational state within v95 0. The F118 state of v9 5 0 is almost isoenergeticto the N9 5 12 state of v9 5 1. The fact that the N95 16–20 states are significantly populated by VETmight indicate an additional, energy-resonant VET.On the other hand, VET from a low-lying rotationalstate ~N9 5 4! yields a rotationally equilibrated en-semble within v9 5 0, and a resonant transfer to thenearby-lying N9 5 13 state of v9 5 0 is not observed.The arrows on the bottom spectra of Fig. 5~a! markthe positions of the corresponding transitions ~R114,R214, Q113, and Q213!. Obviously, we require addi-tional theoretical effort to describe the VET processcorrectly. A more detailed treatment of VET willmost likely abandon the separation of the VET andRET processes and include a formulation of the rateequations that make use of state-to-state rates for allquantum states in both vibronic levels. As such atheory is not available now, we have no means todescribe the apparently high temperatures of the 0–0band emission following excitation to the N9 5 12state, and we assume a constant ~time-independent!band temperature of 2380 K to evaluate the v9 5 0population. As a consequence, the v9 5 0 populationis underestimated for times earlier than 3 ns. Onthe other hand, the high rotational states in v9 5 0that are partially populated through VET from v9 51, N9 5 12, live considerably longer.9 In our modelderived in Subsection 4.A we assumed that the v9 50 quenching is time independent. As a result of thisassumption the N9 5 12 VET rate might be overes-timated, partially compensating for the error intro-duced above.
The relative signal intensities of the 1–0 and 0–0bands are converted to relative level populations bycomparison of the calculated emission strengths ofthe two bands. For the 0–0 band the rotational tem-perature of 2380 K is used for the calculation. Theemission strength within the 1–0 band is only weaklydependent on the rotational state. The fluorescencedecreases only by 3% when N9 is increased from 4 to12.2 Thus we use for the 1–0 band the effectiveEinstein coefficient for N9 5 7. The evaluated v9 51 and v9 5 0 state populations are shown versus timefor the two excitation lines in Figs. 7~a! and 7~b!,respectively. The pump laser polarization is chosento minimize Rayleigh scattering but is still present inthe 1–0 emission signal. Its fraction is higher forthe Q112 measurement because the fluorescence issubstantially weaker owing to the lower population ofthe corresponding rotational level in the groundstate.
20 May 1998 y Vol. 37, No. 15 y APPLIED OPTICS 3359

C. Results: Quenching and Vibrational Energy Transfer
Equations ~3!–~5! are fitted to the derived time-evolving v9 5 1 and v9 5 0 state populations, yieldingeight coefficients: Q1
N9, Q1th, Q0, v10
N9, v10th, kQ, kv,
and E. The temporal resolution is included in thefitting procedure. Because of the residual Rayleighsignal that is still present at t 5 0 the first 200 ps ofthe v9 5 1 population are not considered in the fit.The fitted populations are superimposed upon theexperimental data in Fig. 7 ~dashed curves!, and theresulting thermal and state specific rates are sum-marized in Table 3. The results of six measure-ments for N9 5 4 and of three for N9 5 12 have beenaveraged. The errors given in the table are the stan-dard deviations. The error that is due to calibrationuncertainties is estimated to be less than 65%.
Our results contain a systematic error because12.6% of the excitation energy for N9 5 4, and 20.3%of that for N9 5 12, is distributed over additionalrotational states. Because we know the initialrotational-state population, we can correct the ratesby assuming a functional dependence of the quench-ing and VET rates on N9. Both exp@2aN9~N9 1 1!#dependence19 and exp~2aN9! dependence7 have beenproposed for quenching. The choice of an exponen-tial function leads for the lowest rotational states tovalues that in our opinion are overestimated. Weuse for quenching and VET rates the exp@2aN9~N9 11!# dependence. For N9 greater than 12 the rates
Fig. 7. Solid curves, temporal evolution of the v9 5 1 and v9 5 0state populations following ~a! Q14 and ~b! Q112 excitation.Dashed curves, nonlinear least-squares fit from the time-dependent rate model.
3360 APPLIED OPTICS y Vol. 37, No. 15 y 20 May 1998
might be underestimated. Unpublished resultsshow that the quenching rates reach a constant levelwith increasing N9 and do not diminish completely.29
Combining the results from Table 3 and the initialrotational-state distribution ~Table 1!, we obtain ~inunits of 108 s21!
Q1~N9! 5 9.6 [email protected]~N9 1 1!#, (6a)
v10~N9! 5 6.0 [email protected]~N9 1 1!#. (6b)
D. Discussion: Quenching and Vibrational EnergyTransfer
As demonstrated in Fig. 7, the time-dependent ratemodel is well capable of reproducing the observedtime evolution of the v9 5 1 and v9 5 0 state popula-tions. For this model the values of thermal ratesQ1
th, Q0, and v10th must be independent from the
initially excited rotational state. Indeed, within theerror the values obtained for excitation to the N9 5 4state agree with those for Q112 excitation ~see Table3!. A further validation of the time-dependent ratemodel is given at the end of Section 5 below becauseit requires the simulation of RET within v9 5 1.
We observe a strong dependence of the quenchingrate of OH A 2S1~v9 5 1! on N9. It decreases by;34% when N9 is increased from 4 to 12. Recently adecrease of the OH quenching cross section with H2Oby 20% was reported when N9 was increased from 4 to11.30 Because H2O is responsible for ;80% of thequenching observed in flames, we would expect thedependence on N9 to be similar for the overall quench-ing. The different findings may be rationalized if weconsider that in Ref. 30 the overall quenching wasmeasured, thereby being averaged over the rotationalredistribution process. In another experiment11 thedecay of the 1–0, 1–1, and 0–0 emission bands to-gether was detected by use of picosecond excitation ofthe OH A 2S1~v9 5 1, N9 5 5! state in atmospheric-pressure flames. The measured fluorescence wasfound to decay exponentially, with an effective life-time of 1.78 ns. Only a slightly longer lifetime, of 2ns, was obtained for excitation to N9 5 15. Thisweak dependence of the effective lifetime of the upperelectronic state on the excited rotational state con-tradicts our result. However, the faster decayingrotational states within v9 5 1 experience stronger
Table 3. Quenching and VET Rates ~in units of 108 s21!
Rate Q1N9 v10
N9 kQN9 kv
N9
State specificN9 5 4 8.9 6 0.6 5.0 6 0.2 10.5 6 3.0 12.5 6 3.8N9 5 12 6.0 6 0.3 1.9 6 0.1 7.5 6 2.2 8.0 6 0.7
Thermal Q1th Q0 v10
th
N9 5 4 7.2 6 0.3 6.4 6 0.3 2.9 6 0.3N9 5 12 7.0 6 0.1 6.3 6 0.1 3.0 6 0.1Calculateda 6.5 6 0.5 5.8 6 0.6 3.0 6 0.2
aThe calculated thermal rates are obtained from the cross sec-tions and simulated species concentrations in Table 4.

VET to the considerably longer-lived and morestrongly emitting v9 5 0 state. Detection of the in-tegrated emission from the excited electronic statetherefore smooths the significant N9 dependence ofthe lifetime of the v9 5 1 vibrational state.
The only OH VET data obtained under similar con-ditions of which we are aware were reported by Smithand Crosley.25 Their measurements were per-formed in the burned gas region of a slightly lean ~F5 0.86! atmospheric-pressure methane–air flame at atemperature of 1900 K. From high-resolution LIFspectra, the fraction of energy transferred from theinitially populated v9 5 1 state to the v9 5 0 state wasdetermined. The ratio of the total, time-integratedpopulation in v9 5 0 to that in v9 5 1 was found todecrease linearly with the quantum number of theexcited rotational state. From the fit to the experi-mental data shown in Ref. 25 we infer values forn0yn1 of 0.60 and 0.39 for N9 5 4 and N9 5 12 exci-tation, respectively. By integration of the time-dependent vibrational state, the population resultingfrom our model yields, in good agreement, n0yn1 50.60 and n0yn1 5 0.36 for N9 5 4 and N9 5 12 exci-tation, respectively.
To compare our thermal rates with those calcu-lated from published collisional cross sections of OHwe must know the flame species concentrations.They are extracted from a flame simulation by use ofa one-dimensional flat-flame burner model.31,32
This model includes a reaction mechanism estab-lished by Warnatz33 updated with the most recentlyevaluated kinetic data of the Commission of the Eu-ropean Communities evaluation group.34 The en-ergy equations are solved numerically without use ofthe measured temperature data as input for the mod-eling. The calculated concentrations for a stoichio-metric flame at a height of 3 mm above the burner areshown in Table 4. The calculated temperature is1760 K. Table 4 includes published quenching ~s1and s0! and VET ~s10! cross sections of OH with themost important flame species. The cross sections forN2, CO2, CO, and O2 are thermal cross sections mea-sured at 1900 K.17 The v9 5 1 quenching and theVET cross section for collisions with H2O are aver-ages of the rates recently measured for N9 5 0, 5, and13 at a temperature of 1600 K.28 For the v9 5 0quenching of OH colliding with H2O we use a value of25.5 Å2, the average of the cross sections measured at1200 K ~Ref. 35! and 2300 K ~Ref. 21!. The crosssections for H2, OH, and H are estimates recom-mended by Paul.17 The corresponding thermalquenching and VET rates are then calculated by
k 5 n0 (i
ci^v&i2OHsi, (7a)
where
^v&i2OH 5 ~8kTypmi2OH!1y2 (7b)
is the relative collision velocity, m is the reducedmass, n0 is the total number density, and the sum-mation is over all collision partners i at their mole
fraction ci. The result is shown in the bottom row ofTable 3. For the error estimate we included only thecross-section uncertainties of the dominant species,i.e., H2O for quenching and N2 for VET. The agree-ment is excellent for VET and for v9 5 1 quenching.The v9 5 0 quenching measured here is 12% higherthan predicted by the cross sections from Table 4.Recently Kienle et al.7 estimated a v9 5 0 quenchingcross section of 29 Å2 for collisions of OH with vapor~N9 5 5, T 5 1530 K!. Using this value results in aquenching rate of 6.44 3 108 s21, which correspondswell to our experimental result of 6.35 3 108 s21.
In summary, our results are in good agreementwith results obtained by previous authors as far as adirect comparison is possible. We emphasize thatthe introduced time-dependent rate model allows usto determine the rotational-state-dependent rates re-quired for modeling, rather than the directly measur-able rotationally averaged rates.
5. Rotational Energy Transfer
A. Rate Equations and Scaling Laws
The temporal evolution of the population for eachrotational state within the v9 5 1 vibrational level canbe described by rate equations.36,37 Equation 3~a!then becomes
dn1~i!dt
5 2FQ1~i! 1 v10~i! 1 (iÞj
kijGn1~i! 1 (iÞj
kjin1~ j!
1 v01~i!n0 1 E~i!d~t!, (8)
where kij is the rotational relaxation rate for the tran-sition i 3 j and E~i! is the initial laser-induced pop-ulation of rotational state i. Considering that asmany as 20 rotational states are populated at flametemperatures and taking the spin degeneracy intoaccount, to describe the rotational relaxation processrequires at least 40 3 40 state-to-state rates kij. It isnot reasonable to extract such a large number of pa-rameters from our data. Therefore a theoreticalmodel that limits the number of fit parameters isrequired for simulating the experimentally observedRET process.
The existing theoretical framework of rotationally
Table 4. Published Quenching and VET Cross Sections of OH for theMajor Collision Species and Their Concentrations c
Molecule c ~%! s0th ~Å2! s1
th ~Å2! s10th ~Å2!
N2 71.2 0.52a 0.58a 3.6a
H2O 18.4 25.5b 28.6c 0.3c
CO2 8.9 12.2a 12.9a 8.4a
CO 0.54 13.1a 10.4a 3.8a
O2 0.47 13.4a 15.1a 1.68a
H2 0.33 4.5d 4.5d 7.65d
OH 0.16 28d 28d 2.8d
H 0.05 14d 14d 14d
aRef. 17.bSee text.cRef. 28.dEstimates from Ref. 17.
20 May 1998 y Vol. 37, No. 15 y APPLIED OPTICS 3361

inelastic collisions can be divided into two concepts,the dynamically and the statistically based scalinglaws.38 The dynamically based scaling laws are de-veloped from quantum-mechanical considerations in-volving several approximations and assumptions.The infinite-order sudden approximation39,40 and theenergy-corrected sudden approximation41 ~ECS! be-long to this category. The ECS model accounts forthe finite collision duration by incorporating an adi-abatic energy-correction term into the infinite-ordersudden-approximation theory. These dynamicallybased scaling laws permit the construction of the en-tire RET matrix from a subset of known state-to-staterates. In contrast, statistically based scaling lawsare used to describe empirically measured state-to-state rates, which typically depend on the rotationalenergy spacing. This category includes the power-gap42 and the exponential-gap43,44 laws. An empir-ical model based on the exponential-gap law hasrepeatedly been used to describe experimentally ob-served RET of the OH A 2S1 state in flames.26,37,45
However, to fit the experimental data, an artificialrotational-level-dependent temperature has to be in-troduced. Furthermore, empirical rules have to beused to account for the observed propensity towardspin conservation.26
Recently Kienle et al.13 proposed a scaling formal-ism to describe RET of OH A 2S1~v9 5 0!. Thisformalism is based on the ECS theory in conjunctionwith statistically based scaling laws, using a subset ofmeasured state-to-state rates as input. The trans-fer rate matrix for transitions NJ 3 N9J9 is givenby13
kij 5 kNJ3N9J9 5 ~2J9 1 1! (l
uAlNN9u2Ml
NJN9J9kl, (9)
where
MlNJN9J9 5 ~2l 1 1!
12
@1 2 εε9~21!J1J91l#FJ9 l J1y2 0 1y2G2
(10)
is the angular momentum coupling coefficient40 and
AlNN9 5
24vth2\2 1 ~El 2 El21!
2lc2
24vth2\2 1 ~EN 2 EN21!
2lc2 (11)
is the adiabatic energy correction.41 The parameterε denotes the sign of the electron spin; e.g., ε is 21 forthe F1 and 11 for the F2 states. El is the rotationalenergy of state F1~l !, vth is the thermal velocity of thecollision partners, and lc is an average inelastic im-pact parameter or effective interaction length. Thebasis coefficients, kl, are the transfer rates from stateF1~l ! to the lowest rotational state F1~0!. Equation~9! is valid for downward transitions only. Upwardrates are obtained by detailed balancing. In thelimit where the interaction length lc vanishes, Eq. ~9!corresponds to the infinite-order sudden approxima-tion developed by Alexander.40 It describes rota-tionally inelastic collisions between a diatomic
3362 APPLIED OPTICS y Vol. 37, No. 15 y 20 May 1998
molecule in the 2S1 electronic state and a structure-less target. The assumption of a structureless tar-get is justified because so far no resonance effectswith the colliders have been observed for OH RET.With a set of known basis coefficients kl and collisionlength lc, the RET matrix can be constructed by ap-plication of Eqs. ~9!–~11!.
As we mentioned above, direct measurements ofstate-to-state rates are not feasible in this experi-ment. Thus it is necessary to fit the model, with lc asa fitting parameter, to the measured temporal evolu-tion of the 1–1 emission band. The basis coefficientsare calculated according to the power-gap law42:
kl 5 kl,l11y230,1y2 5 k0 S2El
El51D2g
, (12)
where k0 and g are two additional fitting parameters.Alternatively, an exponential-gap law kl ; k0exp~2bElykT! or a combination of both power- andexponential-gap laws was considered in Ref. 13.Our data are more accurately described by the power-gap law. The combination of both fitting laws didnot improve the results.
In general, the three model parameters lc, k0, andg are different for each colliding partner. In thisexperiment, however, a separation of the RET con-tributions that originate from the individual collisionpartners is not possible. Thus we fit a single set ofthe parameters lc, k0, and g to the experimental data,averaging the individual contribution of each flamespecies. Note that the average collision velocities vthare comparable for the three most important flamespecies: vth is 1880, 2065, and 1745 mys for N2, H2O,and CO2, respectively. Using the species concentra-tions from Table 4, we obtain a weighted average of1900 mys and used it in the simulation.
The total RET rate kL 5 SkLj from the laser-excitedrotational state L has often been measured to deter-mine branching ratios between quenching andRET.22,27,45–48 It is possible to calculate kL by usingthe ECS result or, alternatively, to determine it fromthe decay of the fluorescence emitted by the laser-excited state. Because this decay is strongly influ-enced by backtransfer, kL is not directly observable.However, KL can be determined by application of atime-dependent model similar to the one introducedin Section 4 for the quenching and VET rates:
dn1~L!
dt5 2k~t!n1~L!. (13)
If we assume that there is one excited state only~which is not strictly true in our experiment! the ratek at t 5 0 is given by k~0! 5 Q1~L! 1 v10~L! 1 kL. Astime evolves, the rotational-state population is equil-ibrated by RET and k~t! will approach the thermaldecay rate of the v9 5 1 vibrational band @k~`! 5 Q1
th
1 v10th#. An exponential decay toward the equilib-

rium value is chosen arbitrarily to describe the time-dependent decay rate:
k~t! 5 k~`! 1 @k~0! 2 k~`!#exp~2kR t!. (14)
The decay rate kR can be understood as the relaxationrate of the relative population of the laser-excitedstate toward its value within the rotationally equili-brated v9 5 1 manifold. Q1
N5L, Q1th, v10
N5L, andv10
th were determined in Section 4. Fitting Eqs. ~13!and ~14! to the fluorescence lines emitted by the laser-excited rotational state yields the two parameters kLand kR.
B. Results and Discussion: Rotational Energy Transfer
We investigate RET within the v9 5 1 vibronic levelby observing the 1–1 emission band. Comparedwith the 1–0 band, the 1–1 band is two times stron-ger,2 and the detection system is more efficient at 312nm. In addition, the 1–1 band does not interferewith Rayleigh scattering that might hide importantRET features within the 1–0 emission. It is essen-tial to account for the fluorescence polarization whenone is determining decay rates by using LIF. It ispossible to obtain isotropic spectra by carefully set-ting the laser polarization to a magic angle.16 Here,however, we performed measurements by using ver-tical and horizontal laser polarization that we com-bined by applying relation ~2!, yielding isotropic 1–1spectra. The resulting spectra are shown versustime for Q14 and Q112 excitation in Figs. 8~a! and8~b!, respectively. Because the amplitude of theemission decays rapidly with time, the intensities inFig. 8 are normalized to the most intense signal ineach individual spectrum.
A nonlinear least-squares fit yields the three pa-rameters lc, k0, and g. The procedure includes thefollowing steps: First, with each new set of fit pa-rameters the entire RET matrix is constructed fromEqs. ~9!–~12!; second, the time evolution of the popu-lation of each state is determined by solution of thesystem of ordinary differential equations @Eqs. ~8!and ~3b!#; third, the resulting emission is computed,convoluted with the measured instrumental re-sponse, and normalized to the experimental data bycomparison of the spectra at time zero. The compu-tation includes rotational states up to N9 5 29 andresults in a 59 3 59 RET matrix. Including the v9 50 vibrational level that is populated through VET, 60coupled ordinary differential equations must besolved. We use the relative excitations from Table 1for the fit because for both excitation lines only ;75%of the energy is deposited into the main excited rota-tional state. The required quenching and VET pa-rameters are taken from Section 4. The upwardVET is arbitrary distributed evenly over the lowest10 rotational states of the v9 5 1 level. During thefirst nanosecond, however, its contribution to the evo-lution of the rotational-state population is negligible.The fit is applied to the observed emission during thefirst nanosecond after excitation only. For Q14 thewhole 1–1 emission band is fitted. For the Q112
excitation the fitted spectral range is confined from314.7 nm to the red. The lower part of the spectrummay contain substantial contributions from the 0–0band, which is not well known for excitation to theF112 state ~see Subsection 4.B!. We calculate the v95 0 emission by assuming a rotational temperatureof 2380 K.
Best results are obtained when both data sets arefitted simultaneously. The fitted spectra are super-imposed onto the experimental data in Fig. 8. Theresulting fit parameters and their uncertainties aresummarized in the first row of Table 5. The resultsthat we obtained for fitting each data set individuallyor by using the sudden approximation without theadiabatic energy correction @by setting lc 5 0 in Eq.~11!# are also shown in Table 5. For comparison, theresulting sum of least squares ~x2! is calculated indi-vidually for the N9 5 4 and the N9 5 12 data andnormalized to those of the simultaneous fit.
The sudden approximation tolerably well describes
Fig. 8. Temporal evolution of the isotropic 1–1 band emission for~a! N9 5 4 and ~b! N9 5 12 ~b! excitation. Solid curves, experi-ment; dashed curves, nonlinear least-squares fit obtained fromapplication of the ECS RET model. Each individual ~experimen-tal and simulated! spectrum is averaged over 100 ps.
20 May 1998 y Vol. 37, No. 15 y APPLIED OPTICS 3363

Table 5. ECS Parameters g, lc, and k0 Depending on the Modela
RETModel
FittedData g lc ~Å!
k0
~3108 s21!
x2
N9 5 4 N9 5 12
ECS N9 5 4, 12 1.26 6 0.04 1.1 6 0.1 31 6 4 1.0 1.0N9 5 4 1.27 6 0.07 1.4 6 0.5 33 6 8 0.99 1.4N9 5 12 1.33 6 0.12 1.3 6 0.3 45 6 29 1.9 0.99
Sudden N9 5 4, 12 1.15 6 0.05 – 15 6 1 3.8 3.3N9 5 4 1.26 6 0.08 – 27 6 5 1.15 11.6N9 5 12 1.01 6 0.06 – 8 6 2 9.6 1.4
aThe first row shows the result obtained when the ECS model was fitted to both data sets ~N9 5 4 and N9 5 12! simultaneously. Forcomparison, the result obtained by fitting each data set individually or by use of the sudden approximation are also shown. The sumsof least-squares errors x2 are normalized and calculated separately for each data set ~see text!.
the measured spectra when each data set is fittedseparately. Better agreement is found for N9 5 4than for N9 5 12, as can be explained as follows:The sudden approximation is valid for kinetic ener-gies that are much larger than the rotational energiesof the molecule under consideration, e.g., when theduration of the collision ~tc 5 lcyvth! is much shorter~more sudden! than the rotational period ~tR!; e.g., tc,, tR.40 With lc 5 1.1 Å we derive an average col-lision time of 58 fs, which compares to a rotationalperiod of approximately 230 fs for the F14 and 85 fsfor the F112 states. Hence the sudden approxima-tion is more suitable for describing RET from lower-lying rotational states. For N9 5 12 the rotationalperiod approaches the collision time and, conse-quently, the adiabatic energy correction becomes sig-nificant.41 This result explains the loweruncertainty of collision length lc when the ECS modelis fitted to the N9 5 12 data than to the N9 5 4 data.
Applying the ECS model simultaneously to themeasured fluorescence obtained for N9 5 4 and N9 512 leads to substantial improvements: The uncer-tainty of the fit parameters decreases considerablywithout any loss of fit accuracy. The correspondingx2 values increase by only approximately 1%. Thisresult is due to the main role of the adiabatic energycorrection, which is to describe correctly the substan-tial decrease of RET with increasing rotational state.For illustration, the dependence of the total RET kLon N9 is shown in Fig. 9. We compute the curves byusing the ECS result from the first row of Table 5.The decrease of RET with increasing N9 is a result ofthe adiabatic energy correction. The ECS parame-ters must therefore be determined from a set of mea-surements obtained by excitation to as manyrotational levels as feasible, preferably includinghigh-lying levels. In the sudden limit the depen-dence of kL on N9 is nearly flat ~dashed curve in Fig.9!. This explains why the sudden approximationfails to describe both data sets simultaneously ~seeTable 5!.
The main differences between the ECS fit and theexperimental result are found for the transitions thatexhibit a change of the electron spin, i.e., F1~L! 3F2~L!. The effect can be seen clearly for the earlyspectra of Fig. 8~a!. The observed emissions near
3364 APPLIED OPTICS y Vol. 37, No. 15 y 20 May 1998
314.8 nm that correspond to the overlapping Q2~1–5!transitions are approximately 10% stronger than thefitted spectra. Also, for N9 5 12 the calculated P213line is considerably weaker than measured. Thedisagreement might emerge from neglecting the spininteraction in the collision process.40 Alternatively,the difference might be caused by the distinct contri-butions of the collision partners present in the flamethat are averaged for the computation. State-to-state rates determined for the most important flamespecies in low-pressure flames show that the propen-sity toward spin conservation is strong for H2O,weaker for N2, and vanishing for CO2.49 The finitecollision length introduced by the ECS model weak-ens the strong propensity for spin conservation im-posed by the sudden approximation.13,40,41 As aresult, collision lengths lc might differ strongly forthese molecules. Indeed, a value for lc of 0.7 Å wasdetermined for water vapor,13 which is smaller thanour average value of 1.1 Å and is in agreement withthe considerations above. The exponent of thepower-gap law for collisions of OH with H2O wasfound to be 1.3, close to our result of 1.26. The valuefor g seems to be insensitive to the collision partner.
To validate the ECS result above we independentlydetermine the total RET kL of the laser excited state
Fig. 9. Total RET rate kL as a function of rotational level ascalculated by application of the ECS model ~solid curve! and thesudden approximation ~dashed curve!. Symbols, total RET ratesobtained in this research by direct fitting of the emissions by thelaser-excited rotational state: triangles, Q lines; circles, P lines.

by fitting Eqs. ~13! and ~14! to the Q and P linesemitted from the laser excited state. The resultingrates are summarized in Table 6 and shown in Fig. 9.They are in good agreement with the rates that wecalculated by applying the ECS result. However,there is a discrepancy between the values obtainedfor kR from the different lines that is due to the lim-ited spectral resolution of our detection system. Inparticular, the P15 line overlaps other lines that aresubstantially populated through RET. This effecttends to mimic a slower decay of the laser excitedstate.
We can compare the ECS result determined in thissection with the results on quenching and VET givenin Section 4. It is important to point out that theamplitudes of the measured and fitted spectra in Fig.8 are in good agreement. The overall decay of the1–1 emission is therefore well described by thequenching and VET result obtained in Section 4.Also, the 0–0 emission band is well reproduced by thesimulation, as is discernible in Fig. 8 below the onsetof the 1–1 emission band at 312.2 nm. As expectedfrom the results in Subsection 4.B, the agreement isbetter for N9 5 4 than for N9 5 12. The calculatedtime-integrated population ratio of the v9 5 0 and v95 1 vibrational levels versus N9 of the laser-excitedrotational state is shown as a solid curve in Fig. 10
Fig. 10. Time-integrated population ratio n0yn1 as a function ofthe laser-excited rotational state computed from the ECS model~solid curve!. Symbols, results derived from experimental data:circles, this work ~see Section 4!; diamonds, Ref. 25.
Table 6. Total RET Rates kL and Relative State Relaxation Rates kR
~in units of 108 s21!a
RotationalState
DetectedTransition kR
kL
Rate ModelECS
Model
N9 5 4 Q14 26.5 6 2.0 57 6 4 59.6P15 36.5 6 2.4 58 6 5 –
N9 5 12 Q112 12.6 6 1.5 30 6 2 28.3P113 11.8 6 1.5 32 6 2 –
aColumns 3 and 4 obtained by fitting the time-dependent ratemodel @Eqs. ~11! and ~12!# to the lines emitted by the laser-excitedrotational state; column 5, the corresponding total RET rates cal-culated with the ECS result.
and compared with the results from Section 4 andwith those obtained by Smith and Crosley.25 Theagreement is good for N9 up to 12. Finally, we canuse the ECS model to validate the time-dependentrate model that yields the quenching and VET ratesgiven in Section 4. The temporal evolution of theoverall quenching and VET of the v9 5 1 band can besimulated by use of the ECS model. We show theresult in Fig. 11 and compare it with the result ob-tained in Section 4 by using the time-dependent ratemodel ~thinner solid curves!. Despite the uncertain-ties involved in the experiment and the assumptionsmade in the model, the agreement is reasonable.For the first few nanoseconds the simulation en-dorses our assumption made in Eqs. ~4! that thequenching and VET rates decay exponentially towardan equilibrium value. However, within the timewindow of 5 ns shown in Fig. 11, such equilibrium isnot reached. The long-term evolution depends onthe distribution of the upward VET from v9 5 0 overthe rotational states within the v9 5 1 level. More-over, as time evolves, high-lying rotational states arebeing populated through RET. The quenching givenby Eqs. ~6! might be underestimated for large N9.For N9 larger than 20, predissociation must be con-sidered.50,51 These effects become increasingly im-portant for the computation of the rotational-statedistribution within v9 5 1 for times later than 3 ns.At this time, however, the upper electronic state issubstantially depleted and the influence of the up-ward VET and predissociation to the overall, time-integrated LIF signal is small.
6. Summary
We have presented measurements of the temporallyand spectrally resolved fluorescence of OH A 2S1~v9 50, 1! in an atmospheric-pressure methane–air flame,using picosecond excitation and detection. The mea-surements permitted the comprehensive investiga-tion of the collisional deactivation of the excitedmolecule, e.g., the study of LIF depolarization,quenching, VET, and RET. It is essential to account
Fig. 11. Temporal evolution of the total v9 5 1 quenching andVET rates computed from the ECS model for Q14 ~thicker solidcurves! and Q112 ~dashed curves! excitation. For comparison thecorresponding rates obtained in Section 4 from the time-dependentrate model are plotted with the thinner solid curves.
20 May 1998 y Vol. 37, No. 15 y APPLIED OPTICS 3365

for the LIF polarization to avoid significant errors inrate measurements. Significant polarization andanisotropy of the OH emission were observed, anddepolarization rates were determined. Depolariza-tion was found to be a factor of 2–3 slower than RET.We proposed an empirical model to describe thetime dependence of the quenching and VET ratesemerging from the rotational-state relaxation that isgoverned by RET. This model permits the determi-nation of both the thermal and the rotational-state-specific rates for quenching and VET. The thermalrates obtained on excitation of a low ~N9 5 4! rota-tional state agree well with those obtained when ahigh rotational state ~N9 5 12! is excited. Also, theyare in accordance with rates calculated from pub-lished cross sections of OH for the most dominantflame species. VET from the higher rotational state~N9 5 12! showed a slight preference for transitions toclose-lying rotational levels of the lower vibrationalstate. Such a tendency for transitions toward isoen-ergetic states was not observed for the lower rota-tional state ~N9 5 4!. Finally, we showed that RETwithin the excited vibronic state is reasonably welldescribed by the ECS theory in combination with apower-gap law. Fitting this model to our datayielded an average effective collision length of 1.1 Åand an exponent of the power-gap law of 1.26. TheECS parameters used to describe the RET processmust be based on experimental data that include,whenever possible, rates determined for low- andhigh-lying rotational states. State-to-state rates ofOH with specific colliders have been published forRET within v9 5 0 and v9 5 1 for N9 # 5.49,52,53
Finally, we point out that time- and spectrally re-solved measurements may be useful for validation ofLIF simulation codes, such as the recently proposedLASKIN code.7
We thank Andreas Schlegel for the flame simula-tions and W. Kreutner for a preprint of Ref. 28. Thisresearch was supported by the Swiss Department ofEnergy.
References1. G. H. Dieke and H. M. Crosswhite, “The ultraviolet bands of
OH,” J. Quant. Spectrosc. Radiat. Transfer 2, 97–199 ~1961!.2. I. L. Chidsey and D. R. Crosley, “Calculated rotational transi-
tion probabilities for the A–X system of OH,” J. Quant. Spec-trosc. Radiat. Transfer 23, 187–199 ~1980!.
3. A. C. Eckbreth, Laser Diagnostics for Combustion Temperatureand Species ~Abacus, Cambridge, Mass., 1988!.
4. K. Kohse-Hoinghaus, “Laser techniques for the quantitativedetection of reactive intermediates in combustion systems,” inProg. Energy Combust. Sci. 21, 203–279 ~1995!.
5. D. R. Crosley, “Rotational and translational effects in collisionsof electronically excited diatomic hydrides,” J. Phys. Chem. 93,6273–6282 ~1989!.
6. D. R. Crosley, “Semiquantitative laser induced fluorescence inflames,” Combust. Flame 78, 153–167 ~1989!.
7. R. Kienle, M. P. Lee, and K. Kohse-Hoinghaus, “A detailed rateequation model for the simulation of energy transfer in OHlaser-induced fluorescence,” Appl. Phys. B 62, 583–599 ~1996!.
8. N. Bergano, P. Jaanimagi, and M. Salour, “Picosecond laser-
3366 APPLIED OPTICS y Vol. 37, No. 15 y 20 May 1998
spectroscopy measurement of hydroxyl fluorescence in flames,”Opt. Lett. 8, 443–445 ~1983!.
9. R. Schwarzwald, P. Monkhouse and J. Wolfrum, “Picosecondfluorescence lifetime measurement of the OH radical in anatmospheric pressure flame,” Chem. Phys. Lett. 142, 15–18~1987!.
10. M. Kollner, P. Monkhouse, and J. Wolfrum, “Time-resolvedLIF of OH ~A 2S1, v9 5 1 and v9 5 0! in atmospheric-pressureflames using picosecond excitation,” Chem. Phys. Lett. 168,355–360 ~1990!.
11. A. Dreizler, R. Tadday, P. Monkhouse, and J. Wolfrum, “Timeand spatially resolved LIF of OH A 2S1~v9 5 1! in atmospheric-pressure flames by picosecond excitation,” Appl. Phys. B 57,85–87 ~1993!.
12. T. A. Reichardt, M. S. Klassen, G. B. King, and N. M. Lauren-deau, “Measurements of hydroxyl concentrations and lifetimesin laminar flames using picosecond time-resolved laser-induced fluorescence,” Appl. Opt. 35, 2125–2139 ~1996!.
13. R. Kienle, M. P. Lee, and K. Kohse-Hoinghaus, “A scalingformalism for the representation of rotational energy transferin OH ~A 2S1! in combustion experiments,” Appl. Phys. B 63,403–418 ~1996!.
14. M. W. Sasnett, “Propagation of multimode laser beams—theM2 factor,” in The Physics and Technology of Laser Resonators,D. R. Hall and P. E. Jackson, eds. ~Hilger, Bristol, UK, 1989!,pp. 132–142.
15. R. N. Zare, “Molecular level-crossing spectroscopy,” J. Chem.Phys. 45, 4510–4518 ~1966!.
16. P. M. Doherty and D. R. Crosley, “Polarization of laser-inducedfluorescence in OH in an atmospheric pressure flame,” Appl.Opt. 23, 713–721 ~1984!.
17. P. H. Paul, “Vibrational energy transfer and quenching of OHA 2S1 ~v9 5 1! measured at high temperatures in a shock tube,”J. Phys. Chem. 99, 8472–8476 ~1995!.
18. K. R. German, “Direct measurement of the radiative lifetimesof the A 2S1~V9 5 0! states of OH and OD,” J. Chem. Phys. 62,2584–2587 ~1975!; “Radiative and predissociative lifetimes ofthe v9 5 0, 1 and 2 levels of the A 2S1 state of OH and OD,”J. Chem. Phys. 63, 5252–5255 ~1975!.
19. R. A. Copeland, M. J. Dyer, and D. R. Crosley, “Rotational-level-dependent quenching of A 2S1 OH and OD,” J. Chem.Phys. 82, 4022–4032 ~1985!.
20. K. Kohse-Hoinghaus, J. B. Jeffries, R. A. Copeland, G. P.Smith, and D. R. Crosley, “The quantitative LIF determinationof OH concentrations in low-pressure flames,” in Twenty-Second Symposium ~International! on Combustion ~Combus-tion Institute, Pittsburgh, Pa., 1988!, pp. 1857–1866.
21. J. B. Jeffries, K. Kohse-Hoinghaus, G. P. Smith, R. A. Cope-land, and D. R. Crosley, “Rotational-level-dependent quench-ing of OH ~A 2S1! at flame temperatures,” Chem. Phys. Lett.152, 160–166 ~1988!.
22. M. P. Lee, R. Kienle, and K. Kohse-Hoinghaus, “Measure-ments of rotational energy transfer and quenching in OH A2S1, v9 5 0 at elevated temperature,” Appl. Phys. B 58, 447–457 ~1994!.
23. R. K. Lengel and D. R. Crosley, “Rotational-dependence ofvibrational relaxation in A 2S1 OH,” Chem. Phys. Lett. 32,261–264 ~1975!.
24. R. K. Lengel and D. R. Crosley, “Energy transfer in A 2S1 OH.II. Vibrational,” J. Chem. Phys. 68, 5309–5324 ~1978!.
25. G. Smith and D. R. Crosley, “Vibrational energy transfer in A2S1 OH in flames,” Appl. Opt. 22, 1428–1430 ~1983!.
26. D. R. Crosley and G. P. Smith, “Rotational energy transfer andLIF temperature measurements,” Combust. Flame 44, 27–34~1982!.
27. D. Stepowski and M. J. Cotterau, “Time resolved study ofrotational energy transfer in A 2S1~v9 5 0! state of OH in a

flame by laser induced fluorescence,” J. Chem. Phys. 74, 6674–6679 ~1981!.
28. A. T. Hartlieb, D. Markus, W. Kreutner, and K. Kohse-Hoinghaus, “Measurement of vibrational energy transfer ofOH ~A 2S1, v9 5 13 0! in low-pressure flames,” Appl. Phys. B65, 81–91 ~1997!.
29. D. R. Crosley, SRI International, Menlo Park, Calif. 94025~personal communication, 1997!.
30. R. J. Cattolica and T. G. Mataga, “Rotational-level-dependentquenching of OH A 2S1~v9 5 1! by collisions with H2O in a lowpressure flame,” Chem. Phys. Lett. 182, 623–631 ~1991!.
31. M. D. Smooke, J. A. Miller, and R. J. Kee, “On the use ofadaptive grids in numerically calculating adiabatic flamespeeds,” in Numerical Methods in Laminar Flame Propaga-tion, N. Peters and J. Warnatz, eds. ~Vieweg, Wiesbaden, Ger-many, 1982!, pp. 65–70.
32. J. F. Grcar, R. J. Kee, M. D. Smooke, and J. A. Miller, “A hybridNewtonytime-integration procedure for the solution of steady,laminar, one-dimensional, premixed flames,” in Twenty-FirstSymposium ~International! on Combustion ~Combustion Insti-tute, Pittsburgh, Pa., 1986!, pp. 1773–1779.
33. J. Warnatz, “Rate coefficients in the CyHyO-system,” in Com-bustion Chemistry, W. C. Gardiner, ed. ~Springer-Verlag, Ber-lin, 1984!, pp. 197–360.
34. D. L. Baulch, C. J. Cobos, R. A. Cox, C. Esser, P. Frank, Th.Just, J. A. Kerr, M. J. Pilling, J. Troe, R. W. Walker, and J.Warnatz, “Evaluated kinetic data for combustion modeling,” J.Phys. Chem. 21, 411–734 ~1992!.
35. P. W. Fairchild, G. P. Smith, and D. R. Crosley, “Collisionalquenching of A 2S1 OH at elevated temperatures,” J. Chem.Phys. 79, 1795–1807 ~1983!.
36. J. W. Daily, “Use of rate equations to describe laser excitationin flames,” Appl. Opt. 16, 2322–2327 ~1977!.
37. C. Chan and J. W. Daily, “Laser excitation dynamics of OH inflames,” Appl. Opt. 19, 1357–1367 ~1980!.
38. T. A. Brunner and D. Pritchard, “Fitting laws for rotationallyinelastic collisions,” Adv. Chem. Phys. 50, 589–641 ~1982!.
39. R. Goldflam, S. Green, and D. J. Kouri, “Infinite order suddenapproximation for rotational energy transfer in gaseous mix-tures,” J. Chem. Phys. 67, 4149–4161 ~1977!.
40. M. H. Alexander, “Rotationally inelastic collisions between adiatomic molecule in a 2S1 electronic state and a structurelesstarget,” J. Chem. Phys. 76, 3637–3645 ~1982!.
41. A. E. DePristo, S. D. Augustin, R. Ramaswamy, and H. Rabitz,“Quantum number and energy scaling for nonreactive colli-sions,” J. Chem. Phys. 71, 850–865 ~1979!.
42. T. A. Brunner, R. D. Driver, N. Smith, and D. E. Pritchard,“Simple scaling law for rotational-energy transfer in Na2*–Xecollisions,” Phys. Rev. Lett. 41, 856–859 ~1978!.
43. J. C. Polanyi and K. B. Woodall, “Mechanism of rotationalrelaxation,” J. Chem. Phys. 56, 1563–1572 ~1972!.
44. I. Procaccia and R. D. Levine, “Cross sections for rotationalenergy transfer: an information-theoretic synthesis,”J. Chem. Phys. 64, 808–817 ~1976!.
45. R. K. Lengel and D. R. Crosley, “Energy transfer in A 2S1 OH.I. Rotational,” J. Chem. Phys. 67, 2085–2101 ~1977!.
46. G. P. Smith and D. R. Crosley, “Quantitative laser-inducedfluorescence in OH: transition probabilities and the influenceof energy transfer,” in Eighteenth Symposium ~International!on Combustion ~Combustion Institute, Pittsburgh, Pa., 1981!,pp. 1511–1520.
47. R. P. Lucht, D. W. Sweeney, and N. M. Laurendeau, “Time-resolved fluorescence investigation of rotational transfer in A2S1~v 5 0! OH,” Appl. Opt. 25, 4086–4095, ~1986!.
48. J. Burris, J. Butler, T. McGee, and W. Heaps, “Quenching androtational energy transfer rates in the v9 5 0 manifold of OH~A 2S1!,” Chem. Phys. 151, 233–238 ~1991!.
49. R. Kienle, A. Jorg, and K. Kohse-Hoinghaus, “State-to-staterotational energy transfer in OH ~A 2S1, v9 5 1!,” Appl. Phys.B 56, 249–258 ~1993!.
50. R. A. Sutherland and R. A. Anderson, “Radiative and predis-sociative lifetimes of the A 2S1 state of OH,” J. Chem. Phys. 58,1226–1234 ~1973!.
51. D. R. Yarkony, “A theoretical treatment of the predissociationof the individual rovibronic levels of OHyOD~A 2S1!,” J. Chem.Phys. 97, 1838–1849 ~1992!.
52. A. Jorg, U. Meier, and K. Kohse-Hoinghaus, “Rotational en-ergy transfer in OH ~A 2S1, v9 5 0!: a method for the directdetermination of state-to-state transfer coefficients,” J. Chem.Phys. 93, 6453–6462 ~1990!.
53. A. Jorg, U. Meier, R. Kienle, and K. Kohse-Hoinghaus, “State-specific rotational energy transfer in OH ~A 2S1, v9 5 0! bysome combustion relevant collision partners,” Appl. Phys. B55, 305–310 ~1992!.
20 May 1998 y Vol. 37, No. 15 y APPLIED OPTICS 3367


![The substituent effect of π-electron delocalization in N … · 2020-04-30 · R[F2 >2σ(F2)] Final R indices R1=0.0572,wR2=0.0958 R1=0.0364,wR2=0.0549 R1=0.0252, wR2=0.0721 R indices](https://static.fdocument.org/doc/165x107/5f6e463324a3df634645499f/the-substituent-effect-of-electron-delocalization-in-n-2020-04-30-rf2-2ff2.jpg)


![B-TOUCH intelligence passenger airbag deactivation warning lamp intelligence pre heating display reconfigurable intelligence radio command display ... passat [1997] (3b) edi (ΗΛΕΚΤΡΟΝΙΚΗ](https://static.fdocument.org/doc/165x107/6123f6172259f476611dad53/b-intelligence-passenger-airbag-deactivation-warning-lamp-intelligence-pre-heating.jpg)