pi pulii — ™ ι - aei.pitt.eduaei.pitt.edu/91706/1/4880.pdf · Depressurization of the Vessel...
58
■M •«•■WiSh 'ifwi* ; Birto Aon» & ii EUR 4880 e || |É« ti«!«!»!'««! 'lir ty? r)lÀ*'V\ ¿pur* ih·} 1 '* iti*·' TO 1 ·*&*Ψ ■m OF THE EUROPEAN COMMUNITIES ■ " : i^fci !* -tii iff ii I n ■ *· * '▼! ™ '*ff* 15 Δ » Τ Τ > Tït ' • i HH' ' ' '■ RAPID DEPRESSURIZATION OF A THERMAL »i« If ål; ipil E. ARANOVITCH and D. VAN ASSELT Μ* !, |'·Λ;!: wm IH*íoñ- m ie« im 4M 'β; iliiife ,„, sipi: HHIHHB MA liiMil m ÚIMW ÉfpSfé »8»Α11^ %» ¡"VUS :k"if.ri< mÈ^mm IPi illiffi iHSiiil ι&δΜ* Ito E*■■!· is M t >■·«.' M* Joint Nuclear Research Centre Ispra Establishment - Italy fPM * ' *Γ(} ; ίΐΑ> Irta ¡i ¡ti- J? OT.hlliWi&wiKSdRítiwfflfc.-' lIiilÉilPli»
-
Upload
trinhthuan -
Category
Documents
-
view
213 -
download
0
Transcript of pi pulii — ™ ι - aei.pitt.eduaei.pitt.edu/91706/1/4880.pdf · Depressurization of the Vessel...
■M •«•■WiSh ' i fwi*;
Birto Aon» & ii EUR 4880 e | |
| É « ti«!«!»!'««! 'lir ty? r)lÀ*'V\ ¿pur* ih·}
1'* i t i * · '
TO1 ·*&*Ψ
■m
OF THE EUROPEAN COMMUNITIES ■ "
:i^fci !* -tii iff ii I n
■ *· * ' ▼ ! ™ '*ff*
15 Δ » Τ Τ > T ï t
' • i HH'
' fc ' '■ RAPID DEPRESSURIZATION OF A THERMAL
»i«
If ål;
ipil
E. ARANOVITCH and D. VAN ASSELT
Μ* !,|'·Λ;!:
wm IH*íoñ- m i e « im 4M
'β; iliiife ,„, sipi:
HHIHHB MA
liiMil m
ÚIMW
ÉfpSfé
»8»Α11^ %» ¡"VUS :k"if.ri< mÈ^mm
IPi i l l i ff i iHSiiil
ι&δΜ* Ito E*■■!·
is
M t >■·« . ' M*
Joint Nuclear Research Centre
Ispra Establishment - Italy
f P M * ' *Γ(};ίΐΑ> Irta ¡i ¡ti-J ? OT.hlliWi&wiKSdRítiwfflfc.-' lIiilÉilPli»
vii mm
mm* ltìt*if,'*H, i Via· tí<1 ld ¡Of.iáJji \e'.JmV'~ j..'tSÌiSììÀi · Un Ubiti r.
ii Η Κ 11 wat- **$i"m"'ûWw 'lus
m
f W f i IIP pi pulii — ™ ι
f Thi
o f1
This document was prepared under the sponsorship of the Commission
the European Communities.
Neither the Commission of the European Communities, its contractors
nor any person acting on their behalf:
fm ;ιΗ ι ffi 'If in this document.
MmMmàâî rÆ ff ' \¿W MA· Wi iWÆi Ut -twñ&i
make any warranty or representation, express or implied, with respect
to the accuracy, completeness, or usefulness of the information contained
in this document, or tha t the use of any information, apparatus, method
or process disclosed in this document may not infringe privately owned
rights; or
assume any liability with respect to the use of, or for damages resulting
from the use of any information, apparatus, method or process disclosed
in this document.
WlH«! 111
Í This report is on sale at the addresses listed on cover page 4
. _ lam Si!
im 'mM at the price of B.Fr. 70, MifÉit pilfisfei
%«S!|î;®!
'Mr C o m m i s s i o n of t h e
M ¡ B e i : mäåXEmtäfäfåBk ■a» m ii
This document was reproduced on the basis of the best available copy. le copy.
IltÉbì MmmmêM
EUR 4880 e
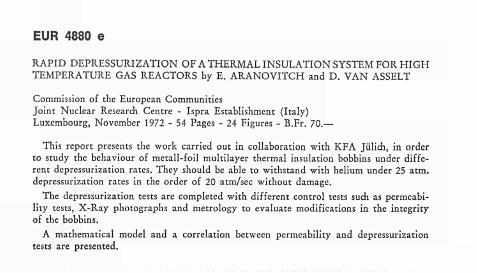
RAPID DEPRESSURIZATION OF A THERMAL INSULATION SYSTEM FOR HIGH TEMPERATURE GAS REACTORS by E. ARANOVITCH and D. VAN ASSELT
Commission of the European Communities Joint Nuclear Research Centre - Ispra Establishment (Italy) Luxembourg, November 1972 - 54 Pages - 24 Figures - B.Fr. 70.—
This report presents the work carried out in collaboration with KFA Jülich, in order to study the behaviour of metall-foil multilayer thermal insulation bobbins under different deprcssurization rates. They should be able to withstand with helium under 25 atm. depressurization rates in the order of 20 atm/sec without damage.
The deprcssurization tests are completed with different control tests such as permeability tests, X-Ray photographs and metrology to evaluate modifications in the integrity of the bobbins.
A mathematical model and a correlation between permeability and depressurization tests are presented.

EUR 4880 e
COMMISSION OF THE EUROPEAN COMMUNITIES
RAPID DEPRESSURIZATION OF A THERMAL INSULATION SYSTEM FOR HIGH TEMPERATURE
GAS REACTORS
by
E. ARANOVITCH and D. VAN ASSELT
1972
Joint Nuclear Research Centre Ispra Establishment - Italy
ABSTRACT
This report presents the work carried out in collaboration with KFA Jülich, in order to study the behaviour of metall-foil multilayer thermal insulation bobbins under different deprcssurization rates. They should be able to withstand with helium under 25 atm. depressurization rates in the order of 20 atm/sec without damage.
The depressurization tests are completed with different control tests such as permeability tests, X-Ray photographs and metrology to evaluate modifications in the integrity of the bobbins.
A mathematical model and a correlation between permeability and depressurization tests are presented.
KEYWORDS
HTGR TYPE REACTORS LEAKS THERMAL INSULATION MEASURED VALUES FOILS TESTING METALS NONDESTRUCTIVE TESTING PRESSURE MATHEMATICAL MODELS TRANSIENTS
- 3 -C O N T E N T S P a g e
1. I n t r o d u c t i o n 5
2 . D e s c r i p t i o n of T e s t F a c i l i t y 6
3 . D e s c r i p t i o n of T e s t B o b b i n s 7
3 . 1 G e n e r a l D e s c r i p t i o n 7
3 . 2 Mod i f i c a t i on of T e s t B o b b i n s 8
4 . I n s t r u m e n t a t i o n 8
4 . 1 P r e s s u r e M e a s u r e m e n t s 8
4 . 2 D i f f e r e n t i a l P r e s s u r e s 9
4 . 3 S t r a i n M e a s u r e m e n t s 1 0
4 . 4 T e m p e r a t u r e M e a s u r e m e n t s 10
5. D e p r e s s u r i z a t i o n of t h e V e s s e l 11
6 . D e p r e s s u r i z a t i o n of t h e I n s u l a t i o n S y s t e m in to the V e s s e l 13
7 . E x p e r i m e n t a l R e s u l t s 15
7 . 1 I n i t i a l D e p r e s s u r i z a t i o n R a t e s 20
7 . 2 M a x i m u m P r e s s u r e D i f f e r e n c e s 20
8. C o n t r o l T e s t s 23
8. 1 P e r m e a b i l i t y T e s t s (Gas F l o w R e s i s t a n c e T e s t s ) 23
8. 2 X - r a y P h o t o g r a p h s 27
8. 3 M e t r o l o g y 28
8 . 4 L e a k t e s t s 28
9 . C o r r e l a t i o n b e t w e e n P e r m e a b i l i t y a n d D e p r e s s u r i z a t i o n T e s t s 30
C o n c l u s i o n s 31
A p p e n d i x 34
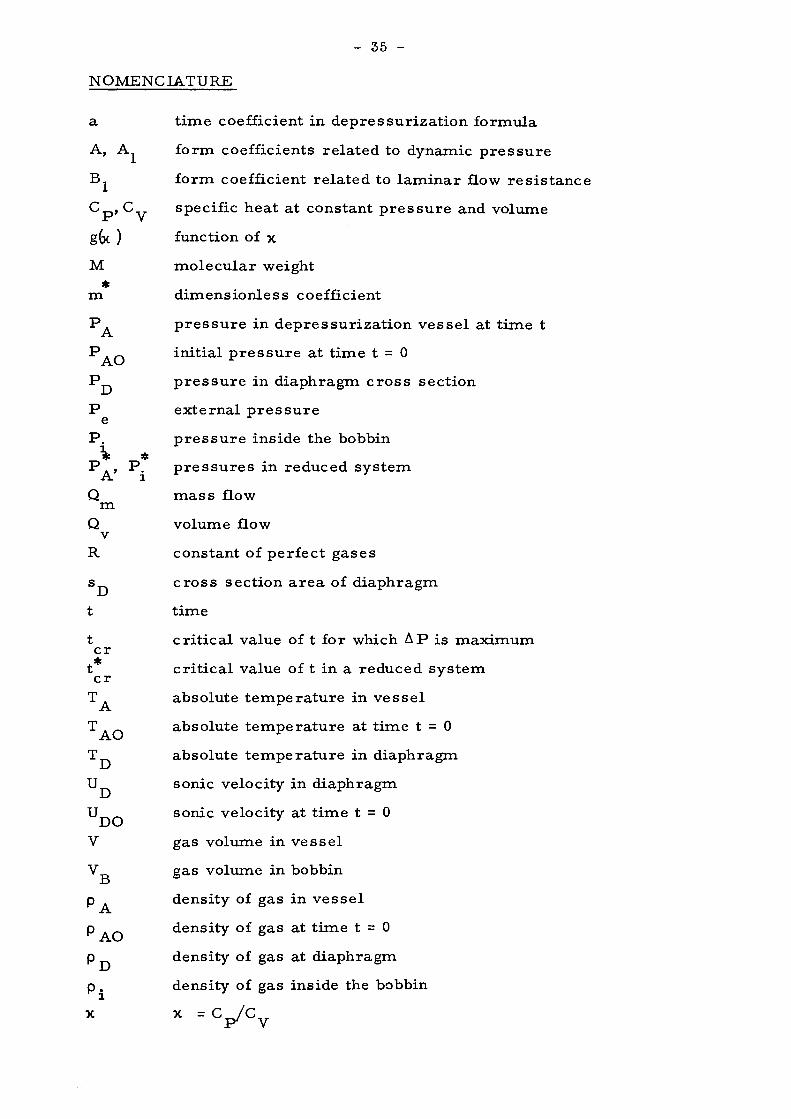
N o m e n c l a t u r e 35
L i s t of T a b l e s a n d F i g u r e s 37

- 5 -
RAPID DEPRESSURIZATION OF A THERMAL INSULATION SYSTEM FOR
HIGH TEMPERATURE GAS REACTORS
by
E. Ar ano vite h and D. van As s e It
Cont rac t of Col laborat ion: No. 014 - 70 - PISGD G H H / K F A , Jülich
1. INTRODUCTION
Insulat ion sy s t ems for high t e m p e r a t u r e gas r e a c t o r s m u s t not only show
good c h a r a c t e r i s t i c s from a t h e r m a l point of view, but m u s t a l so fulfill o ther
condit ions, such as good behaviour under t h e r m a l cycling, p r e s s u r e cycling,
eventual c o r r o s i o n phenomena, v ib ra t ions . They m u s t be easy to mount and
fix and be highly re l i ab le , genera l ly for the life t ime of the reac tor -
The mul t i l aye r foil type of insulat ion i s designed such as to keep the na
t u r a l convection in the l a m i n a r range and in such s y s t e m s , t he rma l ly speak
ing, i t i s be t t e r to have the individual ce l ls as leaktight as poss ible in o r d e r
to avoid m a c r o convection, that i s fluid flow pa t t e rns covering the whole insu
lat ion s y s t e m . But from a safety point of view, the insulat ion mus t be able to
withstand accidental rapid d e p r e s s u r i z a t i o n s , due for ins tance to pump fai l
u r e . In the case of a d i rec t cycle , the ini t ia l dep re s su r i za t i on ra te could
reach the o r d e r of 20 a t m / s e c in the p r i m a r y ducts . There fore the re mus t
be communicat ions between the ce l ls with the outs ide . A compromise mus t
be found between these two cont rad ic tory a s p e c t s , safety and t h e r m a l p e r
fo rmances .
The object of the p re sen t cont rac t is to study the behaviour of DARCHEM
type insulat ion bobbins under different dep re s su r i za t i on r a t e s . They should
be able to withstand with hel ium under 25 a tm dep re s su r i za t i on r a t e s in the
o r d e r of 20 a t m / s e c without damage.
- 6 -
The depressu r i za t ion t e s t s a r e completed with different control t e s t s
such as permeabi l i ty t e s t s , radiography and met ro logy to evaluate modif i
cat ions in the integr i ty of the bobbins.
The t e s t s were c a r r i e d out at the CCR I s p r a on a t e s t facility in which
the depres su r i za t ion r a t e s can be made to vary up to m o r e than 100 a t m / s e c .
The tes t p r o g r a m which was divided into two p a r t s , s t a r t e d in Apr i l 1970,
through to December 1970. The second pa r t of the p r o g r a m was pe r fo rmed
in the per iod January-October 1971. Two technical r epor t s were wr i t ten in
the meant ime, giving pa r t i a l r e s u l t s . The p r e sen t r epor t r e p r e s e n t s the d e
finitive r epo r t .
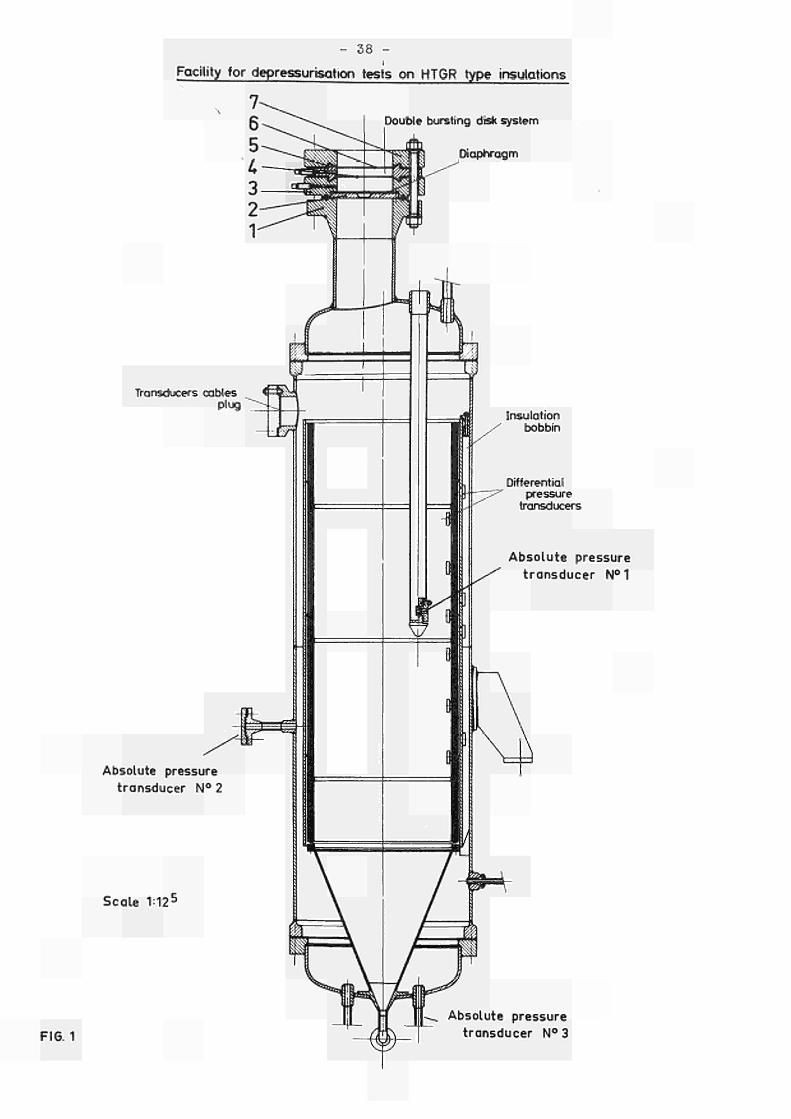
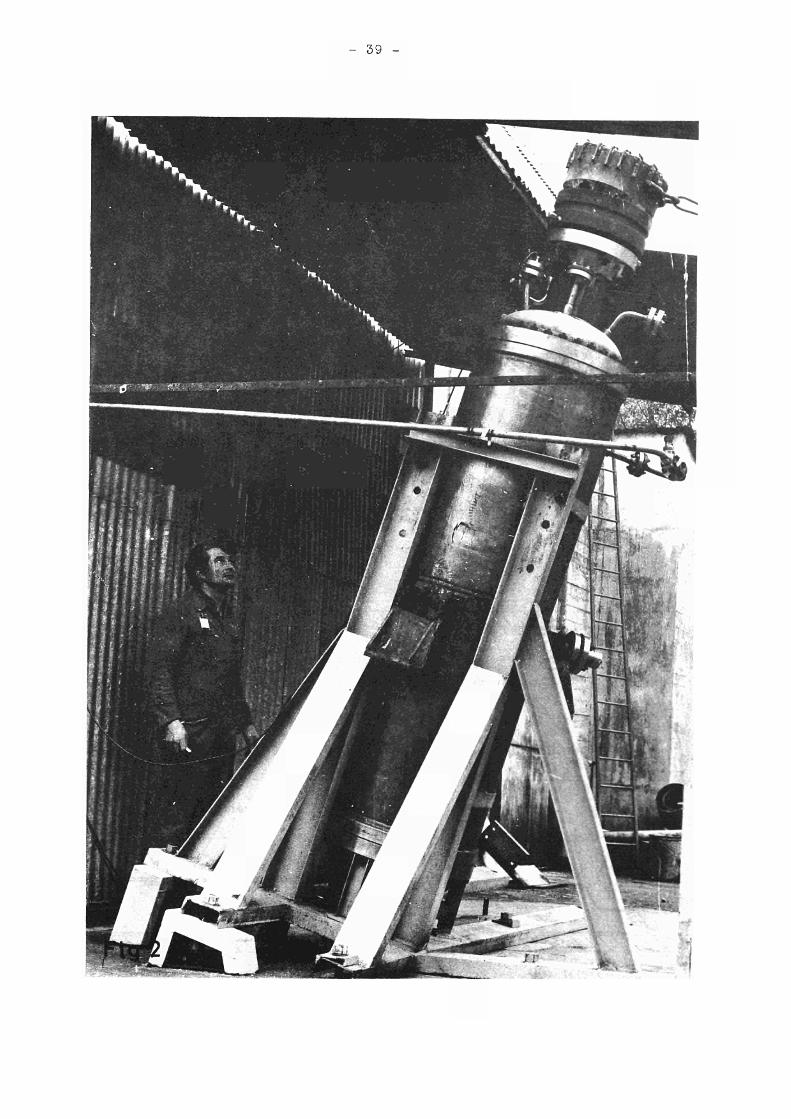
2. DESCRIPTIONS OF THE TEST FACILITY
A schemat ic design and a photograph of the depres su r i za t ion facility a r e
shown in F ig . 1 and 2. It mainly consis ts of a p r e s s u r e v e s s e l , in te rna l d ia
m e t e r 610 m m , height 2450 m m , in terna l d i ame te r of l id 570 m m . Working
p r e s s u r e 25 a tm is in cold condition.
This facility offers the possibi l i ty to t e s t e i ther panels o r bobbins up to
560 m m d iame te r and 1500 mm length, at an init ial p r e s s u r e up to 25 a tm .
Different depressu r i za t ion r a t e s a r e obtained by var ia t ion of the d i ame
t e r of a d iaphragm through which the gas is escaping into the ambiance in
the upper head of the ve s se l . The outlet d i ame te r can be va r i ed in mounting
diaphragms of different d i amete r s up to a max imum outlet of 200 m m , al low
ing depressur iza t ion r a t e s between 0 and 200 a t m / s e c .
A double burs t ing disk sys tem is fitted above the d iaphragm (see Fig . 1).
This sys tem is built up as follows:
1. Flange welded on upper l id of vesse l with meta l ring joint
2. Diaphragm
3. Flange with mounting poss ibi l i t ies for d iaphragm at lower side and b u r s t -
- 7 -
ing d isk at upper side
4. Lower bursting disk. Copper m e m b r a n e , th ickness 0. 5 m m
5. In te rmedia te flange between l ower - and upper burs t ing disk with gas in
le t to p r e s s u r i z e space between burs t ing disks
6. Upper burs t ing disk copper m e m b r a n e , th ickness 2 m m
7. Endflange.
All flanges having 200 m m d i ame te r openings.
Any n o n - c o r r o s i v e gas can be used in the t e s t r ig . The t e s t s a r e done
h n i
25 k g / c m
with n i t rogen or hel ium at room t e m p e r a t u r e with an ini t ia l p r e s s u r e of 2
During p r e s s u r i z a t i o n of the ve s se l , the p r e s s u r e between the two burs t ing
disks i s main ta ined at the s ame value as the v e s s e l p r e s s u r e . To bur s t the
disks and thus open the outlet , the p r e s s u r e in the space is suddenly r a i s ed
to a value between 40 and 60 a t m . That makes the upper disk bu r s t followed
immedia te ly by the lower disk.
F o r m e a s u r i n g pu rpose s , some studs a r e mounted on the ve s se l .
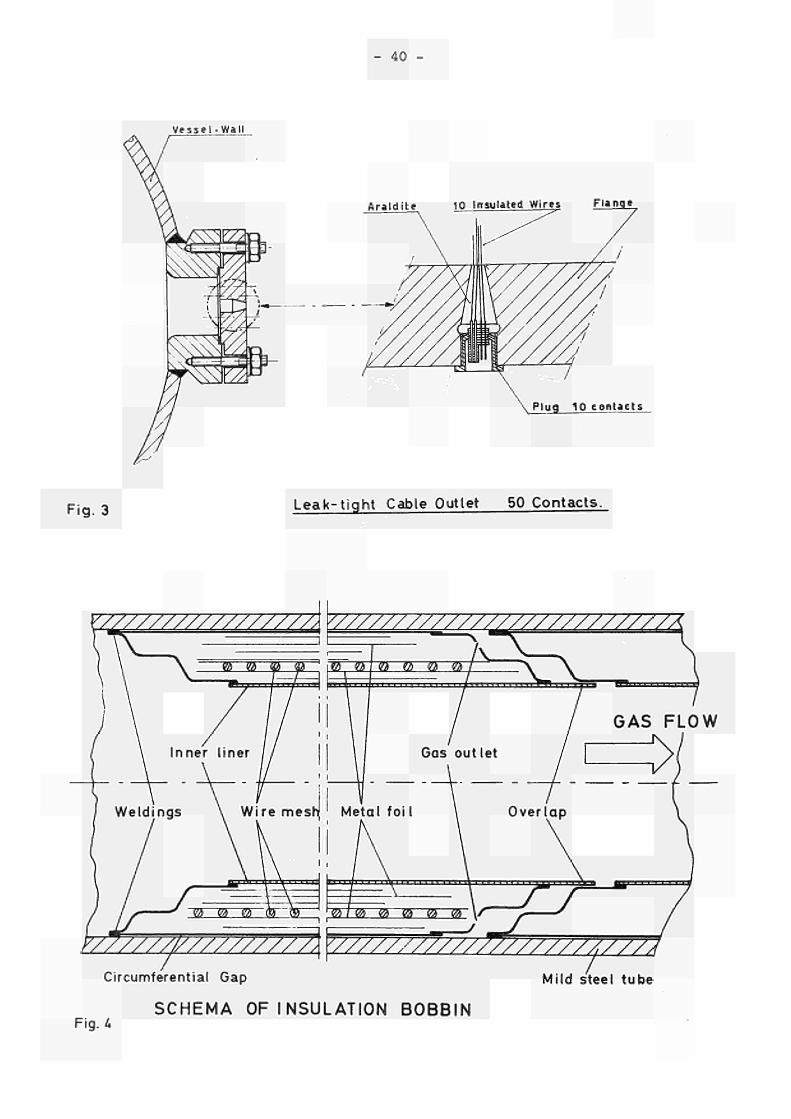
F u r t h e r m o r e , th ree holes a r e made in the v e s s e l wall to make a leak-
tight cable outlet for the ins t rumenta t ion of the t e s t piece (see F ig . 3).
3 . DESCRIPTION OF THE TEST BOBBINS
3 . 1 Genera l Descr ip t ion
The insulat ion to be t e s t ed (Fig . 4) was designed and fabr icated by the
DARCHEM Engineer ing L t d . , and i s a cyl indr ica l insulat ion for the p r i m a
ry ducts . In a mi ld s tee l tube two different insulat ion bobbins (length 60 5 m m ,
in te rna l d i ame te r 480 m m , outer d i ame te r 540 mm) were mounted. Each
bobbin is composed of 17 l a y e r s of s t a in less s tee l foil ( thickness 0. 1 mm) ,
s epa ra t ed from each o ther by a wire m e s h (square ce l ls of 2", wire d i ame
t e r 1. 2 m m ) . The l a y e r s a r e enclosed between an i n n e r - and an outer l ine r
of s t a in less s tee l ( thickness 1.6 m m ) . The only difference between the two
- 8 -
bobbins is in the design of the gas outlet .
Bobbin 4 is designed with two b rea the r holes of 6 m m d i ame te r opposite
each o ther . Bobbin 3 is completely open at the end except ten 1" wide m e t a l
s t r ips for mechanica l st iffness. The ends of the bobbins a r e overlapping as
to abso rb t h e r m a l dilatat ion without i n c r e a s e of gas t igh tness .
The design is made in such a way that the geomet ry of these t e s t bobbins
is the same as the geometry of the r ea l bobbin would be in the hot s ta te un
der nominal t e m p e r a t u r e condit ions.
3 . 2 Modifications of Tes t Bobbins
As will be seen in chapter 8. 1, it was found that the g r e a t e s t p a r t of the
gas flow r e s i s t ance was concentra ted on the overlapping of bobbin 3 and in
the b r e a t h e r holes of bobbin 4. In o r d e r to reduce this r e s i s t a n c e , 4 holes
of d i ame te r 6 m m were made in the overlapping of bobbin 3 (holes at 90 of
each o ther , at 20 m m dis tance from the end of the overlap) ( tes t s e r i e s "B") ,
/ 2 After these t e s t s , in o r d e r to achieve in bobbin " 3 " a Δρ of 1 k g / c m at
a dep res su r i za t ion ra te with hel ium of 20 a t m / s e c , another modification
was m a d e . The 6 m m holes were closed and rep laced by 4 holes of d iamete r s
7 .4 , 6 .4 , 6 and 7.2 m m respect ive ly , made c lose toge ther in the over laps of
bobbins " 3 " and " 4 " ( tes t s e r i e s "C") .
A l a s t modification was c a r r i e d out after t es t " C 5 " . Ten holes of 7. 2 m m
d iamete r each were added to the 4 holes a l ready p re sen t in the over lap of
bobbin " 4 " and 14 additional holes of 7. 2 m m d iamete r were dr i l led at 180
in the same over lap . Because of these 28 ho les , a l l the gas flow r e s i s t ance
of bobbin " 4 " is concent ra ted in the b r e a t h e r holes and not in the over lap .
(See table 7 , t e s t s e r i e s "D") .
4. INSTRUMENTATION
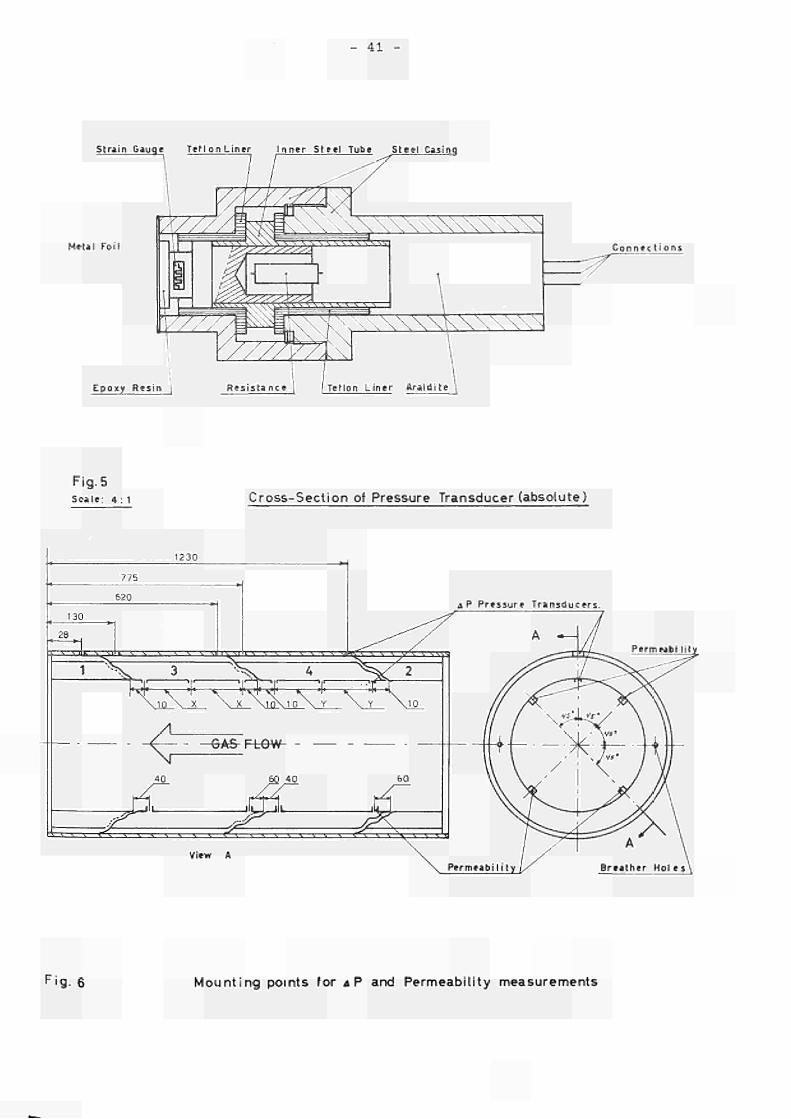
4. 1 P r e s s u r e Measurements
Absolute P r e s s u r e s . To m e a s u r e in the t e s t r ig the p r e s s u r e drop as a
- 9 -
function of t i m e , t h r ee absolute p r e s s u r e t r a n s d u c e r s a r e mounted in the
v e s s e l . (Fo r mounting posi t ion see F ig . 1). These t r a n s d u c e r s w h i c h w e r e
developed in our l abo ra to r i e s use a half br idge s t r a in gauge c i rcu i t with a
r e sponse t ime infer ior to 30 m i c r o s e c o n d s (Fig. 5). The t r a n s d u c e r s a r e
connected to a c a r r i e r frequency ampl i f ier (BRANDAU mult ichannel amp l i
f ier , c a r r i e r frequency 6 kHz, br idge supply voltage 3 - 7. 5 V) the output
of which is connected to an U. V. -ga lvanometer r e c o r d e r (S. E . L. u l t r a
violet l ight r e c o r d e r , type SE 3012 50 channels , pape r speed up to 3 m / s e c ,
t iming l ines each 0.01 sec ; ga lvanomete r s , type A 1000, na tu ra l frequency
1000 c / s e c , flat frequency response 600 C / s e c . ).
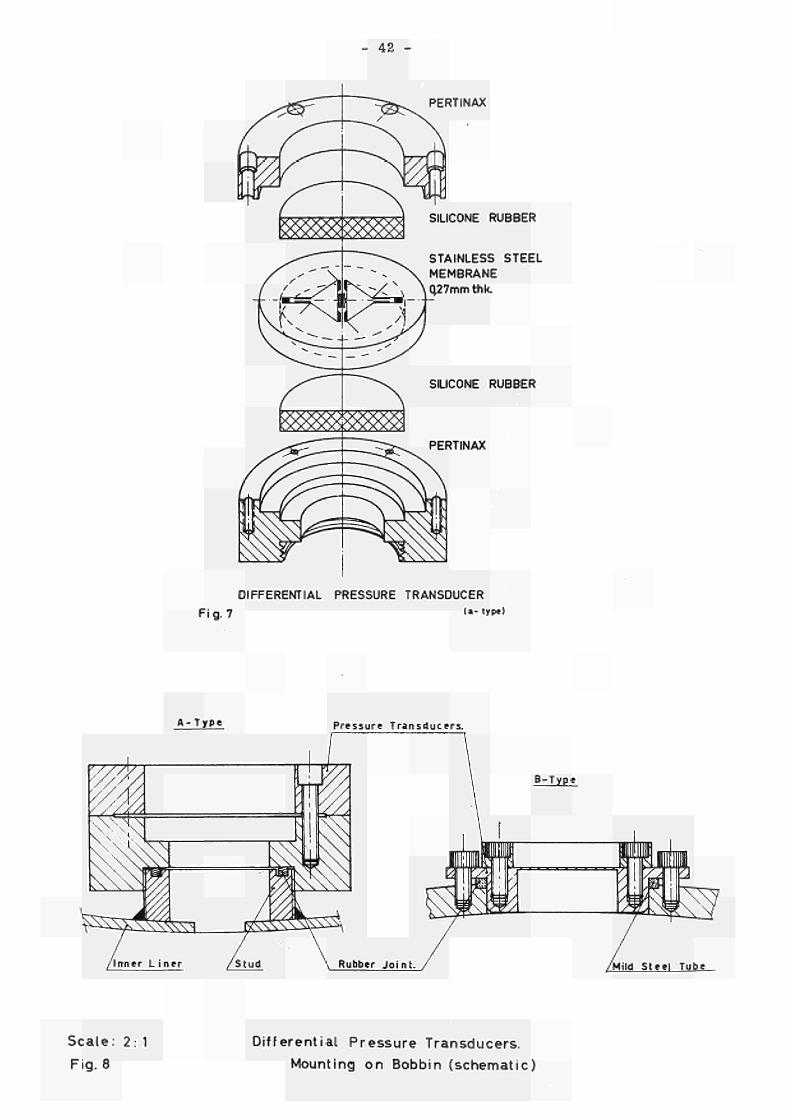
4. 2 Differential P r e s s u r e s
P r e s s u r e differences a r e m e a s u r e d :
a) between the inside of the t e s t bobbin and the p r e s s u r e vesse l
b) between the inside of p r e s s u r e ves se l and the c i rcumferen t i a l gap by
two different types of t r a n s d u c e r s .
F o r mounting posit ion see F ig . 6.
The technica l difficulties to ove rcome concerned mainly mounting space ,
10 m m for the (b) type t r a n s d u c e r , and the t e m p e r a t u r e effect during the
expansion of the gas .
The basic p a r t s of the (a) type t r a n s d u c e r s a r e :
- s ta in less s tee l m e m b r a n e
- full br idge s t r a in gauge c i rcu i t of 4 s t r a in gauges IMP 220 - p rec i s ion
2 x 2 m m
- pe r t inax housing
(See F ig . 7).
The m e m b r a n e with s t r a i n gauges is mounted in between the two p e r t i
nax p a r t s of the housing. The lower pa r t can be sc rewed on the studs wel
ded on the inner l ine r of the bobbins (Fig. 8).
12
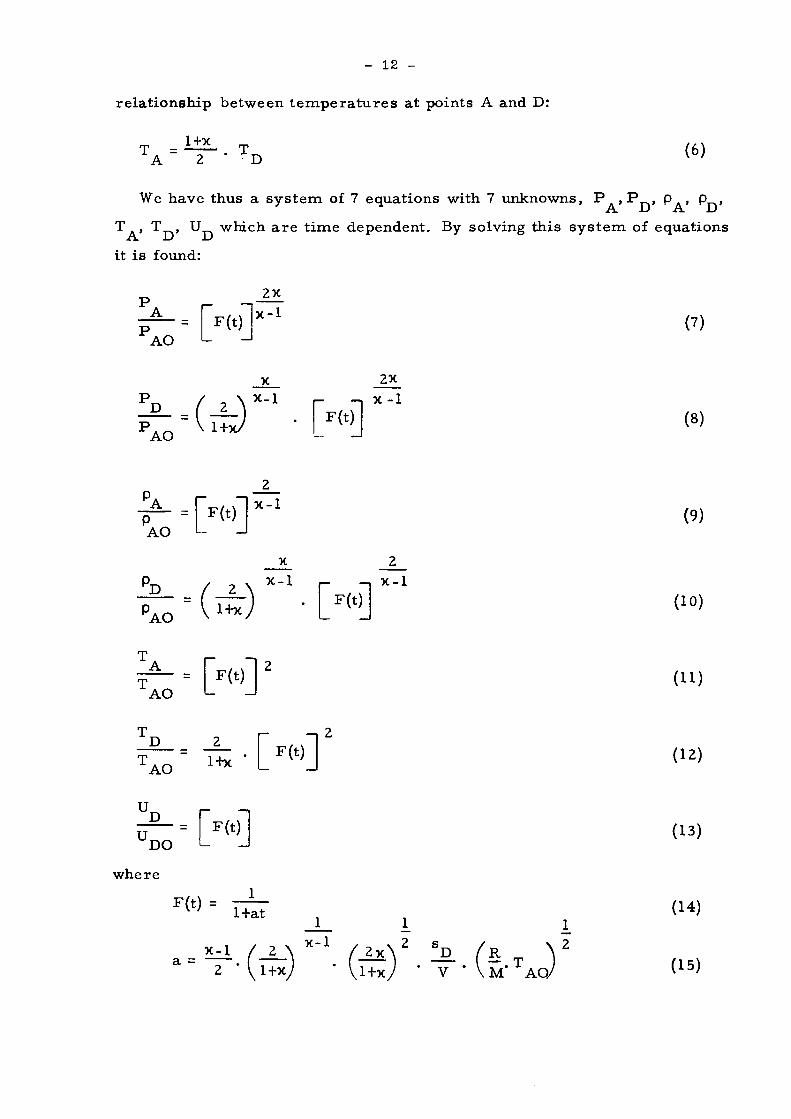
re la t ionship between t e m p e r a t u r e s at points A and D:
nn 1+κ rr,
Τ = τ A 2 · D
(6)
We have thus a sys tem of 7 equations with 7 unknowns, I 5 .»! 5^» ΡΔ> Ργν A. xJ Ä J—/
Τ , Τ , U which a r e t ime dependent. By solving this sy s t em of equations
it is found:
P A
Ρ Α θ "
F(t)
2κ
κ1
κ
? ■ < . 1+κ/
κ l
2κ
Γ ι Χ 1 F(t)
(7)
(8) AO
AO
F(t) ,]""1
(9)
D
AO
2Λ 1+κ/
κ
κ 1
F(t)J
2
, κ 1
(10)
AO - [>>] (11)
D
AO 1+κ
F(t) ] (12)
U_ D
U DO
where
F(t)] (13)
F ( t ) = -+at
κ 1 a = 1+κ
κ 1 2κ
1+κ
D V
S= τ M' AO
(14)
(15)
- 13 -
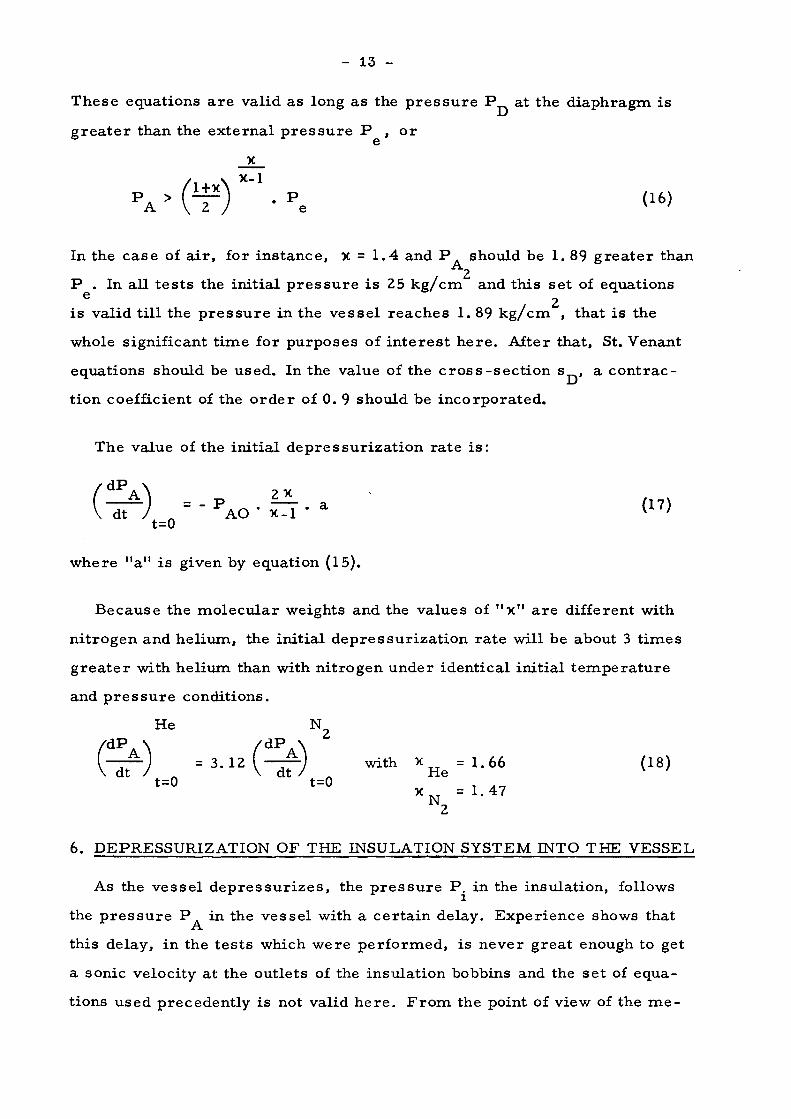
These equations a r e valid as long as the p r e s s u r e Ρ at the d iaphragm is
g r e a t e r than the ex te rna l p r e s s u r e Ρ , o r
P A '
_κ κ-ΐ
Ψ) · 'e In the case of a i r , for ins tance , κ = 1.4 and Ρ should be 1. 89 g r e a t e r than
2 Ρ . In al l t e s t s the ini t ia l p r e s s u r e is 25 k g / c m and this se t of equations
e / 2
i s valid t i l l the p r e s s u r e in the ves se l r eaches 1. 89 k g / c m , that i s the
whole significant t ime for purposes of i n t e r e s t h e r e . After that, St. Venant
equations should be used . In the value of the c r o s s - s e c t i o n s , a c o n t r a c
t ion coefficient of the o r d e r of 0. 9 should be incorpora ted .
The value of the ini t ia l dep re s su r i za t i on ra te i s :
d P m = -P
A O - f Ì T -a <
17>
t=0
where "a" i s given by equation (15).
Because the molecu la r weights and the values of " κ " a r e different with
n i t rogen and hel ium, the ini t ia l dep re s su r i za t i on ra te will be about 3 t imes
g r e a t e r with hel ium than with ni t rogen under ident ical ini t ia l t e m p e r a t u r e
and p r e s s u r e condit ions.
He N 2
&) = 3
-1 2
(-K> ** *He = 1
·6 6 <
18>
t = 0 t = 0 κ = 1 47 N 2
6. DEPRESSURIZATION OF THE INSULATION SYSTEM ΓΝΤΟ THE VESSEL
As the vesse l d e p r e s s u r i z e s , the p r e s s u r e P . in the insulat ion, follows
the p r e s s u r e Ρ in the vesse l with a ce r t a in delay. Exper ience shows that
this delay, in the t e s t s which were per fo rmed , is never g rea t enough to get
a sonic velocity at the outlets of the insulat ion bobbins and the se t of equa
tions used precedent ly is not valid h e r e . F r o m the point of view of the m e
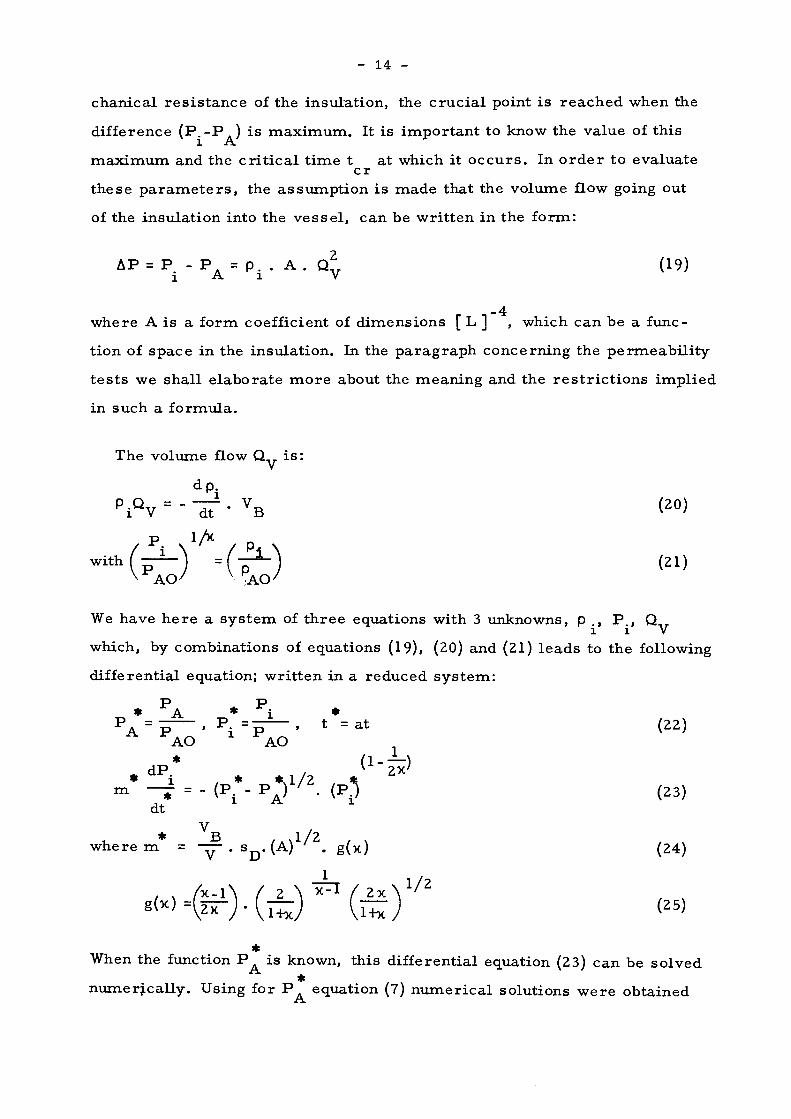
14
chanical resistance of the insulation, the crucial point is reached when the
difference (P.P ) is maximum. It is important to know the value of this
maximum and the critical time t at which it occurs. In order to evaluate
cr
these parameters, the assumption is made that the volume flow going out
of the insulation into the vessel, can be written in the form:
ΔΡ = Ρ - ΡΛ = p. . A . oA (19) i Α ι V
_4
where A is a form coefficient of dimensions [L ] , which can be a func
tion of space in the insulation. In the paragraph concerning the permeability
tests we shall elaborate more about the meaning and the restrictions implied
in such a formula.
The volume flow Q is:
Pi
QV = - "dT '
VB (
2°)
p · \ l A / P« \
AO' 7AO' with ( p — J = {j*~ (21)
ΔΓ)/ X Κ
ΔΓ>/
We have here a system of three equations with 3 unknowns, ρ , Ρ , Q i i V
which, by combinations of equations (19), (20) and (21) leads to the following
differential equation; written in a reduced system:
Ρ Ρ
* A * i * P A = P — ' P i=P~~ * * = a t (22)
AO AO dP , v 2 * '
m -è - - Pi ■ ^f ■ rf P3)
dt ν
♦ R 1 /"? where m = — . s . (A) g(x) (24) V ' D"
1 1/2
*
When the function Ρ is known, this differential equation (23) can be solved
numerically. Using for Ρ equation (7) numerical solutions were obtained
- 15 -
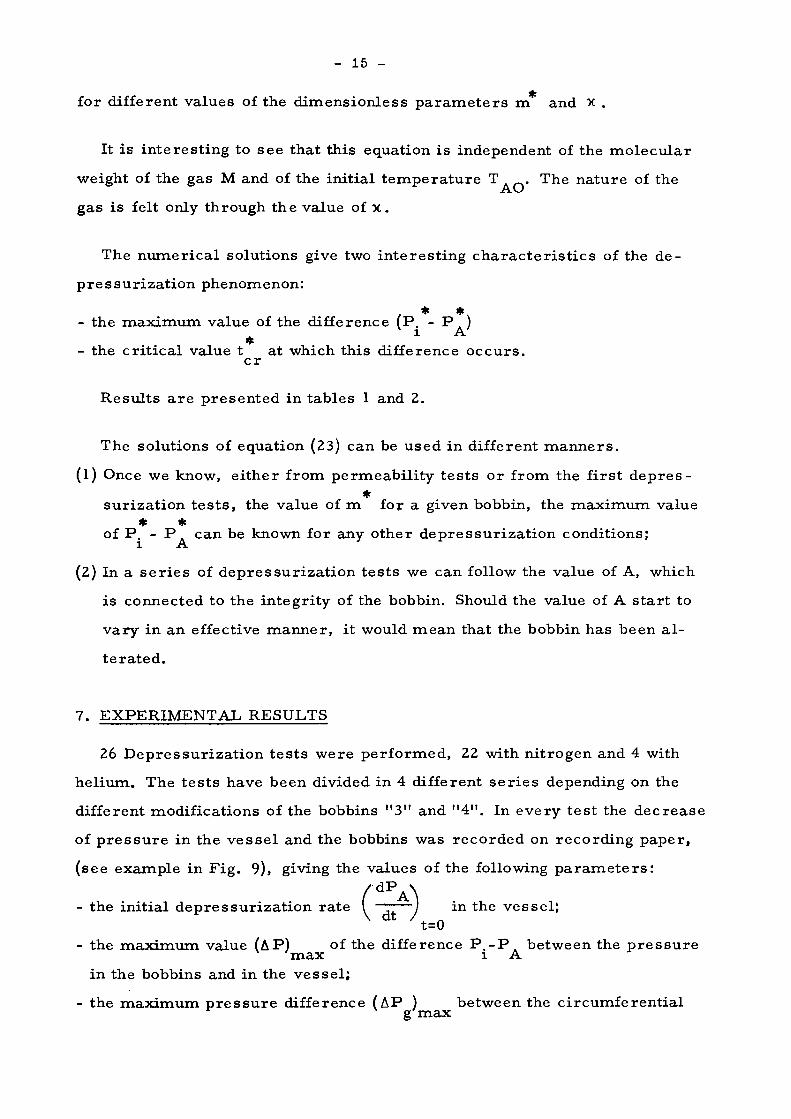
for different values of the d imensionles s p a r a m e t e r s m and κ .
It is in te res t ing to see that this equation is independent of the mo lecu la r
weight of the gas M and of the ini t ia l t e m p e r a t u r e Τ . The na ture of the
gas is felt only through the value of κ .
The numer i ca l solutions give two in te res t ing c h a r a c t e r i s t i c s of the de
p r e s s u r i z a t i o n phenomenon:
* *v - the m a x i m u m value of the difference (P . - Ρ , ) x ι A' * - the c r i t i ca l value t at which this difference o c c u r s .
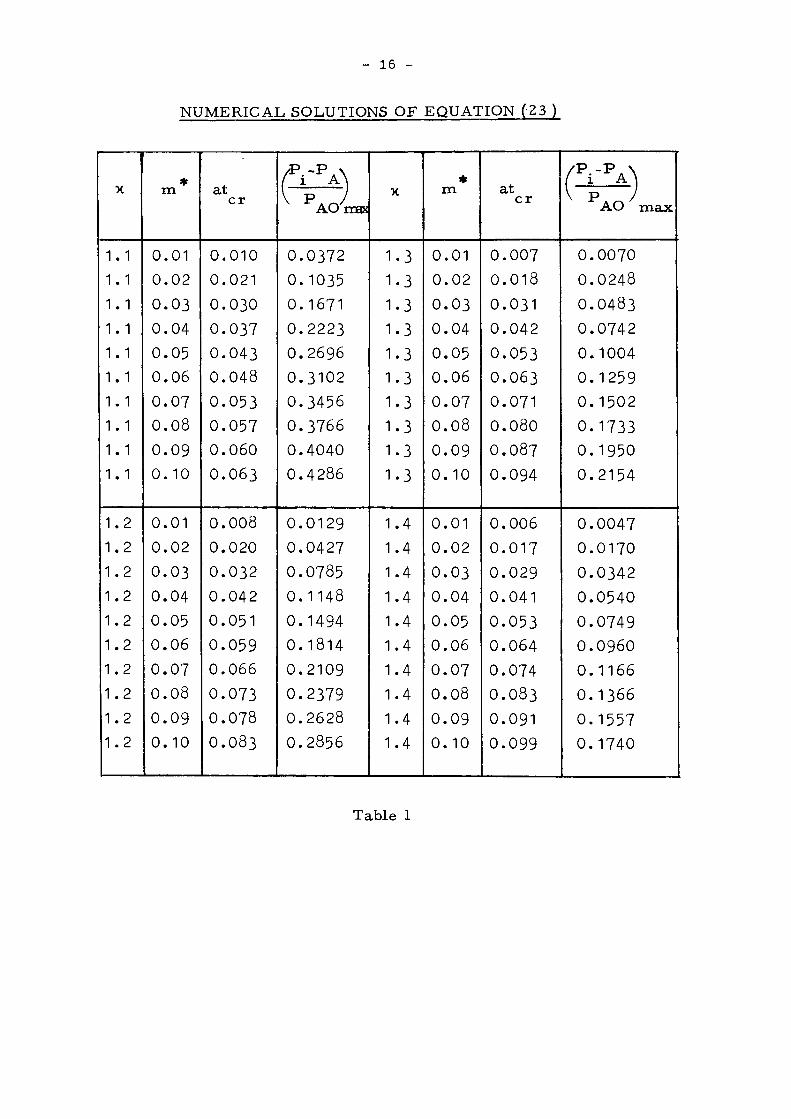
c r Resu l t s a r e p resen ted in tables 1 and 2.
The solutions of equation (23) can be used in different m a n n e r s .
(1) Once we know, e i ther from permeabi l i ty t e s t s or from the f i rs t d e p r e s se
sur iza t ion t e s t s , the value of m for a given bobbin, the max imum value
of P . - P . can be known for any other dep re s su r i za t i on conditions;
ι A '
(2) In a s e r i e s of dep re s su r i za t i on t e s t s we can follow the value of A, which
is connected to the in tegr i ty of the bobbin. Should the value of A s t a r t to
vary in an effective manne r , it would mean that the bobbin has been a l -
t e r a t ed .
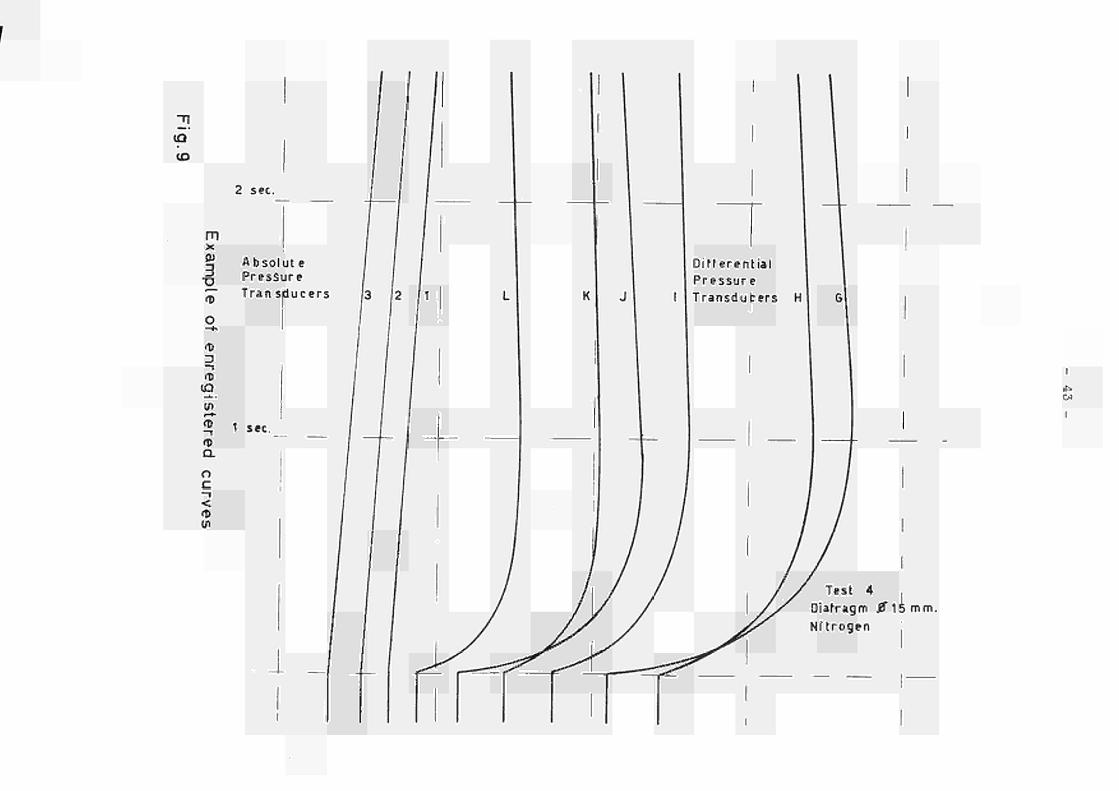
7. EXPERIMENTAL RESULTS
26 Depres su r i za t ion t e s t s were per fo rmed , 22 with ni t rogen and 4 with
he l ium. The t e s t s have been divided in 4 different s e r i e s depending on the
different modificat ions of the bobbins " 3 " and " 4 " . In every t e s t the dec rea se
of p r e s s u r e in the v e s s e l and the bobbins was r eco rded on record ing paper ,
(see example in F ig . 9), giving the values of the following p a r a m e t e r s : dP
the ini t ia l dep re s su r i za t i on ra te I ~~—J in the vesse l ; V 7 t = 0
the m a x i m u m value (AP) of the difference P . - P . between the p r e s s u r e x ' m a x ι A
in the bobbins and in the ves se l ; the max imum p r e s s u r e difference (ΔΡ ) between the c i rcumferen t ia l
g max
16
NUMERICAL SOLUTIONS OF EQUATION (23 )
κ
1.1 1.1 1.1 1.1 1.1 1.1 1.1 1.1 1.1 1.1
1.2 1.2 1.2 1.2 1.2 1.2 1.2 1.2 1.2 1.2
m
0.01 0.02 0.03 0.04 0.05 0.06 0.07 0.08 0.09 0.10
0.01 0.02 0.03 0.04 0.05 0.06 0.07 0.08 0.09 0.10
at cr
0.010 0.021 0.030 0.037 0.043 0.048 0.053 0.057 0.060 0.063
0.008 0.020 0.032 0.042 0.051 0.059 0.066 0.073 0.078 O.O83
/ Ρ · - Ρ Λ \
( -AOL AO max
O.O372 0.1035 0.1671 O.2223 0.2696 O.3IO2 0.3456 0.3766 0.4040 0.4286
0.0129 O.O427 O.O785 0.1148 0.1494 O.I814 0.2109 0.2379 0.2628 O.2856
κ
1.3 1-3 1.3 1.3 1.3 1.3 1.3 1.3 1.3 1.3
1.4 1.4 1.4 1.4 1.4 1.4 1.4 1.4 1.4 1.4
m
0.01 0.02 0.03 0.04 0.05 0.06 0.07 0.08 0.09 0.10
0.01 0.02 0.03 0.04 0.05 0.06 0.07 0.08 0.09 0.10
at cr
0.007 0.018 0.031 0.042 0.053 0.063 0.071 O.O8O O.O87 0.094
0.006 0.017 0.029 0.041 0.053 0.064 0.074 O.O83 0.091 0.099
('O AO max
0.0070 O.O248 O.O483 0.0742 0.1004 0.1259 0.1502 0.1733 0.1950 0.2154
0.0047 0.0170 O.O342 0.0540 0.0749 0.0960 0.1166 O.I366 0.1557 0.1740
Table 1
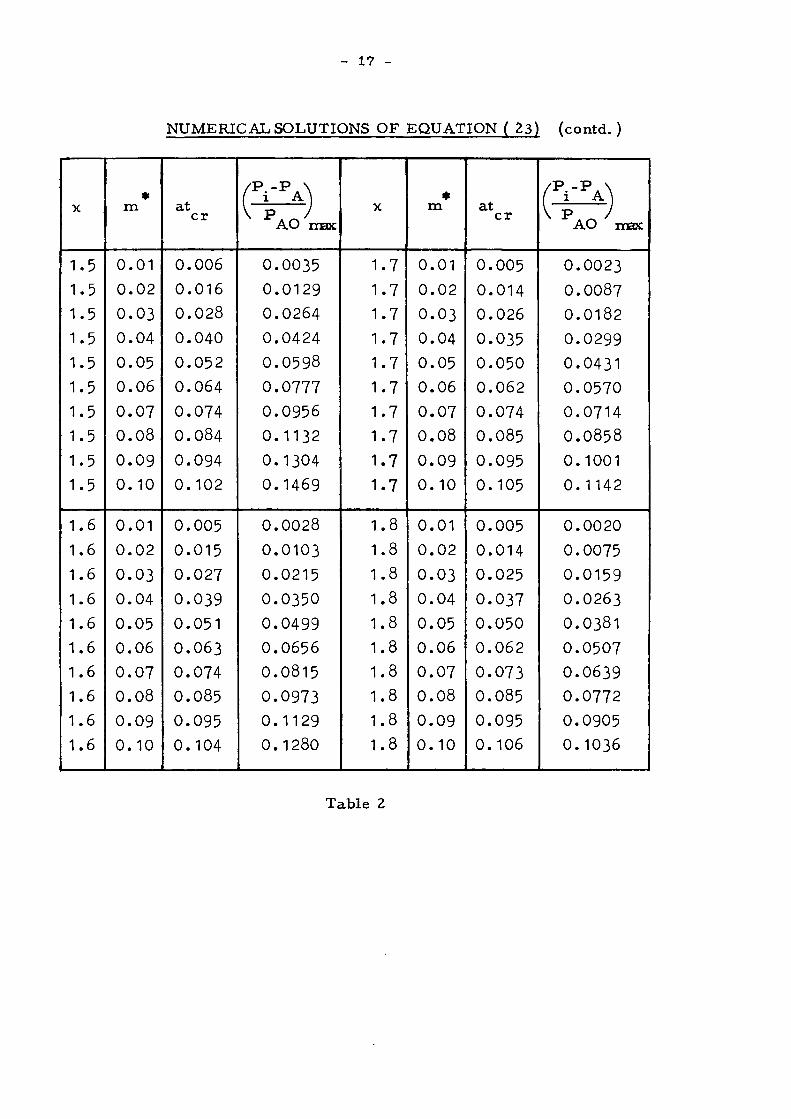
17 -
NUMERICAL SOLUTIONS OF EQUATION ( 23) (contd. )
κ
1.5 1.5 1.5 1.5 1.5 1.5 1.5 1.5 1.5 1.5
1.6 1.6 1.6 1.6 1.6 1.6 1.6 1.6 1.6 1.6
* m
0.01 0.02 0.03 0.04 0.05 0.06 0.07 0.08 0.09 0.10
0.01 0.02 0.03 0.04 0.05 0.06 0.07 0.08 0.09 0.10
at cr
0.006 0.016 0.028 0.040 0.052 0.064 0.074 0.084 0.094 0.102
0.005 0.015 0.027 0.039 0.051 0.063 0.074 0.085 0.095 0.104
(VoA)
AO max 0.0035 0.0129 0.0264 0.0424 0.0598 0.0777 0.0956 0.1132 0.1304 0.1469
0.0028 0.0103 0.0215 0.0350 0.0499 0.0656 0.0815 0.0973 0.1129 0.1280
κ
1.7 1.7 1.7 1.7 1.7 1.7 1.7 1.7 1.7 1.7
1.8 1.8 1.8 1.8 1.8 1.8 1.8 1.8 1.8 1.8
* m
0.01 0.02 0.03 0.04 0.05 0.06 0.07 0.08 0.09 0.10
0.01 0.02 0.03 0.04 0.05 0.06 0.07 0.08 0.09 0.10
at cr
0.005 0.014 0.026 0.035 0.050 0.062 0.074 0.085 0.095 0.105
0.005 0.014 0.025 0.037 0.050 0.062 0.073 0.085 0.095 0.106
('O AO max 0.0023 0.0087 0.0182 0.0299 0.0431 0.0570 0.0714 0.0858 0.1001 0.1142
0.0020 0.0075 0.0159 0.0263 O.O38I 0.0507 0.0639 0.0772 O.O905 O.IO36
Table 2
18
gap and the outside of the bobbins F ig . 4;
the c r i t i ca l t imes t and t at which these max ima occur ; c r Scr
the approximate max imum t empe ra tu r e drop Δ T of the gas in the p res
sure ves se l .
The exper imenta l r e su l t s a r e p resen ted in tables 3 and 4.
EXPERIMENTAL RESULTS
Tes t
No.
A1
A2
A3
A4
A5
A6
A7
A8
A9
A10
A11
A12
Gas
NP
N?
N ?
N ?
N ?
N?
N ?
N ?
N ?
N?
N ?
He
Diaph.
0 mm
5 .6
12 .5
137
15
16 .5
1 8 . 3
19 .1
20 .1
2 1 . 1
2 2 . 5
236
19 .1
V d t yt=o
0 . 5 4
1.23
1.65
1.85
2 .00
2 . 3 8
2 . 7 3
3 .17
3.3O
3 .70
3 .85
7 . 8 0
BOBBIN " 3 "
(ΔΡ) m a x
k g / c m 2
0 . 0 2 2
0 . 1 5 7
0 . 2 0 2
0 . 2 4 7
0 .261
0 . 4 5 2
0 . 4 7 2
O.532
0 . 6 0 4
O.728
0 . 8 6 5
0 . 9 4 0
t c r
sec
0 . 9
0 . 9
1.3
1.1
1.1
1.3
1.3
1.2
1.3
1.3
1.3
0 . 6
BOBBI1N
(ΔΡ) m a x
k g / c m
0 .011
0 . 1 0 0
O.I3O
0 . 1 7 4
0 . 1 8 8
O.33O
0 . 3 7 9
O.43O
0 . 5 1 1
0 . 6 3 7
0 . 8 0 5
1.100
Í " 4 "
t cr
sec
0 . 9
0 . 9
1.0
1.0
0 . 9
1.0
1.1
0 . 9
1.2
1.1
1.3
0 . 7
Table 3
In the s e r i e s of t e s t s "A", the values of (ΔΡ ) and t were not r e g m a x gc r
corded. F r o m the r eco rded cu rves , i t was difficult to de te rmine with a great
p rec i s ion the exact values of the c r i t i ca l t i m e s ; so, for the t e s t s e r i e s " B " ,
" C " and "D" in terva ls a r e given.
- 19
EXPERIMENTAL RESULTS
Test No.
B-1 B-2 B-3 B-4 B-5 C-1 C-2 C-3 C-4 C-5 D-1 D-2 Ώ-3 D-4
Gas
N? N? H2 N2 N2 N2 He N2 N? H e N? n2 N? He
'S 35 50 53 67 -50 65 64 67 30 70 74 74 74
Diaph. 0 mm
11 16.5 19.5 24.2 26.2 16.5 13.0 24.0 26.2 26.2 29.0 31.5 34.0 30.0
Vdt /t=o atm/sec 1.0 2.0 2.9 4.4 5.0 2.4 7.0 4.4 5.0 16.1 7.2 3.3 8.5 19.2
BOBBIN "3"
(ΔΡ) v ' max kg/cm2 0.015 0.075 0.160 0.305 0.370 0.090 0.235 0.325 0.410 0.850 0.425 0.570 0.730 0.860
t cr sec 0.90
0.60-0.90 0.50-0.70 0.65-0.75 0.60-0.30 0.70-0.90 0.18-0.24 0.65-0.75 0.61-0.71
0.23 0.50-0.68 0.57-0.67 0.57-0.66 0.20-0.26
;ΔΡ ) g ' max
k g/c m 2 0.025 0.075 0.140 0.375 0.330 0.095 0.245 0.320 0.445 0.885 0.410 0.575 0.700 0.845
ι
t, g cr sec 0.1 0.5 0.5
0.65-0.75 0.60-0.80 0.50-0.80 0.13-0.24 0.65-0.75 0.55-0.75
0.23 0.50-0.68 0.52-0.62 0.57-0.66
0.23
(ΔΡ) ' max
kg/cm2 0.065 0.225 0.395 1.165 1.365 0.205 0.590 0.800 1.350 1.630* 0.640 1.210 1.530 1.800*
BOBBIN
t cr sec
0.9 0.90-1.45 0.90-1.10 1.55-1.65 1.50-1.80 0.90-1.10 0.37-0.54 1.15-1.25 1.50-1.85
0.23 0.90-1.10 1.35-1.65 1.22-1.44
0.39
"4"
(ΔΡ ) v g'max kg/cm2 0.015 0.040 0.075 0.160 0. 170 0.030 0.095 0.095 0. 130 0.115 0.050 0.060 0.060 0.085
t g cr sec 0.1 0.5 0.5 1.55 1.50
0.90-1.00 O.37-O.54 1.15-1.25
1.60 0.23
0.90-1.10 -
1.22-1.44 O.335
- Buckling. For more information, see table 5.
Table 4
20 -
. ' d P A 7. 1 Init ial Depressu r i za t ion Rates
d t t = 0 / d P A In F ig . 10 the ini t ial dep res su r i za t ion ra te \~7~~J 1 S plotted v e r s u s
t=0 the d i ame te r square of the d iaphragm (proport ional to the c ros s sec t ion a r e a
of the d iaphragm in which a contract ion coefficient of 0. 9 has been accoun
ted for) . As was said before , i t can be noted that for the s a m e d iaphragm
with the same ini t ial s tat ic p r e s s u r e , the dep re s su r i za t i on ra te is g r e a t e r
with hel ium than with ni t rogen. In this F ig . 10 the exper imenta l data is com
pared with the calculated c u r v e s . The ag reemen t between theory and expe
r ience is quite sa t i s fac tory . The exper imenta l values of y__£±J a r e ob
tained by graphical methods from the r eco rded absolute p r e s s u r e cu rves
with a p rec i s ion of the o r d e r of 5%.
7. 2 Maximum P r e s s u r e Differences
Between the different s e r i e s of t e s t s "A", " B " , " C " and "D" modif ica
tions were pe r fo rmed on the bobbins which a r e desc r ibed in chapter 3 . 2 .
In F ig . 11 and Fig . 12 the max imum p r e s s u r e difference (ΔΡ) is m a x
plotted ve r sus the ini t ial depressu r i za t ion ra te for each s e r i e s of t e s t s .
The f i rs t s e r i e s of t e s t s MA" showed that the two t e s t ed bobbins would
not satisfy the ini t ia l r equ i rement of a value of the ( ¿ P ) infer ior to
? m a x 1 k g / c m with hel ium under an init ial dep res su r i za t ion ra te of 20 a t m / s e c .
In these t e s t s , with a depressur i za t ion ra te of 7. 8 a t m / s e c , (ΔΡ) of 2 ? m a x
0. 94 k g / c m and 1. 1 k g / c m were r ecorded for bobbins " 3 " and " 4 " .
In t e s t s s e r i e s " B " it can be noted that the modifications pe r fo rmed
after the "A" t es t s were successful in reducing the values of (Δ P) in
m a x
bobbin " 3 " . Bobbin " 4 " had not been a l t e red . It can be noted that for bob
bin " 3 " the values of (ΔΡ) and (ΔΡ ) a r e about the s a m e , because
the grid sys tem int roduces l i t t le additional r e s i s t a n c e . F o r bobbin " 4 " the
values of (ΔΡ) a r e much higher than the values of ( ¿ P ) because max g 'max
the b r ea the r holes int roduce an impor tant additional r e s i s t a n c e .
- 21 -
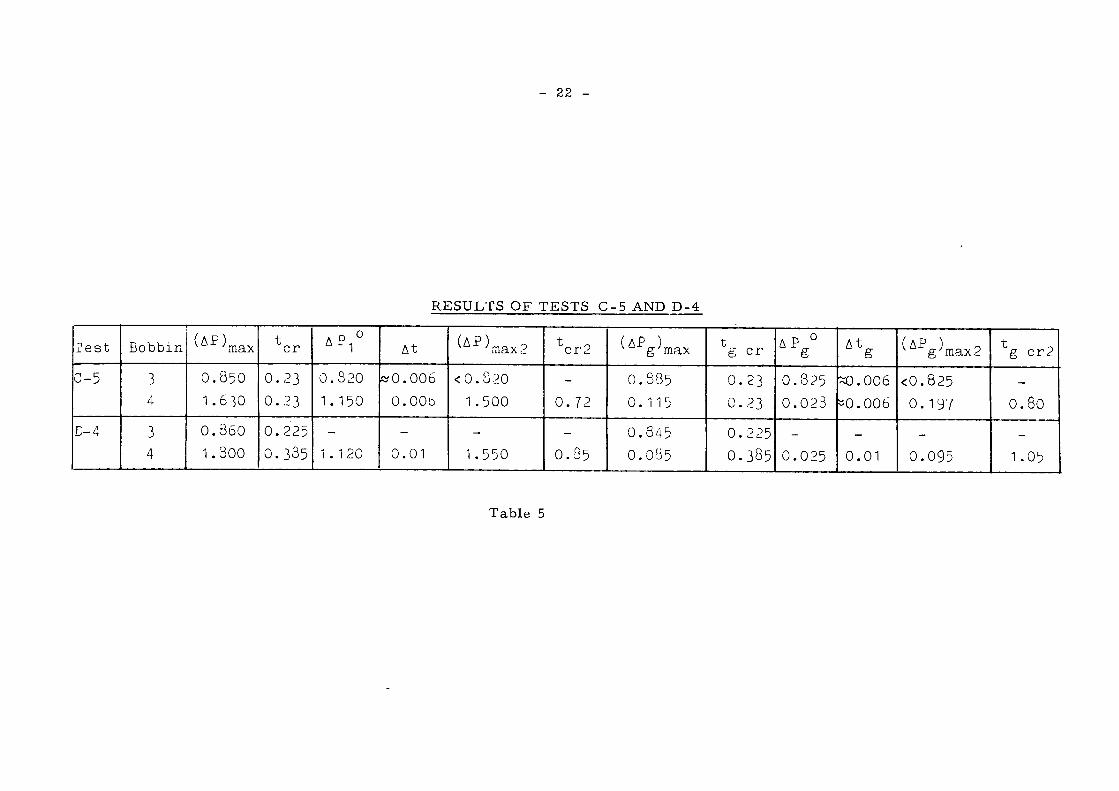
The t e s t s e r i e s " C " show that modifications per formed after the " B " t e s t s
had not changed r e su l t s concerning bobbin " 3 " but had reduced slightly, the
values of ( ΔΡ) for bobbin "4" , but not sufficiently to avoid a severe buck-m a x
ling damage in this bobbin, (with a dep re s su r i za t i on ra te of 16. 1 a t m / s e c . t h e value of the (ΔΡ) was 1.63 k g / c m , t es t No. C-5). The shape of
max
the r e g i s t e r e d curve of this l a s t t e s t confirmed that the buckling had effec
tively taken place at this point; F ig . 13 and F ig . 14. In F ig . 13 it can be seen
that at c r i t i ca l t ime t the ΔΡ diminishes suddenly, because of the i nc r ea se c r
of volume after buckling. In Table 5 the values a r e p resen ted of the different p a r a m e t e r s involved in this phenomenon. At t imes t and t the curves
c r g c r
of s t r a in gauge m e a s u r e m e n t s showed a ve ry s teep peak due to an impor tan t
i nc r ea se of s t r a in . The dimensions of the lump formed after buckling were :
length about 58 cm, width about 22 cm, height about 2. 5 cm (see metro logy) .
The buckling happened along the axial weld of the inner l ine r .
Between t e s t s " C " and "D" , bobbin " 3 " was not modified. The changes in
the exper imenta l r e su l t s for this bobbin were due to the influence of the buck
ling of bobbin " 4 " . F o r bobbin " 4 " the changes in the exper imenta l r esu l t s
when pass ing from t e s t s " C " to t e s t s " D " a r e due par t ly to buckling and p a r t
ly to the modifications pe r fo rmed on this bobbin after the " C " t e s t s . In t es t
D-4 the bobbin " 4 " suffered buckling damage again, of the same type as in
t es t C - 5 . After dismounting, two o ther lumps were noted in bobbin " 4 " (di
mensions 60x27 cm).
In F ig . 15 a compar i son is made between exper imenta l r e s u l t s , p r e s e n
ted in a reduced sys t em, and theore t ica l curves obtained from the m a t h e m a
t ica l model p re sen ted in Chapter 6. It can be noted that the exper imenta l
values of (ΔΡ) a r e sl ightly infer ior to the calculated values of (Δ P) m a x max
(One should not forget the exper imenta l imprec i s ion in the de terminat ion of / d P A \ ( J and t , and the approximat ions in the ma themat i ca l model) . V d t / t =0 c r
22
RESULTS OF TESTS C-5 AND D-4
P e s t
C-5
D-4
Bobb in
3 4
3 4
(ΔΡ) N ' max 0 . 8 5 0 1.630
0 . 3 6 0 1.300
t c r
0 . 2 3 O.23
0 . 2 2 5 O.335
Δ Ρ 1 °
0 . 8 2 0 1. 150
1. 120
Δι
« 0 . 0 0 6 0 . 0 0 b
0 . 0 1
( A P ) m a x 2
<O.82O 1.500
1.550
* c r 2
0 . 7 2
O.85
(AVmax 0 . 3 8 5 0 . 1 1 5
O.845 0 . 0 8 5
t g c r
0 . 2 3 O.23
0 . 2 2 5 O.385
4 V O.825 0 . 0 2 3
0 . 0 2 5
At g
ί θ . 0 0 6 " 0 . 0 0 6
0 . 0 1
(AVmax2 < 0 . 8 2 5
0 . 1 9 7
0 . 0 9 5
g c r 2
O.SO
1.05
Table 5
23
8. CONTROL TESTS
In o r d e r to evaluate eventual damage to the s t ruc tu ra l in tegr i ty of the
bobbins, 4 kinds of t e s t s a r e pe r fo rmed:
pe rmeabi l i ty t e s t s ,
X r a y t e s t s ,
met ro logy ,
leakt ightness of welds .
8. 1 Pe rmeab i l i t y Tes t s (Gasflow Res i s t ance Tes t s )
Pe rmeab i l i t y t e s t s pe r fo rmed before and after dep res su r i za t ion t e s t s
give impor tan t indicat ions of a l t e ra t ion in the integr i ty of the bobbins and
can be used to evaluate the (ΔΡ) at different dep re s su r i za t i on r a t e s .
m a x
We define h e r e the pe rmeab i l i ty in a r a t h e r l a rge sense as the r e s i s t ance
to a fluid flow between two points in the bobbin. In s teady s ta te conditions,
the ΔΡ agains t volume flow can be wr i t ten in the following form:
Δ Ρ Λ , B l — = Ρ Α 1 + μ Q v
v
The f i r s t t e r m accounts for p r e s s u r e drop due to the loss of dynamic p r e s
sure and turbulent flow. The second t e r m accounts for l a m i n a r friction.
A has the dimension ¡_^ J !
Β has the dimension [ L J .
If we plot AP/Q v e r s u s l / Q we should obtain a s t ra igh t line from which
A and Β could eas i ly be deducted.
So if after a s e r i e s of dep re s su r i za t i on t e s t s , the bobbin has suffered
in ternal ly , one can expect modificat ions in the values of the coefficients
A and Β .
Tes t s were c a r r i e d out at ambient t e m p e r a t u r e with ni t rogen. The p r e s
sure drop was m e a s u r e d by an inclined wate r m a n o m e t e r and the volume
flow was m e a s u r e d by a r o t a m e t e r f lowmeter . F o r the in and outlet of the
- 24 -
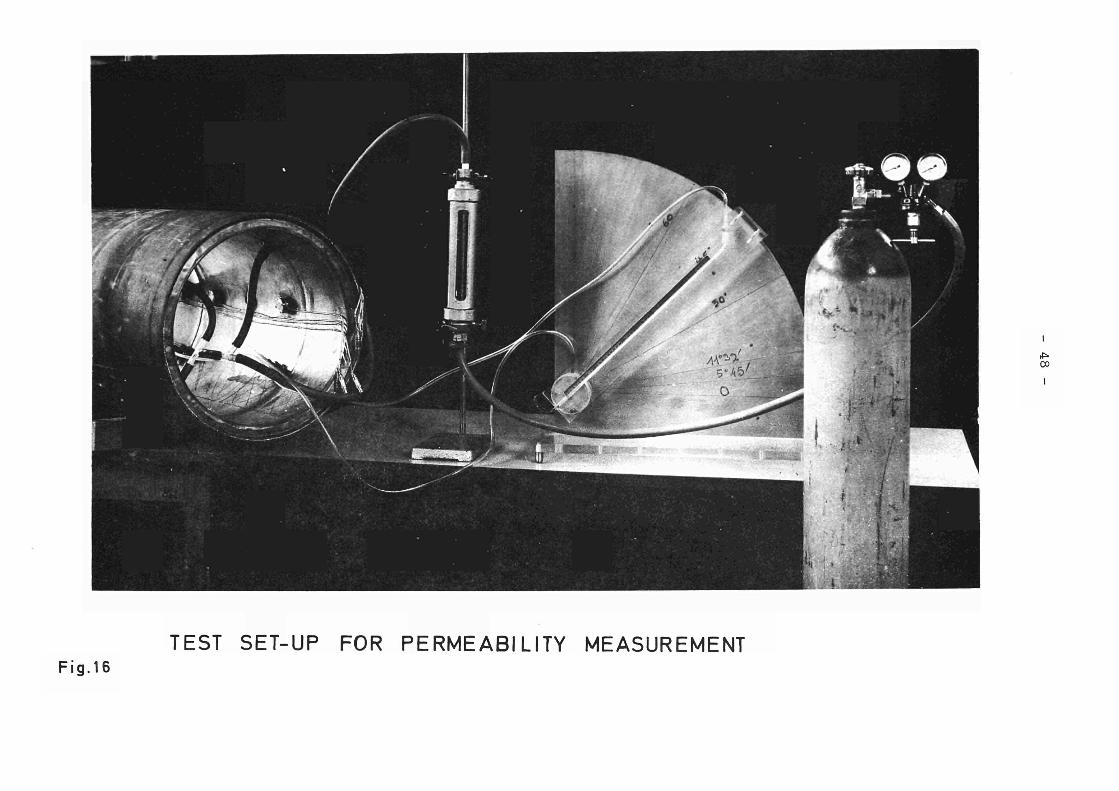
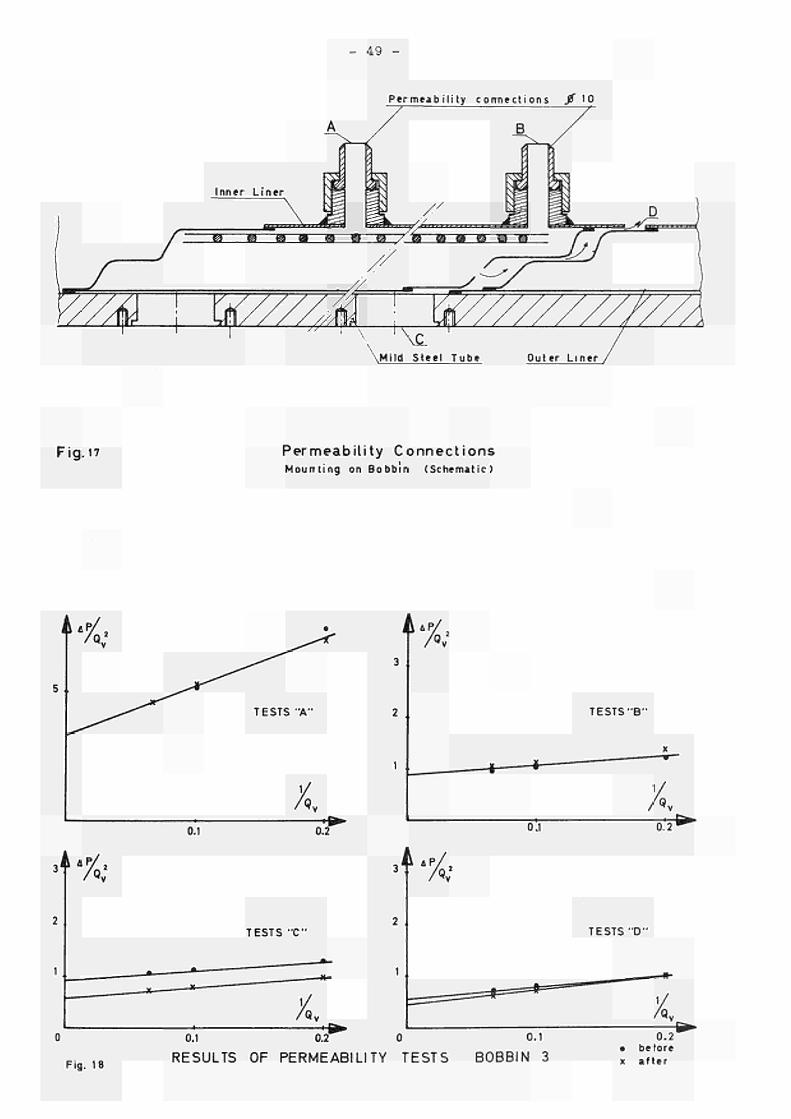
gas , eight bolts were welded on the inner l ine r . F o r t e s t s e t -up see F ig . 16;
for permeabi l i ty connections see F ig . 17; for mounting posi t ion see F ig . 6
When the m e a s u r e m e n t is made on one bobbin, all the openings in the
other one (such as overlapping, modification holes , pe rmeab i l i ty connec
tions and t r ansduce r holes) a r e c losed.
Five different types of permeabi l i ty m e a s u r e m e n t s a r e made with n i t r o
gen before and after each modification or t e s t s s e r i e s :
1) The gas is injected through th ree connections at the front of the bobbin.
(A; see F ig . 17) and leaves the bobbin through th ree connections at the
end (B; see F ig . 17). The p r e s s u r e drop is m e a s u r e d between the fourth
front connection and the a tmosphe re . All other openings a r e c losed. See
tables 6 and 7, Scheme 1).
2) Same as for 1). P r e s s u r e drop is m e a s u r e d between fourth front and
fourth end connections (see Scheme 2).
3) Gas injection through 3 front connect ions. Gas outlet through hole in mi ld
s tee l tube (C; see F ig . 17). P r e s s u r e drop is m e a s u r e d between fourth
front connection and other hole in mi ld s tee l tube. All other openings a r e
closed (see Scheme 3).
4) Gas injection through 3 front connect ions. Gas outlet through over lap
(D; see F ig . 17). P r e s s u r e drop is m e a s u r e d between fourth front con
nection and a tmosphe re . Modification holes and al l o ther openings a r e
closed (see Scheme 4).
5) Same as for 4). Modification holes in over lap a r e opened (see Scheme 5).
The resu l t s a r e shown in tables 6 and 7 and r ep re sen t ed in F ig . 17 and
Fig . 18.
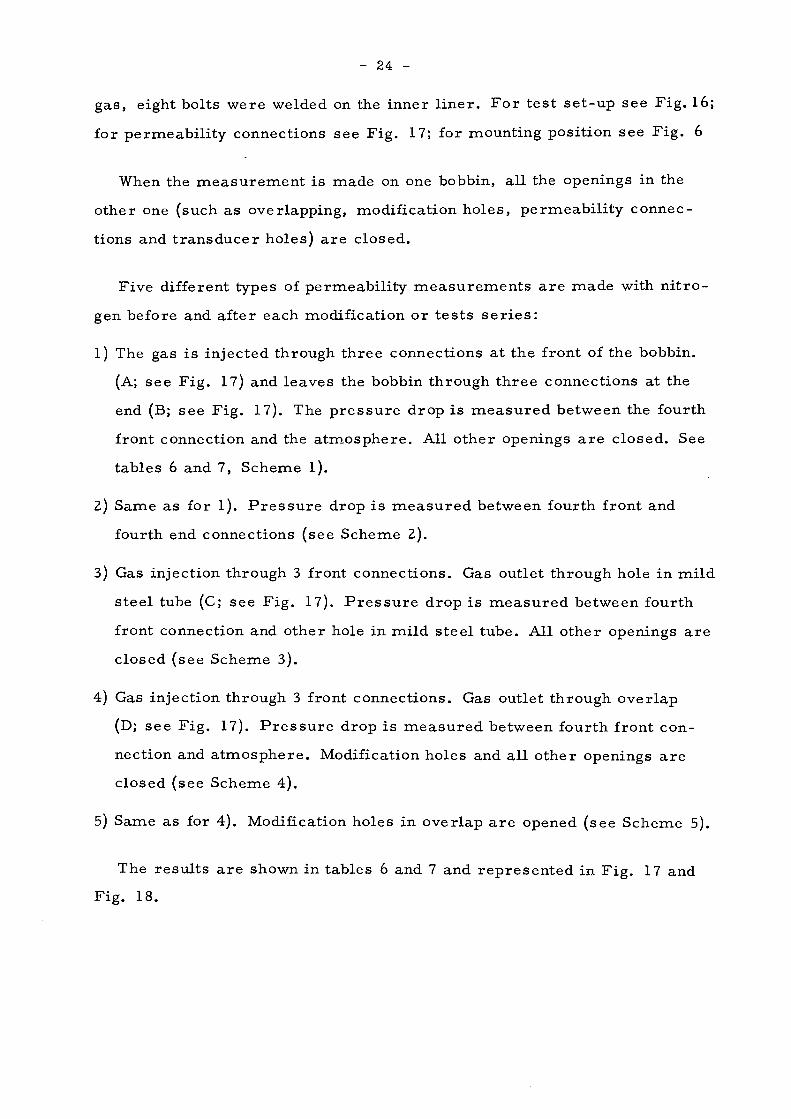
RESULTS OF PERMEABILITY TEST BOBBIN " 3 "
Test No. 1a 1b 1c 1d 1e 1f 1g 2a 2b 2c 2d 2e 2f 2g 3a 3b 3c 3d 3e 3f 3g 4a 4b 4c 4d 4e 4f 4g
5c 5d 5e 5f 5g
Chronology
before A series after A series before Β series after Β series before C series after C series after D series before A series after A series before Β series after Β series before C series after C series after D series before A series after A series before Β series after Β series before C series after C series after D series before A series after A series before Β series after Β series before C series after C series after D series
before Β series after Β series before C series after C series after D series
Δ Ρ for Q m V b 5
186 174 174 170 143 125 63
30 34 33 25 25
10 23 32 27 31 26 31 39 0 2 2 2 2 3 2 0 3 2
4.5 522 520 520 506 392 221 184
106 111 113 80 74
15 63 73 62 72 69 81 76 0 4 3 4 4 6 3
0.4 5 4
7.5
1031 1031 992 816 433 357
220 230 236 160 150
Keasuring points
l i l i i 3
> ' l l i 3
λ
I I I I ) 3
modification '. holes dosed
A I I I.
modification holes opaaed
A I I I. λ O 4
Observations
4 holes 90°
4 holes
internal resistance negligible small effect is observed 4 holes 90° 4 holes A small effect is observed
the grid has no effect
4 holes 90° 4 holes
all resistance concentrated in the overlap 4 holes 90° 4 holes. Deformation of inner liner Bobbin "4" or deformation of overlap (v. 5 e/f). Stronger deformation 4 holes 90° 4 holes. Deformation of inner liner Bobbin "4" or deformation of overlap (v. 4 e/f)
ΔΡ is expressed in mm H O Table 6
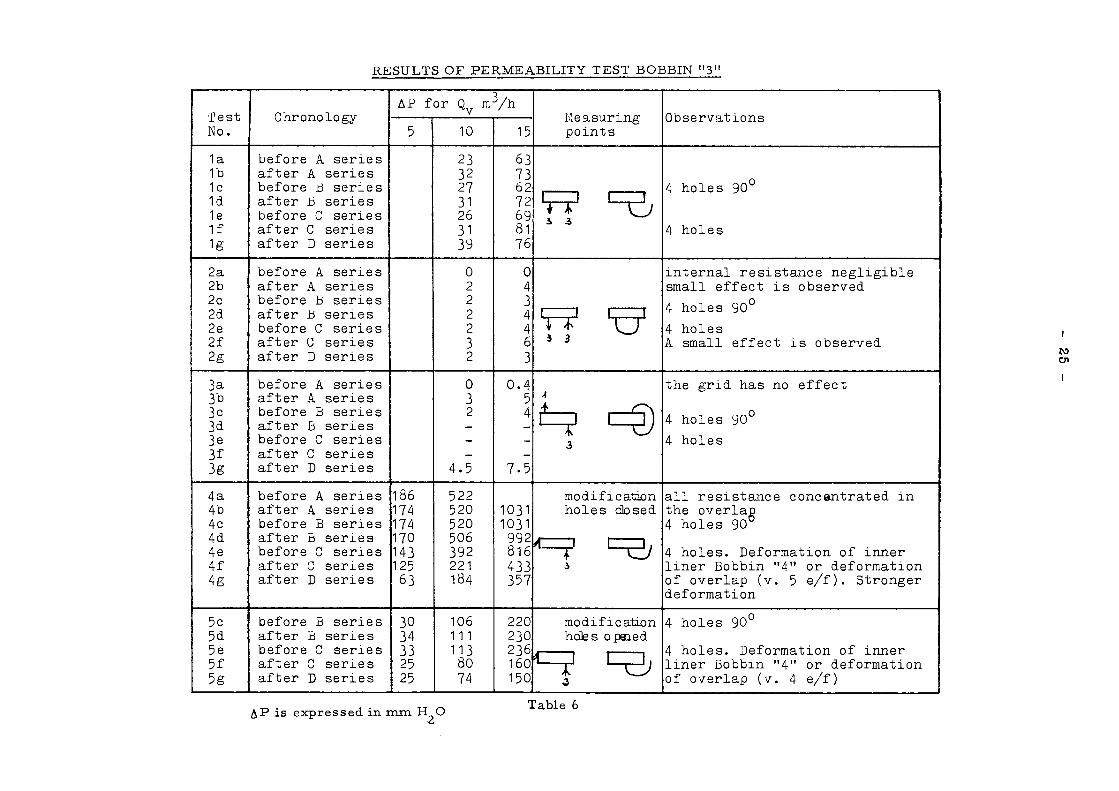
T e s t No.
1a 1b 1c 1d 1e 1f 1 f 1 i g 1
2a 2b 2c 2d 2e 2f 2f 2g 1
3a 3b 3c 3d 3e 3f 3 f 1 3g 1
4a 4b 4 c 4d 4e 4f
4 f 1 4g
5c 5d 5e 5f 5 f 1 5g 1
RESULTS OF PERMEABILITY TESTS BOBBIN
C h r o n o l o g y
b e f o r e A s e r i e s a f t e r tí s e r i e s b e f o r e Β s e r i e s a f t e r Β s e r i e s b e f o r e C s e r i e s a f t e r C s e r i e s b e f o r e D s e r i e s a f t e r D s e r i e s
b e f o r e A s e r i e s a f t e r A s e r i e s b e f o r e Β s e r i e s a f t e r . Β s e r i e s b e f o r e C s e r i e s a f t e r C s e r i e s b e f o r e D s e r i e s a f t e r D s e r i e s
b e f o r e A s e r i e s a f t e r A s e r i e s b e f o r e Β s e r i e s a f t e r Β s e r i e s b e f o r e C s e r i e s a f t e r C s e r i e s b e f o r e D s e r i e s a f t e r D s e r i e s
b e f o r e A s e r i e s a f t e r A s e r i e s b e f o r e tí s e r i e s a f t e r Β s e r i e s b e f o r e C s e r i e s a f t e r C s e r i e s b e f o r e D s e r i e s a f t e r D s e r i e s
b e f o r e Β s e r i e s a f t e r Β s e r i e s b e f o r e C s e r i e s a f t e r C s e r i e s b e f o r e T) s e r i e s a f t e r D s e r i e s
ι
Δ±2 f o r Qv
5
44 79 82 64
41 54
103 109 113 116 110
65 65 85
97 53 33 60
10
35 42 37 48 43 39 44 53
1 4 6 7 7 5 3 3
213 285 293 295
116 188
343 330 395 394 398 210 205 277
344 165 119 209
m 3 / h
15
94 89 84
105 97 73 79
117
10 8
10
13 13 10
5 5
351 834 865 370 427 403 579
753 360 251 457
Measur p o i n t
i n g s
i l l I 4 «μ Ό
l i l I
A i
■i
t Γ I
U
ΓΛ I I I
J
m o d i f i h o l e s
1 ' I
c a t i o n c l o s e d
>| I I I ■
i <J
11411
O b s e r v a t i o n s
4 h o l e s . D e f o r m a t i o n c a u s e d by b u c k l i n g 28 h o l e s . D e f o r m a t i o n c a u s e d by b u c k l i n g
t h e r e i s a s m a l l i n t e r n a l r e s i s t a n c e
4 h o l e s . D e f o r m a t i o n c a u s e d by b u c k l i n g 23 h o l e s . D e f o r m a t i o n c a u s e d by b u c k l i n g
t h e h o l e d e s i g n g i v e s a much g r e a t e r r e s i s t a n c e t h a n t h e g r i d
4 h o l e s
28 h o l e s
i m p o r t a n t r e s i s t a n c e i n o v e r l a p
4 h o l e s
28 h o l e s . D e f o r m a t i o n of o v e r l a p
4 h o l e s
23 h o l e s . D e f o r m a t i o n of o v e r l a p
ΔΡ i s e x p r e s s e d in m m H O Table 7
- 27 -
Bobbin " 3 "
- for t e s t s " 1 " the in t e rna l r e s i s t ance plus the dynamic p r e s s u r e a r e m e a
su red . The effect of the modifications between t e s t s s e r i e s " B " , " C " and
"D" is very smal l .
- for t e s t s " 2 " only the in te rna l r e s i s t ance is m e a s u r e d . It is negligible.
- f or t e s t s " 3 " the gr id r e s i s t ance is m e a s u r e d ; negligible.
- for t e s t s " 4 " the r e s i s t ance of the overlapping is m e a s u r e d with modifica
tion holes c losed. All r e s i s t a n c e is concent ra ted in the overlapping (A se
r i e s ) . These t e s t s showed for s e r i e s " C " and "D" a sens ib le diminution
in the r e s i s t a n c e of the overlapping.
- for t e s t s " 5 " the r e s i s t a n c e of the overlapping is m e a s u r e d with open
ho les . Here a lso compar ing values before and after t e s t s s e r i e s " C " and
"D" it can be observed that the r e s i s t ance of the overlapping has d imi
nished.
Bobbin " 4 "
- for t e s t s " 1 " in te rna l p r e s s u r e plus the dynamic p r e s s u r e a r e m e a s u r e d .
The effect of the modifications between t e s t s s e r i e s " B " , " C " and MD" is
very sma l l . The effect of the buckling is significant.
- for t e s t s " 2 " only in te rna l r e s i s t ance is m e a s u r e d . It is negligible.
- for t e s t s " 3 " the r e s i s t ance of the b r e a t h e r holes is m e a s u r e d . There is
a m e a s u r a b l e effect after buckling.
- for t e s t s " 4 " r e s i s t ance of the overlapping is m e a s u r e d with the modifica
tion holes c losed. Here too an impor tan t r e s i s t ance in the overlapping.
F o r the " C " and "D" s e r i e s a notable deformation of the overlapping is
m e a s u r e d .
- for t e s t s " 5 " r e s i s t a n c e of the overlapping is m e a s u r e d with open holes;
the s ame effect as for t e s t s " 4 " is noted.
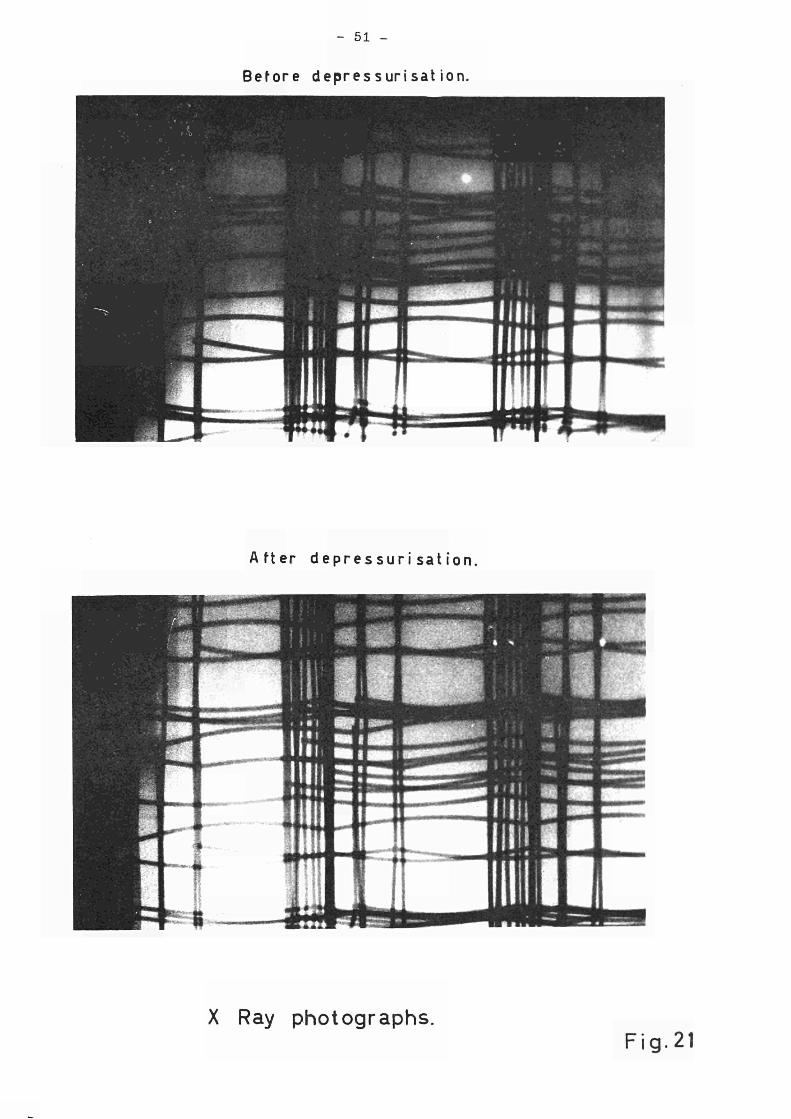
8. 2 X-Ray Photographs
Displacement of the wire m e s h at the i n t e r io r of the bobbin that might
occur due to gas flow velocity is control led with X- ray photography.
- 28 -
Before and after depressu r i za t ion t e s t s X- r ay photographies a r e made
at th ree different re fe rence points of the t e s t tube. See F ig . 20.
Inspection of the pic ture shows no impor tan t axial and tangent ia l d i s
placement of the mesh w i r e s . Example see F ig . 21 .
8. 3 Metrology
The in te rna l d i ame te r s of t es t tube a r e m e a s u r e d before and after t e s t
ing to invest igate eventual changes due to depressu r i za t ion ; see F ig . 23.
The re su l t s a r e given in table 8.
It can be noticed that:
- after dep res su r i za t ion tes t A-12 the re a r e no changes;
- af ter dep res su r i za t ion t e s t B-5 no impor tan t changes occur , except for
m e a s u r i n g point 11;
- after dep res su r i za t ion tes t C-5 not only on bobbin " 4 " impor tan t deforma
tions a r e m e a s u r e d but d i ame te r s of bobbin " 3 " a r e changed as well; espe
cially the over lap (measur ing points 7, 19, 31 and 43);
- after dep res su r i za t ion t e s t D-4 the re a r e impor tan t changes on bobbin " 3 " .
8. 4 Leak tes t s
In o rde r to notice eventual damage of the welds between outer l iner and
mild s tee l tube, these welds of bobbins " 3 " and " 4 " a r e leak tes ted . T h e r e -
fore a ni t rogen p r e s s u r e of r e s p . 10 and 20 g / c m is put into the bobbin
and the gas flow through the weld is m e a s u r e d . F o r t e s t method, see F ig . 23,
As can be seen from table 9, the weld of bobbin " 4 " changes during d e p r e s
sur iza t ion .
- 29 -Test no. 1 before depressurization test A-1 Test no. 2 after depressurization test A-12 Test no. 3 before depressurization test B-1 Test no. 4 after depressurization test B-5 Test no. 5 after depressurization test C-5 Test no. 6 after depressurization test D-4
METROLOGY
Measuring points 1 2 3 4 5 6 7 8 9 10 11 12 13 14 15 16 17 18 19 20 21 22 23 24 25 . 26 27 28 29 30 31 32 33 34 35 36 37 38 39 40 41 42 43 44 45 46 47 48
test 1 480.40 478.75 478.58 477.52 477.35 479.13 480.40 479.88 478.32 476.64 477.72 477.85 476.57 473.64 472.26 476.17 477.78 477.90 475.46 474-76 48O.O3 480.82 480.46 478.56 481.28 481.80 481.75 484.50 480.60 479.90 477.39 477.08 479.50 480.IO 480.76 479.68 483.70 483.41 483.29 485.OO 485.O8 484.42 482.53 482.54 484.37 483.41 482.24 473.92
test 2 480.42 478.74 478.50 477.45 477.28 479.13 480.21 479.70 478.22 476.56 477.56 477.72 476.68 473-73 472.24 476.23 477.83 477.90 475.50 474.83 480.04 480.84 480.49 478.55 481.29 481.79 481.80 481.58 480.71 48O.04 477.59 477.16 479.63 480.27 48O.94 479.83 483.54 483.15 483.18 484.92 485.OO 484.38 482.54 432.49 434.34 483.44 482.26 473.92
Diameter test 3 480.42 478.74 478.50 477.45 477.28 479.13 480.21 479.90 478.22 476.57 477.56 477.72 476.68 473.73 472.24 476.23 477.83 477.90 475.50 474.83 480.04 480.84 480.49 478.55 481.29 481.79 481.30 481.58 480.71 48O.O4 477.59 477.16 479.63 480.27 430.94 479.83 433.54 433.15 483.18 484.92 485.00 484.38 482.54 482.49 484.34 483.44 432.26 478.92
mm test 4 48O.48 478.75 478.60 477.38 477-35 479.12 48O.3O 479-72 473.21 476.65 476.67 477.76 476.65 473.70 472.23 476.25 477.82 477-92 475.23 474.77 480.04 480.80 480.47 478.45 431.38 481.82 481.89 431.60 48O.72 48O.OO 477.44 477.15 479.63 430.24 480.91 479.80 483.59 483.21 483.27 484.97 485.02 484.41 482.46 482.48 484.34 483.37 482.23 473.39
test 5 480.65 479.09 478.82 477.30 476.63 477.73 477.84 475.09 463.07 458.71 463.96 476.57 476.97 473.38 472.05 476.31 478.27 478.67 476.43 475.95 481.OO 481.43 481.16 479.18 481.30 482.OO 481.95 481.50 480.35 479.46 476.55 476.25 479.13 430.07 48O.95 48O.O7 433.67 483.16 483.OO 485.18 485.65 485.52 484.14 484.79 437.13 486.66 484.31 479.07
test 6 480.82 479.48 479.16 476.84 475.39 475.92 475.64 472.63 450.40 431.00 451.10 475.3O 476.29 472.96 471.46 476.67 479.46 481.10 480.75 482.5 485.6 485.O 485.1 479.8 481.46 482.45 482.32 481.88 478.40 475.47 469.5 464.7 445.5 441.3 450.7 479.1 483.46 482.76 482.85 485.80 487.2 488.2 483.2 489.6 493.2 494.3 490.0 430.49
table 8
- 30
LEAK TEST
Bobbin
3
4
Press. ρ
g/cm 10 20 40
10 20 40
Before depr.
0 0 0
1400 2200
-
Leak cc/min after A-12
0 0 -
0 0 -
depressurizatior B-5
0 0 -
0 0 -
σ-5
0 0 -
0 215 -
L Test No. D-4
0 0 0
0 0 0
table 9
9. CORRELATION BETWEEN PERMEABILITY AND DEPRESSURIZATION
TESTS
In chapter 6 we have shown that the in te rna l p r e s s u r e P . in the bobbin
and the p r e s s u r e Ρ in the vesse l can be re la ted by the following difieren-Ά.
t ia l equation
dP . * ι m *oV/2 τ^1"*^
dt (P.-PJ ' .P. ι Α' ι
* V ß / Λ \ 1/2 , χ where m = — . s . (A) . g(x)
«" sWfiMÃc) ^\
1 / ( X-V^x)
1 / 2
Numer ica l solutions of the differential equation give
* ei ther the values of the max imum p r e s s u r e difference (ΔΡ) as a fune
φ max tion of m and κ ,
or the values of the c r i t i ca l t ime t as a function of the s a m e pa ra rne * c r
t e r s m and κ. See tables 1 and 2.
Inverse ly , from exper imenta l t e s t s which gave the values of the maxi
- 31 -
m u m p r e s s u r e difference (ΔΡ) and the c r i t i ca l t ime t , we can d e -max c r
t e r m i n e the values of m , that i s of A , if V , V, s and κ a r e known. Β D
A is a lso given by the permeabi l i ty t e s t s in the form of equation:
- ^ = P A + μ - 1 with A ^ A Q v
v So it is possible to compare the values of A given e i ther by the depressu
r iza t ion t e s t s or the permeabi l i ty t e s t s .
* F r o m the r e su l t s of the dep re s su r i za t i on t e s t s we de te rmine m , and
there fore A , e i ther from the exper imenta l values of the c r i t i ca l t ime t
or from the exper imenta l values of ( ΔΡ) (using tables 1 and 2). m a x '
c r
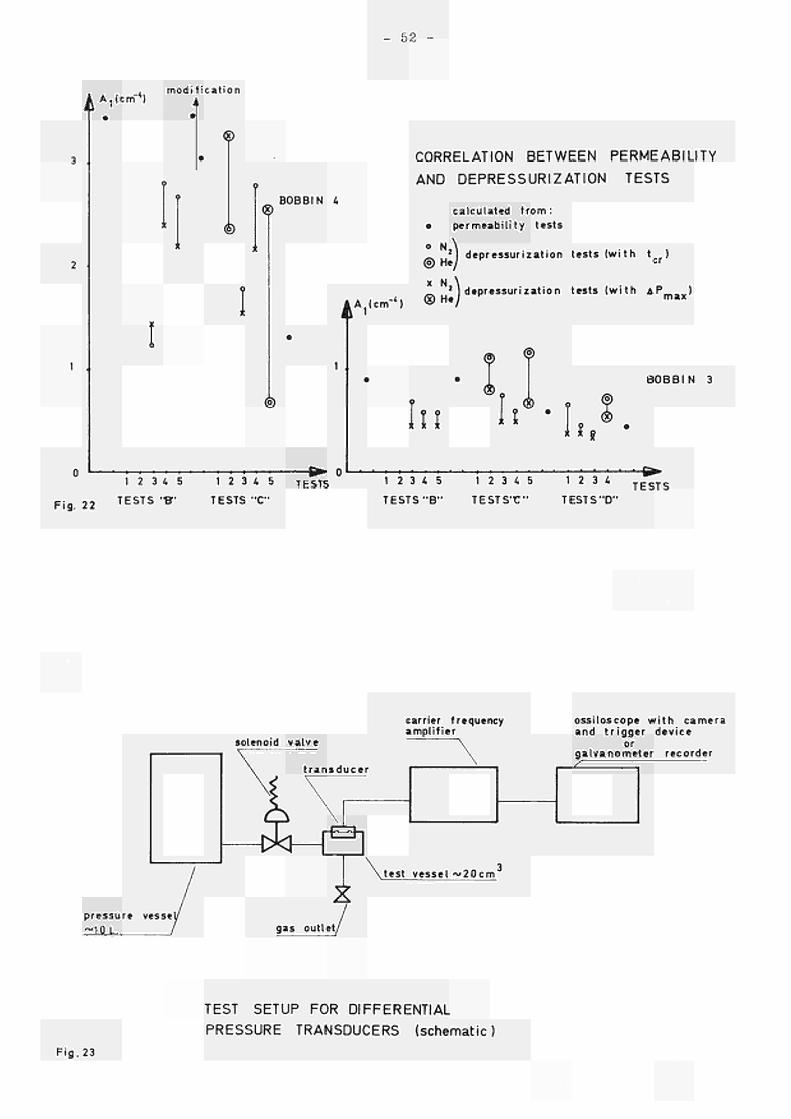
The resu l t s a r e r e p r e s e n t e d in Fig .22 which gives a kind of chronologi
cal h i s to ry of the whole s e r i e s of t e s t s .
As far as the bobbin " 3 " is concerned, it can be noticed that t e s t s " B "
did not modify the values of A , but that after t e s t s " C " the values of A
had diminished. As far as bobbin " 4 " is concerned, buckling appeared at
the end of t e s t s " C " . F o r this r eason t e s t s "D" a r e not r ep re sen t ed .
If we take into account the different simplifying assumpt ions which have
been made , (for ins tance that the flow r e s i s t a n c e is ident ical in steady con
ditions with permeabi l i ty t e s t s as in t r ans i en t conditions with d e p r e s s u r i
zation t e s t s ) , it can be concluded that t he re exis ts a fair ly good c o r r e l a
tion between flow r e s i s t ance in permeabi l i ty t e s t s and in dep res su r i za t ion
t e s t s .
CONCLUSIONS
We have exposed the r e su l t s of a s e r i e s of dep re s su r i za t i on t e s t s on two
slightly different DARCHEM type insulat ion bobbins. 26 Depressu r i za t ion
t e s t s were per fo rmed , 22 with ni t rogen and 4 with he l ium. The t es t s have
been-divided into 4 different s e r i e s depending on the different modifications
pe r fo rmed on the bobbins. All t e s t s were done in the cold s ta te with an in i -
- 32 -
2 t ia l p r e s s u r e of 25 k g / c m . In one bobbin the modifications were s u c c e s s ful in maintaining the value of ( Δ Ρ ) (maximum p r e s s u r e difference b e -
° max 2 tween inside and outside of the bobbin) infer ior to 1 k g / c m with a d e p r e s
sur iza t ion ra te of the o r d e r of 20 a t m / s e c . F o r the o ther bobbin, in which
the design of the overlapping was different, the modifications could not keep 2
the values of (ΔΡ) infer ior to 1 k g / c m and this bobbin was severe ly m a x
damaged by buckling phenomena (with a dep re s su r i za t i on ra te of 16 a t m / s e c ; 2
before the f i r s t buckling a Δ Ρ of 1. 63 k g / c m was m e a s u r e d ) .
F r o m an analys is of the permeabi l i ty t e s t s which were made on the two
bobbins, it can be concluded that the flow r e s i s t ance is not so much due to
the in te rna l s t r u c t u r e s of the bobbins, but r a t h e r to design detai ls conce rn
ing the overlappings between two adjacent bobbins .
A mathemat ica l model is p resen ted from which it is poss ib le to ca lcu
la te the max imum ΔΡ in the bobbin as a function of the dep re s su r i za t i on
r a t e . Agreement between theore t i ca l calculat ions and exper imenta l r e su l t s
i s fair ly sa t i s fac tory . This model confi rms that the l a m i n a r flow r e s i s
tance in the in te rna l s t ruc tu re of the insulat ion is negligible compared to
the dynamic p r e s s u r e r e s i s t a n c e .
X - r a y s control t e s t s showed l i t t le a l t e ra t ion in the wire m e s h d i s t r ibu
tions before and after the t e s t s .
F r o m an ins t rumenta t ion point of view, we had to overcome some in i
t ia l difficulties concerning the p r e s s u r e t r a n s d u c e r s which were too t e m
pe ra tu r e sens i t ive . It was found that the plas t ic p r e s s u r e t r a n s d u c e r s were
not fully re l iable (modification of ca l ibra t ion curves with t ime) . All r e su l t s
p resen ted he re a r e based on data given by the s ta in less s t ee l p r e s s u r e
t r a n s d u c e r s .
As a genera l conclusion it can be s ta ted that the insulat ion bobbins as
they were designed ini t ial ly, would not mee t the r equ i remen t s of a Δ Ρ of 2
1 k g / c m with a dep res su r i za t ion ra te of 20 a t m / s e c with hel ium under a
- 33 -
2 p r e s s u r e of 25 k g / c m . Lit t le flow res i s t ance is offered by the wire m e s h
or the " n o r m a l ins ide" of the bobbin. This r e s i s t ance is al l concent ra ted
in the ex t r emi t i e s (over lappings , b r e a t h e r holes) . These a r e the points
which should be modified. Modifications will be e a s i e r with the bobbins
with the gr id sys t em, than with the bobbins with the b r e a t h e r ho les . Tes t s
show that the mechan ica l r e s i s t ance of the bobbins is sa t i s fac tory up to
values of the Δ Ρ of the o r d e r of 1 k g / c m .
ACKNOWLEDGEMENTS
We wish to thank Dr . BROCKERHOF and Dr . HEINECKE of KFA Jülich
for the i r contr ibution in the planning, d i scuss ion and in te rp re ta t ion of r e
sul ts p re sen ted in this r epo r t . We a lso wish to thank M e s s r s . BENUZZI,
DUFRESNE and FARFALETTI of C. C. R. I sp r a for the i r help in the p repa
ra t ion of this work.
- 34
APPENDIX
Control Tes t s of T r a n s d u c e r s
F o r the ΔΡ m e a s u r e m e n t between the inside of the bobbin and p r e s s u r e
ves se l ini t ial ly two different types of p r e s s u r e t r a n s d u c e r s were foreseen ,
i . e. four with glass fiber re inforced epoxy r e s in m e m b r a n e s and two with
s ta in less s tee l m e m b r a n e s . As resu l ted from the t e s t s , the ΔΡ values given
by the t r a n s d u c e r s with s ta in less s tee l membraneswere always much higher
than the values of the other two t r a n s d u c e r s . To explain this phenomena,
some control t e s t s were done with the t r a n s d u c e r s .
Static t e s t s showed that the t r a n s d u c e r s with s t a in less s tee l m e m b r a n e s
were very stable and showed the same tes t curves with in te rva l s for over
two months . The t r a n s d u c e r s with epoxy r e s in m e m b r a n e s were not s table
and showed an impor tan t aging effect. Therefore in table 1 the r e su l t s of
(ΔΡ) a r e the values m e a s u r e d by the middle t r a n s d u c e r with s ta in -max
l e s s s tee l m e m b r a n e .
Some dynamic t e s t s a r e c a r r i e d out to m e a s u r e the r e sponse t ime and
eventual overshoot of the t r a n s d u c e r . F o r a schemat ic view of the t e s t s e t
up, see F ig . 23 .
The p r e s s u r e vesse l , having a volume of about 10 1, is p r e s s u r i z e d up
to a known ni t rogen p r e s s u r e e. g. 2 a tm. With the gas outlet c losed, the
solenoid valve is opened and the ni t rogen flows into the t e s t v e s s e l . While 3
the volume of the t e s t v e s s e l is 20 cm only, the p r e s s u r e drop in the s y s t em is negligible.
After about 2 seconds the gas outlet is opened. The response t ime of the
sys tem is l imi ted by the opening t ime of the solenoid valve, the gas flow
velocity between p r e s s u r e v e s s e l and t e s t ve s se l and the response t ime of
the t r a n s d u c e r .
Tes t r e s u l t s : r esponse t ime < 20 m s e c ; no measu rab l e overshoot . See example on photograph. 24.
- 35 -
NOMENCLATURE
a t i m e coe f f i c i en t in d e p r e s s u r i z a t i o n f o r m u l a
A, A f o r m c o e f f i c i e n t s r e l a t e d to d y n a m i c p r e s s u r e
Β j f o r m coe f f i c i en t r e l a t e d to l a m i n a r flow r e s i s t a n c e
C , C s p e c i f i c h e a t a t c o n s t a n t p r e s s u r e a n d v o l u m e
g(>c ) func t ion of κ
M m o l e c u l a r w e i g h t
m d i m e n s i o n l e s s coe f f i c i en t
P . p r e s s u r e i n d e p r e s s u r i z a t i o n v e s s e l a t t i m e t
Ρ _ i n i t i a l p r e s s u r e a t t i m e t = 0
Ρ p r e s s u r e i n d i a p h r a g m c r o s s s e c t i o n
Ρ e x t e r n a l p r e s s u r e e P . p r e s s u r e i n s i d e t h e bobb in
\ * Ρ , P . p r e s s u r e s i n r e d u c e d s y s t e m
Q m a s s flow m Q v o l u m e flow v
R c o n s t a n t of p e r f e c t g a s e s
s c r o s s s e c t i o n a r e a of d i a p h r a g m
t t i m e t c r i t i c a l v a l u e of t fo r wh ich Δ Ρ i s m a x i m u m c r t c r i t i c a l va lue of t i n a r e d u c e d s y s t e m c r
T a b s o l u t e t e m p e r a t u r e i n v e s s e l
T a b s o l u t e t e m p e r a t u r e a t t i m e t = 0
T a b s o l u t e t e m p e r a t u r e i n d i a p h r a g m
U s o n i c v e l o c i t y i n d i a p h r a g m
U s o n i c v e l o c i t y a t t i m e t = 0
V gas volume in ves se l V gas volume in bobbin B ρ densi ty of gas in ve s se l
ρ densi ty of gas at t ime t = 0
ρ densi ty of gas at d iaphragm
ρ . density of gas inside the bobbin
κ κ = C p / C v
- 36 -
μ dynamic v iscos i ty of gas
Δ Ρ = P . P . = p r e s s u r e difference between inside and outside of the ι A c
bobbin
(ΔΡ) max imum value of ΔΡ ^max
( ΔΡ ) m a x i m u m value of ΔΡ in a reduced sys tem m a x
t c r i t i ca l value of t for which Δ Ρ is max imum g c r g
t _ c r i t i ca l t ime after buckling; see Fig . 13 cr2 °
t „ c r i t i ca l t ime t after buckling; see F ig . 13 g cr2 g
Δ Ρ difference of p r e s s u r e between inside and outs ide of the mi ld g
s tee l tube
(Δ P) max imum value of Δ Ρ after buckling; see F ig . 13 XTlcL3C<u
(ΔΡ) max imum value of ΔΡ g max g
(Δ Ρ ) „ m a x i m u m value of ΔΡ after buckling; see F ig . 13 gmax2 g
à t t ime during which Δ Ρ drops during buckling
Δ t t ime during which Δ Ρ drops during buckling
Δ Τ t e m p e r a t u r e drop of gas in v e s s e l
- 37 -
LIST OF TABLES AND FIGURES
- Schemat ic design of t e s t facility
- Photograph of t e s t facility
- Leaktight cable outlet
- Schema of insulat ion bobbin
- C r o s s - s e c t i o n of p r e s s u r e t r a n s d u c e r (absolute)
- Mounting points for Δ Ρ and permeabi l i ty m e a s u r e m e n t s
- Differential p r e s s u r e t r a n s d u c e r (a-type)
- Differential p r e s s u r e t r a n s d u c e r s
- Example of e n r e g i s t e r e d cu rves
- Depre s su r i za t i on ra te v e r s u s d iaphragm d iame te r square
- Exper imen ta l r e su l t s bobbin " 3 " ti II II π 11411
" 1 3 - Example of e n r e g i s t e r e d cu rves during buckling
" 14 - Photograph of bobbin af ter buckling
15 - Compar i son between exper imenta l and theore t ica l r esu l t s
16 - Tes t s e t -up for pe rmeab i l i ty m e a s u r e m e n t
17 - Pe rmeab i l i t y connections
" 18 - Resul t s of pe rmeabi l i ty t e s t s bobbin " 3 " 11 ] q _ n n it π 11 11411
20 - Measur ing points met ro logy and posit ion of X- r ay photographs
" 2 1 - X-Ray photographs
" 22 - Cor re l a t ion between pe rmeab i l i ty and dep re s su r i za t i on t e s t s
" 23 - Tes t s e t -up for differential p r e s s u r e t r a n s d u c e r s (schematic)
" 24 - Photographs of dynamic p r e s s u r e record ing
F i g II
II
II
II
π
It
II
II
It
It
II
. 1
2
3
4
5
6
7
8
9
10
11
12
I t
I I
I I
I I
Table ·- Numer i ca l solutions of differential equation (23)
2
3'. Exper imenta l r e su l t s
4" 5 - Resul t s of t e s t s C-5 and D-4
6 - Resul t s of permeabi l i ty t e s t s bobbin " 3 " η it it It It II 1141t
8 - Metrology
9 - leak t e s t
38 -
Facility for depressurisation tests on HTGR type insulations
Transducers cables plug
Absolute pressure transducer N° 2
Scale 1:125
Double bursting disk system
Diaphragm
FI6. 1
Insulation bobbin
Differential pressure
transducers
Absolute pressure transducer N°1
Absolute pressure transducer N ° 3
39 -
40 -
Vessel-Wall
Araldite 10 Insulated Wires Flange
Fig. 3 Leak-tight Cable Outlet 50 Contacts.
'//////////////////////////,
Fig. Λ
Circumferential Gap
SCHEMA OF INSULATION BOBBIN
Mild steel tube
- 41 -
Strain Gauge TeM on Liner Inner Steel Tube Steel Casing
Metal Foil
Epoxy Resin
Fig.5 Scale: 4 : 1 Cross-Section of Pressure Transducer (absolute)
1230
Fig. 6 Mount ing points for & Ρ and Permeability measurements
- 42 -
PERTINAX
SILICONE RUBBER
STAINLESS STEEL
MEMBRANE
0,27mm thk.
SILICONE RUBBER
PERTINAX
DIFFERENTIAL PRESSURE TRANSDUCER
Fi g. 7 ·■-'»Ρ«'
A-Type Pressure Transducers.
Scale: 2: 1
Fig. 8
Differential Pressure Transducers.
Mounting on Bobbin (schematic)
lu
(O
2 sec.
m χ OJ
3 ■σ
Φ
o —t*
Φ
- ι Φ lu
IP
? 1 sec. Φ Q.
O C - t
< φ
Absolut e Pressure
Tran stìucers
Differential
Pressure
Transduters
OJ
1 4 1
gm iT 15 mm.
gen '
- 44 -
20
15
10
m- ( in i t ia l depressurization r a t e : at m./se c. )
Fig. 10
Hel ¡um
contraction coef f i ci ent : .9
cal culated
• experimental poi nts
5 10 d 2 < c m *>
DEPRESSURIZATION RATES VERSUS DIAPHRAGM
DIAMETER SQUARE
AuP)r
He
, + ·
A(ûP)m a x : kg/cm2
, .D„
10 15
10 i d P A^ : atm/sec \ d t / t = o
Fig. 11 EXPERIMENTAL RESULTS BOBBIN "3'
- 45 -
AuP)
ΑΙΔΡ),
He
1 'max
• /
ν/ / *
Ά"
+ / /
/ /
■Β"
" \ / Α(ΔΡ
. 1
^ Up
) m a v: k
9 / c m2
. ,1
'max
"D"
He
Fig.12 EXPERIMENTAL RESULTS BOBBINS"
(ii.) \ d t / t = «
after buckling
PA \
_A_) :atm/s« t / t = o
BOBBIN í
start of
depressurization
BOBBIN 3
EXAMPLE OF RECORDING
BUCKLING
Fig. 13
- 46 -
A = f i rst buckling Β =second buckling
BOBBIN AFTER BUCKLING
Fig . U
47 -
j . * : 1 7dFU cr 2 K \d t / t =
1 t ο Ρ cr
Ao
COMPARISON BETWEEN EXPERIMENTAL AND THEORETICAL RESULTS Fig. 15
00
TEST SET-UP FOR PERMEABILITY MEASUREMENT Fig.16
- 4 9
Permeabil i ty connections β IO
/
ι—ν
Γ ig.17 Permeabi l i ty Connec t ions Mounting on Bobbin (Schematic)
%
Fig. 18
TESTS "C"
Δ Ρ/
Δ Ρ, V
0.1 0.2 0
RESULTS OF PERMEABILITY TESTS
0.1
0.1
BOBBIN 3
TESTS"Β"
0.2'
TESTS"D"
0.2 • before χ after
50 -
A.P/ "
tests "Β" (before , after ) tests "A" (after ) tests "A" (before)
tests "C" (before)
tests "D" (after)
tests "C" (after)
tests "D" (before)
Fig.19
RESULTS OF PERMEABILITY TESTS BOBBIN U
MEASURING POINTS METROLOGY AND
POSITION OF X-RAY PHOTOGRAPHS
s: ^ JS:
^ΞΞ3 Gas Flow
Metrology
So i iTT3 y s é 7r\8 a io // nr1
M M I ' I I ( I [ I I t | I | | I t <
, 'Zoo </oo c > s.is </oc
X Ray photographs
Metrology
Pressure Transducers
Metrol oqy
Fig.20
- 51 -
Before depres suri sat ion.
After depressur i sat ion,
X Ray photographs. Fig.21
5 2
, modification ^ Α , ί ε π Γ 4 ) é
®
©
® BOBBIN Δ
CORRELATION BETWEEN PERMEABILITY
AND DEPRESSURIZATION TESTS
calculated f rom:
■ permeability tests
o
® χ
ï:) ' · " essurization tests (with t c f )
AAjIcm-'l
2 ] depressurization tests (wi th A P „ „ „ )
® H·/ r m a
*
®
In lì ·
BOBBIN 3
χ x g
Fig. 22
1 2 3 4 5 1 2 3 4 5 T E S T S
TESTS 'BT TESTS "C"
1 2 3 4 5 1 2 3 4 5 1 2 3 4
TESTS "B" TESTS'C" TESTS'O'
TESTS
pressure vesse
~10L .
solenoid valve
carrier frequency amplifier
ossiloscope with camera and trigger device
or galvanometer recorder
TEST SETUP FOR DIFFERENTIAL
PRESSURE TRANSDUCERS (schematic)
Fig. 23
55 -
pressure 2 at m.
20 m i l l i sec./div ¡ s ion (upper scale) 1 0 . , ., ,, ( lower ,, )
pressur 2 atm
1 sec./ division (upper scale ) 0.5 .. .. ( lower „ )
F i g . 24 PHOTOS OF DYNAMIC PRESSURE RECORDING

'■"♦?"f!'ttlfl
tfr™ ÌMl
All scientific and technical reports published by the Commission of
the European Communities are announced in the monthly periodical
" e u r o a b s t r a c t s " . For subscription (1 year : B.Fr. 1025,—) or free
specimen copies please write to :
N O T I C E T O T H E R E A D E R
Office for Official Pub l i ca t ions
of t h e E u r o p e a n C o m m u n i t i e s
Case pos ta le 1003
L u x e m b o u r g 1
( G r a n d D u c h y of L u x e m b o u r g )
ri!-;fl
mWÈ
Wmåmam m 'tó-íí ifjllyj
mû
To disseminate knowledge is to disseminate prosperity — I mean
jjjj general prosperity and not individual riches — and with prosperity :::::::::::::::::::::: .Mfc 'IX?'lili. Ll.'líFnill: '.'.ruftlklia -■" 'ΛιΐΐίΜ*Μ Mir't'-'^
ïwïir'i'i:!!P,E .%ΙΪ FjjDljfcí ■ Liu' SJ' |l ,iífi}Xf|i,' ,:ir.«i|ll[jl¡')
,»ji
disappears the greater par t of the evil which is our heritage from
darker times. i:;::-::::::::::-::::·::·:·:-
ι ; : : : : : : : : : : : : : : : : : : : : : : : : : : : : : : : ; : : - · Alfred Nobel
limiffi
W i l i SALES OFFICES
The Office for Official Publications sells all documents
the European Communities at the addresses listed below, at the price given on cove
When ordering, specify clearly the exact reference and the t it le of the document.
H.M. Stationery Office
P.O. Box 569
London S.E. 1
GREAT BRITAIN AND THE COMMONWEALTH
iffice
UNITED STATES OF AMERICA
European Community Information Service
2100 M Street, N.W.
Suite 707
Washington, D.C 20 037
BELGIUM
Moniteur belge - Belgisch Staatsblad
Rue de Louvain 40-42 — Leuvenseweg 40-42
1000 Bruxelles — 1000 Brussel — Tel. 12 00 2,6
CCP 50-80 — Postgiro 50-80
Agency :
Librairie européenne — Europese Boekhandel
Rue de la Loi 244 — Wetstraat 244
1040 Bruxelles — 1040 Brussel
ITALY
m Libreria
Piazza G. Verdi 10
Roma — Tel. (6) 85 09
1/2640
Æ Hmm
cies : 00187 Roma —Via del Tritone 61/A e 61/B 00187 Roma —Via XX Settembre (Palazzo
Ministero delle finanze)
20121 Milano —Galleria Vittorio Emanuele 3
80121 Napoli —Via Chiaia 5
50129 Firenze —Via Cavour 46/R
16121 Genova —Via XII Ottobre 172
40125 Bologna — Strada Magg
NETHERLANDS
Staatsdrukkerij en uitgeverijbedi
Christoffel Plantijnstraat
's-Gravenhage — Tel. (070) 81
Giro 425 300
? will! im ■■""Pt**'liil!íai*e! ìiiw^'lr
'NBIMSI ."!■-! »¡f f i n ii;
dello Stato
IRELAND
»If , t Ä i
GRAND DUCHY
Stationery Office
Beggar's Bush
Dublin 4
SWITZERLAND
SP
O F L U X E M B O U R G SV
iW^ntili ρ ·ί·1ί»ΐ '' f l i J W i . í™u ϊΓ ΓίΗ" 'U Í ' Í '
Office for official publications Librairie Payot
of the European Communities 6, rue Grenus
Case postale 1003 — Luxembourg 1 1211 Genève and 29, rue Aldringen, Library
Tel. 4 79 41 — CCP 191-90
Compte courant bancaire; BIL 8-109/6003/200
CCP 12-236 Genève
SWEDEN
L.brame CE. Fntze
2, Fredsgatan
Stockholm 16
Post Giro 193, Bank Gi,
■ f ' Wit· iÜw »-»M*! * * ' ' I f f n ι Ί < lkv ' w t î '4i.
&mM
CDNA04880ENC
ΛΡΐβ!·ι'.^ΜΠ«ίβυ w ' . t r r»a- . -"«nrr