
PHYSICAL REVIEW D 112009 (2021)
27
First T2K measurement of transverse kinematic imbalance in the muon-neutrino charged-current single-π + production channel containing at least one proton K. Abe, 54 N. Akhlaq, 45 R. Akutsu, 60 A. Ali, 30 C. Alt, 9 C. Andreopoulos, 52,34 M. Antonova, 17 S. Aoki, 29 T. Arihara, 57 Y. Asada, 67 Y. Ashida, 30 E. T. Atkin , 19 Y. Awataguchi, 57 G. J. Barker, 64 G. Barr, 42 D. Barrow, 42 M. Batkiewicz-Kwasniak, 13 A. Beloshapkin, 24 F. Bench, 34 V. Berardi, 20 L. Berns, 56 S. Bhadra, 68 A. Blanchet, 51 A. Blondel, 51,11 S. Bolognesi, 5 T. Bonus, 66 B. Bourguille, 16 S. B. Boyd, 64 A. Bravar, 11 D. Bravo Berguño, 1 C. Bronner, 54 S. Bron, 11 A. Bubak, 50 M. Buizza Avanzini, 33 S. Cao, 18 S. L. Cartwright, 49 M. G. Catanesi, 20 A. Cervera, 17 J. Chakrani, 33 D. Cherdack, 15 G. Christodoulou, 10 M. Cicerchia, 22,* J. Coleman, 34 G. Collazuol, 22 L. Cook, 42,26 D. Coplowe, 42 A. Cudd, 6 G. De Rosa, 21 T. Dealtry, 31 C. C. Delogu, 22 S. R. Dennis, 34 C. Densham, 52 A. Dergacheva, 24 F. Di Lodovico, 28 S. Dolan, 10 D. Douqa, 11 T. A. Doyle, 31 J. Dumarchez, 51 P. Dunne, 19 A. Eguchi, 53 L. Eklund, 12 S. Emery-Schrenk, 5 A. Ereditato, 2 A. J. Finch, 31 G. Fiorillo, 21 C. Francois, 2 M. Friend, 14,† Y. Fujii, 14,† R. Fukuda, 58 Y. Fukuda, 37 K. Fusshoeller, 9 C. Giganti, 51 M. Gonin, 33 E. A. G. Goodman, 12 A. Gorin, 24 M. Grassi, 22 M. Guigue, 51 D. R. Hadley, 64 P. Hamacher-Baumann, 48 D. A. Harris, 68 M. Hartz, 60,26 T. Hasegawa, 14,† S. Hassani, 5 N. C. Hastings, 14 Y. Hayato, 54,26 A. Hiramoto, 30 M. Hogan, 7 J. Holeczek, 50 N. T. Hong Van, 18,25 T. Honjo, 41 F. Iacob, 22 A. K. Ichikawa, 63 M. Ikeda, 54 T. Ishida, 14,† M. Ishitsuka, 58 K. Iwamoto, 53 A. Izmaylov, 24 N. Izumi, 58 M. Jakkapu, 14 B. Jamieson, 65 S. J. Jenkins, 49 C. Jesús-Valls, 16 J. J. Jiang, 39 P. Jonsson, 19 C. K. Jung, 39,‡ P. B. Jurj, 19 M. Kabirnezhad, 68 H. Kakuno, 57 J. Kameda, 54 S. P. Kasetti, 35 Y. Kataoka, 54 Y. Katayama, 67 T. Katori, 28 E. Kearns, 3,26,‡ M. Khabibullin, 24 A. Khotjantsev, 24 T. Kikawa, 30 H. Kikutani, 53 S. King, 28 J. Kisiel, 50 T. Kobata, 41 T. Kobayashi, 14,† L. Koch, 42 A. Konaka, 60 L. L. Kormos, 31 Y. Koshio, 40,‡ A. Kostin, 24 K. Kowalik, 38 Y. Kudenko, 24,§ S. Kuribayashi, 30 R. Kurjata, 62 T. Kutter, 35 M. Kuze, 56 L. Labarga, 1 J. Lagoda, 38 M. Lamoureux, 22 D. Last, 43 M. Laveder, 22 M. Lawe, 31 S.-K. Lin, 35 R. P. Litchfield, 12 S. L. Liu, 39 A. Longhin, 22 L. Ludovici, 23 X. Lu , 42 T. Lux, 16 L. N. Machado, 21 L. Magaletti, 20 K. Mahn, 36 M. Malek, 49 S. Manly, 46 L. Maret, 11 A. D. Marino, 6 L. Marti-Magro, 1 T. Maruyama, 14,† T. Matsubara, 14 K. Matsushita, 53 C. Mauger, 43 A. Maurel, 5 K. Mavrokoridis, 34 E. Mazzucato, 5 N. McCauley, 34 J. McElwee, 49 K. S. McFarland, 46 C. McGrew, 39 A. Mefodiev, 24 G. D. Megias, 55,54 L. Mellet, 51 M. Mezzetto, 22 A. Minamino, 67 O. Mineev, 24 S. Mine, 4 M. Miura, 54,‡ L. Molina Bueno, 17 S. Moriyama, 54,‡ Th. A. Mueller, 33 D. Munford, 15 L. Munteanu, 5 Y. Nagai, 6 T. Nakadaira, 14,† M. Nakahata, 54,26 Y. Nakajima, 53 A. Nakamura, 40 H. Nakamura, 58 K. Nakamura, 26,14,† Y. Nakano, 29 S. Nakayama, 54,26 T. Nakaya, 30,26 K. Nakayoshi, 14,† C. E. R. Naseby, 19 T. V. Ngoc, 18,∥ V. Q. Nguyen, 51 K. Niewczas, 66 Y. Nishimura, 27 K. Nishizaki, 41 E. Noah, 11 T. S. Nonnenmacher, 19 F. Nova, 52 J. Nowak, 31 J. C. Nugent, 12 H. M. O’Keeffe, 31 L. O’Sullivan, 49 T. Odagawa, 30 T. Ogawa, 14 R. Okada, 40 K. Okumura, 55,26 T. Okusawa, 41 R. A. Owen, 45 Y. Oyama, 14,† V. Palladino, 21 V. Paolone, 44 M. Pari, 22 W. C. Parker, 47 J. Parlone, 34 S. Parsa, 11 J. Pasternak, 19 M. Pavin, 60 D. Payne, 34 G. C. Penn, 34 D. Pershey, 8 L. Pickering, 36 C. Pidcott, 49 G. Pintaudi, 67 C. Pistillo, 2 B. Popov, 51,¶ K. Porwit, 50 M. Posiadala-Zezula, 61 B. Quilain, 33 T. Radermacher, 48 E. Radicioni, 20 B. Radics, 9 P. N. Ratoff, 31 M. Reh, 6 C. Riccio , 39 E. Rondio, 38 S. Roth, 48 A. Rubbia, 9 A. C. Ruggeri, 21 C. A. Ruggles, 12 A. Rychter, 62 L. S. M. Lakshmi, 38 K. Sakashita, 14,† F. Sánchez, 11 G. Santucci, 68 C. M. Schloesser, 9 K. Scholberg, 8,‡ M. Scott, 19 Y. Seiya, 41,** T. Sekiguchi, 14,† H. Sekiya, 54,26,‡ D. Sgalaberna, 9 A. Shaikhiev, 24 A. Shaykina, 24 M. Shiozawa, 54,26 W. Shorrock, 19 A. Shvartsman, 24,§ K. Skwarczynski, 38 M. Smy, 4 J. T. Sobczyk, 66 H. Sobel, 4,26 F. J. P. Soler, 12 Y. Sonoda, 54 R. Spina, 20 S. Suvorov, 24,51 A. Suzuki, 29 S. Y. Suzuki, 14,† Y. Suzuki, 26 A. A. Sztuc, 19 M. Tada, 14,† M. Tajima, 30 A. Takeda, 54 Y. Takeuchi, 29,26 H. K. Tanaka, 54,‡ Y. Tanihara, 67 M. Tani, 30 N. Teshima, 41 N. Thamm, 48 L. F. Thompson, 49 W. Toki, 7 C. Touramanis, 34 T. Towstego, 59 K. M. Tsui , 34 T. Tsukamoto, 14,† M. Tzanov, 35 Y. Uchida, 19 M. Vagins, 26,4 S. Valder, 64 D. Vargas, 16 G. Vasseur, 5 C. Vilela, 10 W. G. S. Vinning, 64 T. Vladisavljevic, 52 T. Wachala, 13 J. Walker, 65 J. G. Walsh, 31 Y. Wang, 39 L. Wan, 3 D. Wark, 52,42 M. O. Wascko, 19 A. Weber, 52,42 R. Wendell, 30,‡ M. J. Wilking, 39 C. Wilkinson, 32 J. R. Wilson, 28 K. Wood, 39 C. Wret, 46 J. Xia, 55 Y.-h. Xu, 31 K. Yamamoto, 41,** C. Yanagisawa, 39,†† G. Yang, 39 T. Yano, 54 K. Yasutome, 30 N. Yershov, 24 M. Yokoyama, 53,‡ T. Yoshida, 56 Y. Yoshimoto, 53 M. Yu, 68 R. Zaki, 68 A. Zalewska, 13 J. Zalipska, 38 K. Zaremba, 62 G. Zarnecki, 38 M. Ziembicki, 62 M. Zito, 51 and S. Zsoldos 28 (T2K Collaboration) 1 University Autonoma Madrid, Department of Theoretical Physics, 28049 Madrid, Spain 2 University of Bern, Albert Einstein Center for Fundamental Physics, Laboratory for High Energy Physics (LHEP), Bern, Switzerland 3 Boston University, Department of Physics, Boston, Massachusetts, USA PHYSICAL REVIEW D 103, 112009 (2021) 2470-0010=2021=103(11)=112009(27) 112009-1 Published by the American Physical Society
Transcript of PHYSICAL REVIEW D 112009 (2021)

First T2K measurement of transverse kinematic imbalancein the muon-neutrino charged-current single-π + production
channel containing at least one proton
K. Abe,54 N. Akhlaq,45 R. Akutsu,60 A. Ali,30 C. Alt,9 C. Andreopoulos,52,34 M. Antonova,17 S. Aoki,29 T. Arihara,57
Y. Asada,67 Y. Ashida,30 E. T. Atkin ,19 Y. Awataguchi,57 G. J. Barker,64 G. Barr,42 D. Barrow,42
M. Batkiewicz-Kwasniak,13 A. Beloshapkin,24 F. Bench,34 V. Berardi,20 L. Berns,56 S. Bhadra,68 A. Blanchet,51
A. Blondel,51,11 S. Bolognesi,5 T. Bonus,66 B. Bourguille,16 S. B. Boyd,64 A. Bravar,11 D. Bravo Berguño,1 C. Bronner,54
S. Bron,11 A. Bubak,50 M. Buizza Avanzini,33 S. Cao,18 S. L. Cartwright,49 M. G. Catanesi,20 A. Cervera,17 J. Chakrani,33
D. Cherdack,15 G. Christodoulou,10 M. Cicerchia,22,* J. Coleman,34 G. Collazuol,22 L. Cook,42,26 D. Coplowe,42 A. Cudd,6
G. De Rosa,21 T. Dealtry,31 C. C. Delogu,22 S. R. Dennis,34 C. Densham,52 A. Dergacheva,24 F. Di Lodovico,28 S. Dolan,10
D. Douqa,11 T. A. Doyle,31 J. Dumarchez,51 P. Dunne,19 A. Eguchi,53 L. Eklund,12 S. Emery-Schrenk,5 A. Ereditato,2
A. J. Finch,31 G. Fiorillo,21 C. Francois,2 M. Friend,14,† Y. Fujii,14,† R. Fukuda,58 Y. Fukuda,37 K. Fusshoeller,9 C. Giganti,51
M. Gonin,33 E. A. G. Goodman,12 A. Gorin,24 M. Grassi,22 M. Guigue,51 D. R. Hadley,64 P. Hamacher-Baumann,48
D. A. Harris,68 M. Hartz,60,26 T. Hasegawa,14,† S. Hassani,5 N. C. Hastings,14 Y. Hayato,54,26 A. Hiramoto,30 M. Hogan,7
J. Holeczek,50 N. T. Hong Van,18,25 T. Honjo,41 F. Iacob,22 A. K. Ichikawa,63 M. Ikeda,54 T. Ishida,14,† M. Ishitsuka,58
K. Iwamoto,53 A. Izmaylov,24 N. Izumi,58 M. Jakkapu,14 B. Jamieson,65 S. J. Jenkins,49 C. Jesús-Valls,16 J. J. Jiang,39
P. Jonsson,19 C. K. Jung,39,‡ P. B. Jurj,19 M. Kabirnezhad,68 H. Kakuno,57 J. Kameda,54 S. P. Kasetti,35 Y. Kataoka,54
Y. Katayama,67 T. Katori,28 E. Kearns,3,26,‡ M. Khabibullin,24 A. Khotjantsev,24 T. Kikawa,30 H. Kikutani,53 S. King,28
J. Kisiel,50 T. Kobata,41 T. Kobayashi,14,† L. Koch,42 A. Konaka,60 L. L. Kormos,31 Y. Koshio,40,‡ A. Kostin,24 K. Kowalik,38
Y. Kudenko,24,§ S. Kuribayashi,30 R. Kurjata,62 T. Kutter,35 M. Kuze,56 L. Labarga,1 J. Lagoda,38 M. Lamoureux,22
D. Last,43 M. Laveder,22 M. Lawe,31 S.-K. Lin,35 R. P. Litchfield,12 S. L. Liu,39 A. Longhin,22 L. Ludovici,23 X. Lu ,42
T. Lux,16 L. N. Machado,21 L. Magaletti,20 K. Mahn,36 M. Malek,49 S. Manly,46 L. Maret,11 A. D. Marino,6
L. Marti-Magro,1 T. Maruyama,14,† T. Matsubara,14 K. Matsushita,53 C. Mauger,43 A. Maurel,5 K. Mavrokoridis,34
E. Mazzucato,5 N. McCauley,34 J. McElwee,49 K. S. McFarland,46 C. McGrew,39 A. Mefodiev,24 G. D. Megias,55,54
L. Mellet,51 M. Mezzetto,22 A. Minamino,67 O. Mineev,24 S. Mine,4 M. Miura,54,‡ L. Molina Bueno,17 S. Moriyama,54,‡
Th. A. Mueller,33 D. Munford,15 L. Munteanu,5 Y. Nagai,6 T. Nakadaira,14,† M. Nakahata,54,26 Y. Nakajima,53
A. Nakamura,40 H. Nakamura,58 K. Nakamura,26,14,† Y. Nakano,29 S. Nakayama,54,26 T. Nakaya,30,26 K. Nakayoshi,14,†
C. E. R. Naseby,19 T. V. Ngoc,18,∥ V. Q. Nguyen,51 K. Niewczas,66 Y. Nishimura,27 K. Nishizaki,41 E. Noah,11
T. S. Nonnenmacher,19 F. Nova,52 J. Nowak,31 J. C. Nugent,12 H. M. O’Keeffe,31 L. O’Sullivan,49 T. Odagawa,30
T. Ogawa,14 R. Okada,40 K. Okumura,55,26 T. Okusawa,41 R. A. Owen,45 Y. Oyama,14,† V. Palladino,21 V. Paolone,44
M. Pari,22 W. C. Parker,47 J. Parlone,34 S. Parsa,11 J. Pasternak,19 M. Pavin,60 D. Payne,34 G. C. Penn,34 D. Pershey,8
L. Pickering,36 C. Pidcott,49 G. Pintaudi,67 C. Pistillo,2 B. Popov,51,¶ K. Porwit,50 M. Posiadala-Zezula,61 B. Quilain,33
T. Radermacher,48 E. Radicioni,20 B. Radics,9 P. N. Ratoff,31 M. Reh,6 C. Riccio ,39 E. Rondio,38 S. Roth,48 A. Rubbia,9
A. C. Ruggeri,21 C. A. Ruggles,12 A. Rychter,62 L. S. M. Lakshmi,38 K. Sakashita,14,† F. Sánchez,11 G. Santucci,68
C. M. Schloesser,9 K. Scholberg,8,‡ M. Scott,19 Y. Seiya,41,** T. Sekiguchi,14,† H. Sekiya,54,26,‡ D. Sgalaberna,9
A. Shaikhiev,24 A. Shaykina,24 M. Shiozawa,54,26 W. Shorrock,19 A. Shvartsman,24,§ K. Skwarczynski,38 M. Smy,4
J. T. Sobczyk,66 H. Sobel,4,26 F. J. P. Soler,12 Y. Sonoda,54 R. Spina,20 S. Suvorov,24,51 A. Suzuki,29 S. Y. Suzuki,14,†
Y. Suzuki,26 A. A. Sztuc,19 M. Tada,14,† M. Tajima,30 A. Takeda,54 Y. Takeuchi,29,26 H. K. Tanaka,54,‡ Y. Tanihara,67
M. Tani,30 N. Teshima,41 N. Thamm,48 L. F. Thompson,49 W. Toki,7 C. Touramanis,34 T. Towstego,59 K. M. Tsui ,34
T. Tsukamoto,14,† M. Tzanov,35 Y. Uchida,19 M. Vagins,26,4 S. Valder,64 D. Vargas,16 G. Vasseur,5 C. Vilela,10
W. G. S. Vinning,64 T. Vladisavljevic,52 T. Wachala,13 J. Walker,65 J. G. Walsh,31 Y. Wang,39 L. Wan,3 D. Wark,52,42
M. O. Wascko,19 A. Weber,52,42 R. Wendell,30,‡ M. J. Wilking,39 C. Wilkinson,32 J. R. Wilson,28 K. Wood,39 C. Wret,46
J. Xia,55 Y.-h. Xu,31 K. Yamamoto,41,** C. Yanagisawa,39,†† G. Yang,39 T. Yano,54 K. Yasutome,30 N. Yershov,24
M. Yokoyama,53,‡ T. Yoshida,56 Y. Yoshimoto,53 M. Yu,68 R. Zaki,68 A. Zalewska,13 J. Zalipska,38 K. Zaremba,62
G. Zarnecki,38 M. Ziembicki,62 M. Zito,51 and S. Zsoldos28
(T2K Collaboration)
1University Autonoma Madrid, Department of Theoretical Physics, 28049 Madrid, Spain2University of Bern, Albert Einstein Center for Fundamental Physics,Laboratory for High Energy Physics (LHEP), Bern, Switzerland
3Boston University, Department of Physics, Boston, Massachusetts, USA
PHYSICAL REVIEW D 103, 112009 (2021)
2470-0010=2021=103(11)=112009(27) 112009-1 Published by the American Physical Society

4University of California, Irvine, Department of Physics and Astronomy, Irvine, California, USA5IRFU, CEA, Universite Paris-Saclay, F-91191 Gif-sur-Yvette, France
6University of Colorado at Boulder, Department of Physics, Boulder, Colorado, USA7Colorado State University, Department of Physics, Fort Collins, Colorado, USA
8Duke University, Department of Physics, Durham, North Carolina, USA9ETH Zurich, Institute for Particle Physics and Astrophysics, Zurich, Switzerland
10CERN European Organization for Nuclear Research, CH-1211 Genve 23, Switzerland11University of Geneva, Section de Physique, DPNC, Geneva, Switzerland
12University of Glasgow, School of Physics and Astronomy, Glasgow, United Kingdom13H. Niewodniczanski Institute of Nuclear Physics PAN, Cracow, Poland
14High Energy Accelerator Research Organization (KEK), Tsukuba, Ibaraki, Japan15University of Houston, Department of Physics, Houston, Texas, USA
16Institut de Fisica d’Altes Energies (IFAE)—The Barcelona Institute of Science and Technology,Campus UAB, Bellaterra (Barcelona), Spain
17IFIC (CSIC & University of Valencia), Valencia, Spain18Institute For Interdisciplinary Research in Science and Education (IFIRSE), ICISE, Quy Nhon, Vietnam
19Imperial College London, Department of Physics, London, United Kingdom20INFN Sezione di Bari and Universita e Politecnico di Bari,
Dipartimento Interuniversitario di Fisica, Bari, Italy21INFN Sezione di Napoli and Universita di Napoli, Dipartimento di Fisica, Napoli, Italy
22INFN Sezione di Padova and Universita di Padova, Dipartimento di Fisica, Padova, Italy23INFN Sezione di Roma and Universita di Roma “La Sapienza,” Roma, Italy
24Institute for Nuclear Research of the Russian Academy of Sciences, Moscow, Russia25International Centre of Physics, Institute of Physics (IOP), Vietnam Academy of Science and
Technology (VAST), 10 Dao Tan, Ba Dinh, Hanoi, Vietnam26Kavli Institute for the Physics and Mathematics of the Universe (WPI), The University of Tokyo Institutes
for Advanced Study, University of Tokyo, Kashiwa, Chiba, Japan27Keio University, Department of Physics, Kanagawa, Japan
28King’s College London, Department of Physics, Strand, London WC2R 2LS, United Kingdom29Kobe University, Kobe, Japan
30Kyoto University, Department of Physics, Kyoto, Japan31Lancaster University, Physics Department, Lancaster, United Kingdom
32Lawrence Berkeley National Laboratory, Berkeley, California 94720, USA33Ecole Polytechnique, IN2P3-CNRS, Laboratoire Leprince-Ringuet, Palaiseau, France
34University of Liverpool, Department of Physics, Liverpool, United Kingdom35Louisiana State University, Department of Physics and Astronomy, Baton Rouge, Louisiana, USA36Michigan State University, Department of Physics and Astronomy, East Lansing, Michigan, USA
37Miyagi University of Education, Department of Physics, Sendai, Japan38National Centre for Nuclear Research, Warsaw, Poland
39State University of New York at Stony Brook, Department of Physics and Astronomy,Stony Brook, New York, USA
40Okayama University, Department of Physics, Okayama, Japan41Osaka City University, Department of Physics, Osaka, Japan
42Oxford University, Department of Physics, Oxford, United Kingdom43University of Pennsylvania, Department of Physics and Astronomy,
Philadelphia, Pennsylvania, 19104, USA.44University of Pittsburgh, Department of Physics and Astronomy, Pittsburgh, Pennsylvania, USA45Queen Mary University of London, School of Physics and Astronomy, London, United Kingdom
46University of Rochester, Department of Physics and Astronomy, Rochester, New York, USA47Royal Holloway University of London, Department of Physics, Egham, Surrey, United Kingdom
48RWTH Aachen University, III. Physikalisches Institut, Aachen, Germany49University of Sheffield, Department of Physics and Astronomy, Sheffield, United Kingdom
50University of Silesia, Institute of Physics, Katowice, Poland51Sorbonne Universite, Universite Paris Diderot, CNRS/IN2P3,
Laboratoire de Physique Nucleaire et de Hautes Energies (LPNHE), Paris, France52STFC, Rutherford Appleton Laboratory, Harwell Oxford, and Daresbury Laboratory,
Warrington, United Kingdom53University of Tokyo, Department of Physics, Tokyo, Japan
54University of Tokyo, Institute for Cosmic Ray Research, Kamioka Observatory, Kamioka, Japan
K. ABE et al. PHYS. REV. D 103, 112009 (2021)
112009-2

55University of Tokyo, Institute for Cosmic Ray Research, Research Center for Cosmic Neutrinos,Kashiwa, Japan
56Tokyo Institute of Technology, Department of Physics, Tokyo, Japan57Tokyo Metropolitan University, Department of Physics, Tokyo, Japan
58Tokyo University of Science, Faculty of Science and Technology,Department of Physics, Noda, Chiba, Japan
59University of Toronto, Department of Physics, Toronto, Ontario, Canada60TRIUMF, Vancouver, British Columbia, Canada
61University of Warsaw, Faculty of Physics, Warsaw, Poland62Warsaw University of Technology, Institute of Radioelectronics and Multimedia Technology,
Warsaw, Poland63Tohoku University, Faculty of Science, Department of Physics, Miyagi, Japan
64University of Warwick, Department of Physics, Coventry, United Kingdom65University of Winnipeg, Department of Physics, Winnipeg, Manitoba, Canada
66Wroclaw University, Faculty of Physics and Astronomy, Wroclaw, Poland67Yokohama National University, Department of Physics, Yokohama, Japan
68York University, Department of Physics and Astronomy, Toronto, Ontario, Canada
(Received 9 February 2021; accepted 28 April 2021; published 21 June 2021)
This paper reports the first T2K measurement of the transverse kinematic imbalance in the single-πþ
production channel of neutrino interactions. We measure the differential cross sections in the muon-neutrino charged-current interaction on hydrocarbon with a single πþ and at least one proton in the finalstate, at the ND280 off axis near detector of the T2K experiment. The extracted cross sections are comparedto the predictions from different neutrino-nucleus interaction event generators. Overall, the results show apreference for models that have a more realistic treatment of nuclear medium effects including the initialnuclear state and final-state interactions.
DOI: 10.1103/PhysRevD.103.112009
I. INTRODUCTION
In recent years, neutrino oscillation measurements havereached unprecedented precision [1–7]. The next generationof long-baseline (LBL) neutrino oscillation experiments,such as DUNE [8] and Hyper-Kamiokande [9], aim tomeasure important neutrino properties such as the CP-violating phase and mass ordering [10,11]. This requiresunprecedented constraints on the neutrino flux, neutrino
cross sections and interaction model, and detector response.Amongst all the systematic uncertainties, the limited knowl-edge of neutrino-nucleus interactions, especially thoserelated to nuclear medium effects, is particularly concerningbecause it can cause biases in event classification andneutrino energy reconstruction. In the latest T2K oscillationanalysis [12], the uncertainty in nucleon removal energy incharged current quasielastic (CCQE) interactions is thedominant systematic component. In order to reduce its value,a more refined analysis is necessary to avoid potential biasesin the next measurement of Δm2
32.In the range of energies of current LBL experiments,
neutrinos interact predominantly with nucleons. The initialstate nucleon can be described by Fermi motion togetherwith nucleon-nucleon correlations in a mean field potential.After a neutrino interacts with a nucleon, the residual
nucleus may be left in a simple one-particle-one-hole (1p1h)excited state, or collective 1p1h excitations described byrandom phase approximations (RPA) [13–17]. It is alsopossible to have two-particle-two-hole (2p2h) excitationsdue to meson-exchange currents (MEC) or short-rangecorrelations [17–23]. However, in most generators, thesecorrelations are only implemented in the quasielastic (QE)channel, not for the resonant production (RES) or deepinelastic scattering (DIS) channels.Moreover, after the primary neutrino-nucleon interac-
tion, the outgoing hadrons have to propagate through the
*also at INFN-Laboratori Nazionali di Legnaro, Padova, Italy.†also at J-PARC, Tokai, Japan.‡affiliated member at Kavli IPMU (WPI), the University of
Tokyo, Japan.§also at National Research Nuclear University “MEPhI” and
Moscow Institute of Physics and Technology, Moscow, Russia.∥also at the Graduate University of Science and Technology,Vietnam Academy of Science and Technology, Hanoi, Vietnam.
¶also at JINR, Dubna, Russia.**also at Nambu Yoichiro Institute of Theoretical and Exper-
imental Physics (NITEP), Osaka, Japan.††also at BMCC/CUNY, Science Department, New York,
New York, USA.
Published by the American Physical Society under the terms ofthe Creative Commons Attribution 4.0 International license.Further distribution of this work must maintain attribution tothe author(s) and the published article’s title, journal citation,and DOI. Funded by SCOAP3.
FIRST T2K MEASUREMENT OF TRANSVERSE KINEMATIC … PHYS. REV. D 103, 112009 (2021)
112009-3

nuclear remnant before they can be detected. Final-stateinteractions (FSI) may cause energy dissipation and hadronabsorption, or conversely induce the emission of additionalhadrons. As a result, FSI can change the final-state topologyof a neutrino-nucleon interaction, making the identificationof primary neutrino-nucleon interaction and the measure-ment of primary hadronic kinematics difficult. Neutrinocross sections are often measured in terms of experimentallyaccessible final-state topologies, e.g., in charged-current(CC) interactions, the CC0π topology has only one chargedlepton, any number of nucleons and no other particles; theCC1πþ topology has only one charged lepton, one πþ, anynumber of nucleons and no other particles.To achieve the designed sensitivity of future LBL
experiments, nuclear effects have to be modelled accura-tely and consistently amongst all interaction channels.Experimental studies probing nuclear effects in carbon,through the measurement of transverse kinematic imbal-ance (TKI) in CC interactions [24,25], have been per-formed in T2K [26] and MINERνA [27–29]. TKI exploresthe lepton-hadron correlations on the plane that is trans-verse to the initial neutrino direction and helps preciselyidentify intranuclear dynamics [25–36], or the absencethereof [24,37–40], in neutrino-nucleus interactions. Thesemeasurements focused either on final-state topologieswithout any pions, or final-state topologies with at leastone neutral pion, while none with one charged pion hasbeen performed. These studies suggest that modelingnuclear effects with Fermi gas initial state models isinsufficient, but more data are needed to draw solidconclusions. Positively charged pion production fromelectron neutrinos is one of the signal channels measuredat the T2K far detector and employed in the oscillationanalyses [41]. Studying the same interaction channel in CCmuon neutrino interactions can provide a better under-standing of the common underlying nuclear effects andpion production mechanics. Furthermore, it will providevaluable information towards the future inclusion of suchsample among the one used in T2K oscillation analysis.In this paper, we describe the first measurement of the νμ
cross section on hydrocarbon as a function of TKI variablesin CC production of exactly one πþ and no other mesons,and at least one proton. We introduce TKI in Sec. II and theT2K experiment in Sec. III. The event simulation and eventselection of the analysis are described in Secs. IV and V,respectively. Then, the cross-section extraction method isexplained in Sec. VI, followed by the interpretation ofresults in Sec. VII, which have been compared with thestate-of-the-art neutrino interaction models implemented inneutrino events generators. We conclude in Sec. VIII.
II. OBSERVABLES
In a νμ CC RES πþ interaction on a free proton p,
νμ þ p → μ− þ πþ þ p; ð1Þ
a νμ interacts with an initial-state p to produce a final-stateμ−, πþ, and p. This is the most important channel thatproduces πþ with the T2K neutrino beam which isnarrowly peaked at 0.6 GeV. However, in most neutrinoexperiments, the target involves some nucleus, A, heavierthan hydrogen. In general, a νμ CC1πþ interaction with atleast one proton in the final state can be written as
νμ þ A → μ− þ πþ þ pþ A0; ð2Þ
where A0 is the final-state hadronic system consisting of thenuclear remnant and other possible knocked-out nucleons.Apart from the RES interaction in Eq. (1), this topologyalso includes DIS interactions where multiple pions areproduced and some are subsequently absorbed through FSI,leaving only one πþ visible in the detector. Alternatively,CCQE interactions can be included in this topology whenan additional πþ is produced through FSI. The kinematicsof the μ−, πþ, and p tracks are used to construct the TKI. Ifthere is more than one proton observed in the final state,only the highest momentum one is considered.The set of three TKI variables, δpTT , pN , and δαT , were
first introduced in Refs. [24,25,30,33]. These observablesare designed to characterize the nuclear effects that are mostrelevant to oscillation experiments: the initial nuclear state,such as the Fermi motion of initial state nucleon and thenucleon removal energy, and the FSI of outgoing hadrons.The term “transverse” refers to the fact that all theseobservables are closely related to the transverse momentumcomponent pi
T (with respect to the incoming neutrinodirection) of the final-state particle i. In this analysis, therelevant transverse momenta are the transverse momenta ofthe muon, pμ
T , pion, pπT , and proton, pp
T .The first observable δpTT is the double-transverse
momentum imbalance [24], illustrated in Fig. 1(a). Adouble-transverse axis is defined as
zTT ≡ pν × pμ
jpν × pμj; ð3Þ
and the pion and proton momenta are projected onto thisaxis:
pπTT ¼ zTT · pπ;
ppTT ¼ zTT · pp: ð4Þ
The imbalance is defined as
δpTT ¼ pπTT þ pp
TT: ð5Þ
In the absence of nuclear effects, δpTT ¼ 0 is expected dueto momentum conservation. Inside a nuclear medium, animbalance is caused by the initial state of the bound
K. ABE et al. PHYS. REV. D 103, 112009 (2021)
112009-4

nucleon and the FSI experienced by the outgoing pion andproton.The second observable pN is the initial nucleon momen-
tum. Assuming the target nucleus is at rest and there are noFSI, pN can be computed following the steps in Ref. [33].The transverse component of pN is equal to δpT which isthe sum of the transverse momenta [25] [Fig. 1(b)]:
δpT ¼ pμT þ pπ
T þ ppT: ð6Þ
The longitudinal component of pN is given by [30]
pL ¼ 1
2ðMA þ pμ
L þ pπL þ pp
L − Eμ − Eπ − EpÞ
−1
2
δp2T þM2
A0
MA þ pμL þ pπ
L þ ppL − Eμ − Eπ − Ep
; ð7Þ
where piL and Ei are the longitudinal momentum and the
energy of the final-state particles (c ¼ 1 for simplicity).The target nucleus mass MA and the residual nucleus massMA0 are related by
MA0 ¼ MA −Mp þ hϵpi; ð8Þ
whereMp is the proton mass, and hϵip ¼ 26.1 MeV [42] isthe proton mean excitation energy for carbon that affectsMA0 only at a per mil and therefore has a negligiblesystematic impact. The total initial nucleon momentumpN is given by [30]
pN ¼ffiffiffiffiffiffiffiffiffiffiffiffiffiffiffiffiffiffiffiδp2
T þ p2L
q; ð9Þ
which probes the Fermi motion inside the nucleus.Smearing by FSI can shift the peak position of pN , andcause a long tail in the region of large imbalance (similarlyfor δpTT).The third observable δαT is the transverse boosting
angle [25]:
δαT ¼ arccos
�−pμ
T · δpT
pμTδpT
�; ð10Þ
as illustrated in Fig. 1(b). This observable quantifieswhether the hadronic system is accelerated or deceleratedby nuclear effects. Without FSI, the isotropic Fermi motionof the initial-state nucleon would produce a rather flat δαTdistribution. However, FSI usually slows down the out-going hadrons, making δαT > 90°. Therefore, the strengthof FSI can be inferred from the shape of δαT .
III. THE T2K EXPERIMENT
The Tokai-to-Kamioka (T2K) experiment [43] is a LBLaccelerator-based neutrino experiment measuring oscilla-tions with a νμ (νμ) beam. The neutrino beam is produced atthe Japan Proton Accelerator Research Complex (J-PARC),which is located on the east coast of Japan in Tōkai, Ibaraki.The neutrino beam is discussed in more detail in Sec. III A.J-PARC is also home to a suite of near detectors used tomeasure the properties of the unoscillated beam.The near detector complex is located at 280 m from the
neutrino beam production target and consists of severaldetectors. INGRID [44] is an on axis detector consisting ofan array of 16 iron/scintillator modules, which preciselymeasures the beam direction and intensity. The detector of
(a)
(b)
FIG. 1. Schematic illustration of the TKI variables. Thetotal momentum of particle i is given by pi, while its trans-verse component with respect to the neutrino direction isrepresented by pi
T. In (b), the black circle represents theinitial nucleon; the gray plane shows the transverse plane; theorange circles and dashed lines indicate possible FSI experi-enced by the outgoing hadrons. Figures adapted fromRefs. [25,29].
FIRST T2K MEASUREMENT OF TRANSVERSE KINEMATIC … PHYS. REV. D 103, 112009 (2021)
112009-5

primary interest for this analysis is the near detector at280 m (ND280) which is placed 2.5° away from the beamaxis and measures neutrino interactions for the off axis flux.It is discussed in more detail in Sec. III B. The WAGASCI[45] and BabyMIND [46] detectors are located in the samenear detector complex but are situated 1.5° off axis.The far detector Super-Kamiokande [47] is a 50 kt water
Cherenkov detector located at a distance of 295 km awayfrom the J-PARC facility on the west coast of Japan inHida, Gifu. Super-Kamiokande is on the same off axisangle as ND280. Neutrino CC interaction events can beclassified into νμ and νe like, according to the shape ofCherenkov rings of the outgoing leptons.
A. Neutrino beam
The J-PARC facility utilizes a 30 GeV proton beam asthe primary beam line. A proton spill consists of eightbunches spaced 580 ns apart and is produced every 2.48 s.The beam power has increased over time and reached520 kW during the latest data-taking period in 2019. Toproduce a neutrino beam, the proton beam is collided with a91.4 cm graphite target to produce a secondary beam whichis primarily composed of pions and kaons. Three magnetichorns are used to focus positively (negatively) chargedhadrons which then decay to produce a beam dominated byνμ (νμ). The magnetic horns are operated with a current of250 kA (−250 kA) to produce a νμ (νμ) beam. The datataken while producing a νμ (νμ) beam is qualified asneutrino mode (antineutrino mode). The focused beamof hadrons then enters a helium-filled, 96 m long decayvolume where they decay to produce neutrinos. At the endof the decay volume there is a beam dump and, behind this,
a muon monitor [48,49], which is used to monitor thestability of the secondary beam.The neutrino beams are made up of νμ, νμ, νe, and νe
components. The neutrino flux predictions and the differentflavour components at ND280 are shown in Fig. 2 [50]. Theoff axis configuration allows a narrow energy spectrumwith a peak energy of around 0.6 GeV.
B. The off axis near detector
In this analysis, we measure the νμ differential crosssections as a function of TKI variables at the off axisdetector ND280. As shown in Fig. 3, ND280 is composedof an upstream π0 detector (PØD) [51], followed by acentral tracker region, all surrounded by an electromagneticcalorimeter (ECAL) [52]. The outermost component is theformer UA1/NOMAD magnet, which provides a 0.2 Tdipole field, and contains scintillator modules in the airgaps acting as the side muon range detector (SMRD) [53].The central tracker region contains two fine grained
detectors (FGD1 and FGD2) [54] and three time projectionchambers (TPCs) [55]. The FGDs are instrumented withfinely segmented scintillator bars which act as both thetarget mass and particle tracker. The scintillator bars aremade of 86.1% carbon, 7.4% hydrogen, and 3.7% oxygenby mass. The bars are oriented alternately along the twodetector coordinate axes (XY axes) transverse to theincoming neutrino beam (Z axis), and allow 3D trackingof charged particles. The most upstream FGD (FGD1) iscomposed of 15 XY planes of scintillator with each planehaving 2 × 192 bars. The downstream FGD (FGD2) has
0 1 2 3 4 5 6 7 8 9 10
(GeV)νE
910
1010
1110
1210
]-1
PO
T)
21 (
10-1
(50
MeV
)-2
Flux
[cm
μν μν
eν eν
FIG. 2. The flux prediction for ND280 in neutrino-mode isshown as well as the contributions from different neutrino flavors.
FIG. 3. Schematic showing an exploded view of the ND280 offaxis detector. Each subdetector is labeled using the acronymsgiven in the text. FGD1 is placed upstream of FGD2 and is shownin light green. The neutrino beam enters from the left of thefigure.
K. ABE et al. PHYS. REV. D 103, 112009 (2021)
112009-6

sevenXYplanesof scintillatorwith six 2.54 cm thick layers ofwater in between, which allows cross section measurementsto be made on water. This study focuses on carbon inter-actions and only events occurring in FGD1 are analyzed. Forcharged particles entering the TPCs, the curvature of theparticle’s track and thus its momentum can be determined inthe presence of themagnetic field with a resolution of 10% at1 GeV. In combination with the measurement of energy lossper unit distance, TPCs provide high quality particle iden-tification (PID) for charged particles.The ECAL is a sampling calorimeter consisting of three
key parts: the PØD ECAL that surrounds the PØD; thebarrel ECAL that surrounds the FGDs and TPCs; and thedownstream ECAL that is located downstream of the FGDsand TPCs. The barrel ECAL and downstream ECALtogether are referred to as the tracker ECAL. All ECALsuse layers of plastic scintillator bonded to lead sheets, andeach alternating scintillator layer is rotated by 90° to give3D reconstruction. The tracker ECAL is designed tocomplement the FGDs and TPCs by giving detailedreconstruction of electromagnetic showers and a secondaryPID, with an energy resolution of 10% at 1 GeV.
IV. EVENT SIMULATION
For all T2K analyses, we need a reference Monte Carlo(MC) simulation to get a prediction based on the nominalneutrino flux, neutrino interaction model and detectoreffects. Data are then compared to MC simulations toextract the physics quantities of interest and estimate thesystematic uncertainties.Themodeling of the T2K neutrino flux [50] starts with the
modeling of interactions of protons with the graphite target,which is done using the FLUKA 2011 package [56,57].Outside the target, the simulation of hadronic interactionsand decays is done using the GEANT3 [58] and GCALOR [59]software packages. Hadronic interactions are further tunedwith the recent measurements of π� yields performed byNA61/SHINE experiment using a T2K replica target [60].The conditions of the proton beam, magnetic horn currentand neutrino beam axis direction are continuouslymonitoredand incorporated into the simulation. This data-drivenstrategy helps to reduce the neutrino flux uncertainty nearthe flux peak (0.5–0.6 GeV) to 5%. This results in asignificant improvement with respect to previous T2K crosssection analyses [61,62] where the uncertainty was around8.5% [63]. A comparison of the flux uncertainty used in thisanalysis and the flux uncertainty used in previous T2Kanalyses is shown in Fig. 4.Neutrino-nucleus interactions and FSI of the outgoing
particles are simulated using the neutrino event generatorNEUT version 5.4.0 [64,65]. NEUT uses the spectral function(SF) in Ref. [66] to describe the CCQE cross section. Themodeling of 2p2h interactions is based on the model fromNieves et al. [67]. The RES pion production process isdescribed by the Rein-Sehgal model [68] with updated
nucleon form factors [69] and an axial mass (MRESA ) of
1.07 GeV=c2. The model contains contributions from non-resonant, I1=2 pion-production channels. The nuclear modelused for RES is a relativistic global Fermi gas (RFG) [70],without a removal energy and with a Fermi momentum of217 MeV=c.DIS interactions aremodelled using theGRV98[71] parton distribution functions with corrections fromBodek and Yang [72]. In the low invariant hadronic mass,W, region (1.3 < W ≤ 2.0 GeV=c2) a custom hadroni-zation model [73] is used with suppressed single pionproduction to avoid double counting RES interactions. ForW > 2 GeV=c2, PYTHIA/JETSET [74] is used as the hadro-nization model. The FSI, describing the transport of hadronsproduced in elementary neutrino interaction through thenucleus, are simulated using a semiclassical intranuclearcascade model. The NEUT cascade model has been tuned toexternal pion-scattering data, which is described in Ref. [75].Outside the nucleus, final-state particles are then propa-
gated through the detector material using GEANT4 version4.9.4 [76]. The physics list [77] QGSP_BERT is used for thehadronic physics, EMSTANDARD_OPT3 for the electromag-netic physics and G4DECAYPHYSICS for the particle decays.The pion secondary interactions are handled by the cascademodel in NEUT. The detector readout is simulated with acustom electronics simulation [43].
V. DATA AND EVENT SELECTION
In this analysis, the neutrino-mode data collectedbetween 2010 and 2017 is used, which corresponds to11.6 × 1020 protons on target (POT) and an integratedmuon neutrino flux of 2.2 × 1013=cm2. Events are requiredto have an interaction vertex in the FGD1 fiducial volume(FV), which includes all the XY planes of scintillator exceptfor the most upstream one, and excludes the outermost fivebars on either end of each layer. This leaves the FV with
1−10 1 10Neutrino Energy (GeV)
0
0.02
0.04
0.06
0.08
0.1
0.12
0.14
0.16
0.18
0.2
Fra
ctio
nal E
rror
Updated (Replica target)
Previous
FIG. 4. The fractional error on the muon neutrino flux atND280 as a function of energy used in this analysis (solid) andprevious T2K analyses (dashed).
FIRST T2K MEASUREMENT OF TRANSVERSE KINEMATIC … PHYS. REV. D 103, 112009 (2021)
112009-7

2 × 182 × 14 bars, and a total mass of approximately973 kg. The MC simulation contains simulated dataequivalent to 195.1 × 10²⁰ POT.
A. Signal definition
The goal of this analysis is to characterize nuclear effectsin νμ CC1πþ interactions on carbon using neutrino inter-actions inside FGD1, which is a hydrocarbon (CH) target.Since the CC1πþ production on carbon and on hydrogencannot be clearly separated, the combined cross section onCH is measured, with the TKI variables on hydrogencalculated in the same way as on carbon: for hydrogensignal events, in which there are no nuclear effects, it isexpected that δpTT ¼ 0 and pN ≈ hϵip=c ≈ 26 MeV=c. δαTis undefined for interactions on hydrogen because δpT ¼ 0.A flat distribution across 0–180° is assigned because itresembles the real δαT distribution due to the small butnonvanishing isotropic thermal motion of a free proton.To ensure the cross section results are not dependent on the
signalmodel used in the reference T2K simulation, extensiveprecautions are taken in the analysis. A crucial one is to havethe signal definition only be reliant on observables exper-imentally accessible to ND280. Therefore, the signal isdefined as any event with one μ−, one πþ and no othermesons, and at least one proton in the final state, so that thereis no need to account for the pion and proton FSI. In the casewhere there are multiple protons emitted, only the highestmomentum proton is used in the TKI calculation and very
likely this would result in a large imbalance in all the TKIvariables. In this way we can better separate the contributionfrom different nuclear effects. This also reduces the possiblebias from detector reconstruction where the low energyprotons are not visible in the detector. Hereafter, the signaltopology is denoted as CC1πþXp, where X ≥ 1. In order tomitigate model dependence in the efficiency correction,phase-space restrictions are applied in the signal definitionto restrict the measurement to the regions of kinematic phasespace ND280 is sensitive to. These restrictions are defined inTable I.However, the consideration of three-particle final states
in this analysis necessitates the inclusion of a high dimen-sional kinematic phase space over which the efficiencycannot be kept entirely flat with simple phase-spaceconstraints. This leads to a potential source of bias fromthe input neutrino interaction model predictions. To alle-viate this concern, additional model uncertainties are added(discussed in Sec. VI B) to allow a variation of the inputsimulation in regions of the underlying particle kinematicswhere the efficiency is not flat. The size of this uncertaintyroughly double the largest variation in the efficiency seenfrom a wide variety of different generator predictions(broadly spanning those shown in Sec. VII A).We select one signal sample for the events of interest,
and four control samples to constrain the number ofbackground events in the signal sample. The five samplesare shown schematically in Fig. 5.
B. Signal sample selection
The signal sample contains neutrino events with exactlyone μ− track, one πþ track, and at least one proton track,maximizing the number of signal events selected withminimal background.The selection starts by searching for a good quality μ−
track. Events within a 120 ns time window around one ofthe eight bunch centers per 5 μs spill structure of the beamare considered. The highest momentum, negatively chargedtrack originating from the FGD1 FV and making a long
TABLE I. CC1πþXp signal phase-space restrictions for thepost-FSI final-state particles. The angle θ is relative to theneutrino direction. For events with multiple protons, only thehighest momentum proton is considered, and other protons areignored.
Particle Momentum p Angle θ
μ− 250–7000 MeV=c < 70°πþ 150–1200 MeV=c < 70°p 450–1200 MeV=c < 70°
FIG. 5. Schematic representation of the signal sample (left) and control samples (right) selection, together with the number of eventsobserved in data. Details of the selection criteria are described in Secs. V B and V C.
K. ABE et al. PHYS. REV. D 103, 112009 (2021)
112009-8

track through the downstream TPC is chosen to be a μ−
candidate. Other detector activities in or around FGD1 areused as a veto to ensure the μ− track is not a broken segmentof another track from outside the FV. Then a muon PID cutis applied based on the energy loss and momentummeasurement in the TPC as in Ref. [78]. After this stepa νμ CC sample of 90.3% purity is obtained.
Next, all other tracks originating from the FGD1 FV witha long segment in the TPC are classified by the TPC PID.For positively charged tracks, three particle hypotheses areconsidered: πþ, eþ, and proton; for negatively chargedtracks, only two particle hypotheses are considered: π− ande−. Events with exactly one πþ track, and at least oneproton track are selected. Those with π− or e� are rejected
TABLE II. Kinematic cuts for the reconstructed particles in theanalysis samples. The particle type and kinematics are thereconstructed quantities. The angle θ is relative to the neutrinodirection. For events with multiple reconstructed protons, onlythe highest momentum proton is considered, and other protonsare ignored.
Particle Momentum p Angle θ
μ− 225–7700 MeV=c < 70°πþ 135–1320 MeV=c < 70°p 405–1320 MeV=c < 70°
TABLE III. Analysis bin edges for the CC1πþXp cross sectionsas a function of the TKI variables. The signal sample is binned inone of the reconstructed TKI variables vs reconstructed pp. Thecontrol samples are binned in the reconstructed TKI variableonly.
Variable Number of bins Bin edges
δpTT (MeV=c) 5 −700;−300;−100; 100; 300; 700pN (MeV=c) 4 0,120,240,600,1500δαT (deg) 3 0,60,120,180pp (MeV=c) 6 405,575,700,825,950,1075,1320
(MeV/c)TT
pδReconstructed
600− 400− 200− 0 200 400 600
Eve
nts
per
bin
0
50
100
150
200
250
(MeV/c)N
pReconstructed0 200 400 600 800 1000 1200 1400
Eve
nts
per
bin
0
20
40
60
80
100
120
140
160
180
200
Data ( 0.6%)πCC00p ( 0.7%)+πCC11p (53.6%)+πCC1Np ( 7.5%)+πCC1
( 7.4%)-π1+πCC1 ( 8.0%)0πX+πCC1
( 2.2%)0πCC-other-X ( 3.4%)0πCC-other-0 ( 6.2%)eν,eν,μνNC,
OOFV ( 1.1%)OOPS ( 9.4%)
(deg)TαδReconstructed
0 20 40 60 80 100 120 140 160 180
Eve
nts
per
bin
0
50
100
150
200
250
(MeV/c)p
pReconstructed500 600 700 800 900 1000 1100 1200 1300
Eve
nts
per
bin
0
20
40
60
80
100
FIG. 6. Distribution of events in the signal sample as a function of the reconstructed TKI variables and highest proton momentum,broken down into true final-state topology predicted by the nominal MC simulations. The legend shows the fraction of events in all plots.Histograms are stacked. The MC simulation has been normalized to 11.6 × 10²⁰ POT, the equivalent number of POT collected for thedata. The error bars show the statistical uncertainty in data.
FIRST T2K MEASUREMENT OF TRANSVERSE KINEMATIC … PHYS. REV. D 103, 112009 (2021)
112009-9

because they are likely to be the products of DIS or otherbackground interactions.Additional pions are identified in FGD1 and the tracker
ECAL. Tracks fully contained inside FGD1 are classified
into pions or protons if the energy deposition and range areconsistent with the corresponding particle hypotheses.Michel electrons [79] are also identified by looking fora time-delayed FGD1 hit cluster, and are regarded as
(MeV/c)TT
pδReconstructed600− 400− 200− 0 200 400 600
Eve
nts
per
bin
0
10
20
30
40
50
60
enriched-π1+πCC1
(MeV/c)N
pReconstructed0 200 400 600 800 100012001400
Eve
nts
per
bin
0
20
40
60
80
100
enriched-π1+πCC1
(deg)TαδReconstructed0 20 40 60 80 100 120 140 160 180
Eve
nts
per
bin
0
20
40
60
80
100
120
140
enriched-π1+πCC1Data
( 0.4%)πCC0
0p ( 1.1%)+πCC1
1p ( 2.3%)+πCC1
Np ( 0.8%)+πCC1
(31.9%)-π1+πCC1
( 3.8%)0πX+πCC1
(22.9%)0πCC-other-X
(25.7%)0πCC-other-0
( 6.1%)eν,eν,μνNC,
OOFV ( 2.1%)
OOPS ( 3.0%)
(MeV/c)TT
pδReconstructed600− 400− 200− 0 200 400 600
Eve
nts
per
bin
0
20
40
60
80
100
120
140
enriched0πX+πCC1
(MeV/c)N
pReconstructed0 200 400 600 800 100012001400
Eve
nts
per
bin
0
204060
80100
120140160
180200220
enriched0πX+πCC1
(deg)TαδReconstructed0 20 40 60 80 100 120 140 160 180
Eve
nts
per
bin
0
50
100
150
200
250
300
enriched0πX+πCC1Data
( 0.4%)πCC0
0p ( 1.2%)+πCC1
1p (12.2%)+πCC1
Np ( 2.1%)+πCC1
( 7.5%)-π1+πCC1
(29.5%)0πX+πCC1
(19.1%)0πCC-other-X
( 9.7%)0πCC-other-0
(11.1%)eν,eν,μνNC,
OOFV ( 2.2%)
OOPS ( 5.0%)
(MeV/c)TT
pδReconstructed600− 400− 200− 0 200 400 600
Eve
nts
per
bin
0
10
20
30
40
50
60
70
80
90
enriched0πCC-other-X
(MeV/c)N
pReconstructed0 200 400 600 800 100012001400
Eve
nts
per
bin
0
20
40
60
80
100
120
140
160
180
enriched0πCC-other-X
(deg)TαδReconstructed0 20 40 60 80 100 120 140 160 180
Eve
nts
per
bin
0
50
100
150
200
250
enriched0πCC-other-XData
( 0.2%)πCC0
0p ( 0.6%)+πCC1
1p ( 0.3%)+πCC1
Np ( 0.1%)+πCC1
(11.7%)-π1+πCC1
( 7.7%)0πX+πCC1
(46.1%)0πCC-other-X
(21.1%)0πCC-other-0
( 9.2%)eν,eν,μνNC,
OOFV ( 1.9%)
OOPS ( 1.2%)
(MeV/c)TT
pδReconstructed600− 400− 200− 0 200 400 600
Eve
nts
per
bin
0
5
10
15
20
25
30
35 enriched0πCC-other-0
(MeV/c)N
pReconstructed0 200 400 600 800 100012001400
Eve
nts
per
bin
0
10
20
30
40
50
60
enriched0πCC-other-0
(deg)TαδReconstructed0 20 40 60 80 100 120 140 160 180
Eve
nts
per
bin
0
20
40
60
80
100
enriched0πCC-other-0Data
( 0.3%)πCC0
0p ( 1.0%)+πCC1
1p ( 1.2%)+πCC1
Np ( 0.6%)+πCC1
( 7.7%)-π1+πCC1
( 4.5%)0πX+πCC1
(27.8%)0πCC-other-X
(45.5%)0πCC-other-0
( 6.8%)eν,eν,μνNC,
OOFV ( 1.5%)
OOPS ( 3.0%)
FIG. 7. The distribution of events in the four control samples (top to bottom) as a function of reconstructed TKI variables (left to right),broken down into true final-state topology predicted by the nominal MC simulation. The legends show the fraction of events in eachcontrol sample. Histograms are stacked. The MC simulation has been normalized to 11.6 × 10²⁰ POT, the equivalent number of POTcollected for the data. The error bars show the statistical uncertainty in data.
K. ABE et al. PHYS. REV. D 103, 112009 (2021)
112009-10

products of the pion-muon-electron decay chain. Thetracker-ECAL is employed to identify isolated objects thatare consistent with a photon shower, and tags these asproducts of π0 → 2γ decay. Events with additional chargedpions in FGD1 or π0 in the ECAL are rejected.In the final step, events with additional tracks in FGD1
(either the fully contained tracks that are not classified, orthe non-fully contained tracks without TPC PID) arerejected to reduce the low energy pion backgrounds thatare missed by the pion selection processes. Then we requirethe μ−, πþ, and p tracks to have their starting positions to bewithin a box of 50 mm × 50 mm × 30 mm in the XY and Zplanes. This ensures the tracks are coming from the sameinteraction vertex. Events that are not reconstructed to havematched the kinematic requirements in Table II are put intoan out-of-phase-space (OOPS) bin. Compared to the signaldefinition in Table I, the kinematic cuts have slightly largerranges in momenta to compensate for the finite momentumresolution. The extremely good angular resolution (about1°) allows us to use the same angular restriction.Following the signal sample identification, the selected
events (except the OOPS bin) are binned in one of thereconstructed TKI variables and the reconstructed highestproton momentum, pp. The binning in TKI variables is thesame as that used in the cross section extraction in Sec. VI.The binning in pp helps to correct for the bias in estimatingselection efficiencies. The binning in pp is chosen overother kinematic variables because nucleon emission fromneutrino interactions is less understood than pion or muonemission. In addition, the TPC proton detection threshold isaround 400 MeV, which might significantly affect theefficiency. Table III summarizes the signal sample binning.The CC1πþXp cross sections are measured as a function ofa single TKI variable only, thus the number of recon-structed bins is much more than the number of cross sectionbins. For example, in the δpTT measurement, there are sixpp bins for each of the five δpTT bins in the signal sample.In total there are 6 × 5 ¼ 30 signal sample bins to extractthe differential cross sections in five bins of δpTT .Figure 6 shows the distribution of the reconstructed TKI
variables and pp in the signal sample (without the OOPSbin). A total of 366 events are observed in data. The overallsignal selection efficiency is around 14%. When brokendown by final-state topology, the total CC1πþ1p (oneproton) and CC1πþNp (multiple protons) signal purity is61.1%. The four categories of CC-other events withmultiple pions in the final state, CC1πþ1π−, CC1πþXπ0,CC-other-Xπ0, and CC-other-0π0, are mostly produced byDIS interactions and are the dominant backgrounds. Detailson how to constrain these backgrounds are described inSec. V C. There are also small amounts of neutral current(NC) and νμ=νe=νe events where a π−=e− is misidentifiedas a μ−. In most cases the misidentification comes fromNC interactions. The contribution from out-of-fiducial-volume (OOFV) events is almost negligible. The OOPS
background in Fig. 6 refers to CC1πþXp events which donot satisfy the phase-space restrictions in Table I, and theseparated OOPS bin is used to constrain this background.
C. Control sample selection
To better constrain the CC-other background in thesignal sample, dedicated control samples (on the right ofFig. 5) are selected based on the number of charged andneutral pions identified in the events. Following the FGD1-TPC μ−, πþ and p tracks selection described in Sec. V B,the control samples require the identification of additionalπ� tracks in the FGD/TPC or the identification of a π0 inthe tracker ECAL. These events are then classified into foursamples according to the additional identified pions:
(i) CC1πþ1π− enriched sample—events with one π−
candidate from FGD1 or the TPC.(ii) CC1πþXπ0 enriched sample—events with π0 can-
didates from the ECAL;(iii) CC-other-Xπ0 enriched sample—eventswith charged
pion candidates from FGD1 or the TPC, and π0
candidates from the ECAL.(iv) CC-other-0π0 enriched sample—events with charged
pion candidates fromFGD1or the TPC, excluding thecase of single π− candidate.
The four separate samples allow for better characterizationof the pion emission model and detector responses todifferent particles compared to a single CC-other sample.The same kinematic cuts in Table II are applied to the μ−,highest momentum πþ and p tracks, and the TKI variablesare calculated using only these tracks. The selected eventsare binned in the reconstructed TKI variable only, using thesame binning in Table III. Figure 7 shows the reconstructedTKI variable distributions for the four control samples. Thenominal MC simulation shows a deficit of events and alsosome shape discrepancies with respect to data, indicatingthe need for background correction.
VI. ANALYSIS METHOD
A. Binned likelihood fitting
The analysis is performed using an unregularized binnedlikelihood fit as in Refs. [26,61,62,78,80], with controlsamples to constrain the background, to unfold the detectorsmearing and extract the number of selected signal eventsfrom the signal sample. Compared to previous cross sectionanalyses, significant improvements have been achieved inthe analysis framework, including the use of principlecomponent analysis to reduce the dimensionality of the fit,and the proper treatment of MC statistical uncertainties. Anunregularized fit means that there is no prior constraint onthe shape of TKI from the input signal model, thus reducingmodel bias on the fitted cross sections. The numbers ofsignal events (and thus cross sections) as a function of thethree TKI variables are fitted independently in this study.
FIRST T2K MEASUREMENT OF TRANSVERSE KINEMATIC … PHYS. REV. D 103, 112009 (2021)
112009-11

The input MC simulation is varied by a set of fitparameters, and the set of parameters which best describesthe observed data is extracted together with its associatederrors. The fit parameters of primary interest are the “signaltemplate parameters,” ci, which scale the number of signalevents in the truth TKI variable bin i without priorconstraints. The remaining parameters are the nuisanceparameters that describe plausible systematic variations ofthe flux, detector response and neutrino interaction model.The effect of these parameters is propagated to the numberof selected events in the reconstructed bins.The best-fit parameters are found by minimizing the
following negative log-likelihood (χ2):
χ2 ¼ −2 logðLÞ ¼ −2 logðLstatÞ − 2 logðLsystÞ; ð11Þ
where
χ2stat¼−2logðLstatÞ;
¼Xreco:binsj
2
�βjNMC
j −Nobsj þNobs
j logNobs
j
βjNMCj
þðβj−1Þ22σ2j
�;
ð12Þ
and
χ2syst ¼ −2 logðLsystÞ;¼ ðasyst − asystpriorÞTðVsyst
cov Þ−1ðasyst − asystpriorÞ: ð13Þ
Equation (12) is the modified Poisson likelihood ratiowhich includes the statistical uncertainty of finite MCstatistics using the Barlow-Beeston method [81,82]. NMC
j
and Nobsj are the number of events in each reconstructed bin
j, for MC simulation and data respectively. βj is theBarlow-Beeston scaling parameter given by
βj ¼1
2
�−ðNMC
j σ2j − 1Þ þffiffiffiffiffiffiffiffiffiffiffiffiffiffiffiffiffiffiffiffiffiffiffiffiffiffiffiffiffiffiffiffiffiffiffiffiffiffiffiffiffiffiffiffiffiffiffiffiffiðNMC
j σ2j − 1Þ2 þ 4Nobsj σ2j
q �;
ð14Þ
and σ2j is the relative variance ofNMCj . In the limit of infinite
MC statistics, σj → 0 and βj → 1 which gives the standardPoisson likelihood ratio. Equation (13) describes how wellthe nuisance parameters asyst agree with their prior valuesasystprior, where Vsyst
cov is the covariance matrix describing theconfidence in the prior values as well as correlationsbetween parameters.The MC prediction NMC
j in the signal and controlsamples is composed of both the signal and backgroundevents, which can be written as
NMCj ¼
Xtrue bins
i
ðciwsigi;j N
sigi;j þ wbkg
i;j Nbkgi;j Þ; ð15Þ
where Nsigi;j and Nbkg
i;j are the number of signal and back-ground events in the truth bin i, contributing to thereconstructed bin j, predicted by the T2K MC simulation;wsigi;j and wbkg
i;j are the event weights coming from the sameset of systematic variations and thus are correlated.
B. Sources of systematic uncertainties
Three sources of systematic uncertainties are consideredin this analysis.(1) Neutrino flux uncertainty. This is parametrized as
scale factors in bins of true neutrino energy (samebinning as in Fig. 4). Such scale factors are con-strained by their prior uncertainty, encoded in acovariance matrix. At the same energy, identicalevent weights are applied on the signal and back-ground events.
(2) Detector uncertainty. The detector response (effi-ciency and resolution) is not perfectly modeled inthe simulation. Dedicated and independent controlsamples are used to evaluate each possible uncer-tainty based on the data-MC agreement. The overalldetector uncertainty is parametrized as a covariancematrix that describes the rate uncertainty and corre-lation between each reconstructed bin. The uncer-tainty related to the modeling of the pion secondaryinteractions, one of the largest detector systematicsin previous T2K analyses, has been reduced byaround 40% using external data and the cascademodel implemented in NEUT [75]. In the signalsample and control samples without reconstructedπ0, the biggest uncertainty comes from the modelingof proton secondary interactions which causes a 5%uncertainty on the event rate. On the other hand, π0-tagging uncertainty is dominant (around 10%) in thecontrol samples with reconstructed π0.
(3) Neutrino interaction model uncertainty. This takescare of both the modeling of signal and backgroundinteractions, including FSI. In this analysis, theestimation of signal efficiency and backgroundcontamination are most significantly affected bythe RES and DIS processes. In the RES channel,there are three model parameters: the resonant axialmass MRES
A (1.07� 0.15 GeV=c2), the value of theaxial form factor at zero transferred four-momentumCA5 (0.96� 0.15), and the normalization of the
isospin nonresonant component I1=2 (0.96� 0.40)predicted in the Rein-Sehgal model. Initial centralvalues and uncertainties for these parameters areobtained in a fit to low energy neutrino-deuteriumsingle pion production data from ANL [83,84] and
K. ABE et al. PHYS. REV. D 103, 112009 (2021)
112009-12

BNL [85–87] (flux-corrected data in Ref. [88] isused), and carbonlike data from MiniBooNE [89].One additional parameter varying the Δþþ decaywidth with 50% uncertainty, and ad hoc scaleparameters binned in signal particle momenta andangles with a 20% uncertainty, are included to giveextra freedom to the efficiency correction. Thead hoc variations are chosen to cover the efficiency’sdependency on the initial state nuclear mediumeffects, which is not otherwise parametrized. Inthe DIS channel, a CC-other shape parameterxCC-Other with a 40% uncertainty is used, whichscales the cross section by ð1þ xCC-Other=EνÞ andgives greater flexibility at low Eν. Four normaliza-tion parameters with a 50% uncertainty, with thesame categorization as the four CC-other topologies,are introduced to better parametrize multiple pionproduction. The neutral current and electron (anti)neutrino interactions, which are not constrained bythe control samples, are given a normalizationuncertainty of 30% and 3%, respectively. Finally,there are parameters varying the pion and protonFSI. The tunable pion interactions in the nucleus arecharge exchange, where the charge of the pionchanges; absorption, where the pion is absorbedthrough two- or three-body processes; elastic scat-tering, where the pion only exchanges momentumand energy; and inelastic scattering, where addi-tional pions are produced. Their prior is given byRef. [75]. For proton FSI, there is a single parameterscaling the overall interaction probability inside thecascade with a 50% uncertainty, without tuningspecific processes. It is verified that with suchcomprehensive list of parameters, the fit can coverthe bias in signal efficiency and background sub-traction under extreme model variations as discussedin Sec. VI C.
C. Cross section extraction,error propagation, and validation
After the number of signal events is extracted from thefit, the differential cross section as a function of the trueTKI variable is calculated by the following formula:
dσdxi
¼ Nsignali
ϵiΦNFVnucleonsΔxi
; ð16Þ
whereNsignali is the measured number of signal events in the
ith bin, for all CC1πþXp events on hydrocarbon satisfyingthe kinematic phase restrictions in Table I. Interactions onother elements are estimated by MC simulation andsubtracted. Since the fraction of nonhydrocarbon eventsis small, the potential bias due to cross section or detectormismodeling is insignificant. ϵi is the selection efficiency inthe ith bin, contributed by both the signal and controlsamples.Φ is the overall flux integral, evaluated at the best-
fit flux parameter values, and NFVnucleons is the number of
target nucleons (only hydrocarbon) in the fiducial volume.xi is one of the TKI variables, and Δxi is the bin width.We use a similar method as in Refs. [26,90] to numeri-
cally propagate the uncertainty of the fit to the cross sectionresult, assuming the uncertainties of the fit parameters andcross sections are part of a Gaussian distribution. Thecovariance matrix of the fit parameters is Cholesky decom-posed and multiplied by a vector of Gaussian randomnumbers to generate a set of random parameters. Theserandom parameters are added to the best-fit parameters tocreate 2000 sets of variations (“toys”) of parameters. Thiseffectively samples the likelihood space encoded in thecovariance matrix, and represents the spread of the plau-sible parameters according to the statistical and systematicuncertainties from the fit. For each toy, all variables inEq. (16) (except Δxi), and thus dσ
dxi, are reevaluated with the
toy parameters. The flux integral and selection efficiencyare changed by the toy parameters. The resultant uncer-tainty of the flux integral is around 5%, and Fig. 8 showsthe mean values and uncertainties of the efficiencyextracted from toys. The number of target nucleonsNFV
nucleons is sampled independently with a mean value of5.5 × 1029 and an uncertainty of 0.67% [54]. Finally, acovariance matrix V of dσ
dxiis built from such toys. This
method is different from the one used in previous analyses[61,62], where the uncertainty was estimated by repeatingthe fit many times with toys of input MC simulations.To ensure our results are not biased, a plethora of mock
data studies with alternative neutrino event generators,nuclear ground state models, background models andaltered flux models have been performed. It has beenverified that even in the case of extreme deviations from theinput MC model, such as doubling the signal/backgroundinteractions or completely turning off the FSI, the crosssection extraction method employed can always recover thetruth values to within a 1σ uncertainty. The fit performancefor every mock data study has been quantified by comput-ing the postfit p value. First, 1000 sets of MC data samplesare produced as a result of statistical and systematicvariations of the nominal MC data, which are then fittedto build the distribution of the postfit χ2 [Eq. (11)]. The pvalue for each mock data study has been computed fromthis distribution and an acceptance threshold of 5% hasbeen chosen to quantify good fitter performances. All themock data studies performed (without applying statisticalfluctuations) have a p value around 90%, showing that themodel differences are well covered by the conservativesystematic uncertainties. On the other hand, the agreementon the measured cross sections is quantified by the χ2totstatistic:
χ2tot ¼Xi
Xj
�dσtruth
dxi−dσmeas
dxi
�
· ðV−1Þij�dσtruth
dxj−dσmeas
dxj
�; ð17Þ
FIRST T2K MEASUREMENT OF TRANSVERSE KINEMATIC … PHYS. REV. D 103, 112009 (2021)
112009-13

where σmeas is the measured cross section, and σtruth is thetruth cross section in the mock data. All mock data fitsreturn a χ2tot/ndof less than 0.4, where ndof is the number ofdegrees of freedom, and a p value greater 80%, showing therobustness of the cross section extraction method employedfor this analysis.
VII. RESULTS
Figures 9–11 show the distributions of the reconstructedevents in the signal and control samples, together with the
prediction from the prefit and postfit MC predictions.Overall, the fit is able to reproduce the observed distribu-tions, with a p value greater than 10% for all the TKIvariable fits, and is qualified to have a good data-MCagreement in the presence of statistical fluctuations. Allnuisance parameters are fitted within their prior uncertain-ties. The normalization difference in control samples beforethe fit is well covered by the nuisance parameters, mostlythrough the CC-other normalization parameters. In thesignal sample, there are few bins of reconstructed pp wherethe postfit χ2stat is worse than the prefit one. This indicatesthere might not be enough freedom in the shape of thesignal particle kinematics. However, from the mock datastudies, it is concluded that the potential bias is muchsmaller than the statistical uncertainty and has little impacton this analysis.Figure 12 estimates the uncertainties of the cross sections
as a function of the TKI variables, together with thecorrelation between bins. Contributions from each kindof systematic uncertainties are estimated by running the fitwith only the relevant nuisance parameters. As expected,the statistical error is much larger than the individual orcombined systematic uncertainties. The largest systematicuncertainties are those related to the neutrino interactionmodel, which affect both the signal selection efficiency andbackground estimation. The bin-by-bin correlation in δαTis larger than that in δpTT and pN because the cross sectionon hydrogen is uniform across all bins of δαT .
A. Comparisons to models
In the following, the measured cross sections arecompared to different neutrino interaction models. Theagreement is quantified by the χ2tot statistic in Eq. (17), withσtruth replaced by the model prediction σmodel.On the other hand, the overall normalization uncertainty,
which is fully correlated between bins, may constitute arelatively large fraction of the uncertainty. Therefore, theχ2tot statistics may suffer from “Peelle’s pertinent puzzle”[91,92], in which the assumption in Eq. (17) that thevariance is distributed as a multivariate Gaussian may notbe valid for highly correlated results. To mitigate thisproblem, the shape only χ2shape is also provided:
χ2shape ¼Xi
Xj
�dσmodel
dxi
1
σmodelint
−dσmeas
dxi
1
σmeasint
�
· ðW−1Þij�dσmodel
dxj
1
σmodelint
−dσmeas
dxj
1
σmodelmeas
�; ð18Þ
where σmodelint and σmeas
int are the total integrated cross sectionsper nucleon estimated from the model and data, respec-tively. The shape only covariance matrix W is built by thesame method as described in Sec. VI C but on the shapevariable dσmeas
dxi1
σmeasint
instead. It is important to notice that the
(MeV/c)TT
pδ600− 400− 200− 0 200 400 600
Eff
icie
ncy
0
0.02
0.04
0.06
0.08
0.1
0.12
0.14
0.16
0.18
(MeV/c)N
p0 200 400 600 800 1000 1200 1400
Eff
icie
ncy
0
0.02
0.04
0.06
0.08
0.1
0.12
0.14
0.16
0.18
0.2
(deg)Tαδ0 20 40 60 80 100 120 140 160 180
Eff
icie
ncy
0
0.02
0.04
0.06
0.08
0.1
0.12
0.14
0.16
0.18
FIG. 8. Mean values and uncertainties of the selection effi-ciencies as a function of the TKI variables. The error bars includeboth the statistical and systematic uncertainties propagated fromthe fit.
K. ABE et al. PHYS. REV. D 103, 112009 (2021)
112009-14

(MeV/c)TT
pδReconstructed600− 400− 200− 0 200 400 600
Eve
nts
per
bin
0
10
20
30
40
50<575MeV/c
pSignal sample, 405MeV/c<p
=10.9stat2χPrefit
= 4.3stat2χPostfit
Data
Prefit
Postfit
(MeV/c)TT
pδReconstructed600− 400− 200− 0 200 400 600
Eve
nts
per
bin
0
10
20
30
40
50
<700MeV/cp
Signal sample, 575MeV/c<p
=12.9stat2χPrefit
=11.6stat2χPostfit
(MeV/c)TT
pδReconstructed600− 400− 200− 0 200 400 600
Eve
nts
per
bin
0
5
10
15
20
25
30
35
40
45
<825MeV/cp
Signal sample, 700MeV/c<p
= 4.5stat2χPrefit
= 0.3stat2χPostfit
(MeV/c)TT
pδReconstructed600− 400− 200− 0 200 400 600
Eve
nts
per
bin
0
5
10
15
20
25
30
35
40
45
<950MeV/cp
Signal sample, 825MeV/c<p
= 3.7stat2χPrefit
= 4.0stat2χPostfit
(MeV/c)TT
pδReconstructed600− 400− 200− 0 200 400 600
Eve
nts
per
bin
0
5
10
15
20
25
<1075MeV/cp
Signal sample, 950MeV/c<p
= 8.9stat2χPrefit
= 4.5stat2χPostfit
(MeV/c)TT
pδReconstructed600− 400− 200− 0 200 400 600
Eve
nts
per
bin
0
5
10
15
20
25
30
<1320MeV/cp
Signal sample, 1075MeV/c<p
= 5.7stat2χPrefit
= 4.1stat2χPostfit
(MeV/c)TT
pδReconstructed
600− 400− 200− 0 200 400 600
Eve
nts
per
bin
0
10
20
30
40
50
60
enriched sample-π1+πCC1
=14.9stat2χPrefit
= 7.5stat2χPostfit
(MeV/c)TT
pδReconstructed
600− 400− 200− 0 200 400 600
Eve
nts
per
bin
0
20
40
60
80
100
120
140
enriched sample0πX+πCC1
= 7.1stat2χPrefit
= 1.1stat2χPostfit
(MeV/c)TT
pδReconstructed
600− 400− 200− 0 200 400 600
Eve
nts
per
bin
0
20
40
60
80
100
enriched sample0πCC-other-X
=18.7stat2χPrefit
= 6.3stat2χPostfit
(MeV/c)TT
pδReconstructed
600− 400− 200− 0 200 400 600
Eve
nts
per
bin
0
5
10
15
20
25
30
35
enriched sample0πCC-other-0
=16.0stat2χPrefit
= 4.6stat2χPostfit
FIG. 9. Distribution of events in the signal and control samples in the δpTT fit. χ2stat corresponds to the statistical contribution of the fitχ2 [Eq. (12)] in that sample. The MC prediction before (dashed) and after (solid) the fit are also shown. The error bars show the statisticaluncertainty in data.
FIRST T2K MEASUREMENT OF TRANSVERSE KINEMATIC … PHYS. REV. D 103, 112009 (2021)
112009-15

(MeV/c)N
pReconstructed0 200 400 600 800 1000 1200 1400
Eve
nts
per
bin
0
5
10
15
20
25
30
35
<575MeV/cp
Signal sample, 405MeV/c<p
= 8.5stat2χPrefit
= 1.7stat2χPostfit
Data
Prefit
Postfit
(MeV/c)N
pReconstructed0 200 400 600 800 1000 1200 1400
Eve
nts
per
bin
0
5
10
15
20
25
30
35
40
<700MeV/cp
Signal sample, 575MeV/c<p
= 3.2stat2χPrefit
= 3.9stat2χPostfit
(MeV/c)N
pReconstructed0 200 400 600 800 1000 1200 1400
Eve
nts
per
bin
0
10
20
30
40
50
<825MeV/cp
Signal sample, 700MeV/c<p
= 5.2stat2χPrefit
= 0.7stat2χPostfit
(MeV/c)N
pReconstructed0 200 400 600 800 1000 1200 1400
Eve
nts
per
bin
0
5
10
15
20
25
30
35
<950MeV/cp
Signal sample, 825MeV/c<p
= 0.3stat2χPrefit
= 1.0stat2χPostfit
(MeV/c)N
pReconstructed0 200 400 600 800 1000 1200 1400
Eve
nts
per
bin
0
5
10
15
20
25
30
<1075MeV/cp
Signal sample, 950MeV/c<p
=11.7stat2χPrefit
= 4.9stat2χPostfit
(MeV/c)N
pReconstructed0 200 400 600 800 1000 1200 1400
Eve
nts
per
bin
0
5
10
15
20
25
30
35
40
45<1320MeV/c
pSignal sample, 1075MeV/c<p
= 9.2stat2χPrefit
= 4.4stat2χPostfit
(MeV/c)N
pReconstructed0 200 400 600 800 1000 1200 1400
Eve
nts
per
bin
0
20
40
60
80
100
120
enriched sample-π1+πCC1
=13.2stat2χPrefit
= 6.0stat2χPostfit
(MeV/c)N
pReconstructed0 200 400 600 800 1000 1200 1400
Eve
nts
per
bin
020406080
100120140160180200220240
enriched sample0πX+πCC1
=17.5stat2χPrefit
= 1.3stat2χPostfit
(MeV/c)N
pReconstructed0 200 400 600 800 1000 1200 1400
Eve
nts
per
bin
0
20
40
60
80
100
120
140
160
180
200
enriched sample0πCC-other-X
= 9.6stat2χPrefit
= 0.7stat2χPostfit
(MeV/c)N
pReconstructed0 200 400 600 800 1000 1200 1400
Eve
nts
per
bin
0
10
20
30
40
50
60
enriched sample0πCC-other-0
=18.5stat2χPrefit
= 7.5stat2χPostfit
FIG. 10. Distribution of events in the signal and control samples in the pN fit. χ2stat corresponds to the statistical contribution of the fitχ2 [Eq. (12)] in that sample. The MC predictions before (dashed) and after (solid) the fit are also shown. The error bars show thestatistical uncertainty in data.
K. ABE et al. PHYS. REV. D 103, 112009 (2021)
112009-16

(deg)TαδReconstructed0 20 40 60 80 100 120 140 160 180
Eve
nts
per
bin
0
10
20
30
40
50
<575MeV/cp
Signal sample, 405MeV/c<p
= 4.4stat2χPrefit
= 3.3stat2χPostfit
Data
Prefit
Postfit
(deg)TαδReconstructed0 20 40 60 80 100 120 140 160 180
Eve
nts
per
bin
0
10
20
30
40
50
<700MeV/cp
Signal sample, 575MeV/c<p
= 5.0stat2χPrefit
= 3.5stat2χPostfit
(deg)TαδReconstructed0 20 40 60 80 100 120 140 160 180
Eve
nts
per
bin
0
10
20
30
40
50
<825MeV/cp
Signal sample, 700MeV/c<p
= 0.8stat2χPrefit
= 0.9stat2χPostfit
(deg)TαδReconstructed0 20 40 60 80 100 120 140 160 180
Eve
nts
per
bin
0
5
10
15
20
25
30
35
<950MeV/cp
Signal sample, 825MeV/c<p
= 4.5stat2χPrefit
= 4.2stat2χPostfit
(deg)TαδReconstructed0 20 40 60 80 100 120 140 160 180
Eve
nts
per
bin
0
5
10
15
20
25
<1075MeV/cp
Signal sample, 950MeV/c<p
= 1.6stat2χPrefit
= 1.0stat2χPostfit
(deg)TαδReconstructed0 20 40 60 80 100 120 140 160 180
Eve
nts
per
bin
0
5
10
15
20
25
30
35
<1320MeV/cp
Signal sample, 1075MeV/c<p
= 1.4stat2χPrefit
= 0.5stat2χPostfit
(deg)TαδReconstructed0 20 40 60 80 100 120 140 160 180
Eve
nts
per
bin
0
20
40
60
80
100
120
140
enriched sample-π1+πCC1
= 5.7stat2χPrefit
= 1.1stat2χPostfit
(deg)TαδReconstructed0 20 40 60 80 100 120 140 160 180
Eve
nts
per
bin
0
50
100
150
200
250
300
350 enriched sample0πX+πCC1
= 9.5stat2χPrefit
= 2.5stat2χPostfit
(deg)TαδReconstructed0 20 40 60 80 100 120 140 160 180
Eve
nts
per
bin
0
50
100
150
200
250
300 enriched sample0πCC-other-X
=11.0stat2χPrefit
= 2.4stat2χPostfit
(deg)TαδReconstructed0 20 40 60 80 100 120 140 160 180
Eve
nts
per
bin
0
20
40
60
80
100
enriched sample0πCC-other-0
=11.6stat2χPrefit
= 0.6stat2χPostfit
FIG. 11. Distribution of events in the signal and control samples in the δαT fit. χ2stat corresponds to the statistical contribution of the fitχ2 [Eq. (12)] in that sample. The MC predictions before (dashed) and after (solid) the fit are also shown. The error bars show thestatistical uncertainty in data.
FIRST T2K MEASUREMENT OF TRANSVERSE KINEMATIC … PHYS. REV. D 103, 112009 (2021)
112009-17

ndof is one less for χ2shape compared to χ2tot since the sum ofthe shape variables is equal to one by construction,reducing the number of independent dimensions.To compare the measured cross sections with model
predictions, a sufficiently large number of events aregenerated on hydrocarbon from each model using theT2K flux. Events satisfying the CC1πþXp signaldefinition in Table I are selected to calculate the cross
sections per target nucleon. The number of targetnucleons for each CH is equal to 13, which includes allseven protons and six neutrons. The following models areconsidered.
(i) NEUT version 5.4.0: models implemented inthis event generator are described in Sec. IV. RFGis used as the nuclear ground state for pionproduction.
(MeV/c)TT
pδ600− 400− 200− 0 200 400 600
Frac
tiona
l Err
or
0
0.1
0.2
0.3
0.4
0.5
0.6
1−
0.8−0.6−0.4−
0.2−0
0.2
0.4
0.6
0.8
1
(MeV/c)TT
pδ600− 400− 200− 0 200 400 600
(M
eV/c
)T
Tpδ
600−
400−
200−
0
200
400
600
(MeV/c)N
p0 200 400 600 800 1000 1200 1400
Frac
tiona
l Err
or
0
0.1
0.2
0.3
0.4
0.5
0.6
1−
0.8−0.6−0.4−
0.2−0
0.2
0.4
0.6
0.8
1
(MeV/c)N
p0 200 400 600 800 1000 1200 1400
(M
eV/c
)N
p
0
200
400
600
800
1000
1200
1400
(deg)Tαδ0 20 40 60 80 100 120 140 160 180
Frac
tiona
l Err
or
00.020.040.060.08
0.10.120.140.160.180.2
0.220.24
Statistical + all systematic uncertainties
Statistical uncertainties only
Statistical + cross-section uncertainties
Statistical + flux uncertainties
Statistical + detector uncertainties
1−
0.8−0.6−0.4−
0.2−0
0.2
0.4
0.6
0.8
1
(deg)Tαδ0 20 40 60 80 100 120 140 160 180
(de
g)T
αδ
0
20
40
60
80
100
120
140
160
180
FIG. 12. Error of the measured differential cross sections in each bin (left) and the correlation between bins (right), for the δpTT (top),pN (middle), and δαT (bottom) fit, respectively. The statistical error is shown in red, and the total statistical and systematic error in black.Contributions from each source of systematic uncertainties are shown one by one: neutrino flux in blue, detector in yellow, and neutrinointeraction model in green.
K. ABE et al. PHYS. REV. D 103, 112009 (2021)
112009-18

(ii) GENIE [93,94] version 3.0.6: two model configura-tions are compared: the “BRRFGþ hA” model usesthe G18_01a physics configuration, with the Rein-Sehgal (RS) model for pion production, Bodek-Ritchie empirical corrections of RFG (BRRFG[95,96]) as the nuclear ground state model and
the hA (“empirical”) FSI model; the “LFGþ hN”model uses the G18_10b physics configuration, withthe Berger-Sehgal model [97] for pion production,local Fermi gas (LFG) as nuclear ground state andthe hN (“cascade”) FSI model. For both models, the2018a free nucleon cross section model retune [98]
(MeV/c)TT
pδ600− 400− 200− 0 200 400 600
]-1
(MeV
/c)
2cm
-1 [
Nuc
leon
TT
p δd
σd
0
0.1
0.2
0.3
0.4
0.5
0.6
0.7
0.8
0.9
142−10×
5× 5×
T2K Result
=11.3tot2χNEUT RFG,
= 5.2tot2χGENIE BRRFG+hA,
= 8.6tot2χGENIE LFG+hN,
= 3.6tot2χGiBUU,
(MeV/c)TT
pδ600− 400− 200− 0 200 400 600
]-1
(MeV
/c)
2cm
-1 [
Nuc
leon
TT
pδd
σd
0
0.1
0.2
0.3
0.4
0.5
0.6
0.7
0.8
0.9
142−10×
5× 5×
T2K Result= 7.5
tot2χNuWro RFG,
= 4.9tot2χNuWro BRRFG,
= 8.5tot2χNuWro LFG,
= 5.2tot2χNuWro ESF,
(MeV/c)N
p0 200 400 600 800 1000 1200 1400
]-1
(MeV
/c)
2cm
-1 [
Nuc
leon
Ndp
σd
0
0.1
0.2
0.3
0.4
0.5
0.6
0.7
0.842−10×
5×
T2K Result
=10.8tot2χNEUT RFG,
= 2.9tot2χGENIE BRRFG+hA,
=13.2tot2χGENIE LFG+hN,
= 1.7tot2χGiBUU,
(MeV/c)N
p0 200 400 600 800 1000 1200 1400
]-1
(MeV
/c)
2cm
-1 [
Nuc
leon
Ndp
σd
0
0.1
0.2
0.3
0.4
0.5
0.6
0.7
0.842−10×
5×
T2K Result= 9.0
tot2χNuWro RFG,
= 2.7tot2χNuWro BRRFG,
=11.0tot2χNuWro LFG,
= 3.5tot2χNuWro ESF,
(deg)Tαδ0 20 40 60 80 100 120 140 160 180
]-1
(deg
)2
cm-1
[N
ucle
onT
αδd
σd
0
0.2
0.4
0.6
0.8
1
1.2
1.4
1.6
42−10×T2K Result
= 1.4tot2χNEUT RFG,
= 1.1tot2χGENIE BRRFG+hA,
= 1.6tot2χGENIE LFG+hN,
= 1.2tot2χGiBUU,
(deg)Tαδ0 20 40 60 80 100 120 140 160 180
]-1
(deg
)2
cm-1
[N
ucle
onT
αδd
σd
0
0.2
0.4
0.6
0.8
1
1.2
1.4
1.6
42−10×T2K Result
= 0.6tot2χNuWro RFG,
= 2.7tot2χNuWro BRRFG,
= 2.5tot2χNuWro LFG,
= 3.3tot2χNuWro ESF,
FIG. 13. Measured differential cross sections per nucleon as a function of δpTT (top), pN (middle), and δαT (bottom), together withpredictions from NEUT, GENIE, GiBUU (left), and NuWro (right). In the tails of δpTT and pN (beyond the magenta lines), the cross sectionsare scaled by a factor of 5 for better visualization. The legend also shows the χ2tot from Eq. (17).
FIRST T2K MEASUREMENT OF TRANSVERSE KINEMATIC … PHYS. REV. D 103, 112009 (2021)
112009-19

is used. Specific to pion production, CC1π andCC2π cross section data on deuterium targets fromANL [83,88,99,100], BNL [85,88], BEBC [101–103], and FNAL [104] bubble chamber experimentswere used in the retune. This mostly affects the crosssection normalization (∼15% reduction in total crosssection) and gives much better χ2tot agreement.
(iii) GiBUU [105] version 2019: it uses an LFG-basednuclear ground state to describe all neutrino inter-action modes and FSI consistently. In the RESchannel, 13 resonances are included and the non-resonant contribution is described by a phenomeno-logical model. Rather than a simple cascade model,GiBUU models FSI by solving the dynamical evolu-tion of the particle phase space density in the nuclearmean field potential.
(iv) NuWro [106] version 19.02: four different nuclearground state models are implemented. These includethree Fermi gas models: LFG, RFG, and BRRFG;and an effective approximation of a spectral function(ESF) [107]. The Adler-Rarita-Schwinger single Δmodel [108,109] is used for RES, and the FSIcascade model is based on the Metropolis algorithm[110].
Figure 13 shows the comparisons between the measuredcross sections and model predictions. The full χ2tot andshape only χ2shape are summarized in Table IV. It is observedthat χ2shape is usually much smaller than χ2tot, implying alarge part of the model separation power in this analysiscomes from normalization differences.
B. Discussion
Amongst all the models compared, GiBUU shows margin-ally better agreement with data. Both χ2tot and χ2shape aresmaller than the corresponding ndof for each TKI variable.It is explained in Ref. [111] that GiBUU uses a density- andmomentum-dependent mean field to model the nucleon-nucleus potential and prepare the nuclear ground state.Since the same potential is used in all interaction channels,it may provide a more accurate prediction than othergenerators which often treat QE and pion productionprocesses differently. Also GiBUU’s modeling of FSI inthe transport theory is a more complete approach than thecommonly used cascade models, which might be a con-tributing factor to the overall agreement. The nice shapeagreement at low pN suggests that the nuclear ground statemodeling in GiBUU is better than other generators. The tailis mostly contributed by FSI where all models have similarpredictions in the phase space we probe.Within the NuWro models, ESF and BRRFG have better
agreement than LFG and RFG. In the pion channel, thesenuclear models affect properties like the removal energyand nucleon momentum distribution. This suggests thatESF and BRRFG may provide a more realistic nuclearground state description. From the pN result, the
characteristic nucleon momentum peak at the Fermi surface(∼220 MeV=c) in RFG is strongly disfavored. On thecontrary, LFG predicts a large number of events withpN < 120 MeV=c, which is also incompatible with data.
NEUT RFG, GENIE BRRFG, and GENIE LFG use the sametypes of Fermi gas nuclear ground state models as in NuWro.The choices of pion production and FSI models make adifference in their predictions, but in general the samenuclear ground state model shows similar features acrossgenerators in the small imbalance regions of δpTT and pN .This indicates these observables are a good probe of thenuclear ground state models.In general the model separation in δpTT and pN is better
than that in δαT , with most of the sensitivity coming fromthe central bin of δpTT and the first two bins in pN wherethe imbalance is small. While δαT is rather insensitive to theinitial nuclear state, the hardening of δαT towards 180° isstrongly affected by FSI which usually slow down the final-state hadrons but not the lepton. However, with the presentsignal phase space restrictions, in particular the high protonmomentum threshold of 450 MeV=c, many of theCC1πþXp events that undergo FSI are lost, making themeasurement less effective. With improved detector accep-tance in the coming ND280 upgrade [112], δαT will be anextremely useful and independent probe of FSI.If only χ2shape is considered, then most models have a
χ2shape less than or roughly equal to the ndof. The worst caseis the pN prediction from NuWro RFG which has a p valueof 15%. Nevertheless, the large normalization discrepancyexhibited by the RFG and LFG nuclear ground state modelscannot be simply explained by flux or other normalizationuncertainties. Thus one should be careful in interpreting themodel agreement when the difference between χ2shape andχ2tot is large.It is not straightforward to compare this study to the T2K
CC0π [26] and MINERνA [27,29] TKI results, becauseof the different signal definition and, more importantly,a significant contribution from free nucleon targets
TABLE IV. χ2tot and χ2shape for the three TKI variable measure-ments. The ndof of χ2tot is equal to 5, 4, and 3 for δpTT, pN andδαT , respectively. The ndof of χ2shape is one less than that of χ2tot.
χ2tot (χ2shape)
Generator δpTT pN δαT
NEUT RFG 11.3 (5.1) 10.8 (2.7) 1.4 (0.4)GENIE BRRFGþ hA 5.2 (4.8) 2.9 (2.2) 1.1 (0.5)GENIE LFGþ hN 8.6 (4.2) 13.2 (2.7) 1.6 (0.8)GiBUU 3.6 (3.3) 1.7 (1.3) 1.2 (0.6)NuWro RFG 7.5 (5.9) 9.0 (5.4) 0.6 (0.4)NuWro BRRFG 4.9 (4.2) 2.7 (1.6) 2.7 (1.8)NuWro LFG 8.5 (6.7) 11.0 (4.9) 2.5 (1.7)NuWro ESF 5.2 (5.6) 3.5 (3.0) 3.3 (1.7)
K. ABE et al. PHYS. REV. D 103, 112009 (2021)
112009-20

(hydrogen) in this measurement. For example, Fig. 14shows the interaction target and channel breakdown of theGiBUU prediction. As explained in Sec. VA, the hydrogencross section is a Dirac delta function at δpTT ¼ 0 and
pN ≈ 26 MeV=c, and is flat in δαT . The cross section onhydrogen is related to the carbon component via thecommon neutrino-nucleon cross section modeling; bothcomponents will scale similarly when the neutrino-nucleoncross section is changed. However the ratio between thehydrogen and carbon components is highly dependent onthe modeling of the nuclear medium effects.Qualitatively, almost all models are compatible with the
pN tail in both T2K and MINERνA data, but they have anoverprediction in the peak region. However, there are notsufficient statistics to measure the peak of pN moreprecisely. MINERνA also reported a mild asymmetry inδpTT , and attributed it to the interference between Δ andnonresonant amplitudes [35], but such an asymmetry is notobserved within errors in this study. The tight phase spacerestrictions used in this study reduces our sensitivity to FSImodeling. The rather flat distribution of δαT compared toMINERνA results can be attributed to the difference inphase space restrictions, where MINERνA applied nophase space restriction on the final-state π0. The moreenergetic (∼3 GeV) neutrino beam of MINERνA alsoproduces more energetic final-state particles and a morecurved δαT .While GiBUU has a good agreement with this CC1πþXp
and MINERνA CCπ0 measurements, it shows an incom-patibility with our CC0π TKI results [26,31]. This incom-patibility is not in the δpT [Eq. (6)] tail or normalization,suggesting this might be related to the nuclear ground state.In our previous CC0π cross section measurements as afunction of outgoing muon kinematics [61,62], the GiBUU
prediction also shows a large discrepancy, mainly in themost forward bin where the nuclear physics governing lowenergy and momentum transfer interactions is the mostimportant.
VIII. CONCLUSION
In this paper, the CC1πþXp muon neutrino differentialcross sections on hydrocarbon as a function of the threeTKI variables, δpTT , pN , and δαT , have been measuredindependently in the ND280 tracker. δpTT and pN are mostsensitive to the initial nuclear ground state, and δαT is anindependent probe of FSI. The analysis is performed with ajoint fit between the signal and control samples to minimizethe uncertainties on background estimation, and a maxi-mum likelihood fit is used to unfold the detector smearingeffect and extract cross sections in the truth space. Thereduced flux uncertainty and better detector modeling allowus to have a reduced systematic uncertainty with respect toprevious T2K cross section analyses. Due to the complexand multifaceted nature of this analysis, exceptional carehas been taken in mitigating sources of potential model biasin the extracted results.An extensive comparison of the extracted results to
state-of-the-art neutrino interaction models shows a slightpreference for GiBUU, which uses a more realistic nuclear
(MeV/c)TT
pδ600− 400− 200− 0 200 400 600
]-1
(MeV
/c)
2cm
-1 [
Nuc
leon
TT
p δd
σd
0
0.1
0.2
0.3
0.4
0.5
42−10×
5× 5×
(MeV/c)N
p0 200 400 600 800 1000 1200 1400
]-1
(MeV
/c)
2cm
-1 [
Nuc
leon
Ndp
σd
0
0.1
0.2
0.3
0.4
0.5
42−10×
5×
T2K ResultGiBUUCarbon CCQECarbon DISCarbon RESHydrogen
(deg)Tαδ0 20 40 60 80 100 120 140 160 180
]-1
(deg
)2
cm-1
[Nuc
leon
Tαδ
dσ
d
0
0.2
0.4
0.6
0.8
1
42−10×
FIG. 14. Measured cross sections as a function of the TKIvariables compared to GiBUU predictions. The GiBUU predictionsare decomposed into the contributions from carbon and hydro-gen. In the tails of δpTT and pN (beyond the magenta lines), thecross sections are scaled by a factor of 5 for better visualization.
FIRST T2K MEASUREMENT OF TRANSVERSE KINEMATIC … PHYS. REV. D 103, 112009 (2021)
112009-21

ground state to handle all interaction channels consistently.Our results are statistically limited and a large part ofthe model separation power comes from normalizationdifferences. In general the simple Fermi gas models(RFG and LFG) show a large disagreement in pN withχ2tot=ndof > 2, which indicates a mismodeling of thenucleon Fermi motion. The similar data-MC comparisonto the MINERνA CCπ0 results [29] seems to confirm thatthe mismodeling is general in pion production channels.While the tight phase space restrictions limit our sensitivityto FSI modeling, the relatively flat δαT in T2K results is instrong contrast to MINERνA results, indicating a possibleenergy dependence of hadronic FSI.Future analyses will aim to unfold cross sections in
multiple TKI variables simultaneously and obtain theircorrelations which can then be used to separate effects dueto the initial nuclear state and FSI. The upcoming ND280upgrade is going to expand the measurable phase space,especially in the low energy and high angle regions. Thusthe ND280 upgrade is expected to increase our statisticsand model sensitivity significantly. Another possibleextension is to isolate hydrogen interactions from carbonones by selecting events with small δpTT and pN . Withbetter detector resolution, this technique could betteridentify and separate interactions on hydrogen on anevent-by-event basis, and provide the first “free nucleondata" since the hydrogen bubble chamber experiments[24,37–40].The data release for the results presented in this analysis
is posted in Ref. [113]. It contains the analysis binning, thedifferential cross section best-fit values, and associatedcovariance matrices.
ACKNOWLEDGMENTS
We thank the J-PARC staff for superb acceleratorperformance. We thank the CERN NA61/SHINECollaboration for providing valuable particle productiondata. We acknowledge the support of MEXT, JSPSKAKENHI (Grants No. JP16H06288, No. JP18K03682,No. JP18H03701, No. JP18H05537, No. JP19J01119,No. JP19J22440, No. JP19J22258, No. JP20H00162,No. JP20H00149, and No. JP20J20304) and bilateralprograms (Grants No. JPJSBP120204806 andNo. JPJSBP120209601), Japan; NSERC, the NRC, andCFI, Canada; the CEA and CNRS/IN2P3, France; the DFG(RO 3625/2), Germany; the INFN, Italy; the Ministry ofEducation and Science (Grant No. DIR/WK/2017/05) andthe National Science Centre (Grant No. UMO-2018/30/E/ST2/00441), Poland; the RSF (Grant No. 19-12-00325),RFBR (Grant No. JSPS-RFBR 20-52-50010\20) and theMinistry of Science and Higher Education (Grant No. 075-15-2020-778), Russia; MICINN (Grants No. SEV-2016-0588, No. PID2019–107564 GB-I00, No. PGC2018-099388-BI00) and ERDF funds and CERCA program,Spain; the SNSF and SERI (Grants No. 200021_185012,
No. 200020_188533, and No. 20FL21_186178I),Switzerland; the STFC, UK; and the DOE, USA. We alsothank CERN for the UA1/NOMAD magnet, DESY for theHERA-B magnet mover system, NII for SINET5, theWestGrid and SciNet consortia in Compute Canada, andGridPP in the United Kingdom. In addition, the participa-tion of individual researchers and institutions has beenfurther supported by funds from the ERC (FP7), “la Caixa”Foundation (ID 100010434, fellowship code LCF/BQ/IN17/11620050), the European Union’s Horizon 2020Research and Innovation Programme under the MarieSklodowska-Curie Grants Agreement No. 713673 andNo. 754496, and H2020 Grants No. RISE-GA822070-JENNIFER2 2020 and No. RISE-GA872549-SK2HK; theJSPS, Japan; the Royal Society, UK; French ANR GrantNo. ANR-19-CE31-0001; the DOE Early Career pro-gramme, USA; and RFBR, Project No. 20-32-70196.
APPENDIX A: KINEMATIC VARIABLE PLOTSFOR THE SIGNAL SAMPLE
Figure 15 shows the distributions of the reconstructedparticle momenta and angles in the signal sample, withoutthe OOPS bin. One of the dominant systematic uncer-tainties in this analysis is the model dependence inefficiency correction where the consideration of three-particle final states inevitably includes a high dimensionalkinematic phase space over which the efficiency cannot bekept entirely flat. As illustrated in Fig. 15, no largediscrepancy is seen between the data and MC prediction,therefore the possible bias from efficiency correctionshould be small.
APPENDIX B: MORE MODEL COMPARISONS
This section shows a few more model comparisons todata with different physics configurations in the neutrinogenerators.
1. GENIE
GENIE provides a variety of model configurations forevent generation. Choices in the nuclear ground state modelhave a much larger effect on the TKI predictions than eitherthe FSI models or pion production models. On the otherhand, the GENIE 2018a free nucleon cross section modelretune reduces the CC1π cross sections and increases theCC2π cross sections relative to the baseline tune. Figure 16shows the comparison amongst these model configurationsand physics tunes.
2. NuWro
Within NuWro, the BRRFG and ESF nuclear ground statemodels show the best agreement with data. The FSIconfigurations are varied to study their effects on the
K. ABE et al. PHYS. REV. D 103, 112009 (2021)
112009-22
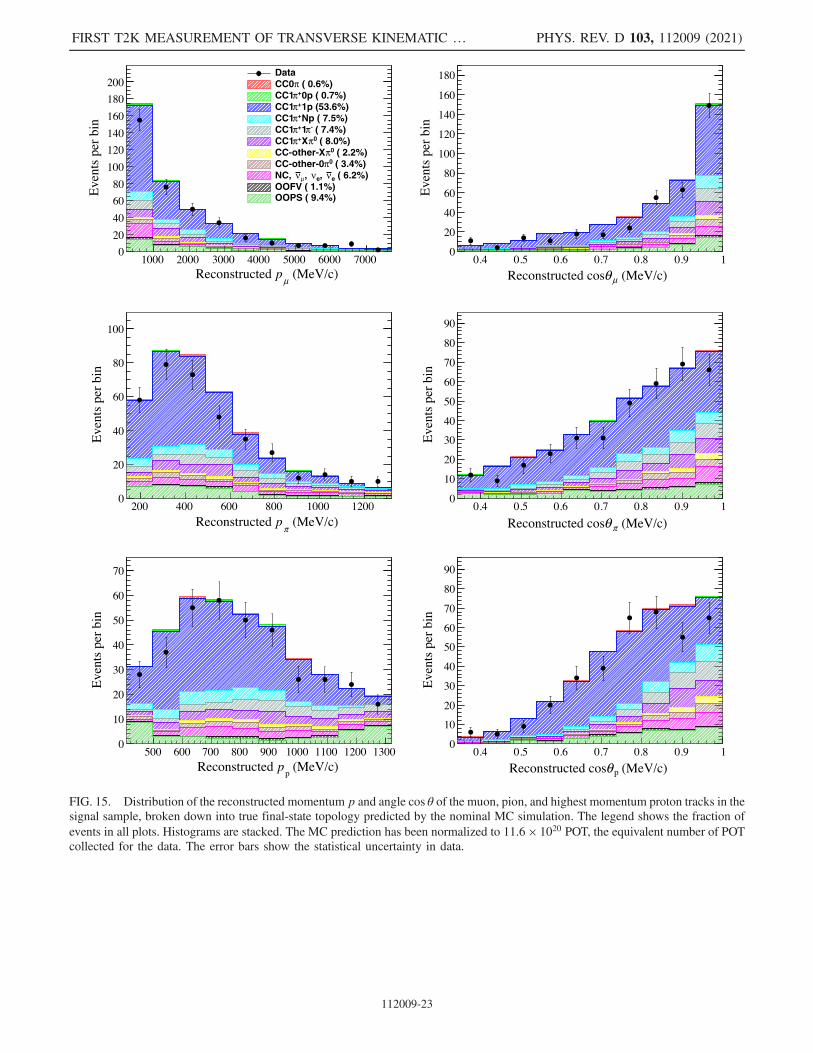
(MeV/c)μpReconstructed1000 2000 3000 4000 5000 6000 7000
Eve
nts
per
bin
0
20
40
60
80
100
120
140
160
180
200Data
( 0.6%)πCC00p ( 0.7%)+πCC11p (53.6%)+πCC1Np ( 7.5%)+πCC1
( 7.4%)-π1+πCC1 ( 8.0%)0πX+πCC1
( 2.2%)0πCC-other-X ( 3.4%)0πCC-other-0 ( 6.2%)eν,eν,μνNC,
OOFV ( 1.1%)OOPS ( 9.4%)
(MeV/c)μθReconstructed cos0.4 0.5 0.6 0.7 0.8 0.9 1
Eve
nts
per
bin
0
20
40
60
80
100
120
140
160
180
(MeV/c)π
pReconstructed200 400 600 800 1000 1200
Eve
nts
per
bin
0
20
40
60
80
100
(MeV/c)πθReconstructed cos0.4 0.5 0.6 0.7 0.8 0.9 1
Eve
nts
per
bin
0
10
20
30
40
50
60
70
80
90
(MeV/c)p
pReconstructed500 600 700 800 900 1000 1100 1200 1300
Eve
nts
per
bin
0
10
20
30
40
50
60
70
(MeV/c)pθReconstructed cos0.4 0.5 0.6 0.7 0.8 0.9 1
Eve
nts
per
bin
0
10
20
30
40
50
60
70
80
90
FIG. 15. Distribution of the reconstructed momentum p and angle cos θ of the muon, pion, and highest momentum proton tracks in thesignal sample, broken down into true final-state topology predicted by the nominal MC simulation. The legend shows the fraction ofevents in all plots. Histograms are stacked. The MC prediction has been normalized to 11.6 × 10²⁰ POT, the equivalent number of POTcollected for the data. The error bars show the statistical uncertainty in data.
FIRST T2K MEASUREMENT OF TRANSVERSE KINEMATIC … PHYS. REV. D 103, 112009 (2021)
112009-23

(MeV/c)TT
pδ600− 400− 200− 0 200 400 600
]-1
(MeV
/c)
2cm
-1 [
Nuc
leon
TT
p δd
σd
0
0.2
0.4
0.6
0.8
1
42−10×
5× 5×
T2K ResultGENIE (tuned)
= 5.2tot2χBRRFG+RS+hA,
= 5.5tot2χBRRFG+RS+hN,
= 6.1tot2χBRRFG+BS+hA,
= 8.6tot2χLFG+BS+hN,
(MeV/c)TT
pδ600− 400− 200− 0 200 400 600
]-1
(MeV
/c)
2cm
-1 [
Nuc
leon
TT
p δd
σd
0
0.2
0.4
0.6
0.8
1
42−10×
5× 5×
T2K ResultGENIE (baseline)
= 8.7tot2χBRRFG+RS+hA,
=11.7tot2χBRRFG+RS+hN,
=12.0tot2χBRRFG+BS+hA,
=17.2tot2χLFG+BS+hN,
(MeV/c)N
p0 200 400 600 800 1000 1200 1400
]-1
(MeV
/c)
2cm
-1 [
Nuc
leon
Ndp
σd
0
0.1
0.2
0.3
0.4
0.5
0.6
0.7
0.842−10×
5×
T2K ResultGENIE (tuned)
= 2.9tot2χBRRFG+RS+hA,
= 3.3tot2χBRRFG+RS+hN,
= 4.0tot2χBRRFG+BS+hA,
=13.2tot2χLFG+BS+hN,
(MeV/c)N
p0 200 400 600 800 1000 1200 1400
]-1
(MeV
/c)
2cm
-1 [
Nuc
leon
Ndp
σd
0
0.1
0.2
0.3
0.4
0.5
0.6
0.7
0.842−10×
5×
T2K ResultGENIE (baseline)
= 7.0tot2χBRRFG+RS+hA,
= 9.9tot2χBRRFG+RS+hN,
=11.8tot2χBRRFG+BS+hA,
=27.9tot2χLFG+BS+hN,
(deg)Tαδ0 20 40 60 80 100 120 140 160 180
)]-1
deg
2cm
-1 [
(Nuc
leon
Tαδ
dσ
d
0
0.2
0.4
0.6
0.8
1
1.2
1.4
1.6
42−10×T2K ResultGENIE (tuned)
= 1.1tot2χBRRFG+RS+hA,
= 1.0tot2χBRRFG+RS+hN,
= 1.2tot2χBRRFG+BS+hA,
= 1.6tot2χLFG+BS+hN,
(deg)Tαδ0 20 40 60 80 100 120 140 160 180
)]-1
deg
2cm
-1 [
(Nuc
leon
Tαδ
dσ
d
0
0.2
0.4
0.6
0.8
1
1.2
1.4
1.6
42−10×T2K ResultGENIE (baseline)
= 0.9tot2χBRRFG+RS+hA,
= 2.3tot2χBRRFG+RS+hN,
= 2.6tot2χBRRFG+BS+hA,
= 4.6tot2χLFG+BS+hN,
FIG. 16. Measured differential cross sections per nucleon as a function of δpTT (top), pN (middle), and δαT (bottom), together withpredictions from the different model configurations of GENIE. The left plots use the free nucleon cross section retune, and the right plotsuse the baseline tune. In the tails of δpTT and pN (beyond the magenta lines), the cross sections are scaled by a factor of 5 for bettervisualization. The legend also shows the χ2tot from Eq. (17).
K. ABE et al. PHYS. REV. D 103, 112009 (2021)
112009-24

predictions. These include a global scaling of the nucleonmean free path in the cascade, or the switch of the pion-nucleon interaction model from Refs. [114] to [115]. As
shown in Fig. 17, the change in χ2tot is small, indicating thatthere is limited sensitivity to FSI under current statistics andsignal phase space restrictions.
(MeV/c)TT
pδ600− 400− 200− 0 200 400 600
]-1
(MeV
/c)
2cm
-1 [
Nuc
leon
TT
p δd
σd
0
0.1
0.2
0.3
0.4
0.5
0.6
0.7
0.8
42−10×
5× 5×
T2K Result
NuWro ESF
= 5.2tot2χNominal,
= 4.7tot2χ 0.7, ×NN MFP
= 5.7tot2χ 1.3, ×NN MFP
= 5.2tot2χN cross section, πAlternative
(MeV/c)TT
pδ600− 400− 200− 0 200 400 600
]-1
(MeV
/c)
2cm
-1 [
Nuc
leon
TT
p δd
σd
0
0.1
0.2
0.3
0.4
0.5
0.6
0.7
0.8
42−10×
5× 5×
T2K Result
NuWro BRRFG
= 4.9tot2χNominal,
= 4.1tot2χ 0.7, ×NN MFP
= 5.5tot2χ 1.3, ×NN MFP
= 4.5tot2χN cross section, πAlternative
(MeV/c)N
p0 200 400 600 800 1000 1200 1400
]-1
(MeV
/c)
2cm
-1 [
Nuc
leon
Ndp
σd
0
0.05
0.1
0.15
0.2
0.25
0.3
0.35
0.4
0.45
0.542−10×
5×
T2K Result
NuWro ESF
= 3.5tot2χNominal,
= 2.7tot2χ 0.7, ×NN MFP
= 4.2tot2χ 1.3, ×NN MFP
= 3.2tot2χN cross section, πAlternative
(MeV/c)N
p0 200 400 600 800 1000 1200 1400
]-1
(MeV
/c)
2cm
-1 [
Nuc
leon
Ndp
σd
0
0.05
0.1
0.15
0.2
0.25
0.3
0.35
0.4
0.45
0.542−10×
5×
T2K Result
NuWro BRRFG
= 2.7tot2χNominal,
= 2.1tot2χ 0.7, ×NN MFP
= 3.5tot2χ 1.3, ×NN MFP
= 2.2tot2χN cross section, πAlternative
(deg)Tαδ0 20 40 60 80 100 120 140 160 180
)]-1
deg
2cm
-1 [
(Nuc
leon
Tαδ
dσ
d
0
0.2
0.4
0.6
0.8
1
1.2
1.4
42−10×T2K Result
NuWro ESF
= 3.3tot2χNominal,
= 3.8tot2χ 0.7, ×NN MFP
= 3.2tot2χ 1.3, ×NN MFP
= 3.5tot2χN cross section, πAlternative
(deg)Tαδ0 20 40 60 80 100 120 140 160 180
)]-1
deg
2cm
-1 [
(Nuc
leon
Tαδ
dσ
d
0
0.2
0.4
0.6
0.8
1
1.2
1.4
42−10×T2K Result
NuWro BRRFG
= 2.7tot2χNominal,
= 2.8tot2χ 0.7, ×NN MFP
= 2.3tot2χ 1.3, ×NN MFP
= 2.3tot2χN cross section, πAlternative
FIG. 17. Measured differential cross sections per nucleon as a function of δpTT (top), pN (middle), and δαT (bottom), together withpredictions from the NuWro ESF (left) and BRRFG (right) models. The black solid line shows the prediction from the nominal FSIconfiguration, while other colors show that from a different nucleon mean free path (NN MFP) or pion-nucleon (πN) interaction modelconfiguration. In the tails of δpTT and pN (beyond the magenta lines), the cross sections are scaled by a factor of 5 for bettervisualization. The legend also shows the χ2tot from Eq. (17).
FIRST T2K MEASUREMENT OF TRANSVERSE KINEMATIC … PHYS. REV. D 103, 112009 (2021)
112009-25

[1] K. Abe et al. (T2K Collaboration), Phys. Rev. Lett. 124,161802 (2020).
[2] K. Abe et al. (Super-Kamiokande Collaboration), Phys.Rev. D 97, 072001 (2018).
[3] M. A. Acero et al. (NOvA Collaboration), Phys. Rev. Lett.123, 151803 (2019).
[4] D. Adey et al. (Daya Bay Collaboration), Phys. Rev. Lett.121, 241805 (2018).
[5] H. de Kerret et al. (Double Chooz Collaboration), Nat.Phys. 16, 558 (2020).
[6] S. H. Seo et al. (RENO Collaboration), Phys. Rev. D 98,012002 (2018).
[7] M. G. Aartsen et al. (IceCube Collaboration), Phys. Rev.Lett. 120, 071801 (2018).
[8] B. Abi et al. (DUNE Collaboration), Eur. Phys. J. C 80,978 (2020).
[9] K. Abe et al. (Hyper-Kamiokande Proto-Collaboration),Prog. Theor. Exp. Phys. 2015, 053C02 (2015).
[10] Z. Maki, M. Nakagawa, and S. Sakata, Prog. Theor. Phys.28, 870 (1962).
[11] B. Pontecorvo, Sov. Phys. JETP 26, 984 (1968).[12] K. Abe et al. (T2K Collaboration), Nature (London) 580,
339 (2020).[13] S. Singh and E. Oset, Nucl. Phys. A542, 587 (1992).[14] A. Gil, J. Nieves, and E. Oset, Nucl. Phys. A627, 543
(1997).[15] J. Nieves, J. E. Amaro, and M. Valverde, Phys. Rev. C 70,
055503 (2004); 72, 019902(E) (2005).[16] J. Nieves, M. Valverde, and M. J. Vicente Vacas, Phys.
Rev. C 73, 025504 (2006).[17] M. Martini, M. Ericson, G. Chanfray, and J. Marteau,
Phys. Rev. C 80, 065501 (2009).[18] J. Delorme and M. Ericson, Phys. Lett. 156B, 263 (1985).[19] J. Marteau, J. Delorme, and M. Ericson, Nucl. Instrum.
Methods Phys. Res., Sect. A 451, 76 (2000).[20] M. Martini, M. Ericson, G. Chanfray, and J. Marteau,
Phys. Rev. C 81, 045502 (2010).[21] J. Nieves, I. Ruiz Simo, and M. J. Vicente Vacas, Phys.
Rev. C 83, 045501 (2011).[22] J. Nieves, I. Ruiz Simo, and M. Vicente Vacas, Phys. Lett.
B 707, 72 (2012).[23] M. Martini, M. Ericson, and G. Chanfray, Phys. Rev. C 84,
055502 (2011).[24] X. G. Lu, D. Coplowe, R. Shah, G. Barr, D. Wark, and A.
Weber, Phys. Rev. D 92, 051302 (2015).[25] X. G. Lu, L. Pickering, S. Dolan, G. Barr, D. Coplowe, Y.
Uchida, D. Wark, M. O. Wascko, A. Weber, and T. Yuan,Phys. Rev. C 94, 015503 (2016).
[26] K. Abe et al. (T2K Collaboration), Phys. Rev. D 98,032003 (2018).
[27] X. Lu et al. (MINERvA Collaboration), Phys. Rev. Lett.121, 022504 (2018).
[28] T. Cai et al. (MINERvA Collaboration), Phys. Rev. D 101,092001 (2020).
[29] D. Coplowe et al. (MINERvA Collaboration), Phys. Rev.D 102, 072007 (2020).
[30] A. P. Furmanski and J. T. Sobczyk, Phys. Rev. C 95,065501 (2017).
[31] S. Dolan, U. Mosel, K. Gallmeister, L. Pickering, and S.Bolognesi, Phys. Rev. C 98, 045502 (2018).
[32] S. Dolan, arXiv:1810.06043.[33] X. Lu and J. T. Sobczyk, Phys. Rev. C 99, 055504 (2019).[34] L. Harewood and R. Gran, arXiv:1906.10576.[35] T. Cai, X. Lu, and D. Ruterbories, Phys. Rev. D 100,
073010 (2019).[36] B. Bourguille, J. Nieves, and F. Sanchez, J. High Energy
Phys. 04 (2021) 004.[37] H. Duyang, B. Guo, S. Mishra, and R. Petti, arXiv:
1809.08752.[38] H. Duyang, B. Guo, S. Mishra, and R. Petti, Phys. Lett. B
795, 424 (2019).[39] L. Munteanu, S. Suvorov, S. Dolan, D. Sgalaberna, S.
Bolognesi, S. Manly, G. Yang, C. Giganti, K. Iwamoto,and C. Jesús-Valls, Phys. Rev. D 101, 092003 (2020).
[40] P. Hamacher-Baumann, X. Lu, and J. Martín-Albo, Phys.Rev. D 102, 033005 (2020).
[41] K. Abe et al. (T2K Collaboration), Phys. Rev. D 96,092006 (2017); 98, 019902(E) (2018).
[42] A. Bodek and T. Cai, Eur. Phys. J. C 79, 293 (2019).[43] K. Abe et al., Nucl. Instrum. Methods Phys. Res., Sect. A
659, 106 (2011).[44] K. Abe et al., Nucl. Instrum. Methods Phys. Res., Sect. A
694, 211 (2012).[45] K. Kin, J. Harada, Y. Seiya, and K. Yamamoto (WAGASCI
Collaboration), J. Phys. Conf. Ser. 888, 012125 (2017).[46] M. Antonova et al., in Prospects in Neutrino Physics
(NuPhys2016, 2017).[47] S. Fukuda et al., Nucl. Instrum. Methods Phys. Res., Sect.
A 501, 418 (2003).[48] K. Matsuoka, A. Ichikawa, H. Kubo, T. Maruyama, A.
Murakami, T. Nakaya, and M. Yokoyama, Nucl. Instrum.Methods Phys. Res., Sect. A 623, 385 (2010), 1stInternational Conference on Technology and Instrumenta-tion in Particle Physics.
[49] K. Matsuoka et al., Nucl. Instrum. Methods Phys. Res.,Sect. A 624, 591 (2010).
[50] K. Abe et al. (T2K Collaboration), Phys. Rev. D 87,012001 (2013); 87, 019902(A) (2013).
[51] S. Assylbekov et al., Nucl. Instrum. Methods Phys. Res.,Sect. A 686, 48 (2012).
[52] D. Allan et al., J. Instrum. 8, P10019 (2013).[53] S. Aoki et al., Nucl. Instrum. Methods Phys. Res., Sect. A
698, 135 (2013).[54] P.-A. Amaudruz et al., Nucl. Instrum. Methods Phys. Res.,
Sect. A 696, 1 (2012).[55] N. Abgrall et al., Nucl. Instrum. Methods Phys. Res., Sect.
A 637, 25 (2011).[56] A. Ferrari, P. R. Sala, A. Fasso, and J. Ranft, FLUKA: A
Multi-Particle Transport Code (Program version 2005)(CERN Yellow Reports: Monographs, 2005).
[57] T. Bhlen, F. Cerutti, M. Chin, A. Fass, A. Ferrari, P. Ortega,A. Mairani, P. Sala, G. Smirnov, and V. Vlachoudis, Nucl.Data Sheets 120, 211 (2014).
[58] R. Brun, F. Bruyant, F. Carminati, S. Giani, M. Maire, A.McPherson, G. Patrick, and L. Urban, GEANT DetectorDescription and Simulation Tool (CERN Program Library,1994).
[59] C. Zeitnitz and T. Gabriel, in 3rd International Conferenceon Calorimetry in High-energy Physics (Note: dateschanged from Oct 6-9) (1992) pp. 394–404.
K. ABE et al. PHYS. REV. D 103, 112009 (2021)
112009-26

[60] N. Abgrall et al. (NA61/SHINE Collaboration), Eur. Phys.J. C 79, 100 (2019).
[61] K. Abe et al. (T2K Collaboration), Phys. Rev. D 101,112001 (2020).
[62] K. Abe et al. (T2K Collaboration), Phys. Rev. D 101,112004 (2020).
[63] N. Abgrall et al. (NA61/SHINE Collaboration), Eur. Phys.J. C 76, 84 (2016).
[64] Y. Hayato, Nucl. Phys. B, Proc. Suppl. 112, 171 (2002).[65] Y. Hayato, Acta Phys. Pol. B 40, 2477 (2009).[66] O. Benhar, A. Fabrocini, S. Fantoni, and I. Sick, Nucl.
Phys. A579, 493 (1994).[67] J. Nieves, F. Sanchez, I. Ruiz Simo, and M. J. Vicente
Vacas, Phys. Rev. D 85, 113008 (2012).[68] D. Rein and L. M. Sehgal, Ann. Phys. (N.Y.) 133, 79
(1981).[69] K. M. Graczyk and J. T. Sobczyk, Phys. Rev. D 77, 053001
(2008); 79, 079903(E) (2009).[70] R. Smith and E. Moniz, Nucl. Phys. B43, 605 (1972);
B101, 547(E) (1975).[71] M. Glck, E. Reya, and A. Vogt, Eur. Phys. J. C 5, 461
(1998).[72] A. Bodek and U. K. Yang, AIP Conf. Proc. 670, 110
(2003).[73] L. Aliaga et al. (NuSTEC Collaboration), in NuSTEC
Workshop on Neutrino-Nucleus Pion Production in theResonance Region (2020), https://indico.fnal.gov/event/20793/overview.
[74] T. Sjostrand, Comput. Phys. Commun. 82, 74 (1994).[75] E. S. Pinzon Guerra et al., Phys. Rev. D 99, 052007 (2019).[76] S. Agostinelli et al., Nucl. Instrum. Methods Phys. Res.,
Sect. A 506, 250 (2003).[77] J. Allison et al., Nucl. Instrum. Methods Phys. Res., Sect.
A 835, 186 (2016).[78] K. Abe et al. (T2K Collaboration), Phys. Rev. D 98,
012004 (2018).[79] L. Michel, Proc. Phys. Soc. London Sect. A 63, 514
(1950).[80] K. Abe et al. (T2K Collaboration), Phys. Rev. D 93,
112012 (2016).[81] R. Barlow and C. Beeston, Comput. Phys. Commun. 77,
219 (1993).[82] J. S. Conway, Proceedings of the PHYSTAT 2011 Work-
shop on Statistical Issues Related to Discovery Claims inSearch Experiments and Unfolding: CERN, Geneva,Switzerland 17—20 Jan 2011. PHYSTAT 2011 Workshopon Statistical Issues Related to Discovery Claims in SearchExperiments and Unfolding, Incorporating NuisanceParameters in Likelihoods for Multisource Spectra(CERN, Geneva, 2011).
[83] G. M. Radecky et al., Phys. Rev. D 25, 1161 (1982); 26,3297(E) (1982).
[84] M. Derrick et al., Phys. Rev. D 23, 569 (1981).[85] T. Kitagaki et al., Phys. Rev. D 34, 2554 (1986).[86] N. J. Baker, A. M. Cnops, P. L. Connolly, S. A. Kahn, M. J.
Murtagh, R. B. Palmer, N. P. Samios, and M. Tanaka, Phys.Rev. D 23, 2495 (1981).
[87] K. Furuno, A. Suzuki, T. Kitagaki, M. Etou, H. Sagawa,K. B. McConnel Mahn, E. Jeon, and M. Sakuda, in 2nd
International Workshop on Neutrino-Nucleus Interactionsin the Few GeV Region (2003), https://inspirehep.net/conferences/974475.
[88] C. Wilkinson, P. Rodrigues, S. Cartwright, L. Thompson,and K. McFarland, Phys. Rev. D 90, 112017 (2014).
[89] A. A. Aguilar-Arevalo et al. (MiniBooNE Collaboration),Phys. Rev. D 83, 052007 (2011).
[90] K. Abe et al. (T2K Collaboration), Phys. Rev. D 102,012007 (2020).
[91] R. Peelle, Peelles Pertinent Puzzle (Oak Ridge NationalLaboratory, 1987), informal memorandum.
[92] K. M. Hanson, T. Kawano, and P. Talou, AIP Conf. Proc.769, 304 (2005).
[93] C. Andreopoulos et al., Nucl. Instrum. Methods Phys.Res., Sect. A 614, 87 (2010).
[94] C. Andreopoulos, C. Barry, S. Dytman, H. Gallagher, T.Golan, R. Hatcher, G. Perdue, and J. Yarba, The GENIENeutrino Monte Carlo Generator: Physics and UserManual (FERMILAB-FN-1004-CD, 2015).
[95] A. Bodek and J. L. Ritchie, Phys. Rev. D 23, 1070(1981).
[96] A. Bodek and J. L. Ritchie, Phys. Rev. D 24, 1400(1981).
[97] C. Berger and L. M. Sehgal, Phys. Rev. D 76, 113004(2007).
[98] C. Andreopoulos et al. (NuSTEC Collaboration), inNuSTEC Workshop on Shallow- and Deep-InelasticScattering (2019), https://indico.cern.ch/event/727283.
[99] D. Day et al., Phys. Rev. D 28, 2714 (1983).[100] J. Campbell et al., Phys. Rev. Lett. 30, 335 (1973).[101] P. Allen et al., Nucl. Phys. B176, 269 (1980).[102] D. Allasia et al., Nucl. Phys. B343, 285 (1990).[103] P. Allen et al., Nucl. Phys. B264, 221 (1986).[104] J. Bell et al., Phys. Rev. Lett. 41, 1008 (1978).[105] O. Buss, T. Gaitanos, K. Gallmeister, H. van Hees,
M. Kaskulov, O. Lalakulich, A. Larionov, T. Leitner, J.Weil, and U. Mosel, Phys. Rep. 512, 1 (2012), transport-theoretical Description of Nuclear Reactions.
[106] T. Golan, J. Sobczyk, and J. muda, Nucl. Phys. B, Proc.Suppl. 229–232, 499 (2012), neutrino 2010.
[107] A. M. Ankowski and J. T. Sobczyk, Phys. Rev. C 74,054316 (2006).
[108] K. M. Graczyk, D. Kiełczewska, P. Przewłocki, and J. T.Sobczyk, Phys. Rev. D 80, 093001 (2009).
[109] C. Juszczak, J. A. Nowak, and J. T. Sobczyk, Nucl. Phys.B, Proc. Suppl. 159, 211 (2006).
[110] K. Niewczas and J. T. Sobczyk, Phys. Rev. C 100, 015505(2019).
[111] U. Mosel, J. Phys. G 46, 113001 (2019).[112] K. Abe et al. (T2K Collaboration), Technical Report
No. CERN-SPSC-2019-001; SPSC-TDR-006, 2019.[113] Data release, https://t2k-experiment.org/results/2021_tki_
numucc1pinp/.[114] L. Salcedo, E. Oset, M. Vicente-Vacas, and C. Garcia-
Recio, Nucl. Phys. A484, 557 (1988).[115] N. Metropolis, R. Bivins, M. Storm, A. Turkevich,
J. M. Miller, and G. Friedlander, Phys. Rev. 110, 185(1958).
FIRST T2K MEASUREMENT OF TRANSVERSE KINEMATIC … PHYS. REV. D 103, 112009 (2021)
112009-27


![Gilbert damping in binary magnetic multilayers · E. BARATI AND M. CINAL PHYSICAL REVIEW B 95, 134440 (2017) ons-d exchangeattheinterfaces,hasbeenproposedbyBerger [53]. More recently,](https://static.fdocument.org/doc/165x107/5d4e675988c99303708b99e1/gilbert-damping-in-binary-magnetic-multilayers-e-barati-and-m-cinal-physical.jpg)