PHYSICAL REVIEW D 052001 (2017) Measurement of μ charged ... · Measurement of ν¯μ and νμ...
15
Measurement of ¯ ν μ and ν μ charged current inclusive cross sections and their ratio with the T2K off-axis near detector K. Abe, 45 J. Amey, 15 C. Andreopoulos, 43,25 M. Antonova, 20 S. Aoki, 22 A. Ariga, 1 Y. Ashida, 23 S. Ban, 23 M. Barbi, 37 G. J. Barker, 53 G. Barr, 33 C. Barry, 25 M. Batkiewicz, 11 V. Berardi, 16 S. Berkman, 3,49 S. Bhadra, 57 S. Bienstock, 34 A. Blondel, 10 S. Bolognesi, 5 S. Bordoni, 13,* S. B. Boyd, 53 D. Brailsford, 24 A. Bravar, 10 C. Bronner, 45 M. Buizza Avanzini, 9 R. G. Calland, 21 T. Campbell, 7 S. Cao, 12 S. L. Cartwright, 41 M. G. Catanesi, 16 A. Cervera, 14 A. Chappell, 53 C. Checchia, 18 D. Cherdack, 7 N. Chikuma, 44 G. Christodoulou, 25 J. Coleman, 25 G. Collazuol, 18 D. Coplowe, 33 A. Cudd, 27 A. Dabrowska, 11 G. De Rosa, 17 T. Dealtry, 24 P. F. Denner, 53 S. R. Dennis, 25 C. Densham, 43 F. Di Lodovico, 36 S. Dolan, 33 O. Drapier, 9 K. E. Duffy, 33 J. Dumarchez, 34 P. Dunne, 15 S. Emery-Schrenk, 5 A. Ereditato, 1 T. Feusels, 3,49 A. J. Finch, 24 G. A. Fiorentini, 57 M. Friend, 12,† Y. Fujii, 12,† D. Fukuda, 31 Y. Fukuda, 28 A. Garcia, 13 C. Giganti, 34 F. Gizzarelli, 5 T. Golan, 55 M. Gonin, 9 D. R. Hadley, 53 L. Haegel, 10 J. T. Haigh, 53 D. Hansen, 35 J. Harada, 32 M. Hartz, 21,49 T. Hasegawa, 12,† N. C. Hastings, 37 T. Hayashino, 23 Y. Hayato, 45,21 A. Hillairet, 50 T. Hiraki, 23 A. Hiramoto, 23 S. Hirota, 23 M. Hogan, 7 J. Holeczek, 42 F. Hosomi, 44 K. Huang, 23 A. K. Ichikawa, 23 M. Ikeda, 45 J. Imber, 9 J. Insler, 26 R. A. Intonti, 16 T. Ishida, 12,† T. Ishii, 12,† E. Iwai, 12 K. Iwamoto, 44 A. Izmaylov, 14,20 B. Jamieson, 54 M. Jiang, 23 S. Johnson, 6 P. Jonsson, 15 C. K. Jung, 30,‡ M. Kabirnezhad, 29 A. C. Kaboth, 39,43 T. Kajita, 46,‡ H. Kakuno, 47 J. Kameda, 45 D. Karlen, 50,49 T. Katori, 36 E. Kearns, 2,21,‡ M. Khabibullin, 20 A. Khotjantsev, 20 H. Kim, 32 J. Kim, 3,49 S. King, 36 J. Kisiel, 42 A. Knight, 53 A. Knox, 24 T. Kobayashi, 12,† L. Koch, 40 T. Koga, 44 P. P. Koller, 1 A. Konaka, 49 L. L. Kormos, 24 Y. Koshio, 31,‡ K. Kowalik, 29 Y. Kudenko, 20,§ R. Kurjata, 52 T. Kutter, 26 J. Lagoda, 29 I. Lamont, 24 M. Lamoureux, 5 P. Lasorak, 36 M. Laveder, 18 M. Lawe, 24 M. Licciardi, 9 T. Lindner, 49 Z. J. Liptak, 6 R. P. Litchfield, 15 X. Li, 30 A. Longhin, 18 J. P. Lopez, 6 T. Lou, 44 L. Ludovici, 19 X. Lu, 33 L. Magaletti, 16 K. Mahn, 27 M. Malek, 41 S. Manly, 38 L. Maret, 10 A. D. Marino, 6 J. F. Martin, 48 P. Martins, 36 S. Martynenko, 30 T. Maruyama, 12,† V. Matveev, 20 K. Mavrokoridis, 25 W. Y. Ma, 15 E. Mazzucato, 5 M. McCarthy, 57 N. McCauley, 25 K. S. McFarland, 38 C. McGrew, 30 A. Mefodiev, 20 C. Metelko, 25 M. Mezzetto, 18 A. Minamino, 56 O. Mineev, 20 S. Mine, 4 A. Missert, 6 M. Miura, 45,‡ S. Moriyama, 45,‡ J. Morrison, 27 Th. A. Mueller, 9 T. Nakadaira, 12,† M. Nakahata, 45,21 K. G. Nakamura, 23 K. Nakamura, 21,12,† K. D. Nakamura, 23 Y. Nakanishi, 23 S. Nakayama, 45,‡ T. Nakaya, 23,21 K. Nakayoshi, 12,† C. Nantais, 48 C. Nielsen, 3,49 K. Nishikawa, 12,† Y. Nishimura, 46 P. Novella, 14 J. Nowak, 24 H. M. O’Keeffe, 24 K. Okumura, 46,21 T. Okusawa, 32 W. Oryszczak, 51 S. M. Oser, 3,49 T. Ovsyannikova, 20 R. A. Owen, 36 Y. Oyama, 12,† V. Palladino, 17 J. L. Palomino, 30 V. Paolone, 35 N. D. Patel, 23 P. Paudyal, 25 M. Pavin, 34 D. Payne, 25 Y. Petrov, 3,49 L. Pickering, 15 E. S. Pinzon Guerra, 57 C. Pistillo, 1 B. Popov, 34,∥ M. Posiadala-Zezula, 51 J.-M. Poutissou, 49 A. Pritchard, 25 P. Przewlocki, 29 B. Quilain, 23 T. Radermacher, 40 E. Radicioni, 16 P. N. Ratoff, 24 M. A. Rayner, 10 E. Reinherz-Aronis, 7 C. Riccio, 17 E. Rondio, 29 B. Rossi, 17 S. Roth, 40 A. C. Ruggeri, 17 A. Rychter, 52 K. Sakashita, 12,† F. Sánchez, 13 E. Scantamburlo, 10 K. Scholberg, 8,‡ J. Schwehr, 7 M. Scott, 49 Y. Seiya, 32 T. Sekiguchi, 12,† H. Sekiya, 45,21,‡ D. Sgalaberna, 10 R. Shah, 43,33 A. Shaikhiev, 20 F. Shaker, 54 D. Shaw, 24 M. Shiozawa, 45,21 T. Shirahige, 31 M. Smy, 4 J. T. Sobczyk, 55 H. Sobel, 4,21 J. Steinmann, 40 T. Stewart, 43 P. Stowell, 41 Y. Suda, 44 S. Suvorov, 20 A. Suzuki, 22 S. Y. Suzuki, 12,† Y. Suzuki, 21 R. Tacik, 37,49 M. Tada, 12,† A. Takeda, 45 Y. Takeuchi, 22,21 R. Tamura, 44 H. K. Tanaka, 45,‡ H. A. Tanaka, 48,49,¶ T. Thakore, 26 L. F. Thompson, 41 S. Tobayama, 3,49 W. Toki, 7 T. Tomura, 45 T. Tsukamoto, 12,† M. Tzanov, 26 M. Vagins, 21,4 Z. Vallari, 30 G. Vasseur, 5 C. Vilela, 30 T. Vladisavljevic, 33,21 T. Wachala, 11 C. W. Walter, 8,‡ D. Wark, 43,33 M. O. Wascko, 15 A. Weber, 43,33 R. Wendell, 23,‡ M. J. Wilking, 30 C. Wilkinson, 1 J. R. Wilson, 36 R. J. Wilson, 7 C. Wret, 15 Y. Yamada, 12,† K. Yamamoto, 32 C. Yanagisawa, 30,** T. Yano, 22 S. Yen, 49 N. Yershov, 20 M. Yokoyama, 44,‡ M. Yu, 57 A. Zalewska, 11 J. Zalipska, 29 L. Zambelli, 12,† K. Zaremba, 52 M. Ziembicki, 52 E. D. Zimmerman, 6 and M. Zito 5 (The T2K Collaboration) 1 University of Bern, Albert Einstein Center for Fundamental Physics, Laboratory for High Energy Physics (LHEP), Bern, Switzerland 2 Boston University, Department of Physics, Boston, Massachusetts, USA 3 University of British Columbia, Department of Physics and Astronomy, Vancouver, British Columbia, Canada 4 University of California, Irvine, Department of Physics and Astronomy, Irvine, California, USA 5 IRFU, CEA Saclay, Gif-sur-Yvette, France 6 University of Colorado at Boulder, Department of Physics, Boulder, Colorado, USA 7 Colorado State University, Department of Physics, Fort Collins, Colorado, USA PHYSICAL REVIEW D 96, 052001 (2017) 2470-0010=2017=96(5)=052001(15) 052001-1 Published by the American Physical Society
Transcript of PHYSICAL REVIEW D 052001 (2017) Measurement of μ charged ... · Measurement of ν¯μ and νμ...
Measurement of ν̄μ and νμ charged current inclusive cross sectionsand their ratio with the T2K off-axis near detector
K. Abe,45 J. Amey,15 C. Andreopoulos,43,25 M. Antonova,20 S. Aoki,22 A. Ariga,1 Y. Ashida,23 S. Ban,23 M. Barbi,37
G. J. Barker,53 G. Barr,33 C. Barry,25 M. Batkiewicz,11 V. Berardi,16 S. Berkman,3,49 S. Bhadra,57 S. Bienstock,34
A. Blondel,10 S. Bolognesi,5 S. Bordoni,13,* S. B. Boyd,53 D. Brailsford,24 A. Bravar,10 C. Bronner,45
M. Buizza Avanzini,9 R. G. Calland,21 T. Campbell,7 S. Cao,12 S. L. Cartwright,41 M. G. Catanesi,16 A. Cervera,14
A. Chappell,53 C. Checchia,18 D. Cherdack,7 N. Chikuma,44 G. Christodoulou,25 J. Coleman,25 G. Collazuol,18
D. Coplowe,33 A. Cudd,27 A. Dabrowska,11 G. De Rosa,17 T. Dealtry,24 P. F. Denner,53 S. R. Dennis,25 C. Densham,43
F. Di Lodovico,36 S. Dolan,33 O. Drapier,9 K. E. Duffy,33 J. Dumarchez,34 P. Dunne,15 S. Emery-Schrenk,5
A. Ereditato,1 T. Feusels,3,49 A. J. Finch,24 G. A. Fiorentini,57 M. Friend,12,† Y. Fujii,12,† D. Fukuda,31 Y. Fukuda,28
A. Garcia,13 C. Giganti,34 F. Gizzarelli,5 T. Golan,55 M. Gonin,9 D. R. Hadley,53 L. Haegel,10 J. T. Haigh,53
D. Hansen,35 J. Harada,32 M. Hartz,21,49 T. Hasegawa,12,† N. C. Hastings,37 T. Hayashino,23 Y. Hayato,45,21
A. Hillairet,50 T. Hiraki,23 A. Hiramoto,23 S. Hirota,23 M. Hogan,7 J. Holeczek,42 F. Hosomi,44 K. Huang,23
A. K. Ichikawa,23 M. Ikeda,45 J. Imber,9 J. Insler,26 R. A. Intonti,16 T. Ishida,12,† T. Ishii,12,† E. Iwai,12 K. Iwamoto,44
A. Izmaylov,14,20 B. Jamieson,54 M. Jiang,23 S. Johnson,6 P. Jonsson,15 C. K. Jung,30,‡ M. Kabirnezhad,29
A. C. Kaboth,39,43 T. Kajita,46,‡ H. Kakuno,47 J. Kameda,45 D. Karlen,50,49 T. Katori,36 E. Kearns,2,21,‡
M. Khabibullin,20 A. Khotjantsev,20 H. Kim,32 J. Kim,3,49 S. King,36 J. Kisiel,42 A. Knight,53 A. Knox,24
T. Kobayashi,12,† L. Koch,40 T. Koga,44 P. P. Koller,1 A. Konaka,49 L. L. Kormos,24 Y. Koshio,31,‡ K. Kowalik,29
Y. Kudenko,20,§ R. Kurjata,52 T. Kutter,26 J. Lagoda,29 I. Lamont,24 M. Lamoureux,5 P. Lasorak,36 M. Laveder,18
M. Lawe,24 M. Licciardi,9 T. Lindner,49 Z. J. Liptak,6 R. P. Litchfield,15 X. Li,30 A. Longhin,18 J. P. Lopez,6
T. Lou,44 L. Ludovici,19 X. Lu,33 L. Magaletti,16 K. Mahn,27 M. Malek,41 S. Manly,38 L. Maret,10 A. D. Marino,6
J. F. Martin,48 P. Martins,36 S. Martynenko,30 T. Maruyama,12,† V. Matveev,20 K. Mavrokoridis,25 W. Y. Ma,15
E. Mazzucato,5 M. McCarthy,57 N. McCauley,25 K. S. McFarland,38 C. McGrew,30 A. Mefodiev,20 C. Metelko,25
M. Mezzetto,18 A. Minamino,56 O. Mineev,20 S. Mine,4 A. Missert,6 M. Miura,45,‡ S. Moriyama,45,‡ J. Morrison,27
Th. A. Mueller,9 T. Nakadaira,12,† M. Nakahata,45,21 K. G. Nakamura,23 K. Nakamura,21,12,† K. D. Nakamura,23
Y. Nakanishi,23 S. Nakayama,45,‡ T. Nakaya,23,21 K. Nakayoshi,12,† C. Nantais,48 C. Nielsen,3,49 K. Nishikawa,12,†
Y. Nishimura,46 P. Novella,14 J. Nowak,24 H. M. O’Keeffe,24 K. Okumura,46,21 T. Okusawa,32 W. Oryszczak,51
S. M. Oser,3,49 T. Ovsyannikova,20 R. A. Owen,36 Y. Oyama,12,† V. Palladino,17 J. L. Palomino,30 V. Paolone,35
N. D. Patel,23 P. Paudyal,25 M. Pavin,34 D. Payne,25 Y. Petrov,3,49 L. Pickering,15 E. S. Pinzon Guerra,57
C. Pistillo,1 B. Popov,34,∥ M. Posiadala-Zezula,51 J.-M. Poutissou,49 A. Pritchard,25 P. Przewlocki,29 B. Quilain,23
T. Radermacher,40 E. Radicioni,16 P. N. Ratoff,24 M. A. Rayner,10 E. Reinherz-Aronis,7 C. Riccio,17 E. Rondio,29
B. Rossi,17 S. Roth,40 A. C. Ruggeri,17 A. Rychter,52 K. Sakashita,12,† F. Sánchez,13 E. Scantamburlo,10
K. Scholberg,8,‡ J. Schwehr,7 M. Scott,49 Y. Seiya,32 T. Sekiguchi,12,† H. Sekiya,45,21,‡ D. Sgalaberna,10 R. Shah,43,33
A. Shaikhiev,20 F. Shaker,54 D. Shaw,24 M. Shiozawa,45,21 T. Shirahige,31 M. Smy,4 J. T. Sobczyk,55 H. Sobel,4,21
J. Steinmann,40 T. Stewart,43 P. Stowell,41 Y. Suda,44 S. Suvorov,20 A. Suzuki,22 S. Y. Suzuki,12,† Y. Suzuki,21
R. Tacik,37,49 M. Tada,12,† A. Takeda,45 Y. Takeuchi,22,21 R. Tamura,44 H. K. Tanaka,45,‡ H. A. Tanaka,48,49,¶
T. Thakore,26 L. F. Thompson,41 S. Tobayama,3,49 W. Toki,7 T. Tomura,45 T. Tsukamoto,12,† M. Tzanov,26
M. Vagins,21,4 Z. Vallari,30 G. Vasseur,5 C. Vilela,30 T. Vladisavljevic,33,21 T. Wachala,11 C. W. Walter,8,‡
D. Wark,43,33 M. O. Wascko,15 A. Weber,43,33 R. Wendell,23,‡ M. J. Wilking,30 C. Wilkinson,1 J. R. Wilson,36
R. J. Wilson,7 C. Wret,15 Y. Yamada,12,† K. Yamamoto,32 C. Yanagisawa,30,** T. Yano,22 S. Yen,49 N. Yershov,20
M. Yokoyama,44,‡ M. Yu,57 A. Zalewska,11 J. Zalipska,29 L. Zambelli,12,† K. Zaremba,52 M. Ziembicki,52
E. D. Zimmerman,6 and M. Zito5
(The T2K Collaboration)
1University of Bern, Albert Einstein Center for Fundamental Physics, Laboratory for High Energy Physics(LHEP), Bern, Switzerland
2Boston University, Department of Physics, Boston, Massachusetts, USA3University of British Columbia, Department of Physics and Astronomy, Vancouver,
British Columbia, Canada4University of California, Irvine, Department of Physics and Astronomy, Irvine, California, USA
5IRFU, CEA Saclay, Gif-sur-Yvette, France6University of Colorado at Boulder, Department of Physics, Boulder, Colorado, USA
7Colorado State University, Department of Physics, Fort Collins, Colorado, USA
PHYSICAL REVIEW D 96, 052001 (2017)
2470-0010=2017=96(5)=052001(15) 052001-1 Published by the American Physical Society
8Duke University, Department of Physics, Durham, North Carolina, USA9Ecole Polytechnique, IN2P3-CNRS, Laboratoire Leprince-Ringuet, Palaiseau, France
10University of Geneva, Section de Physique, DPNC, Geneva, Switzerland11H. Niewodniczanski Institute of Nuclear Physics PAN, Cracow, Poland
12High Energy Accelerator Research Organization (KEK), Tsukuba, Ibaraki, Japan13Institut de Fisica d’Altes Energies (IFAE), The Barcelona Institute of Science and Technology, Campus
UAB, Bellaterra (Barcelona) Spain14IFIC (CSIC & University of Valencia), Valencia, Spain
15Imperial College London, Department of Physics, London, United Kingdom16INFN Sezione di Bari and Università e Politecnico di Bari,
Dipartimento Interuniversitario di Fisica, Bari, Italy17INFN Sezione di Napoli and Università di Napoli, Dipartimento di Fisica, Napoli, Italy
18INFN Sezione di Padova and Università di Padova, Dipartimento di Fisica, Padova, Italy19INFN Sezione di Roma and Università di Roma “La Sapienza,” Roma, Italy
20Institute for Nuclear Research of the Russian Academy of Sciences, Moscow, Russia21Kavli Institute for the Physics and Mathematics of the Universe (WPI),
The University of Tokyo Institutes for Advanced Study, University of Tokyo,Kashiwa, Chiba, Japan
22Kobe University, Kobe, Japan23Kyoto University, Department of Physics, Kyoto, Japan
24Lancaster University, Physics Department, Lancaster, United Kingdom25University of Liverpool, Department of Physics, Liverpool, United Kingdom
26Louisiana State University, Department of Physics and Astronomy,Baton Rouge, Louisiana, USA
27Michigan State University, Department of Physics and Astronomy, East Lansing, Michigan, USA28Miyagi University of Education, Department of Physics, Sendai, Japan
29National Centre for Nuclear Research, Warsaw, Poland30State University of New York at Stony Brook, Department of Physics and Astronomy,
Stony Brook, New York, USA31Okayama University, Department of Physics, Okayama, Japan32Osaka City University, Department of Physics, Osaka, Japan
33Oxford University, Department of Physics, Oxford, United Kingdom34UPMC, Université Paris Diderot, CNRS/IN2P3, Laboratoire de Physique Nucléaire et de Hautes
Energies (LPNHE), Paris, France35University of Pittsburgh, Department of Physics and Astronomy,
Pittsburgh, Pennsylvania, USA36Queen Mary University of London, School of Physics and Astronomy, London, United Kingdom
37University of Regina, Department of Physics, Regina, Saskatchewan, Canada38University of Rochester, Department of Physics and Astronomy, Rochester, New York, USA
39Royal Holloway University of London, Department of Physics, Egham, Surrey, United Kingdom40RWTH Aachen University, III. Physikalisches Institut, Aachen, Germany
41University of Sheffield, Department of Physics and Astronomy, Sheffield, United Kingdom42University of Silesia, Institute of Physics, Katowice, Poland
43STFC, Rutherford Appleton Laboratory, Harwell Oxford, and Daresbury Laboratory,Warrington, United Kingdom
44University of Tokyo, Department of Physics, Tokyo, Japan45University of Tokyo, Institute for Cosmic Ray Research,
Kamioka Observatory, Kamioka, Japan46University of Tokyo, Institute for Cosmic Ray Research, Research Center for Cosmic Neutrinos,
Kashiwa, Japan47Tokyo Metropolitan University, Department of Physics, Tokyo, Japan
48University of Toronto, Department of Physics, Toronto, Ontario, Canada49TRIUMF, Vancouver, British Columbia, Canada
50University of Victoria, Department of Physics and Astronomy,Victoria, British Columbia, Canada
51University of Warsaw, Faculty of Physics, Warsaw, Poland52Warsaw University of Technology, Institute of Radioelectronics, Warsaw, Poland
53University of Warwick, Department of Physics, Coventry, United Kingdom54University of Winnipeg, Department of Physics, Winnipeg, Manitoba, Canada
55Wroclaw University, Faculty of Physics and Astronomy, Wroclaw, Poland
K. ABE et al. PHYSICAL REVIEW D 96, 052001 (2017)
052001-2
56Yokohama National University, Faculty of Engineering, Yokohama, Japan57York University, Department of Physics and Astronomy, Toronto, Ontario, Canada
(Received 15 June 2017; published 5 September 2017)
We report a measurement of cross section σðνμ þ nucleus → μ− þ XÞ and the first measurements of the
cross section σðν̄μ þ nucleus → μþ þ XÞ and their ratio Rðσðν̄ÞσðνÞÞ at (anti) neutrino energies below 1.5 GeV.
We determine the single momentum bin cross section measurements, averaged over the T2K ν̄=ν-flux, forthe detector target material (mainly carbon, oxygen, hydrogen and copper) with phase space restrictedlaboratory frame kinematics of θμ < 32° and pμ > 500 MeV=c. The results are σðν̄Þ ¼ð0.900� 0.029ðstatÞ � 0.088ðsystÞÞ × 10−39 and σðνÞ ¼ ð2.41� 0.022ðstatÞ � 0.231ðsystÞÞ × 10−39 in
units of cm2=nucleon and Rðσðν̄ÞσðνÞÞ ¼ 0.373� 0.012ðstatÞ � 0.015ðsystÞ.
DOI: 10.1103/PhysRevD.96.052001
I. INTRODUCTION
Since the 1998 discovery [1] of neutrino oscillations,there have been major advances in neutrino disappearanceand appearance oscillation measurements, and all thefundamental neutrino mixing parameters [2] have beendetermined except for the mass hierarchy and the charge-parity (CP) phase δCP. Evidence of δCP ≠ 0; π leads to thenonconservation or violation of the charge-parity sym-metry (CPV). This is tested by measuring the neutrinoνμ → νe and antineutrino ν̄μ → ν̄e appearance oscillationevent rates to determine if the neutrino and antineutrinooscillation appearance probabilities, Pðνμ → νeÞ andP̄ðν̄μ → ν̄eÞ are equal in vacuum [2,3] at the same ratioof the oscillation distance L over the neutrino energy E orLE. Major long-baseline neutrino experiments [4] havebeen built and future projects [5] are proposed todetermine these probabilities using separate νμ and ν̄μbeams that cross near and far detectors. The probabilitiesare obtained from near detector measurements of theνμ þ N and ν̄μ þ N charged current (CC) interactions andcross sections, where N is the target nucleon, and fardetector measurements of νe þ N and ν̄e þ N CCinteractions.
In this paper, the T2K Collaboration, using the off-axisnear detector (ND280), presents a measurement at a peakenergy ∼0.6 GeV of the charged current inclusive (CCINC)νμ þ N cross section and first CCINC measurements of theν̄μ þ N cross section and their ratio of the ν̄μ þ N over theνμ þ N CCINCcross section. These νμ and ν̄μ measurementsare important to understand their impact on future CPVmeasurements and to test neutrino cross section models.T2K has published flux averaged neutrino-mode mea-
surements of CCINC [6] and charged current quasi-elasticlike (CCQE) [7] cross sections per nucleon of ð6.91�0.13ðstatÞ � 0.84ðsystÞÞ × 10−39 cm2 and ð4.15� 0.6Þ×10−39 cm2, respectively. These measurements were per-formed using the Fine-Grain Detector (FGD) which hasdifferent detector systematics compared to the measure-ments presented in this paper. There are no publishedCCINC ν̄μ measurements at energies below 1.5 GeV;however, the MINVERVA Collaboration recently pub-lished [8] CCINC results above 2 GeV and theMiniBooNE Collaboration has published [9] CCQE mea-surements in both ν̄μ and νμ modes which require largeraxial mass values compared to other experiments to fit theirobserved data. There are several multinucleon models (2particle 2 hole, or 2p2h) [10–12] proposed to explain largecross sections. In addition, in some models it has beenpredicted [10] that the difference between the νμ and ν̄μcross sections is expected to increase when 2p2h effects[13] are included. The measurements of the ratio, sum, anddifference of these cross sections, which have very differentsystematic errors, will be presented.Following this introduction, the paper is organized as
follows. We begin with a description of the ND280 off-axisdetector and the neutrino beam in Sec. II. Then theMonte Carlo (MC) simulation is presented in Sec. III,followed by the event selection given in Sec. IV. Theanalysis methods and systematic error evaluations arepresented in Secs. V and VI, and we finally conclude withthe results and conclusions in Secs. VII and VIII.
*Now at CERN.†Also at J-PARC, Tokai, Japan.‡Affiliated member at Kavli IPMU (WPI), the University of
Tokyo, Japan.§Also at National Research Nuclear University "MEPhI" and
Moscow Institute of Physics and Technology, Moscow, Russia.∥Also at JINR, Dubna, Russia.¶Also at Institute of Particle Physics, Canada.**Also at BMCC/CUNY, Science Department, New York,
New York, USA.
Published by the American Physical Society under the terms ofthe Creative Commons Attribution 4.0 International license.Further distribution of this work must maintain attribution tothe author(s) and the published article’s title, journal citation,and DOI.
MEASUREMENT OF ν̄μ AND νμ … PHYSICAL REVIEW D 96, 052001 (2017)
052001-3
II. BEAM AND DETECTOR
The T2K experiment [14] is composed of a neutrinobeam line and a near detector at the J-PARC laboratory inTokai, Japan, and the far detector Super-Kamiokande (SK)situated 295 km away in the Kamioka mine. The J-PARCaccelerator complex produces a 30 GeV energy protonbeam with spills every 2.48 s that contain eight beambunches which are 580 ns apart. At this spill and repetitionrate, a beam power of 430 kW produces 2.25 × 10¹⁴
protons on target (PoT) per spill corresponding to≈0.8 × 10¹⁹ PoT integrated per day of data taking.The proton beam strikes a graphite target to produce
pions and kaons that are focused by three magnetic hornsinto a 96 m long decay pipe. The polarity of the magnetichorns can be changed to forward horn current (FHC) orreverse horn current (RHC) to select either positive ornegative pions and kaons to produce a predominantly νμor an ν̄μ beam. The resulting main neutrino beam axis isparallel to the proton beam direction. SK lies 2.5° off-axiswith respect to the main neutrino beam direction and thisarrangement produces at SK both the νμ and ν̄μ energiesthat peak at ∼0.6 GeV. This νμðν̄μÞ peak energy with a295 km baseline distance, produces an L
E value that max-imizes the νeðν̄eÞ appearance rate and has a νμðν̄μÞdisappearance that minimizes the νμðν̄μÞ rates at SK.The ND280 νμ and ν̄μ fluxes were determined by
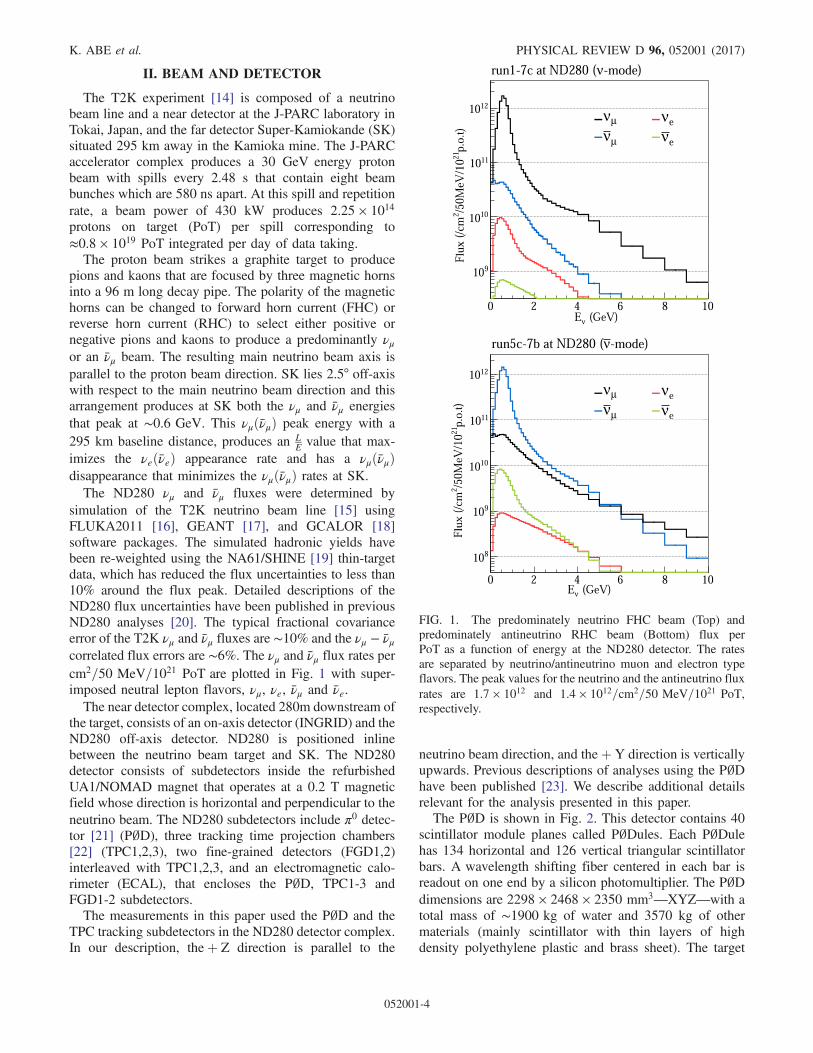
simulation of the T2K neutrino beam line [15] usingFLUKA2011 [16], GEANT [17], and GCALOR [18]software packages. The simulated hadronic yields havebeen re-weighted using the NA61/SHINE [19] thin-targetdata, which has reduced the flux uncertainties to less than10% around the flux peak. Detailed descriptions of theND280 flux uncertainties have been published in previousND280 analyses [20]. The typical fractional covarianceerror of the T2K νμ and ν̄μ fluxes are ∼10% and the νμ − ν̄μcorrelated flux errors are ∼6%. The νμ and ν̄μ flux rates percm2=50 MeV=1021 PoT are plotted in Fig. 1 with super-imposed neutral lepton flavors, νμ, νe, ν̄μ and ν̄e.The near detector complex, located 280m downstream of
the target, consists of an on-axis detector (INGRID) and theND280 off-axis detector. ND280 is positioned inlinebetween the neutrino beam target and SK. The ND280detector consists of subdetectors inside the refurbishedUA1/NOMAD magnet that operates at a 0.2 T magneticfield whose direction is horizontal and perpendicular to theneutrino beam. The ND280 subdetectors include π0 detec-tor [21] (P∅D), three tracking time projection chambers[22] (TPC1,2,3), two fine-grained detectors (FGD1,2)interleaved with TPC1,2,3, and an electromagnetic calo-rimeter (ECAL), that encloses the P∅D, TPC1-3 andFGD1-2 subdetectors.The measurements in this paper used the P∅D and the
TPC tracking subdetectors in the ND280 detector complex.In our description, theþ Z direction is parallel to the
neutrino beam direction, and theþ Y direction is verticallyupwards. Previous descriptions of analyses using the P∅Dhave been published [23]. We describe additional detailsrelevant for the analysis presented in this paper.The P∅D is shown in Fig. 2. This detector contains 40
scintillator module planes called P∅Dules. Each P∅Dulehas 134 horizontal and 126 vertical triangular scintillatorbars. A wavelength shifting fiber centered in each bar isreadout on one end by a silicon photomultiplier. The P∅Ddimensions are 2298 × 2468 × 2350 mm3—XYZ—with atotal mass of ∼1900 kg of water and 3570 kg of othermaterials (mainly scintillator with thin layers of highdensity polyethylene plastic and brass sheet). The target
FIG. 1. The predominately neutrino FHC beam (Top) andpredominately antineutrino RHC beam (Bottom) flux perPoT as a function of energy at the ND280 detector. The ratesare separated by neutrino/antineutrino muon and electron typeflavors. The peak values for the neutrino and the antineutrino fluxrates are 1.7 × 10¹² and 1.4 × 1012=cm2=50 MeV=1021 PoT,respectively.
K. ABE et al. PHYSICAL REVIEW D 96, 052001 (2017)
052001-4
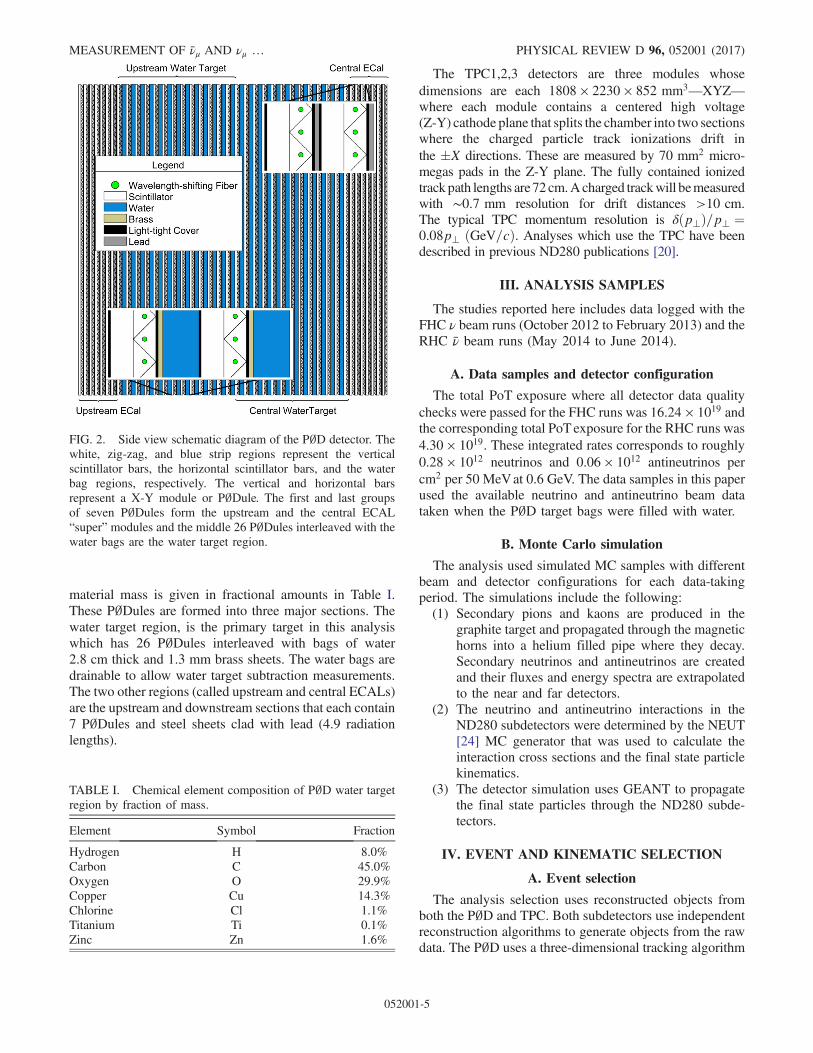
material mass is given in fractional amounts in Table I.These P∅Dules are formed into three major sections. Thewater target region, is the primary target in this analysiswhich has 26 P∅Dules interleaved with bags of water2.8 cm thick and 1.3 mm brass sheets. The water bags aredrainable to allow water target subtraction measurements.The two other regions (called upstream and central ECALs)are the upstream and downstream sections that each contain7 P∅Dules and steel sheets clad with lead (4.9 radiationlengths).
The TPC1,2,3 detectors are three modules whosedimensions are each 1808 × 2230 × 852 mm3—XYZ—where each module contains a centered high voltage(Z-Y) cathode plane that splits the chamber into two sectionswhere the charged particle track ionizations drift inthe �X directions. These are measured by 70 mm2 micro-megas pads in the Z-Y plane. The fully contained ionizedtrackpath lengths are72 cm.Acharged trackwill bemeasuredwith ∼0.7 mm resolution for drift distances >10 cm.The typical TPC momentum resolution is δðp⊥Þ=p⊥ ¼0.08p⊥ ðGeV=cÞ. Analyses which use the TPC have beendescribed in previous ND280 publications [20].
III. ANALYSIS SAMPLES
The studies reported here includes data logged with theFHC ν beam runs (October 2012 to February 2013) and theRHC ν̄ beam runs (May 2014 to June 2014).
A. Data samples and detector configuration
The total PoT exposure where all detector data qualitychecks were passed for the FHC runs was 16.24 × 10¹⁹ andthe corresponding total PoT exposure for the RHC runs was4.30 × 1019. These integrated rates corresponds to roughly0.28 × 1012 neutrinos and 0.06 × 10¹² antineutrinos percm2 per 50 MeVat 0.6 GeV. The data samples in this paperused the available neutrino and antineutrino beam datataken when the P∅D target bags were filled with water.
B. Monte Carlo simulation
The analysis used simulated MC samples with differentbeam and detector configurations for each data-takingperiod. The simulations include the following:(1) Secondary pions and kaons are produced in the
graphite target and propagated through the magnetichorns into a helium filled pipe where they decay.Secondary neutrinos and antineutrinos are createdand their fluxes and energy spectra are extrapolatedto the near and far detectors.
(2) The neutrino and antineutrino interactions in theND280 subdetectors were determined by the NEUT[24] MC generator that was used to calculate theinteraction cross sections and the final state particlekinematics.
(3) The detector simulation uses GEANT to propagatethe final state particles through the ND280 subde-tectors.
IV. EVENT AND KINEMATIC SELECTION
A. Event selection
The analysis selection uses reconstructed objects fromboth the P∅D and TPC. Both subdetectors use independentreconstruction algorithms to generate objects from the rawdata. The P∅D uses a three-dimensional tracking algorithm
FIG. 2. Side view schematic diagram of the P∅D detector. Thewhite, zig-zag, and blue strip regions represent the verticalscintillator bars, the horizontal scintillator bars, and the waterbag regions, respectively. The vertical and horizontal barsrepresent a X-Y module or P∅Dule. The first and last groupsof seven P∅Dules form the upstream and the central ECAL“super” modules and the middle 26 P∅Dules interleaved with thewater bags are the water target region.
TABLE I. Chemical element composition of P∅D water targetregion by fraction of mass.
Element Symbol Fraction
Hydrogen H 8.0%Carbon C 45.0%Oxygen O 29.9%Copper Cu 14.3%Chlorine Cl 1.1%Titanium Ti 0.1%Zinc Zn 1.6%
MEASUREMENT OF ν̄μ AND νμ … PHYSICAL REVIEW D 96, 052001 (2017)
052001-5
to form tracks from individual hits in the scintillator bars.The TPC reconstruction uses a track in the Y-Z plane(nondrift plane) as a seed to search for hits in the down-stream FGD to form a track object.After independent reconstructions in the TPC and in the
P∅D, the analysis uses an algorithm to match a three-dimensional P∅D track ending near the most downstreamedge of the P∅D to a TPC track beginning near the mostupstream edge of the TPC.The event selection is the following:(1) The first requirement is good data quality for the
data run. After ND280 data is processed, the sub-detectors are evaluated run by run for good timingwith respect to the beam and checked to satisfy gooddetector calibrations. Events are used only if theirrun passed data quality checks. For each FHC(RHC) beam bunch there must be a negative(positive) TPC track that is identified within�70 ns around the nominal beam bunch time.
(2) A veto is applied to reject events whose vertexoriginated outside the fiducial region but had asecondary interaction inside the fiducial region. Alsoevents with single tracks that are broken into twotracks by the track reconstruction are rejected. Theevent vertex is defined by the most upstream P∅Dulehit in the track. The vertex X-Y position is defined bythe X-Y triangular scintillator bars and the vertex Zposition of the P∅Dule. The fiducial volume requiresthe vertex to be within −836 mm < X < 864 mmand −871 mm < Y < 869 mm and inside one of themiddle 24 P∅Dules. The X boundaries are∼250 mmand the Y boundaries are ∼236 mm away from theends of the X and Y scintillator bars, respectively.
(3) The vertex must be in the P∅D water target fiducialvolume. The charge is determined by the curvatureof the TPC track. Of all TPC tracks meeting thesecriteria, the one with the highest reconstructed
momentum at the start of the track is chosen tobe the lepton candidate.
(4) The RHC mode selection has an additional require-ment that the lepton track candidate is positivelycharged and has the highest momentum of allcharged tracks in the bunch.
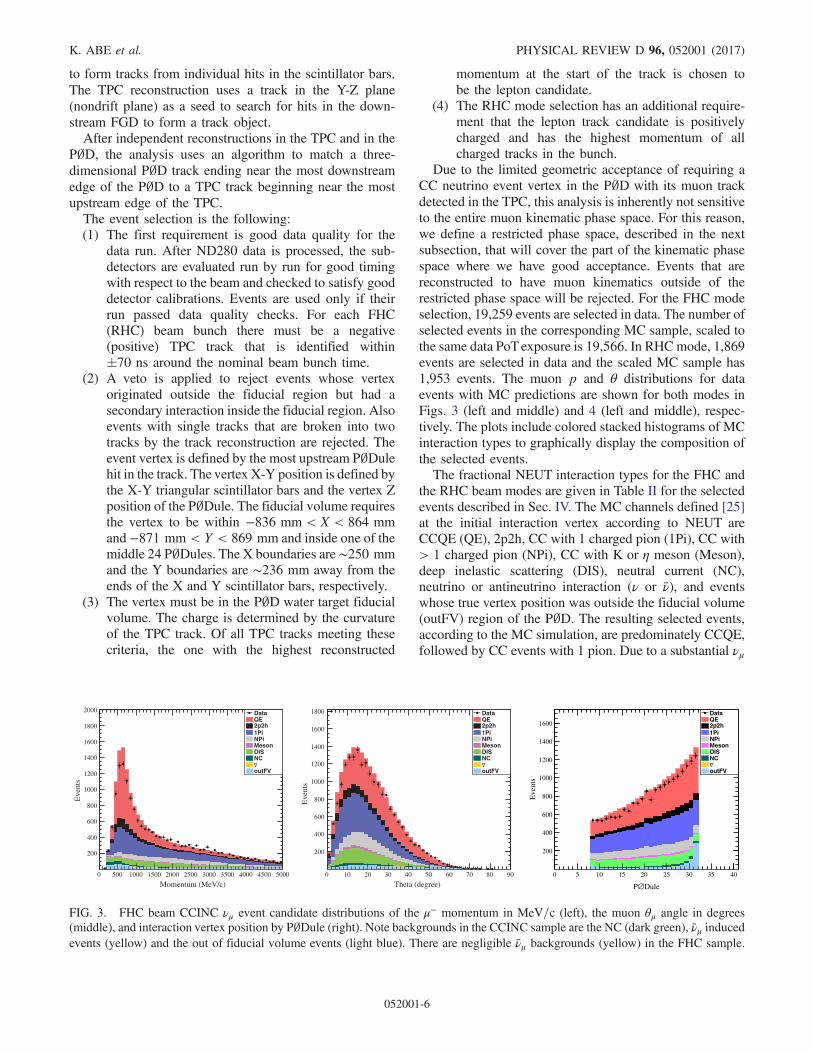
Due to the limited geometric acceptance of requiring aCC neutrino event vertex in the P∅D with its muon trackdetected in the TPC, this analysis is inherently not sensitiveto the entire muon kinematic phase space. For this reason,we define a restricted phase space, described in the nextsubsection, that will cover the part of the kinematic phasespace where we have good acceptance. Events that arereconstructed to have muon kinematics outside of therestricted phase space will be rejected. For the FHC modeselection, 19,259 events are selected in data. The number ofselected events in the corresponding MC sample, scaled tothe same data PoTexposure is 19,566. In RHCmode, 1,869events are selected in data and the scaled MC sample has1,953 events. The muon p and θ distributions for dataevents with MC predictions are shown for both modes inFigs. 3 (left and middle) and 4 (left and middle), respec-tively. The plots include colored stacked histograms of MCinteraction types to graphically display the composition ofthe selected events.The fractional NEUT interaction types for the FHC and
the RHC beam modes are given in Table II for the selectedevents described in Sec. IV. The MC channels defined [25]at the initial interaction vertex according to NEUT areCCQE (QE), 2p2h, CC with 1 charged pion (1Pi), CC with> 1 charged pion (NPi), CC with K or η meson (Meson),deep inelastic scattering (DIS), neutral current (NC),neutrino or antineutrino interaction (ν or ν̄), and eventswhose true vertex position was outside the fiducial volume(outFV) region of the P∅D. The resulting selected events,according to the MC simulation, are predominately CCQE,followed by CC events with 1 pion. Due to a substantial νμ
Momentum (MeV/c) Theta (degree)0 500 1000 1500 2000 2500 3000 3500 4000 4500 5000
Eve
nts
200
400
600
800
1000
1200
1400
1600
1800
2000 DataQE2p2h1PiNPiMesonDISNCνoutFV
0 10 20 30 40 50 60 70 80 90
Eve
nts
200
400
600
800
1000
1200
1400
1600
1800 DataQE2p2h1PiNPiMesonDISNCνoutFV
Dule∅P
0 5 10 15 20 25 30 35 40
Eve
nts
200
400
600
800
1000
1200
1400
1600
DataQE2p2h1PiNPiMesonDISNCνoutFV
FIG. 3. FHC beam CCINC νμ event candidate distributions of the μ− momentum in MeV=c (left), the muon θμ angle in degrees(middle), and interaction vertex position by P∅Dule (right). Note backgrounds in the CCINC sample are the NC (dark green), ν̄μ inducedevents (yellow) and the out of fiducial volume events (light blue). There are negligible ν̄μ backgrounds (yellow) in the FHC sample.
K. ABE et al. PHYSICAL REVIEW D 96, 052001 (2017)
052001-6
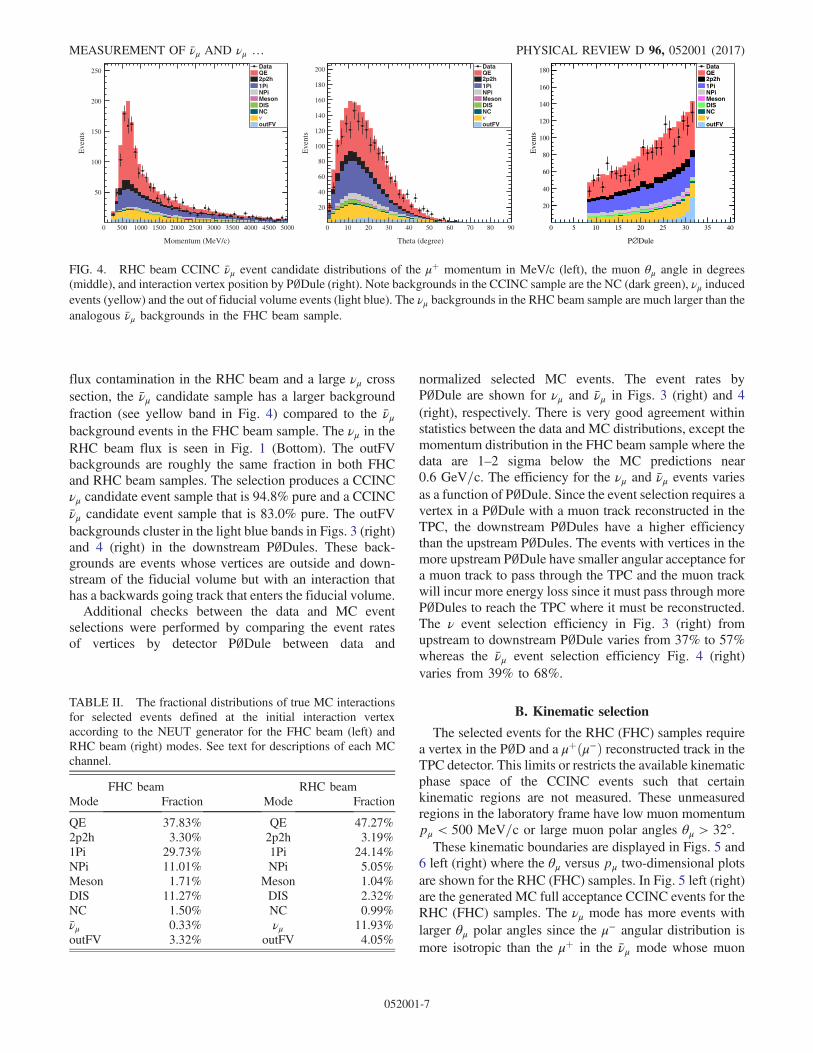
flux contamination in the RHC beam and a large νμ crosssection, the ν̄μ candidate sample has a larger backgroundfraction (see yellow band in Fig. 4) compared to the ν̄μbackground events in the FHC beam sample. The νμ in theRHC beam flux is seen in Fig. 1 (Bottom). The outFVbackgrounds are roughly the same fraction in both FHCand RHC beam samples. The selection produces a CCINCνμ candidate event sample that is 94.8% pure and a CCINCν̄μ candidate event sample that is 83.0% pure. The outFVbackgrounds cluster in the light blue bands in Figs. 3 (right)and 4 (right) in the downstream P∅Dules. These back-grounds are events whose vertices are outside and down-stream of the fiducial volume but with an interaction thathas a backwards going track that enters the fiducial volume.Additional checks between the data and MC event
selections were performed by comparing the event ratesof vertices by detector P∅Dule between data and
normalized selected MC events. The event rates byP∅Dule are shown for νμ and ν̄μ in Figs. 3 (right) and 4(right), respectively. There is very good agreement withinstatistics between the data and MC distributions, except themomentum distribution in the FHC beam sample where thedata are 1–2 sigma below the MC predictions near0.6 GeV=c. The efficiency for the νμ and ν̄μ events variesas a function of P∅Dule. Since the event selection requires avertex in a P∅Dule with a muon track reconstructed in theTPC, the downstream P∅Dules have a higher efficiencythan the upstream P∅Dules. The events with vertices in themore upstream P∅Dule have smaller angular acceptance fora muon track to pass through the TPC and the muon trackwill incur more energy loss since it must pass through moreP∅Dules to reach the TPC where it must be reconstructed.The ν event selection efficiency in Fig. 3 (right) fromupstream to downstream P∅Dule varies from 37% to 57%whereas the ν̄μ event selection efficiency Fig. 4 (right)varies from 39% to 68%.
B. Kinematic selection
The selected events for the RHC (FHC) samples requirea vertex in the P∅D and a μþðμ−Þ reconstructed track in theTPC detector. This limits or restricts the available kinematicphase space of the CCINC events such that certainkinematic regions are not measured. These unmeasuredregions in the laboratory frame have low muon momentumpμ < 500 MeV=c or large muon polar angles θμ > 32°.These kinematic boundaries are displayed in Figs. 5 and
6 left (right) where the θμ versus pμ two-dimensional plotsare shown for the RHC (FHC) samples. In Fig. 5 left (right)are the generated MC full acceptance CCINC events for theRHC (FHC) samples. The νμ mode has more events withlarger θμ polar angles since the μ− angular distribution ismore isotropic than the μþ in the ν̄μ mode whose muon
Momentum (MeV/c) Theta (degree)
0 500 1000 1500 2000 2500 3000 3500 4000 4500 5000
Eve
nts
50
100
150
200
250DataQE2p2h1PiNPiMesonDISNCνoutFV
0 10 20 30 40 50 60 70 80 90
Eve
nts
20
40
60
80
100
120
140
160
180
200 DataQE2p2h1PiNPiMesonDISNCνoutFV
Dule∅P
0 5 10 15 20 25 30 35 40
Eve
nts
20
40
60
80
100
120
140
160
180 DataQE2p2h1PiNPiMesonDISNCνoutFV
FIG. 4. RHC beam CCINC ν̄μ event candidate distributions of the μþ momentum in MeV/c (left), the muon θμ angle in degrees(middle), and interaction vertex position by P∅Dule (right). Note backgrounds in the CCINC sample are the NC (dark green), νμ inducedevents (yellow) and the out of fiducial volume events (light blue). The νμ backgrounds in the RHC beam sample are much larger than theanalogous ν̄μ backgrounds in the FHC beam sample.
TABLE II. The fractional distributions of true MC interactionsfor selected events defined at the initial interaction vertexaccording to the NEUT generator for the FHC beam (left) andRHC beam (right) modes. See text for descriptions of each MCchannel.
FHC beam RHC beamMode Fraction Mode Fraction
QE 37.83% QE 47.27%2p2h 3.30% 2p2h 3.19%1Pi 29.73% 1Pi 24.14%NPi 11.01% NPi 5.05%Meson 1.71% Meson 1.04%DIS 11.27% DIS 2.32%NC 1.50% NC 0.99%ν̄μ 0.33% νμ 11.93%outFV 3.32% outFV 4.05%
MEASUREMENT OF ν̄μ AND νμ … PHYSICAL REVIEW D 96, 052001 (2017)
052001-7
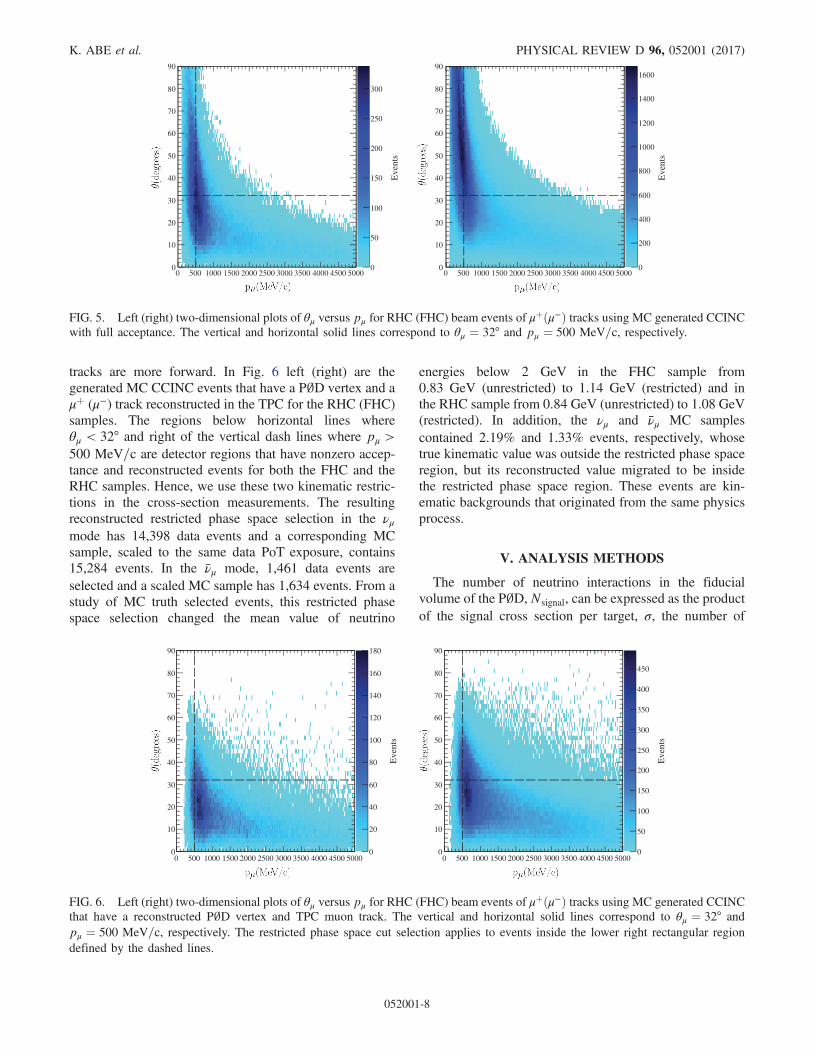
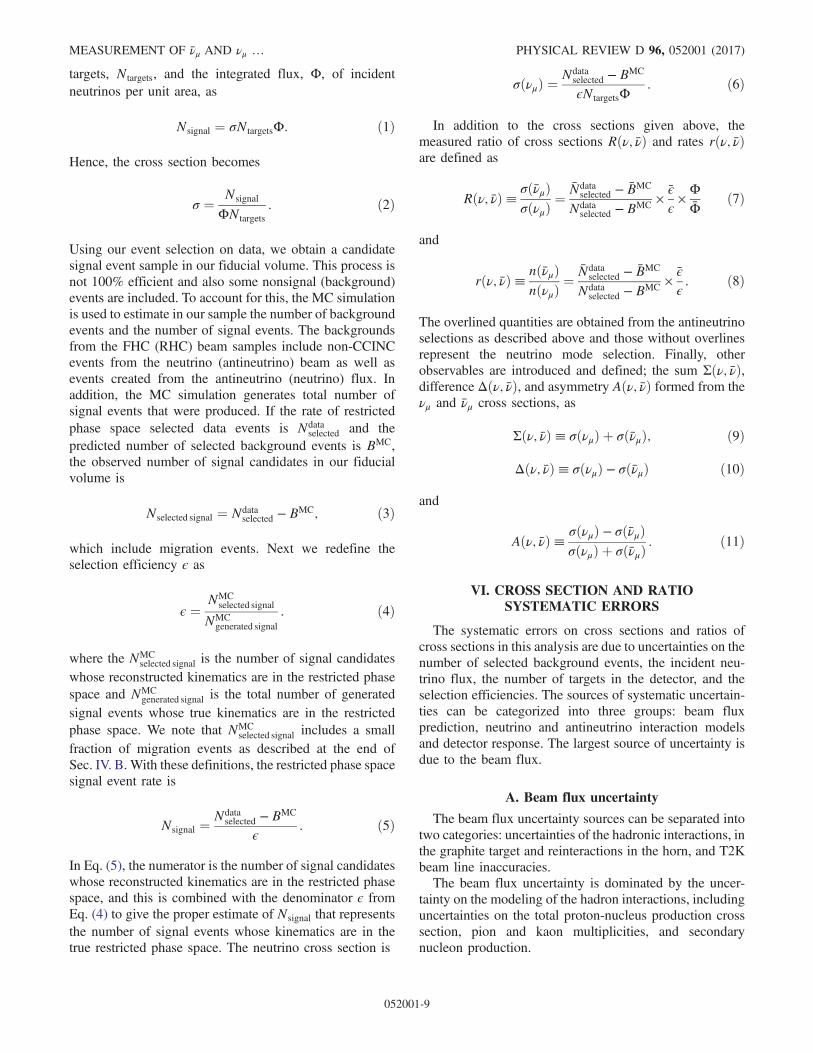
tracks are more forward. In Fig. 6 left (right) are thegenerated MC CCINC events that have a P∅D vertex and aμþ (μ−) track reconstructed in the TPC for the RHC (FHC)samples. The regions below horizontal lines whereθμ < 32° and right of the vertical dash lines where pμ >500 MeV=c are detector regions that have nonzero accep-tance and reconstructed events for both the FHC and theRHC samples. Hence, we use these two kinematic restric-tions in the cross-section measurements. The resultingreconstructed restricted phase space selection in the νμmode has 14,398 data events and a corresponding MCsample, scaled to the same data PoT exposure, contains15,284 events. In the ν̄μ mode, 1,461 data events areselected and a scaled MC sample has 1,634 events. From astudy of MC truth selected events, this restricted phasespace selection changed the mean value of neutrino
energies below 2 GeV in the FHC sample from0.83 GeV (unrestricted) to 1.14 GeV (restricted) and inthe RHC sample from 0.84 GeV (unrestricted) to 1.08 GeV(restricted). In addition, the νμ and ν̄μ MC samplescontained 2.19% and 1.33% events, respectively, whosetrue kinematic value was outside the restricted phase spaceregion, but its reconstructed value migrated to be insidethe restricted phase space region. These events are kin-ematic backgrounds that originated from the same physicsprocess.
V. ANALYSIS METHODS
The number of neutrino interactions in the fiducialvolume of the P∅D, Nsignal, can be expressed as the productof the signal cross section per target, σ, the number of
Eve
nts
0
50
100
150
200
250
300
0 500 1000 1500 2000 2500 3000 3500 4000 4500 50000
10
20
30
40
50
60
70
80
90
Eve
nts
0
200
400
600
800
1000
1200
1400
1600
0 500 1000 1500 2000 2500 3000 3500 4000 4500 50000
10
20
30
40
50
60
70
80
90
FIG. 5. Left (right) two-dimensional plots of θμ versus pμ for RHC (FHC) beam events of μþðμ−Þ tracks using MC generated CCINCwith full acceptance. The vertical and horizontal solid lines correspond to θμ ¼ 32° and pμ ¼ 500 MeV=c, respectively.
Eve
nts
0
20
40
60
80
100
120
140
160
180
0 500 1000 1500 2000 2500 3000 3500 4000 4500 50000
10
20
30
40
50
60
70
80
90E
vent
s
0
50
100
150
200
250
300
350
400
450
0 500 1000 1500 2000 2500 3000 3500 4000 4500 50000
10
20
30
40
50
60
70
80
90
FIG. 6. Left (right) two-dimensional plots of θμ versus pμ for RHC (FHC) beam events of μþðμ−Þ tracks using MC generated CCINCthat have a reconstructed P∅D vertex and TPC muon track. The vertical and horizontal solid lines correspond to θμ ¼ 32° andpμ ¼ 500 MeV=c, respectively. The restricted phase space cut selection applies to events inside the lower right rectangular regiondefined by the dashed lines.
K. ABE et al. PHYSICAL REVIEW D 96, 052001 (2017)
052001-8
targets, Ntargets, and the integrated flux, Φ, of incidentneutrinos per unit area, as
Nsignal ¼ σNtargetsΦ: ð1Þ
Hence, the cross section becomes
σ ¼ Nsignal
ΦNtargets: ð2Þ
Using our event selection on data, we obtain a candidatesignal event sample in our fiducial volume. This process isnot 100% efficient and also some nonsignal (background)events are included. To account for this, the MC simulationis used to estimate in our sample the number of backgroundevents and the number of signal events. The backgroundsfrom the FHC (RHC) beam samples include non-CCINCevents from the neutrino (antineutrino) beam as well asevents created from the antineutrino (neutrino) flux. Inaddition, the MC simulation generates total number ofsignal events that were produced. If the rate of restrictedphase space selected data events is Ndata
selected and thepredicted number of selected background events is BMC,the observed number of signal candidates in our fiducialvolume is
Nselected signal ¼ Ndataselected − BMC; ð3Þ
which include migration events. Next we redefine theselection efficiency ϵ as
ϵ ¼ NMCselected signal
NMCgenerated signal
: ð4Þ
where the NMCselected signal is the number of signal candidates
whose reconstructed kinematics are in the restricted phasespace and NMC
generated signal is the total number of generatedsignal events whose true kinematics are in the restrictedphase space. We note that NMC
selected signal includes a smallfraction of migration events as described at the end ofSec. IV. B. With these definitions, the restricted phase spacesignal event rate is
Nsignal ¼Ndata
selected − BMC
ϵ: ð5Þ
In Eq. (5), the numerator is the number of signal candidateswhose reconstructed kinematics are in the restricted phasespace, and this is combined with the denominator ϵ fromEq. (4) to give the proper estimate of Nsignal that representsthe number of signal events whose kinematics are in thetrue restricted phase space. The neutrino cross section is
σðνμÞ ¼Ndata
selected − BMC
ϵNtargetsΦ: ð6Þ
In addition to the cross sections given above, themeasured ratio of cross sections Rðν; ν̄Þ and rates rðν; ν̄Þare defined as
Rðν; ν̄Þ≡ σðν̄μÞσðνμÞ
¼ N̄dataselected − B̄MC
Ndataselected − BMC ×
ϵ̄
ϵ×ΦΦ̄
ð7Þ
and
rðν; ν̄Þ≡ nðν̄μÞnðνμÞ
¼ N̄dataselected − B̄MC
Ndataselected − BMC ×
ϵ̄
ϵ: ð8Þ
The overlined quantities are obtained from the antineutrinoselections as described above and those without overlinesrepresent the neutrino mode selection. Finally, otherobservables are introduced and defined; the sum Σðν; ν̄Þ,difference Δðν; ν̄Þ, and asymmetry Aðν; ν̄Þ formed from theνμ and ν̄μ cross sections, as
Σðν; ν̄Þ≡ σðνμÞ þ σðν̄μÞ; ð9Þ
Δðν; ν̄Þ≡ σðνμÞ − σðν̄μÞ ð10Þ
and
Aðν; ν̄Þ≡ σðνμÞ − σðν̄μÞσðνμÞ þ σðν̄μÞ
: ð11Þ
VI. CROSS SECTION AND RATIOSYSTEMATIC ERRORS
The systematic errors on cross sections and ratios ofcross sections in this analysis are due to uncertainties on thenumber of selected background events, the incident neu-trino flux, the number of targets in the detector, and theselection efficiencies. The sources of systematic uncertain-ties can be categorized into three groups: beam fluxprediction, neutrino and antineutrino interaction modelsand detector response. The largest source of uncertainty isdue to the beam flux.
A. Beam flux uncertainty
The beam flux uncertainty sources can be separated intotwo categories: uncertainties of the hadronic interactions, inthe graphite target and reinteractions in the horn, and T2Kbeam line inaccuracies.The beam flux uncertainty is dominated by the uncer-
tainty on the modeling of the hadron interactions, includinguncertainties on the total proton-nucleus production crosssection, pion and kaon multiplicities, and secondarynucleon production.
MEASUREMENT OF ν̄μ AND νμ … PHYSICAL REVIEW D 96, 052001 (2017)
052001-9
The hadronic interactions in the target where the primaryproton beam first interacts and produces the majority of thesecondary pions is simulated by the FLUKA2011 packagewhich creates MC neutrino and antineutrino flux samples.Uncertainties on the proton beam properties, horn current,hadron production model and alignment are taken intoaccount to produce an energy-dependent systematic uncer-tainty on the neutrino flux. These uncertainties are propa-gated to the T2K neutrino beam flux prediction byreweighting MC flux samples. Systematic uncertaintieson the neutrino flux predictions coming from the NA61/SHINE hadron production measurements are included.Those uncertainties were estimated by varying trackselection and identification criteria as well as the param-eters used to calculate needed corrections, to account forexample for decays of strange particles like Lambdas,which produce additional pions and protons, that canmimic our signal in the NA61/SHINE detector. Detailedreview of the sources of systematics errors of hadronproduction data of NA61/SHINE results needed for T2Kmay be found elsewhere [19].The flux smearing is done using toyMC data sets that are
based on the FHC and RHC beam flux uncertainty covari-ancematrices. The resulting�1σ change in the cross sectionis taken as the systematic error associated with the beamflux. These uncertainties on individual cross sections lead to9% errors whereas the errors on the ratio are 4% due tocorrelated neutrino and antineutrino flux covariance errors.Table III summarizes the systematic errors due to the beamflux uncertainties on the cross sections and combinations ofcross sections. These results have been cross checked withanalytic calculations. The fractional errors on ratios havesmaller errors due to cancellations of correlated errorsbetween the neutrino and antineutrino modes.
B. Interaction model uncertainty
The interaction model uncertainties were calculated by adata-driven method [26] where the NEUT predictions werecompared to external neutrino-nucleus data in the energyregion relevant for T2K. Some of the NEUT modelparameters are fitted and assigned mean and 1σ errorvalues that allow for differences between NEUT and theexternal data.The CCQE model in NEUT is based on the Llewellyn-
Smith neutrino-nucleon scattering model [27] with a dipoleaxial form factor and the BBBA05 vector form factors [28].The NEUT generator uses the Smith-Moniz RFG model[29] and includes an implementation of both the random
phase approximation (RPA) correction [30] and the 2p2hNieves model [30]. The NEUT resonant pion production isbased on the Rein-Sehgal model [31] with updated formfactors from Ref. [32]. The DIS model used in NEUTincludes both the structure function from Ref. [33] and theBodek-Yang correction [34]. The NEUT MC generatorincludes various model parameters to describe the differentmodels, uncertainties and approximations. The axial massMQE
A was set to 1.21 GeV=c2 based on the Super-Kamiokande atmospheric data and the K2K data. The1σ error on MQE
A was set to 0.41 GeV=c2. The largeuncertainty on this parameter is due to the disagreementsbetween recent experimental measurements and bubblechamber results [35]. The Fermi gas momentum parameter(pF) values and their errors are set to 223 MeV=c and225 MeV=c for carbon and oxygen, respectively, with botherrors set to �12.7 MeV=c. The Fermi gas binding energy(EB) parameter was set to 25 MeV and 27 MeV for carbonand oxygen, respectively, with both errors set to �9 MeV.The Nieves model 2p2h normalization to 1� 1 for bothcarbon and oxygen, the resonant pion production model inNEUT used the Graczyk and Sobczyk form factors CA
5 ð0Þand the I ¼ 1
2background scale were set to 1.01� 0.12 and
1.20� 0.20, respectively. The nominal axial mass MRESA
was set to 0.95� 0.15 GeV=c2. Additional uncertaintiesare νe=νμ cross section factor that was set to 1.00� 0.02.Both CC and NC coherent uncertainties based on the Rein-Sehgal model were set to 1� 1 and 1.0� 0.3, respectively.Moreover, for CC and NC interactions, additional scalefactors were set to 0.0� 0.4 and 1.0� 0.3, respectively. Inaddition the CC other is an energy dependent factor [20]and the NC other is a normalization factor. The π final stateinteraction (FSI) uncertainties are tuned to a pion-nucleusscattering data, and other smaller corrections wereincluded [26].Variation of model parameters within their errors (�1σ)
was used to estimate their effect on the final observables inorder to determine final measurement uncertainties. Asummary of the parameters and their effects on the overallnormalization are shown in Table IV.
C. Detector response uncertainty
The detector response uncertainty studies used datasamples supported with MC samples and measurementsof the target weight. The three dominant detector responsesystematic uncertainties are caused by the fiducial volumeboundaries, the sand/rock muon interactions and the massof the target in the fiducial volume. There were smalluncertainties from reconstruction and charge misidentifi-cation from the TPC measurements. All the sources ofdetector response errors considered in the analysis are givenin Table V.The fiducial volume systematics were estimated by
varying its boundaries. The sand/rock muon interactions
TABLE III. Summary table for one standard deviation errorsdue to beam flux uncertainties (fractionl errors in %).
σðν̄Þ σðνÞ Rðν; ν̄Þ Aðν; ν̄Þ Σðν; ν̄Þ Δðν; ν̄Þ�9.37 �9.14 �3.58 �3.35 �9.17 �9.42
K. ABE et al. PHYSICAL REVIEW D 96, 052001 (2017)
052001-10
occurring upstream and in the surrounding ND280 volumecould create tracks passing through the P∅D and TPCdetectors, mimicking a CCINC event. Another source ofdetector systematics was the mass of the target in thefiducial volume. The uncertainty due to the fiducial masswas conservatively estimated to be 0.96% from the mea-sured mass of the detector material during construction andthe water mass measured during filling the water bags.
VII. RESULTS
A. Cross sections and ratios
The flux averaged cross section and ratio values mea-sured in the FHC and RHC samples are extracted from the
flux, the number of targets, MC efficiencies and MCbackground estimates. The input parameters are given inTable VI, and the results for the restricted (full) phase spaceselections are given in Tables VII (VIII). The systematicerrors in Table VII are determined by adding in quadraturethe errors in Tables III, IV and V. For example, thefractional R error, taken from the three tables, is 4% andthis yields 0.015 for the absolute systematic R error inTable VII.In Table VI, for the restricted phase space results, the
input parameters include the νμðν̄μÞ fluxes normalized toPoT in the FHC(RHC) samples. The number of nucleontargets is given for both the data and MC which slightlydiffered. The number of reconstructed MC events is given
TABLE IV. Summary table for physics model uncertainties for restricted phase space measurements (fractional errors in %).
Parameter σðν̄Þ σðνÞ Rðν; ν̄Þ Aðν; ν̄Þ Σðν; ν̄Þ Δðν; ν̄ÞMQE
A �0.51 �0.14 �0.37 �0.32 �0.24 �0.08pFð12CÞ �0.01 �0.02 �0.01 �0.01 �0.02 �0.02pFð16OÞ 0 �0.01 0 0 �0.01 �0.01MEC norm ð12CÞ �0.30 �0.44 �0.14 �0.12 �0.40 �0.52MEC norm ð16OÞ �0.18 �0.24 �0.06 �0.05 �0.22 �0.27EBð12CÞ �0.01 �0.01 �0.02 �0.02 0 �0.02EBð16OÞ �0.01 �0.01 �0.02 �0.02 0 �0.02CA5 ð0Þ �0.70 �0.46 �0.24 �0.21 �0.53 �0.32
M1πA �0.99 �0.28 �0.75 �0.65 �0.44 �0.21
I ¼ 12Bkg �0.29 �0.21 �0.08 �0.07 �0.23 �0.17
νe=νμ �0.02 0 �0.01 �0.01 �0.01 0CC Other shape �0.65 �0.70 �0.06 �0.79 �0.06 �0.75CC Coherent �0.01 �0.01 0 �0.05 �0.69 �0.73NC Coherent 0 0 0 0 0 0NC Other �1.28 �0.39 �0.89 �0.77 �0.63 �0.14π FSI �0.16 �0.19 �0.11 �0.09 �0.18 �0.23MEC norm Other �0.08 �0.15 �0.07 �0.20 �0.13 �0.20Total �2.13 �1.16 �1.56 �1.36 �1.31 �1.32
TABLE V. Summary table for detector response uncertainties (fractional errors in %).
Parameter σðν̄Þ σðνÞ Rðν; ν̄Þ Aðν; ν̄Þ Σðν; ν̄Þ Δðν; ν̄ÞTPC tracking efficiency �0.37 �0.32 �0.04 �0.04 �0.34 �0.29Charge misidentification �0.37 �0.32 �0.04 �0.04 �0.34 �0.29Sand/Rock muon interference �1.45 �2.20 �0.74 �0.70 �1.99 �2.70Fiducial mass �0.96 �0.96 0 0 �1.36 �1.36Fiducial volume boundaries �0.13 �0.97 �0.83 �1.39 �0.77 �0.74Total �1.82 �2.63 �1.11 �1.02 �2.58 �3.35
TABLE VI. Tabulation of flux, targets, and data/MC events used in the cross section calculations. The data corrected values arebackground subtracted and divided by the MC efficiency.
Inputs for cross sections Units RHC ν̄ mode FHC ν mode
Integrated flux [cm2=1021 PoT] 1.477 × 10¹³ 1.823 × 10¹³
Number of targets (data) [Nucleons] 3.147 × 1030 3.147 × 1030
Number of targets (MC) [Nucleons] 3.119 × 1030 3.119 × 1030
Number of data/MC events (restricted PS) [Events] 1; 498=1; 634 14; 398=15; 284Data corrected (restricted PS) [Events=1021 PoT] 41; 821� 1; 334 138; 576� 1; 249
MEASUREMENT OF ν̄μ AND νμ … PHYSICAL REVIEW D 96, 052001 (2017)
052001-11
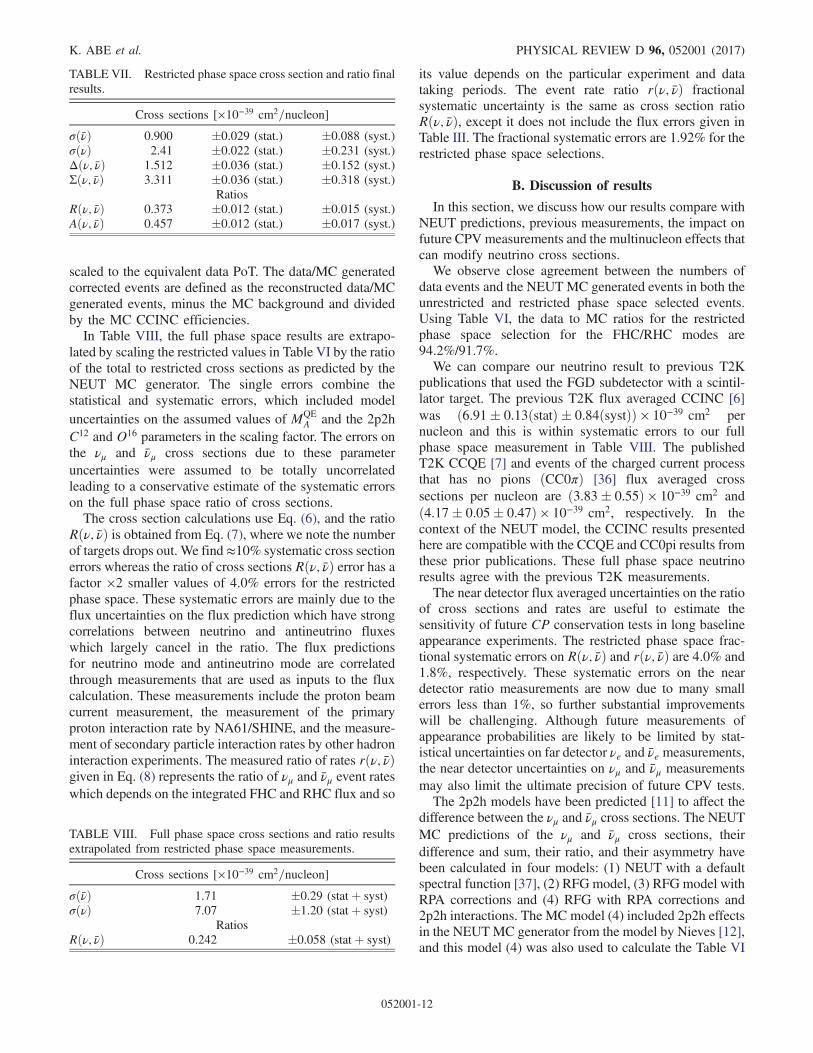
scaled to the equivalent data PoT. The data/MC generatedcorrected events are defined as the reconstructed data/MCgenerated events, minus the MC background and dividedby the MC CCINC efficiencies.In Table VIII, the full phase space results are extrapo-
lated by scaling the restricted values in Table VI by the ratioof the total to restricted cross sections as predicted by theNEUT MC generator. The single errors combine thestatistical and systematic errors, which included modeluncertainties on the assumed values of MQE
A and the 2p2hC12 and O16 parameters in the scaling factor. The errors onthe νμ and ν̄μ cross sections due to these parameteruncertainties were assumed to be totally uncorrelatedleading to a conservative estimate of the systematic errorson the full phase space ratio of cross sections.The cross section calculations use Eq. (6), and the ratio
Rðν; ν̄Þ is obtained from Eq. (7), where we note the numberof targets drops out. We find≈10% systematic cross sectionerrors whereas the ratio of cross sections Rðν; ν̄Þ error has afactor ×2 smaller values of 4.0% errors for the restrictedphase space. These systematic errors are mainly due to theflux uncertainties on the flux prediction which have strongcorrelations between neutrino and antineutrino fluxeswhich largely cancel in the ratio. The flux predictionsfor neutrino mode and antineutrino mode are correlatedthrough measurements that are used as inputs to the fluxcalculation. These measurements include the proton beamcurrent measurement, the measurement of the primaryproton interaction rate by NA61/SHINE, and the measure-ment of secondary particle interaction rates by other hadroninteraction experiments. The measured ratio of rates rðν; ν̄Þgiven in Eq. (8) represents the ratio of νμ and ν̄μ event rateswhich depends on the integrated FHC and RHC flux and so
its value depends on the particular experiment and datataking periods. The event rate ratio rðν; ν̄Þ fractionalsystematic uncertainty is the same as cross section ratioRðν; ν̄Þ, except it does not include the flux errors given inTable III. The fractional systematic errors are 1.92% for therestricted phase space selections.
B. Discussion of results
In this section, we discuss how our results compare withNEUT predictions, previous measurements, the impact onfuture CPV measurements and the multinucleon effects thatcan modify neutrino cross sections.We observe close agreement between the numbers of
data events and the NEUTMC generated events in both theunrestricted and restricted phase space selected events.Using Table VI, the data to MC ratios for the restrictedphase space selection for the FHC/RHC modes are94.2%/91.7%.We can compare our neutrino result to previous T2K
publications that used the FGD subdetector with a scintil-lator target. The previous T2K flux averaged CCINC [6]was ð6.91� 0.13ðstatÞ � 0.84ðsystÞÞ × 10−39 cm2 pernucleon and this is within systematic errors to our fullphase space measurement in Table VIII. The publishedT2K CCQE [7] and events of the charged current processthat has no pions ðCC0πÞ [36] flux averaged crosssections per nucleon are ð3.83� 0.55Þ × 10−39 cm2 andð4.17� 0.05� 0.47Þ × 10−39 cm2, respectively. In thecontext of the NEUT model, the CCINC results presentedhere are compatible with the CCQE and CC0pi results fromthese prior publications. These full phase space neutrinoresults agree with the previous T2K measurements.The near detector flux averaged uncertainties on the ratio
of cross sections and rates are useful to estimate thesensitivity of future CP conservation tests in long baselineappearance experiments. The restricted phase space frac-tional systematic errors on Rðν; ν̄Þ and rðν; ν̄Þ are 4.0% and1.8%, respectively. These systematic errors on the neardetector ratio measurements are now due to many smallerrors less than 1%, so further substantial improvementswill be challenging. Although future measurements ofappearance probabilities are likely to be limited by stat-istical uncertainties on far detector νe and ν̄e measurements,the near detector uncertainties on νμ and ν̄μ measurementsmay also limit the ultimate precision of future CPV tests.The 2p2h models have been predicted [11] to affect the
difference between the νμ and ν̄μ cross sections. The NEUTMC predictions of the νμ and ν̄μ cross sections, theirdifference and sum, their ratio, and their asymmetry havebeen calculated in four models: (1) NEUT with a defaultspectral function [37], (2) RFG model, (3) RFG model withRPA corrections and (4) RFG with RPA corrections and2p2h interactions. The MC model (4) included 2p2h effectsin the NEUTMC generator from the model by Nieves [12],and this model (4) was also used to calculate the Table VI
TABLE VII. Restricted phase space cross section and ratio finalresults.
Cross sections [×10−39 cm2=nucleon]
σðν̄Þ 0.900 �0.029 (stat.) �0.088 (syst.)σðνÞ 2.41 �0.022 (stat.) �0.231 (syst.)Δðν; ν̄Þ 1.512 �0.036 (stat.) �0.152 (syst.)Σðν; ν̄Þ 3.311 �0.036 (stat.) �0.318 (syst.)
RatiosRðν; ν̄Þ 0.373 �0.012 (stat.) �0.015 (syst.)Aðν; ν̄Þ 0.457 �0.012 (stat.) �0.017 (syst.)
TABLE VIII. Full phase space cross sections and ratio resultsextrapolated from restricted phase space measurements.
Cross sections [×10−39 cm2=nucleon]
σðν̄Þ 1.71 �0.29 (stat þ syst)σðνÞ 7.07 �1.20 (stat þ syst)
RatiosRðν; ν̄Þ 0.242 �0.058 (stat þ syst)
K. ABE et al. PHYSICAL REVIEW D 96, 052001 (2017)
052001-12
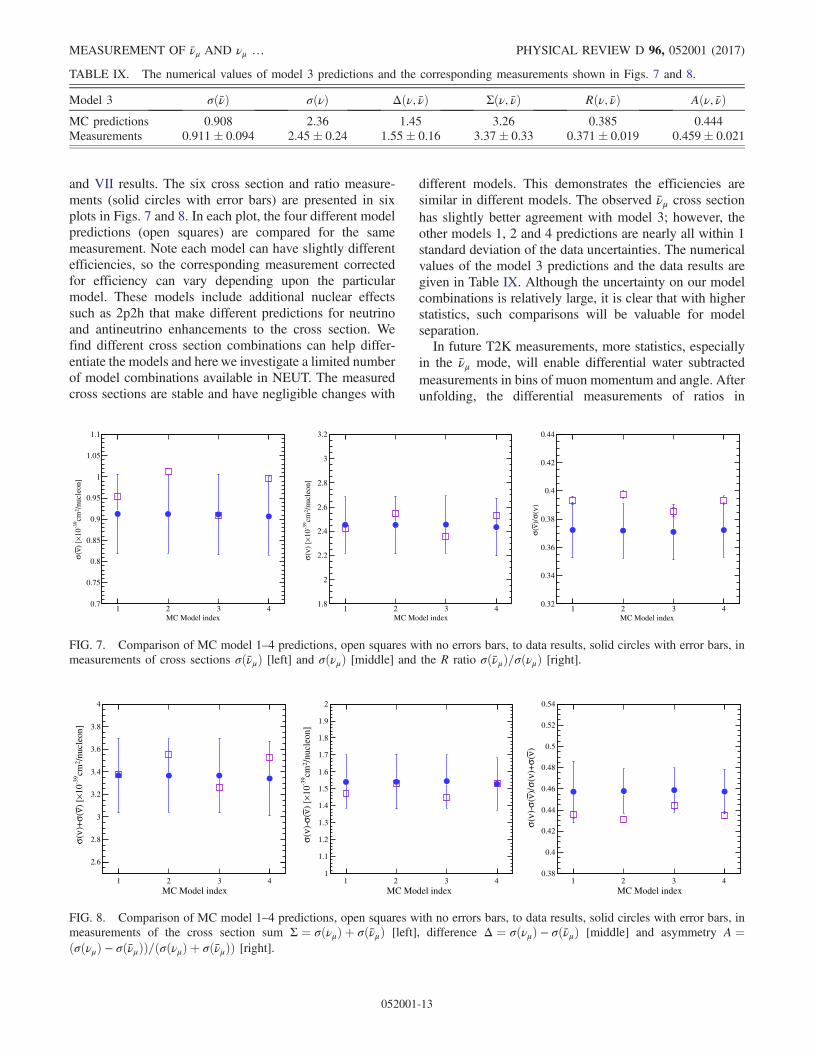
and VII results. The six cross section and ratio measure-ments (solid circles with error bars) are presented in sixplots in Figs. 7 and 8. In each plot, the four different modelpredictions (open squares) are compared for the samemeasurement. Note each model can have slightly differentefficiencies, so the corresponding measurement correctedfor efficiency can vary depending upon the particularmodel. These models include additional nuclear effectssuch as 2p2h that make different predictions for neutrinoand antineutrino enhancements to the cross section. Wefind different cross section combinations can help differ-entiate the models and here we investigate a limited numberof model combinations available in NEUT. The measuredcross sections are stable and have negligible changes with
different models. This demonstrates the efficiencies aresimilar in different models. The observed ν̄μ cross sectionhas slightly better agreement with model 3; however, theother models 1, 2 and 4 predictions are nearly all within 1standard deviation of the data uncertainties. The numericalvalues of the model 3 predictions and the data results aregiven in Table IX. Although the uncertainty on our modelcombinations is relatively large, it is clear that with higherstatistics, such comparisons will be valuable for modelseparation.In future T2K measurements, more statistics, especially
in the ν̄μ mode, will enable differential water subtractedmeasurements in bins of muon momentum and angle. Afterunfolding, the differential measurements of ratios in
TABLE IX. The numerical values of model 3 predictions and the corresponding measurements shown in Figs. 7 and 8.
Model 3 σðν̄Þ σðνÞ Δðν; ν̄Þ Σðν; ν̄Þ Rðν; ν̄Þ Aðν; ν̄ÞMC predictions 0.908 2.36 1.45 3.26 0.385 0.444Measurements 0.911� 0.094 2.45� 0.24 1.55� 0.16 3.37� 0.33 0.371� 0.019 0.459� 0.021
MC Model index1 2 3 4
/nuc
leon
]2
cm-3
910×
) [
ν(σ
0.7
0.75
0.8
0.85
0.9
0.95
1
1.05
1.1
MC Model index1 2 3 4
/nuc
leon
]2
cm-3
910×
) [
ν(σ
1.8
2
2.2
2.4
2.6
2.8
3
3.2
MC Model index1 2 3 4
) ν(σ)/ν( σ
0.32
0.34
0.36
0.38
0.4
0.42
0.44
FIG. 7. Comparison of MC model 1–4 predictions, open squares with no errors bars, to data results, solid circles with error bars, inmeasurements of cross sections σðν̄μÞ [left] and σðνμÞ [middle] and the R ratio σðν̄μÞ=σðνμÞ [right].
MC Model index
/nuc
leon
]2
cm-3
910×
) [
ν(σ)+ν(σ
2.6
2.8
3
3.2
3.4
3.6
3.8
4
MC Model index
/nuc
leon
]2
cm-3
910×
) [
ν(σ)-ν(σ
1
1.1
1.2
1.3
1.4
1.5
1.6
1.7
1.8
1.9
2
MC Model index1 2 3 4 1 2 3 4 1 2 3 4
) ν( σ)+ν (σ
)/ν(σ)-ν(σ
0.38
0.4
0.42
0.44
0.46
0.48
0.5
0.52
0.54
FIG. 8. Comparison of MC model 1–4 predictions, open squares with no errors bars, to data results, solid circles with error bars, inmeasurements of the cross section sum Σ ¼ σðνμÞ þ σðν̄μÞ [left], difference Δ ¼ σðνμÞ − σðν̄μÞ [middle] and asymmetry A ¼ðσðνμÞ − σðν̄μÞÞ=ðσðνμÞ þ σðν̄μÞÞ [right].
MEASUREMENT OF ν̄μ AND νμ … PHYSICAL REVIEW D 96, 052001 (2017)
052001-13
particular, differences and sums are expected to provideimproved estimates of systematic uncertainties in futureexperimental CPV tests and better tests of 2p2h models.
VIII. CONCLUSIONS
In summary, the T2K experiment has measured chargedcurrent inclusive events, in a restricted phase space ofθμ < 32° and pμ > 500 MeV=c, the flux averaged crosssections (cm2 per nucleon) and ratio of cross sections, as
σðν̄Þ¼ ð0.900�0.029ðstatÞ�0.088ðsystÞÞ×10−39; ð12Þ
σðνÞ ¼ ð2.41� 0.021ðstatÞ � 0.231ðsystÞÞ × 10−39 ð13Þ
and
R
�σðν̄ÞσðνÞ
�¼ 0.373� 0.012ðstatÞ � 0.015ðsystÞ: ð14Þ
The ν̄μ inclusive cross section and the ratio R results are thefirst published measurements at νμ and ν̄μ flux energies [38]below 1.5 GeV. Although the current uncertainty on thedifferent model combinations is relatively large, we expect
future higher statistics comparisons will be valuable formodel discrimination.
ACKNOWLEDGMENTS
We thank the J-PARC staff for superb acceleratorperformance. We thank the CERN NA61/SHINECollaboration for providing valuable particle productiondata. We acknowledge the support of MEXT, Japan;NSERC (Grant No. SAPPJ-2014-00031), NRC and CFI,Canada; CEA and CNRS/IN2P3, France; DFG, Germany;INFN, Italy; National Science Centre (NCN) and Ministryof Science and Higher Education, Poland; RSF, RFBR, andMES, Russia; MINECO and ERDF funds, Spain; SNSFand SERI, Switzerland; STFC, UK; and DOE, USA. Wealso thank CERN for the UA1/NOMADmagnet, DESY forthe HERA-B magnet mover system, NII for SINET4, theWestGrid and SciNet consortia in Compute Canada, andGridPP in the United Kingdom. In addition, participation ofindividual researchers and institutions has been furthersupported by funds from ERC (FP7), H2020 GrantNo. RISE-GA644294-JENNIFER, EU; JSPS, Japan;Royal Society, UK; the Alfred P. Sloan Foundation andthe DOE Early Career program, USA.
[1] Y. Fukuda et al. (Super-Kamiokande Collaboration), Phys.Rev. Lett. 81, 1562 (1998).
[2] For a description of neutrino physics see reviews in C.Patrignani et al. (Particle Data Group), Chin. Phys. C 40,100001 (2016). The neutrino parameters are given in section14. The CP violations tests are given in section 14.7. Thematter effects are given in section 14.8.
[3] S. P. Mikheev and A. Yu. Smirnov, Sov. J. Nucl. Phys. 42,913 (1985); L. Wolfenstein, Phys. Rev. D 17, 2369 (1978).
[4] K. Abe et al. (T2K Collaboration), Nucl. Instrum. MethodsPhys. Res., Sect. A 659, 106 (2011); P. Adamson et al.(NOvA Collaboration), Nucl. Instrum. Methods Phys. Res.,Sect. A 806, 279 (2016); K. Anderson et al., The NuMIFacility Technical Design Report, FNAL Laboratory ReportFermilab-Design-1998-01 (unpublished).
[5] R. Acciarri et al. (DUNE Collaboration), arXiv:1601.02984;K. Abe et al. (HyperK Collaboration), KEK preprint2016-21, https://lib‑extopc.kek.jp/preprints/PDF/2016/1627/1627021.pdf (unpublished).
[6] K. Abe et al., Phys. Rev. D 87, 092003 (2013). Note that thispublication used the FGD detector which is mainly ahydrocarbon target, whereas this paper reports on a targetthat is mainly water þ hydrocarbon with heavier elementsgiven in Table 1.
[7] K. Abe et al., Phys. Rev. D 92, 112003 (2015). Note that thispublication quotes the cross section per neutron. In thispaper we provide the CCQE cross section as ð4.15� 0.6Þ ×10−39 cm2 per nucleon which is a factor 2 smaller.
[8] L. Ren et al. (MINVERVACollaboration), Phys. Rev. D 95,072009 (2017).
[9] A. Aguilar-Arevalo et al. (MiniBooNE Collaboration),Phys. Rev. D 81, 092005 (2010); A. Aguilar-Arevaloet al., Phys. Rev. D 88, 032001 (2013).
[10] M. Martini, M. Ericson, G. Chanfray, and J. Marteau, Phys.Rev. C 81, 045502 (2010).
[11] M. Ericson and M. Martini, Phys. Rev. C 91, 035501(2015).
[12] R. Gran, J. Nieves, F. Sanchez, and M. J. Vicente Vacas,Phys. Rev. D 88, 113007 (2013).
[13] C. Juszczak, J. T. Sobczyk, and J. Zmuda, Phys. Rev. C 82,045502 (2010); J. Nieves, I. R. Simo, and M. V. Vacas,Phys. Lett. B 707, 72 (2012).
[14] T2K Experiment, K. Abe et al. (T2K Collaboration),Nucl. Instrum.Methods Phys. Res., Sect. A 659, 106 (2011).
[15] K. Abe et al. (T2K Collaboration), Phys. Rev. D 87, 012001(2013); 87, 019902 (2013).
[16] FLUKA package, G. Battistoni, S. Muraro, P. R. Sala, F.Cerutti, A. Ferrari, S. Roesler, A. Fasso, and J. Ranft, AIPConf. Proc. 896, 31 (2007); A. Ferrari, P. R. Sala, A. Fasso,and J. Ranft, CERN Report CERN- 2005-010, SLACReport SLAC-R-773 and INFN Report INFN-TC-05-11(unpublished reports).
[17] S. Agostinelli et al. (GEANT4 collaboration), Nucl. Ins-trum. Methods Phys. Res., Sect. A 506, 250 (2003).
[18] GCALOR package, C. Zeitnitz, and T. A. Gabriel, Nucl.Instrum. Methods Phys. Res., Sect. A 349, 106 (1994).
K. ABE et al. PHYSICAL REVIEW D 96, 052001 (2017)
052001-14
[19] N. Abgrall et al. (NA61/SHINE Collaboration), Eur. Phys.J. C 76, 84 (2016).
[20] See the detailed descriptions and the references for TPCanalysis selections in Sec. IV., for neutrino interactions inSec. V., for beam flux uncertainties in Sec. VI A. and forCC-other in Sec. VI. B. in K. Abe et al. (T2K Collabora-tion), Phys. Rev. D 92, 112003 (2015).
[21] S. Assylbekov et al. (T2K ND280 P∅D Collaboration),Nucl. Instrum. Methods Phys. Res., Sect. A 686, 48 (2012).
[22] N. Abgrall et al. (T2K ND280 TPC Collaboration), Nucl.Instrum. Methods Phys. Res., Sect. A 637, 25 (2011).
[23] K. Abe et al. (T2K Collaboration), Phys. Rev. D 91, 112010(2015).
[24] The NEUT simulation is described in Y. Hayato, Acta Phys.Pol. B 40, 2477 (2009). This version 5.3.2 includes themultinucleon ejection model and nuclear long-range corre-lations for CCQE interactions treated in the random phaseapproximation.
[25] J. A. Formaggio and G. P. Zeller, Rev. Mod. Phys. 84, 1307(2012).
[26] Previous T2K published analyses which include extensivedescriptions and use of the interaction model include K. Abeet al. (T2K Collaboration), Phys. Rev. D 93, 112012 (2016);K. Abe et al. (T2K Collaboration), Phys. Rev. D 92, 112003(2015).
[27] C. H. Llewellyn Smith, Phys. Rep. 3, 261 (1972).[28] R. Bradford, A. Bodek, H. S. Budd, and J. Arrington, Nucl.
Phys. B, Proc. Suppl. 159, 127 (2006).[29] R. A. Smith and E. J. Moniz, Nucl. Phys. B43, 605 (1972);
B101, 547(E) (1975).
[30] J. Nieves, I. R. Simo, and M. J. Vicente Vacas, Phys. Rev. C83, 045501 (2011).
[31] D. Rein and L. M. Sehgal, Ann. Phys. (N.Y.) 133, 79 (1981).[32] K. M. Graczyk and J. T. Sobczyk, Phys. Rev. D 77, 053001
(2008); K. M. Graczyk and J. T. Sobczyk, Phys. Rev. D 79,079903(E) (2009).
[33] M. Gluck, E. Reya, and A. Vogt, Eur. Phys. J. C 5, 461(1998).
[34] A. Bodek and U. K. Yang, AIP Conf. Proc. 670, 110 (2003).[35] The recent published MQE
A measurements from the K2K,MiniBooNE, MINOS, and T2K experiments in GeV=c2
are 1.20� 0.12, 1.35� :17, 1.23þ:13−:09 ðstatÞþ:12
−:15 ðsystÞ and1.26þ:21
−:18 , respectively. These results have been publishedin R. Gran et al. (K2K Collaboration), Phys. Rev. D 74,052002 (2006); A. Aguilar-Arevalo et al. (MiniBooNECollaboration), Phys. Rev. D 81, 092005 (2010); P. Adam-son et al. (MINOS Collaboration), Phys. Rev. D 91, 012005(2015); K. Abe et al. (T2K Collaboration), Phys. Rev. D 92,112003 (2015); The bubble chamber results(MA ¼ 0.94� :03 GeV=c2) have been reanalyzed in K.M. Graczyk, D. Kielczewska, P. Przewlocki, and J. T.Sobczyk, Phys. Rev. D 80, 093001 (2009).
[36] K. Abe et al. (T2K Collaboration), Phys. Rev. D 93, 112012(2016).
[37] O. Benhar and A. Fabrocini, Phys. Rev. C 62, 034304(2000).
[38] See http://t2k‑experiment.org/results/neutrino‑beam‑flux‑prediction‑2016/ for the detailed ND280 FHC and RHCneutrino/antineutrino flux predictions used in this paper.
MEASUREMENT OF ν̄μ AND νμ … PHYSICAL REVIEW D 96, 052001 (2017)
052001-15