Selectionof charged–currentinducedinteractionswith ...
34
Selection of ν μ charged–current induced interactions with N>0 protons and performance of events with N=2 protons in the final state in the MicroBooNE detector from the BNB MICROBOONE-NOTE-1056-PUB The MicroBooNE Collaboration October 12, 2018 Abstract Using the MicroBooNE liquid argon time projection chamber (LArTPC) at Fermilab’s Booster Neutrino Beam, we examine samples of charged current events from neutrino scat- tering on argon with exactly two or with any number of protons in final states with no other hadrons except neutrons. We described the particle identification method employed for pro- tons, and we compare measured kinematic distributions of muons and protons to predictions from several Monte Carlo event generators. 1
Transcript of Selectionof charged–currentinducedinteractionswith ...
Selection of νµ charged–current induced interactions withN>0 protons and performance of events with N=2 protonsin the final state in the MicroBooNE detector from the BNB
MICROBOONE-NOTE-1056-PUB
The MicroBooNE Collaboration
October 12, 2018
Abstract
Using the MicroBooNE liquid argon time projection chamber (LArTPC) at Fermilab’sBooster Neutrino Beam, we examine samples of charged current events from neutrino scat-tering on argon with exactly two or with any number of protons in final states with no otherhadrons except neutrons. We described the particle identification method employed for pro-tons, and we compare measured kinematic distributions of muons and protons to predictionsfrom several Monte Carlo event generators.
1
Contents1 Introduction 3
2 Motivation 32.1 MicroBooNE simulation . . . . . . . . . . . . . . . . . . . . . . . . . . . . . . . . . 72.2 Data and Monte Carlo data sets . . . . . . . . . . . . . . . . . . . . . . . . . . . . 8
3 The νµ Charged Current inclusive selection 9
4 Particle identification in LArTPC 9
5 The νµ Charged Current N Proton Selection 135.1 Signal Definition and Background Categories . . . . . . . . . . . . . . . . . . . . . 135.2 Event Selection Scheme . . . . . . . . . . . . . . . . . . . . . . . . . . . . . . . . . 145.3 Proton Momentum Threshold Determination . . . . . . . . . . . . . . . . . . . . . 155.4 Proton Multiplicity Study . . . . . . . . . . . . . . . . . . . . . . . . . . . . . . . . 175.5 Signal and background analysis . . . . . . . . . . . . . . . . . . . . . . . . . . . . . 17
5.5.1 Efficiency dependence on model . . . . . . . . . . . . . . . . . . . . . . . . . 185.6 CCNProton Kinematical observables . . . . . . . . . . . . . . . . . . . . . . . . . . 195.7 Study of tracking resolution . . . . . . . . . . . . . . . . . . . . . . . . . . . . . . . 22
6 The νµ charged current two proton events 236.1 Kinematical distributions for the CC2Proton sample with a proton threshold mo-
menta of 300 MeV/c . . . . . . . . . . . . . . . . . . . . . . . . . . . . . . . . . . . 246.2 Discussion on CC2Proton analysis . . . . . . . . . . . . . . . . . . . . . . . . . . . 29
7 Conclusions 30
8 On-beam data Event Displays 31
2
1 IntroductionThis note describes the development and application of a fully-automated algorithm to identify finalstate protons in the MicroBooNE LAr TPC detector. The technique utilizes a χ2 discriminatorcomparing the dE/dx along a candidate track to the theoretical expectation for a proton traversingliquid argon. Liquid Argon TPCs provide improved response to final state hadrons and greatersensitivity when comparing data to theoretical neutrino interaction models, final state interactionmodels, and nuclear models. Proton candidate reconstruction and identification is an importantdevelopment on the path to improved cross section measurements and comparison with thesemodels. The identification of final state particles is a key component to improved studies of neutrinointeractions and comparison with theoretical models. The focus of the note is the presentation ofa new proton identification method, efficiency and purity determination of this algorithm, and theapplication within the νµ–CC inclusive framework [8]. Finally, we present comparisons betweendata and two model choices of GENIE MC generated samples within this event selection.
2 MotivationThe study of charged–current neutrino interactions in Ar is an important component on the pathto improving neutrino interaction models and reducing the uncertainties for current and futureneutrino oscillation measurements. Past CCQE results came from MiniBooNE [10] without re-construction of final-state nucleons. The neutrino beam energy spectrum is almost identical forMiniBooNE is almost identical to MicroBooNE. This allows results to improve upon MiniBooNEmeasurements. The most studied signal is now CC0π (sometimes called "CCQE-like") where thesignal has one muon, no pions, and any number of nucleons in the final state. Many experimentshave measured the CCQE–like interaction because it has a large cross-section in most acceleratorbased oscillation experiments, and is often the main signal channel for oscillation measurements.This note focuses on the study of νµ induced CC events containing a reconstructed muon candi-date and at least one proton candidate. In future measurements, this channel will allow for thedisentanglement of effects from neutrino interaction models, Final State Interaction (FSI) modelsand other theoretical concerns.
The MiniBooNE results were the primary indication for extending the 2p–2h mechanism (wellknown process in nuclear theory) into neutrino experiment interpretation; this is significant becausethe final state has an enhancement in nucleon multiplicity and can modified the final muon andhadron kinematics. Using the same CCQE-like definition mentioned earlier, MINERvA [9] andT2K [11] have used measured cross sections where both true CCQE and 2p2h events are includedin signal while suppressing the dominant background (pion production). Pion production eventswhere the pion is absorbed in the nucleus were also included.
Each detector experiment has a characteristic minimum proton energy based upon detectorperformance and beam properties, 102.3 MeV (450 MeV/c on momenta) for MINERvA and 500MeV/c momenta for T2K. The identification of low momentum protons at MicroBooNE, alongwith an increased detector angular acceptance, gives greater sensitivity to nuclear structure andproton and/or pion FSI in studying these events. Although all Monte Carlo event generators nowinclude 2p2h mechanisms, data samples gives only indirect evidence for it and the improved protonidentification is important to have direct evidence. To study the 2p–2h mechanism with greatersensitivity, an explicit selection of νµ Charged Current two proton candidates is performed as asub–set of the CCNProton sample (CC2Proton). We study the CC2Proton as a function of severalreconstructed observables:
• Muon momenta and angle with respect to neutrino beam
• Protons momenta and angles with respect to neutrino beam
• Angle between the two protons
We present studies that, at the MicroBooNE detector with our current status of simulation andreconstruction, the proton must have a momentum above 300 MeV/c (kinetic energy of 46.8 MeV)to be detected and reconstructed.
Proton multiplicity is explored within this study due to its importance in order to achievemore accurate neutrino energy measurements, this is of strong importance for experiments with
3
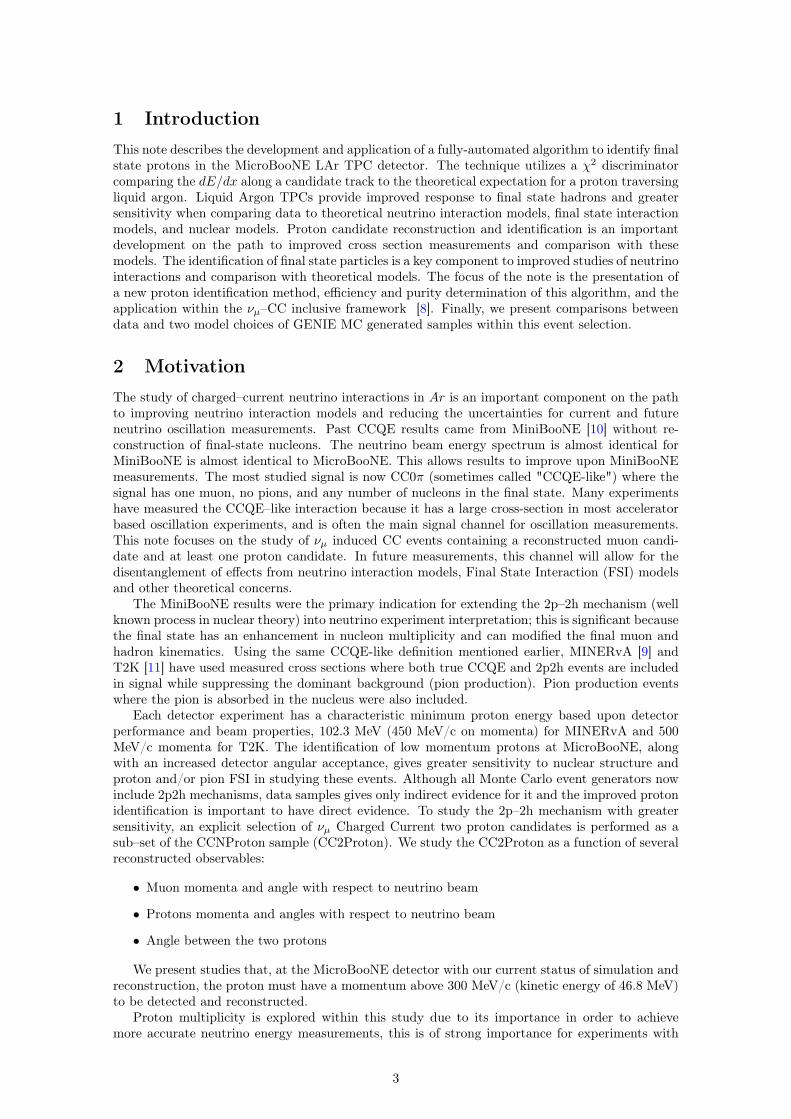
unknown neutrino energy. The measured proton multiplicity in this note is compared with ourdefault neutrino event generator, GENIE. However, in the distributions shown on Figure 1 wecompare the predicted proton multiplicity with different generators. In this case, no reconstructionhave been applied and they are only simulated νµ events in the MicroBooNE detector from theBNB beam with no other hadrons than protons in the final state (CCNp events, N=>0), andproton multiplicity accounts for protons above 300MeV/c in momentum. As seen in Figure 1,when comparing different neutrino event generators, in this case two different model choices forGENIE (left plot GENIE Default, right plot GENIE Alternative, see Section 2.1) and NuWRO(bottom plot, see [13]), proton multiplicity can differ and even more noticeable is that the predictedcomposition at each multiplicity is as well different along the different generators.
Number of protons momentum > 300 MeV/c0 1 2 3 4 5 6 7 8 9 10
frac
tio
n o
f ev
ents
0
0.1
0.2
0.3
0.4
0.5CCQE
CCRES
CC-Coh
CCDIS
CCMEC
Number of protons momentum > 300 MeV/c0 1 2 3 4 5 6 7 8 9 10
frac
tio
n o
f ev
ents
0
0.1
0.2
0.3
0.4
0.5CCQE
CCRES
CC-Coh
CCDIS
CCMEC
Number of protons momentum > 300 MeV/c0 2 4 6 8 10
frac
tio
n o
f ev
ents
0
0.2
0.4
CCQE
CCRES
CC-Coh
CCDIS
CCMEC
Figure 1: Comparison of the predicted proton multiplicity with different generators: GENIEDefault (top left), GENIE Alternative (top right) and NuWRO (bottom). In this case, no recon-struction have been applied and they are only simulated νµ events in the MicroBooNE detectorfrom the BNB beam with no other hadrons than protons in the final state (CCNp events, N=>0).Proton multiplicity accounts for protons above 300MeV/c in momentum. Events are normalizedto unity.
In the study described in this note we investigate events with at least one proton above300MeV/c in momentum. For these events we can infer the neutrino energy by using the samemethodology applied by the ArgoNeuT experiment [1]. We calculate the neutrino energy as:
Eν = Eµ +∑
Tp + Esepar+excit + Trecoil (1)
Trecoil =√
(P 2T,miss −M2
A−np) −MA−np
4
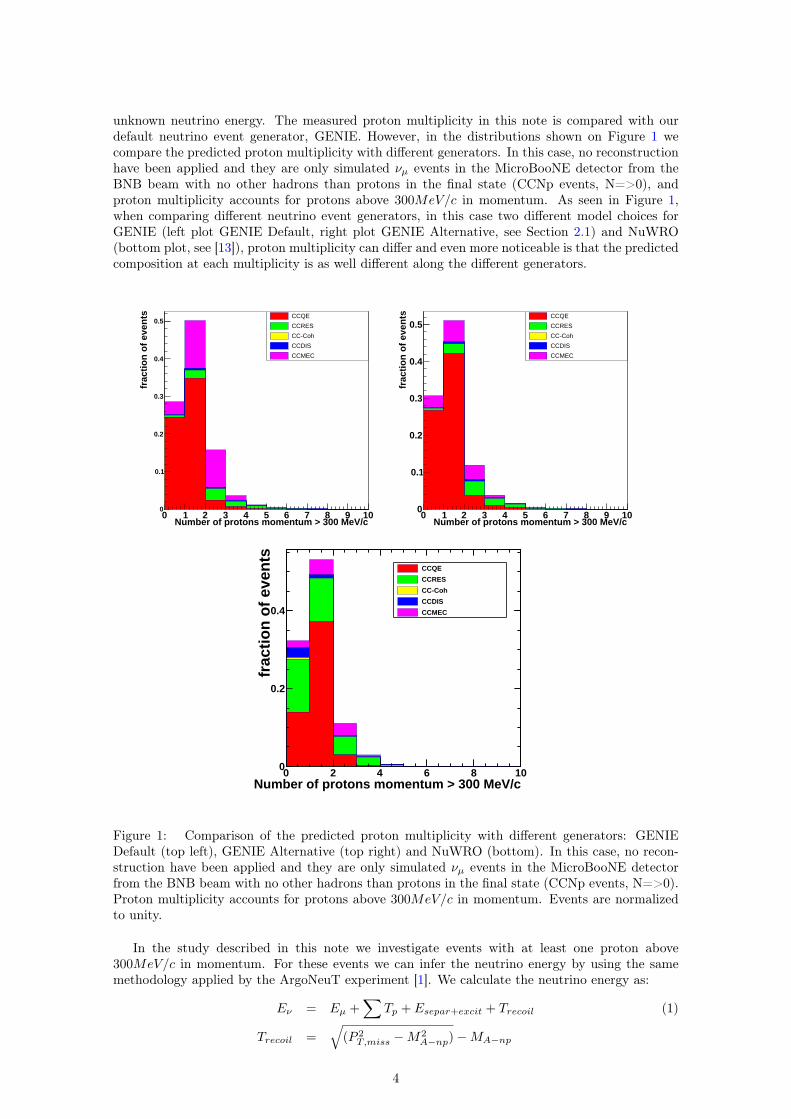
where, MA−np is the mass of the nucleus, and depends on the number of protons in the finalstate. Excitation energy of argon, Esepar+exit, equals to 30.4 MeV and PT,miss is the missingtransverse momentum. The accuracy of this approximation, when applied into reconstructedCCNp events in MicroBooNE, is shown on Figure 2. In this Figure we perform the distribution ofthe true neutrino energy minus calculated neutrino energy stacked by neutrino interaction type,for GENIE Deafult (left) and GENIE Alternative (right).
Figure 2: Distribution of true neutrino energy minus calculated neutrino energy for GENIE Default(Left) and GENIE Alternative (Right).
Additionally, the CC plus two proton exclusive channel (CC2p) is studied because of the sig-nificance of this sample with regards to meson exchange current (MEC) production in neutrinointeraction models, the impact of pion absorption processes, and sensitivity to short range corre-lations (SRC) in nuclear models.
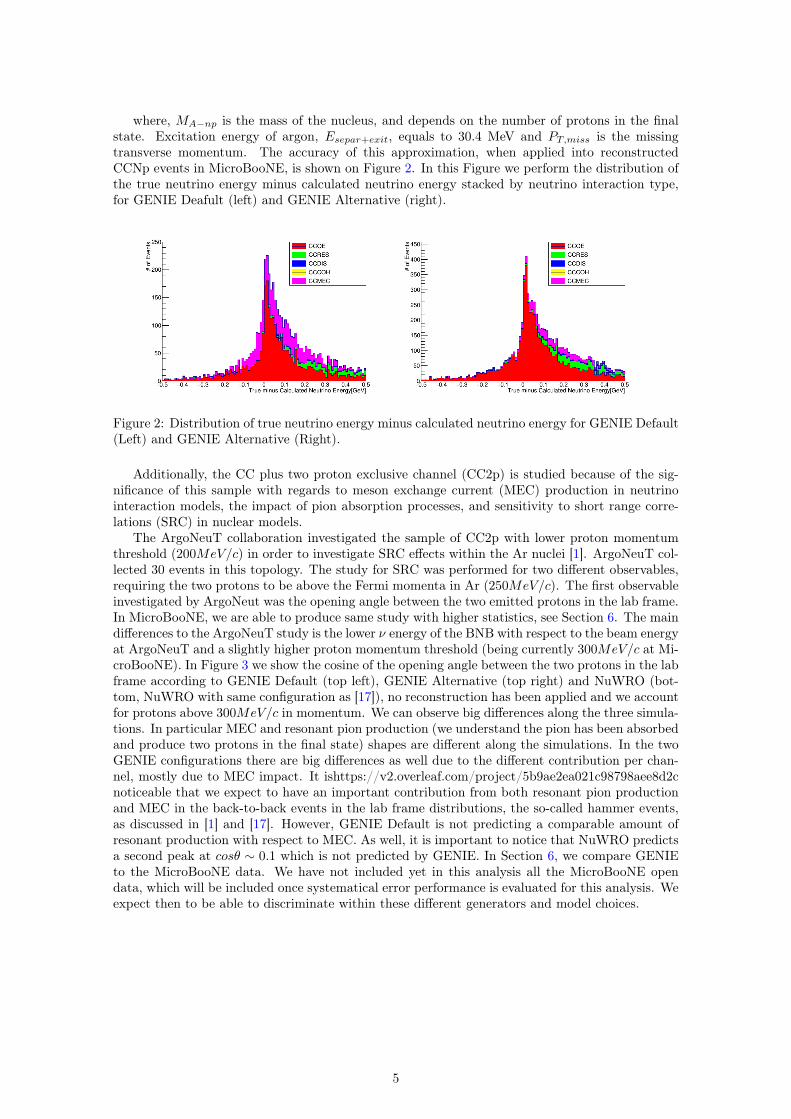
The ArgoNeuT collaboration investigated the sample of CC2p with lower proton momentumthreshold (200MeV/c) in order to investigate SRC effects within the Ar nuclei [1]. ArgoNeuT col-lected 30 events in this topology. The study for SRC was performed for two different observables,requiring the two protons to be above the Fermi momenta in Ar (250MeV/c). The first observableinvestigated by ArgoNeut was the opening angle between the two emitted protons in the lab frame.In MicroBooNE, we are able to produce same study with higher statistics, see Section 6. The maindifferences to the ArgoNeuT study is the lower ν energy of the BNB with respect to the beam energyat ArgoNeuT and a slightly higher proton momentum threshold (being currently 300MeV/c at Mi-croBooNE). In Figure 3 we show the cosine of the opening angle between the two protons in the labframe according to GENIE Default (top left), GENIE Alternative (top right) and NuWRO (bot-tom, NuWRO with same configuration as [17]), no reconstruction has been applied and we accountfor protons above 300MeV/c in momentum. We can observe big differences along the three simula-tions. In particular MEC and resonant pion production (we understand the pion has been absorbedand produce two protons in the final state) shapes are different along the simulations. In the twoGENIE configurations there are big differences as well due to the different contribution per chan-nel, mostly due to MEC impact. It ishttps://v2.overleaf.com/project/5b9ae2ea021c98798aee8d2cnoticeable that we expect to have an important contribution from both resonant pion productionand MEC in the back-to-back events in the lab frame distributions, the so-called hammer events,as discussed in [1] and [17]. However, GENIE Default is not predicting a comparable amount ofresonant production with respect to MEC. As well, it is important to notice that NuWRO predictsa second peak at cosθ ∼ 0.1 which is not predicted by GENIE. In Section 6, we compare GENIEto the MicroBooNE data. We have not included yet in this analysis all the MicroBooNE opendata, which will be included once systematical error performance is evaluated for this analysis. Weexpect then to be able to discriminate within these different generators and model choices.
5
lab framep1p2θcos 1− 0.8− 0.6− 0.4− 0.2− 0 0.2 0.4 0.6 0.8 1
frac
tio
n o
f ev
ents
0
0.02
0.04
0.06
0.08
0.1
0.12
0.14
0.16 CCQE
CCRES
CC-Coh
CCDIS
CCMEC
lab framep1p2θcos 1− 0.8− 0.6− 0.4− 0.2− 0 0.2 0.4 0.6 0.8 1
frac
tio
n o
f ev
ents
0
0.02
0.04
0.06
0.08
0.1
0.12
CCQE
CCRES
CC-Coh
CCDIS
CCMEC
lab framep1p2θcos 1− 0.5− 0 0.5 1
frac
tio
n o
f ev
ents
0
0.05
0.1
CCQE
CCRES
CC-Coh
CCDIS
CCMEC
Figure 3: Opening angle between the two protons in the lab frame according to GENIE Default(top left), GENIE Alternative (top right) and NuWRO (bottom) in the lab frame for the CC2ptopology. Events are normalized to unity.
The second observable studied by ArgoNeuT was the two body current events trying to recon-struct initial nucleon-nucleon configuration. In this case, it is performed the cosine of the anglebetween the least energetic proton and the struck nucleon. The struck nucleon 3-momenta, ~pn, iscalculated using:
~pn = ~p1 − ~q3
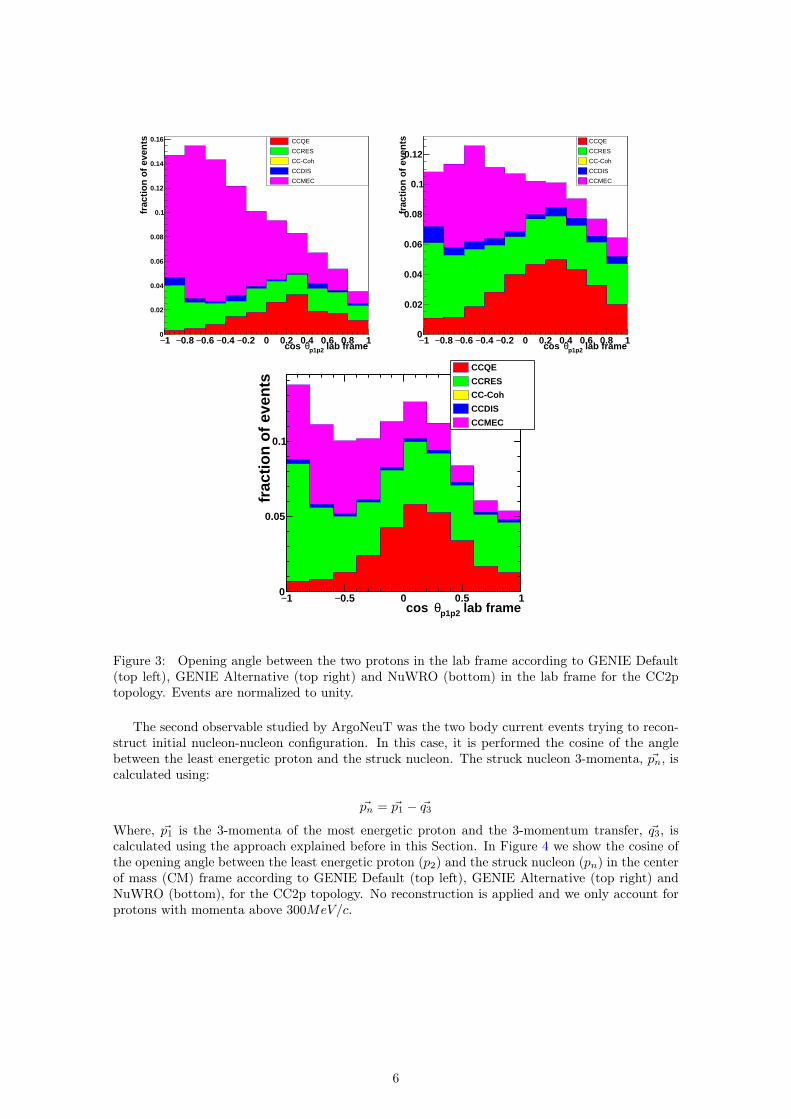
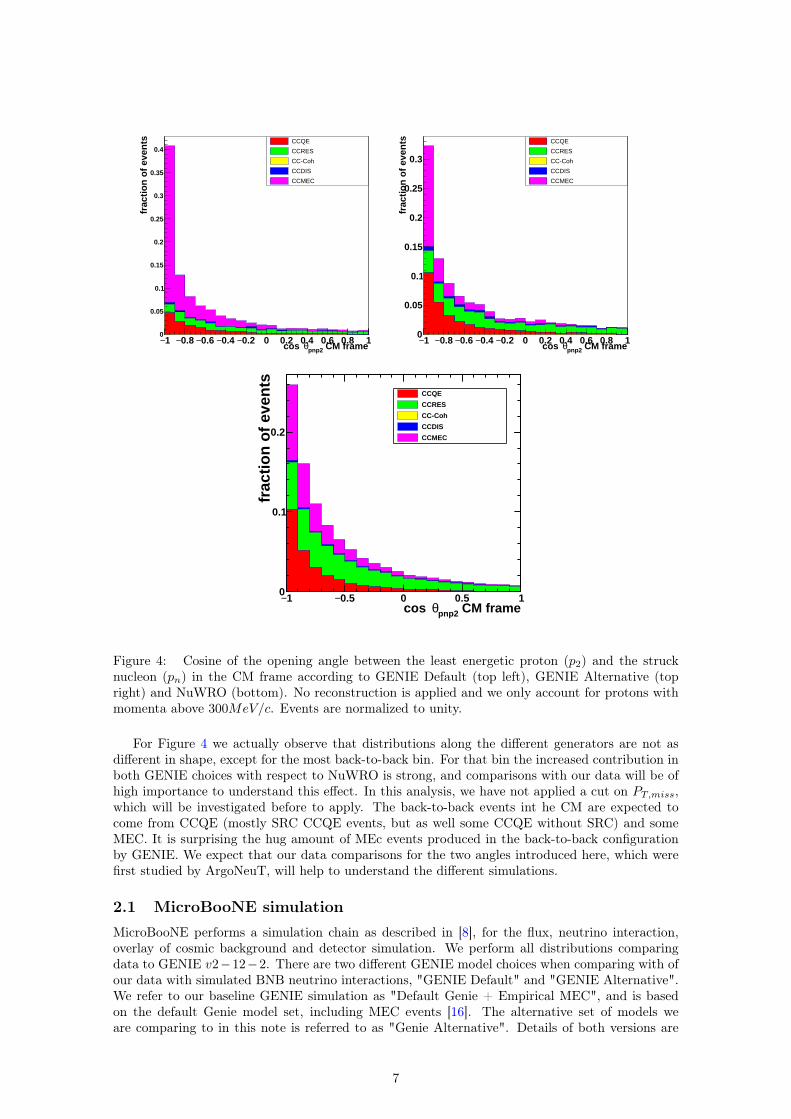
Where, ~p1 is the 3-momenta of the most energetic proton and the 3-momentum transfer, ~q3, iscalculated using the approach explained before in this Section. In Figure 4 we show the cosine ofthe opening angle between the least energetic proton (p2) and the struck nucleon (pn) in the centerof mass (CM) frame according to GENIE Default (top left), GENIE Alternative (top right) andNuWRO (bottom), for the CC2p topology. No reconstruction is applied and we only account forprotons with momenta above 300MeV/c.
6
CM framepnp2θcos 1− 0.8− 0.6− 0.4− 0.2− 0 0.2 0.4 0.6 0.8 1
frac
tio
n o
f ev
ents
0
0.05
0.1
0.15
0.2
0.25
0.3
0.35
0.4CCQE
CCRES
CC-Coh
CCDIS
CCMEC
CM framepnp2θcos 1− 0.8− 0.6− 0.4− 0.2− 0 0.2 0.4 0.6 0.8 1
frac
tio
n o
f ev
ents
0
0.05
0.1
0.15
0.2
0.25
0.3
CCQE
CCRES
CC-Coh
CCDIS
CCMEC
CM framepnp2θcos 1− 0.5− 0 0.5 1
frac
tio
n o
f ev
ents
0
0.1
0.2
CCQE
CCRES
CC-Coh
CCDIS
CCMEC
Figure 4: Cosine of the opening angle between the least energetic proton (p2) and the strucknucleon (pn) in the CM frame according to GENIE Default (top left), GENIE Alternative (topright) and NuWRO (bottom). No reconstruction is applied and we only account for protons withmomenta above 300MeV/c. Events are normalized to unity.
For Figure 4 we actually observe that distributions along the different generators are not asdifferent in shape, except for the most back-to-back bin. For that bin the increased contribution inboth GENIE choices with respect to NuWRO is strong, and comparisons with our data will be ofhigh importance to understand this effect. In this analysis, we have not applied a cut on PT,miss,which will be investigated before to apply. The back-to-back events int he CM are expected tocome from CCQE (mostly SRC CCQE events, but as well some CCQE without SRC) and someMEC. It is surprising the hug amount of MEc events produced in the back-to-back configurationby GENIE. We expect that our data comparisons for the two angles introduced here, which werefirst studied by ArgoNeuT, will help to understand the different simulations.
2.1 MicroBooNE simulationMicroBooNE performs a simulation chain as described in [8], for the flux, neutrino interaction,overlay of cosmic background and detector simulation. We perform all distributions comparingdata to GENIE v2−12−2. There are two different GENIE model choices when comparing with ofour data with simulated BNB neutrino interactions, "GENIE Default" and "GENIE Alternative".We refer to our baseline GENIE simulation as "Default Genie + Empirical MEC", and is basedon the default Genie model set, including MEC events [16]. The alternative set of models weare comparing to in this note is referred to as "Genie Alternative". Details of both versions are
7
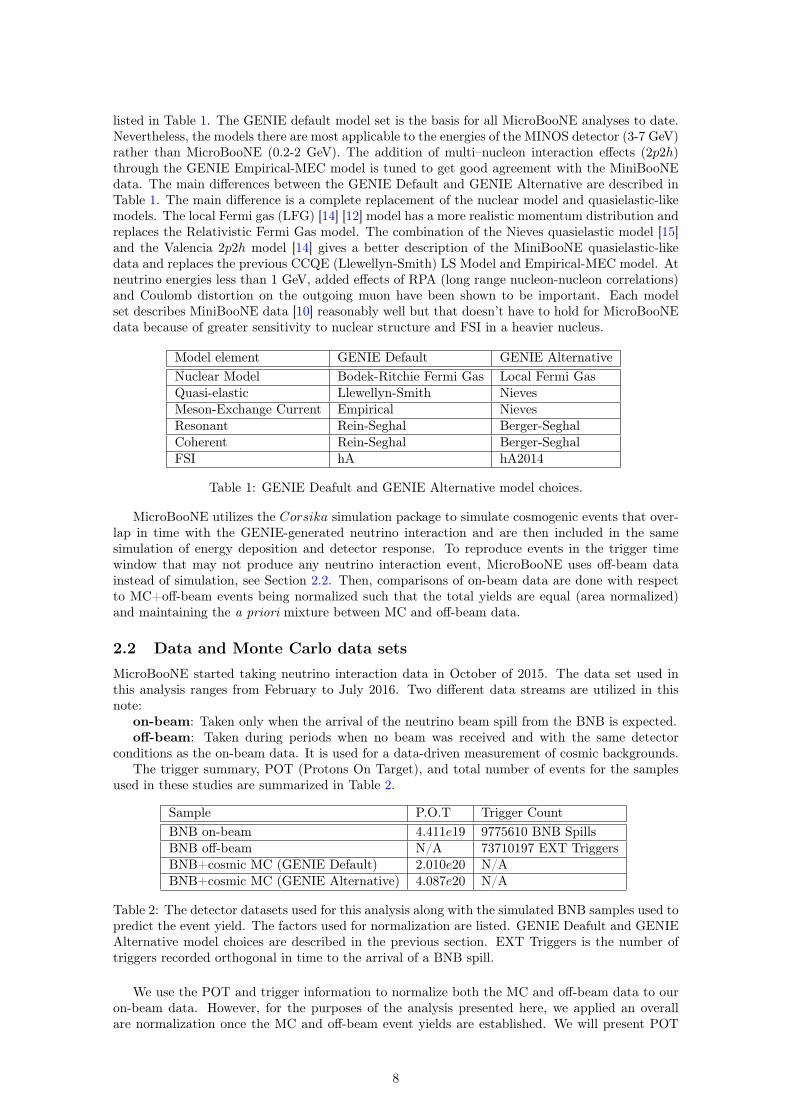
listed in Table 1. The GENIE default model set is the basis for all MicroBooNE analyses to date.Nevertheless, the models there are most applicable to the energies of the MINOS detector (3-7 GeV)rather than MicroBooNE (0.2-2 GeV). The addition of multi–nucleon interaction effects (2p2h)through the GENIE Empirical-MEC model is tuned to get good agreement with the MiniBooNEdata. The main differences between the GENIE Default and GENIE Alternative are described inTable 1. The main difference is a complete replacement of the nuclear model and quasielastic-likemodels. The local Fermi gas (LFG) [14] [12] model has a more realistic momentum distribution andreplaces the Relativistic Fermi Gas model. The combination of the Nieves quasielastic model [15]and the Valencia 2p2h model [14] gives a better description of the MiniBooNE quasielastic-likedata and replaces the previous CCQE (Llewellyn-Smith) LS Model and Empirical-MEC model. Atneutrino energies less than 1 GeV, added effects of RPA (long range nucleon-nucleon correlations)and Coulomb distortion on the outgoing muon have been shown to be important. Each modelset describes MiniBooNE data [10] reasonably well but that doesn’t have to hold for MicroBooNEdata because of greater sensitivity to nuclear structure and FSI in a heavier nucleus.
Model element GENIE Default GENIE AlternativeNuclear Model Bodek-Ritchie Fermi Gas Local Fermi GasQuasi-elastic Llewellyn-Smith NievesMeson-Exchange Current Empirical NievesResonant Rein-Seghal Berger-SeghalCoherent Rein-Seghal Berger-SeghalFSI hA hA2014
Table 1: GENIE Deafult and GENIE Alternative model choices.
MicroBooNE utilizes the Corsika simulation package to simulate cosmogenic events that over-lap in time with the GENIE-generated neutrino interaction and are then included in the samesimulation of energy deposition and detector response. To reproduce events in the trigger timewindow that may not produce any neutrino interaction event, MicroBooNE uses off-beam datainstead of simulation, see Section 2.2. Then, comparisons of on-beam data are done with respectto MC+off-beam events being normalized such that the total yields are equal (area normalized)and maintaining the a priori mixture between MC and off-beam data.
2.2 Data and Monte Carlo data setsMicroBooNE started taking neutrino interaction data in October of 2015. The data set used inthis analysis ranges from February to July 2016. Two different data streams are utilized in thisnote:
on-beam: Taken only when the arrival of the neutrino beam spill from the BNB is expected.off-beam: Taken during periods when no beam was received and with the same detector
conditions as the on-beam data. It is used for a data-driven measurement of cosmic backgrounds.The trigger summary, POT (Protons On Target), and total number of events for the samples
used in these studies are summarized in Table 2.
Sample P.O.T Trigger CountBNB on-beam 4.411e19 9775610 BNB SpillsBNB off-beam N/A 73710197 EXT TriggersBNB+cosmic MC (GENIE Default) 2.010e20 N/ABNB+cosmic MC (GENIE Alternative) 4.087e20 N/A
Table 2: The detector datasets used for this analysis along with the simulated BNB samples used topredict the event yield. The factors used for normalization are listed. GENIE Deafult and GENIEAlternative model choices are described in the previous section. EXT Triggers is the number oftriggers recorded orthogonal in time to the arrival of a BNB spill.
We use the POT and trigger information to normalize both the MC and off-beam data to ouron-beam data. However, for the purposes of the analysis presented here, we applied an overallare normalization once the MC and off-beam event yields are established. We will present POT
8
normalized distributions once full uncertainty studies have been completed. For now, shape-onlycomparisons with the two GENIE choices are the main focus of this note.
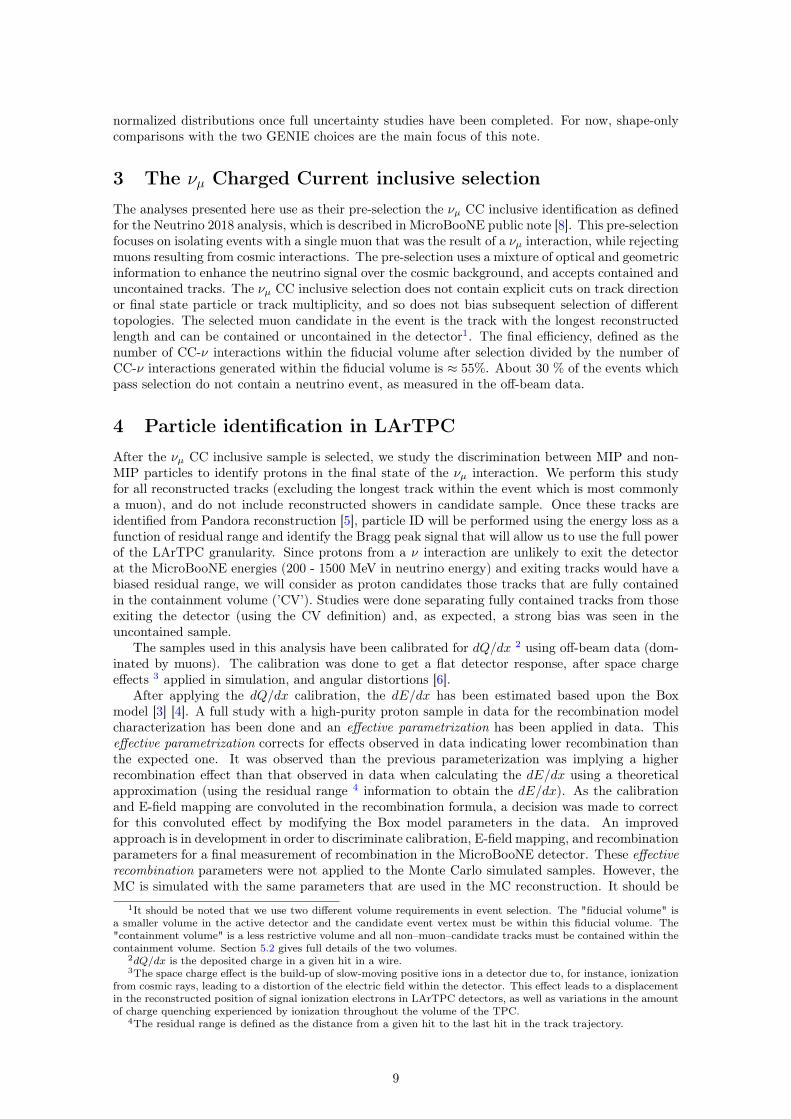
3 The νµ Charged Current inclusive selectionThe analyses presented here use as their pre-selection the νµ CC inclusive identification as definedfor the Neutrino 2018 analysis, which is described in MicroBooNE public note [8]. This pre-selectionfocuses on isolating events with a single muon that was the result of a νµ interaction, while rejectingmuons resulting from cosmic interactions. The pre-selection uses a mixture of optical and geometricinformation to enhance the neutrino signal over the cosmic background, and accepts contained anduncontained tracks. The νµ CC inclusive selection does not contain explicit cuts on track directionor final state particle or track multiplicity, and so does not bias subsequent selection of differenttopologies. The selected muon candidate in the event is the track with the longest reconstructedlength and can be contained or uncontained in the detector1. The final efficiency, defined as thenumber of CC-ν interactions within the fiducial volume after selection divided by the number ofCC-ν interactions generated within the fiducial volume is ≈ 55%. About 30 % of the events whichpass selection do not contain a neutrino event, as measured in the off-beam data.
4 Particle identification in LArTPCAfter the νµ CC inclusive sample is selected, we study the discrimination between MIP and non-MIP particles to identify protons in the final state of the νµ interaction. We perform this studyfor all reconstructed tracks (excluding the longest track within the event which is most commonlya muon), and do not include reconstructed showers in candidate sample. Once these tracks areidentified from Pandora reconstruction [5], particle ID will be performed using the energy loss as afunction of residual range and identify the Bragg peak signal that will allow us to use the full powerof the LArTPC granularity. Since protons from a ν interaction are unlikely to exit the detectorat the MicroBooNE energies (200 - 1500 MeV in neutrino energy) and exiting tracks would have abiased residual range, we will consider as proton candidates those tracks that are fully containedin the containment volume (’CV’). Studies were done separating fully contained tracks from thoseexiting the detector (using the CV definition) and, as expected, a strong bias was seen in theuncontained sample.
The samples used in this analysis have been calibrated for dQ/dx 2 using off-beam data (dom-inated by muons). The calibration was done to get a flat detector response, after space chargeeffects 3 applied in simulation, and angular distortions [6].
After applying the dQ/dx calibration, the dE/dx has been estimated based upon the Boxmodel [3] [4]. A full study with a high-purity proton sample in data for the recombination modelcharacterization has been done and an effective parametrization has been applied in data. Thiseffective parametrization corrects for effects observed in data indicating lower recombination thanthe expected one. It was observed than the previous parameterization was implying a higherrecombination effect than that observed in data when calculating the dE/dx using a theoreticalapproximation (using the residual range 4 information to obtain the dE/dx). As the calibrationand E-field mapping are convoluted in the recombination formula, a decision was made to correctfor this convoluted effect by modifying the Box model parameters in the data. An improvedapproach is in development in order to discriminate calibration, E-field mapping, and recombinationparameters for a final measurement of recombination in the MicroBooNE detector. These effectiverecombination parameters were not applied to the Monte Carlo simulated samples. However, theMC is simulated with the same parameters that are used in the MC reconstruction. It should be
1It should be noted that we use two different volume requirements in event selection. The "fiducial volume" isa smaller volume in the active detector and the candidate event vertex must be within this fiducial volume. The"containment volume" is a less restrictive volume and all non–muon–candidate tracks must be contained within thecontainment volume. Section 5.2 gives full details of the two volumes.
2dQ/dx is the deposited charge in a given hit in a wire.3The space charge effect is the build-up of slow-moving positive ions in a detector due to, for instance, ionization
from cosmic rays, leading to a distortion of the electric field within the detector. This effect leads to a displacementin the reconstructed position of signal ionization electrons in LArTPC detectors, as well as variations in the amountof charge quenching experienced by ionization throughout the volume of the TPC.
4The residual range is defined as the distance from a given hit to the last hit in the track trajectory.
9
noted that only the collection plane hits 5 are used for the particle identification due to a betterunderstanding and modeling of the calorimetry and detector response, and due to the status ofour reconstruction and simulation at this stage.
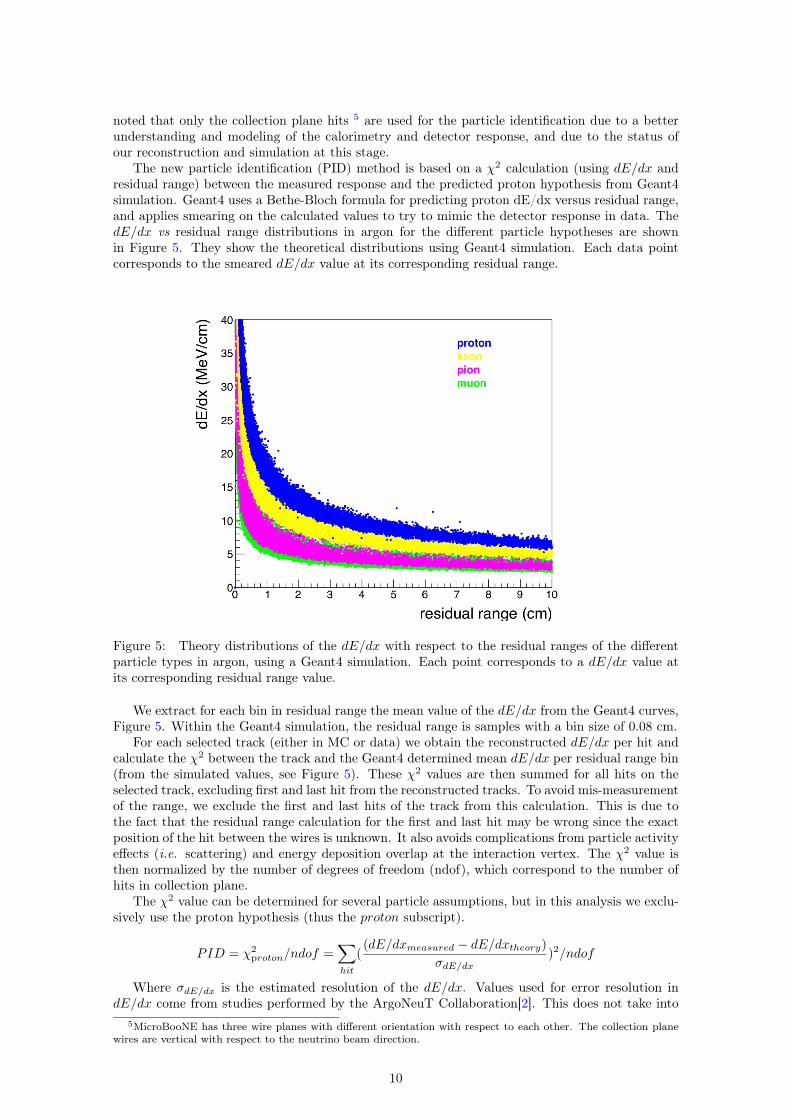
The new particle identification (PID) method is based on a χ2 calculation (using dE/dx andresidual range) between the measured response and the predicted proton hypothesis from Geant4simulation. Geant4 uses a Bethe-Bloch formula for predicting proton dE/dx versus residual range,and applies smearing on the calculated values to try to mimic the detector response in data. ThedE/dx vs residual range distributions in argon for the different particle hypotheses are shownin Figure 5. They show the theoretical distributions using Geant4 simulation. Each data pointcorresponds to the smeared dE/dx value at its corresponding residual range.
Figure 5: Theory distributions of the dE/dx with respect to the residual ranges of the differentparticle types in argon, using a Geant4 simulation. Each point corresponds to a dE/dx value atits corresponding residual range value.
We extract for each bin in residual range the mean value of the dE/dx from the Geant4 curves,Figure 5. Within the Geant4 simulation, the residual range is samples with a bin size of 0.08 cm.
For each selected track (either in MC or data) we obtain the reconstructed dE/dx per hit andcalculate the χ2 between the track and the Geant4 determined mean dE/dx per residual range bin(from the simulated values, see Figure 5). These χ2 values are then summed for all hits on theselected track, excluding first and last hit from the reconstructed tracks. To avoid mis-measurementof the range, we exclude the first and last hits of the track from this calculation. This is due tothe fact that the residual range calculation for the first and last hit may be wrong since the exactposition of the hit between the wires is unknown. It also avoids complications from particle activityeffects (i.e. scattering) and energy deposition overlap at the interaction vertex. The χ2 value isthen normalized by the number of degrees of freedom (ndof), which correspond to the number ofhits in collection plane.
The χ2 value can be determined for several particle assumptions, but in this analysis we exclu-sively use the proton hypothesis (thus the proton subscript).
PID = χ2proton/ndof =
∑hit
((dE/dxmeasured − dE/dxtheory)
σdE/dx)2/ndof
Where σdE/dx is the estimated resolution of the dE/dx. Values used for error resolution indE/dx come from studies performed by the ArgoNeuT Collaboration[2]. This does not take into
5MicroBooNE has three wire planes with different orientation with respect to each other. The collection planewires are vertical with respect to the neutrino beam direction.
10
account that MicroBooNE has 3mm wire pitch (instead of the 4mm in ArgoNeuT), which shouldoverestimate the error in resolution. We prefer to use this conservative approach due to the largesmearing in the dEd/dx observed in the MicroBooNE detector.
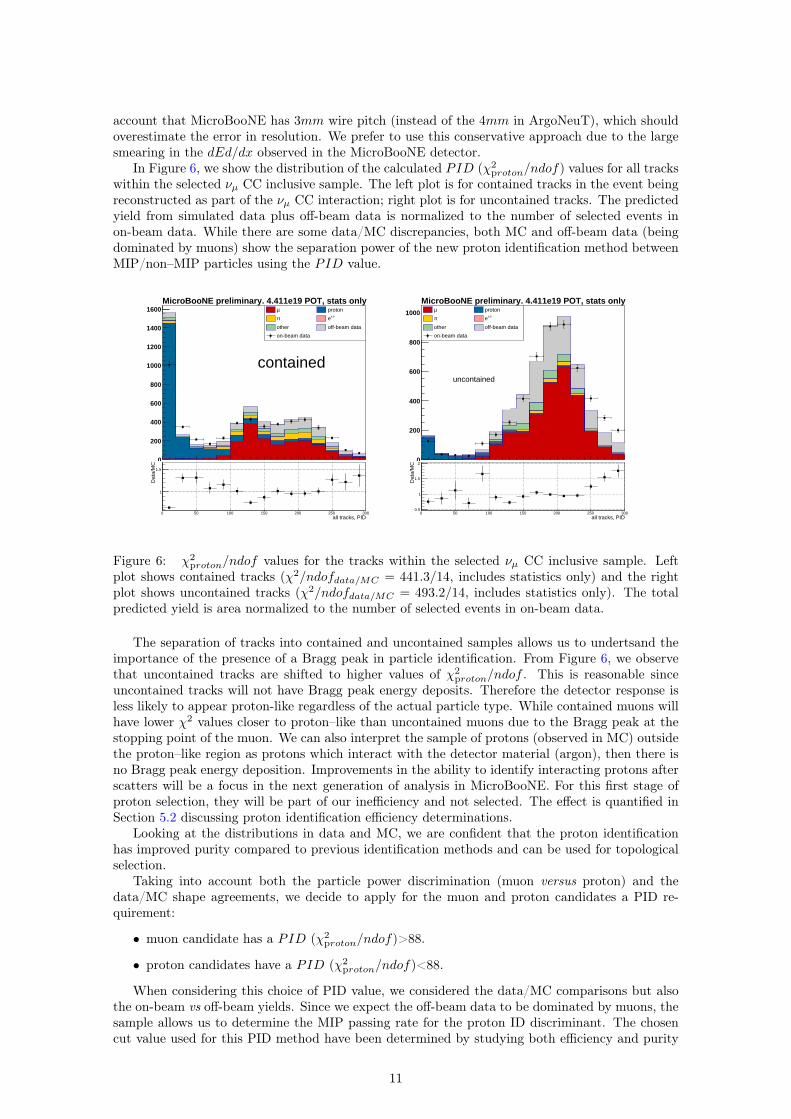
In Figure 6, we show the distribution of the calculated PID (χ2proton/ndof) values for all tracks
within the selected νµ CC inclusive sample. The left plot is for contained tracks in the event beingreconstructed as part of the νµ CC interaction; right plot is for uncontained tracks. The predictedyield from simulated data plus off-beam data is normalized to the number of selected events inon-beam data. While there are some data/MC discrepancies, both MC and off-beam data (beingdominated by muons) show the separation power of the new proton identification method betweenMIP/non–MIP particles using the PID value.
No. of Entries0 50 100 150 200 250 3000
200
400
600
800
1000
1200
1400
1600 µ proton
π +/-e
other off-beam data
on-beam data
contained
MicroBooNE preliminary. 4.411e19 POT, stats only
all tracks, PID0 50 100 150 200 250 300
Dat
a/M
C
1
1.5 No. of Entries0 50 100 150 200 250 3000
200
400
600
800
1000 µ proton
π +/-e
other off-beam data
on-beam data
uncontained
MicroBooNE preliminary. 4.411e19 POT, stats only
all tracks, PID0 50 100 150 200 250 300
Dat
a/M
C
0.5
1
1.5
2
Figure 6: χ2proton/ndof values for the tracks within the selected νµ CC inclusive sample. Left
plot shows contained tracks (χ2/ndofdata/MC = 441.3/14, includes statistics only) and the rightplot shows uncontained tracks (χ2/ndofdata/MC = 493.2/14, includes statistics only). The totalpredicted yield is area normalized to the number of selected events in on-beam data.
The separation of tracks into contained and uncontained samples allows us to undertsand theimportance of the presence of a Bragg peak in particle identification. From Figure 6, we observethat uncontained tracks are shifted to higher values of χ2
proton/ndof . This is reasonable sinceuncontained tracks will not have Bragg peak energy deposits. Therefore the detector response isless likely to appear proton-like regardless of the actual particle type. While contained muons willhave lower χ2 values closer to proton–like than uncontained muons due to the Bragg peak at thestopping point of the muon. We can also interpret the sample of protons (observed in MC) outsidethe proton–like region as protons which interact with the detector material (argon), then there isno Bragg peak energy deposition. Improvements in the ability to identify interacting protons afterscatters will be a focus in the next generation of analysis in MicroBooNE. For this first stage ofproton selection, they will be part of our inefficiency and not selected. The effect is quantified inSection 5.2 discussing proton identification efficiency determinations.
Looking at the distributions in data and MC, we are confident that the proton identificationhas improved purity compared to previous identification methods and can be used for topologicalselection.
Taking into account both the particle power discrimination (muon versus proton) and thedata/MC shape agreements, we decide to apply for the muon and proton candidates a PID re-quirement:
• muon candidate has a PID (χ2proton/ndof)>88.
• proton candidates have a PID (χ2proton/ndof)<88.
When considering this choice of PID value, we considered the data/MC comparisons but alsothe on-beam vs off-beam yields. Since we expect the off-beam data to be dominated by muons, thesample allows us to determine the MIP passing rate for the proton ID discriminant. The chosencut value used for this PID method have been determined by studying both efficiency and purity
11
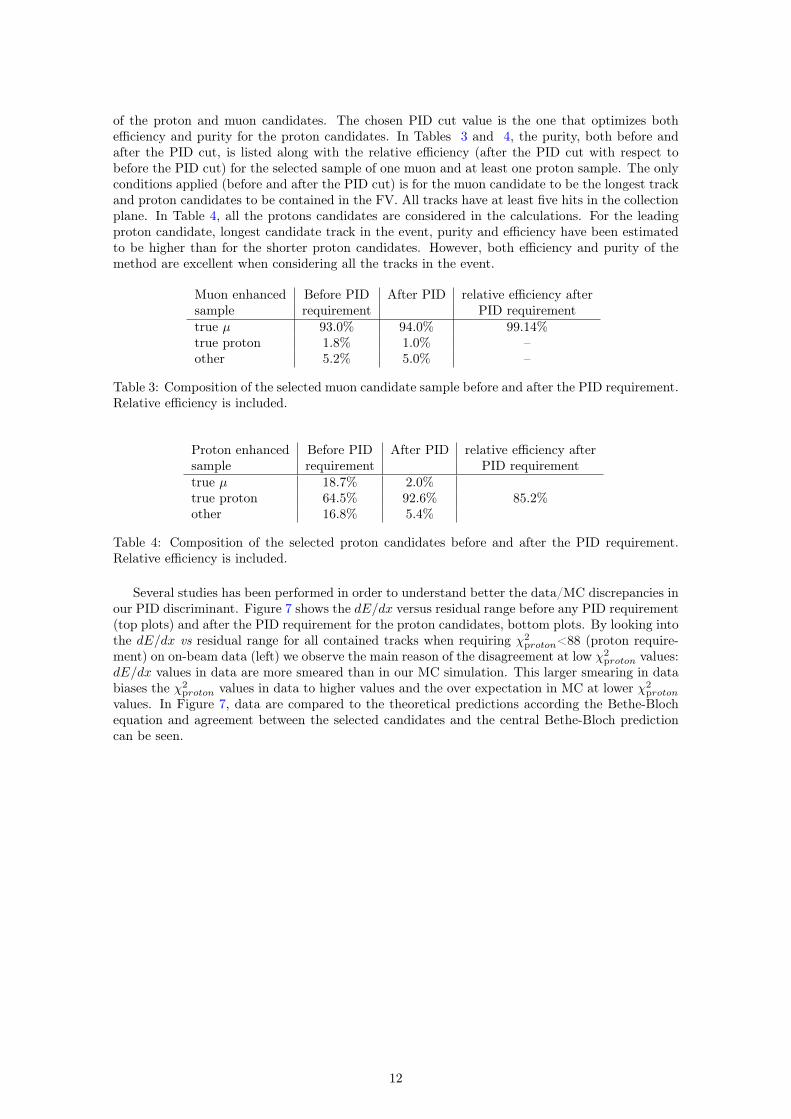
of the proton and muon candidates. The chosen PID cut value is the one that optimizes bothefficiency and purity for the proton candidates. In Tables 3 and 4, the purity, both before andafter the PID cut, is listed along with the relative efficiency (after the PID cut with respect tobefore the PID cut) for the selected sample of one muon and at least one proton sample. The onlyconditions applied (before and after the PID cut) is for the muon candidate to be the longest trackand proton candidates to be contained in the FV. All tracks have at least five hits in the collectionplane. In Table 4, all the protons candidates are considered in the calculations. For the leadingproton candidate, longest candidate track in the event, purity and efficiency have been estimatedto be higher than for the shorter proton candidates. However, both efficiency and purity of themethod are excellent when considering all the tracks in the event.
Muon enhanced Before PID After PID relative efficiency aftersample requirement PID requirementtrue µ 93.0% 94.0% 99.14%true proton 1.8% 1.0% –other 5.2% 5.0% –
Table 3: Composition of the selected muon candidate sample before and after the PID requirement.Relative efficiency is included.
Proton enhanced Before PID After PID relative efficiency aftersample requirement PID requirementtrue µ 18.7% 2.0%true proton 64.5% 92.6% 85.2%other 16.8% 5.4%
Table 4: Composition of the selected proton candidates before and after the PID requirement.Relative efficiency is included.
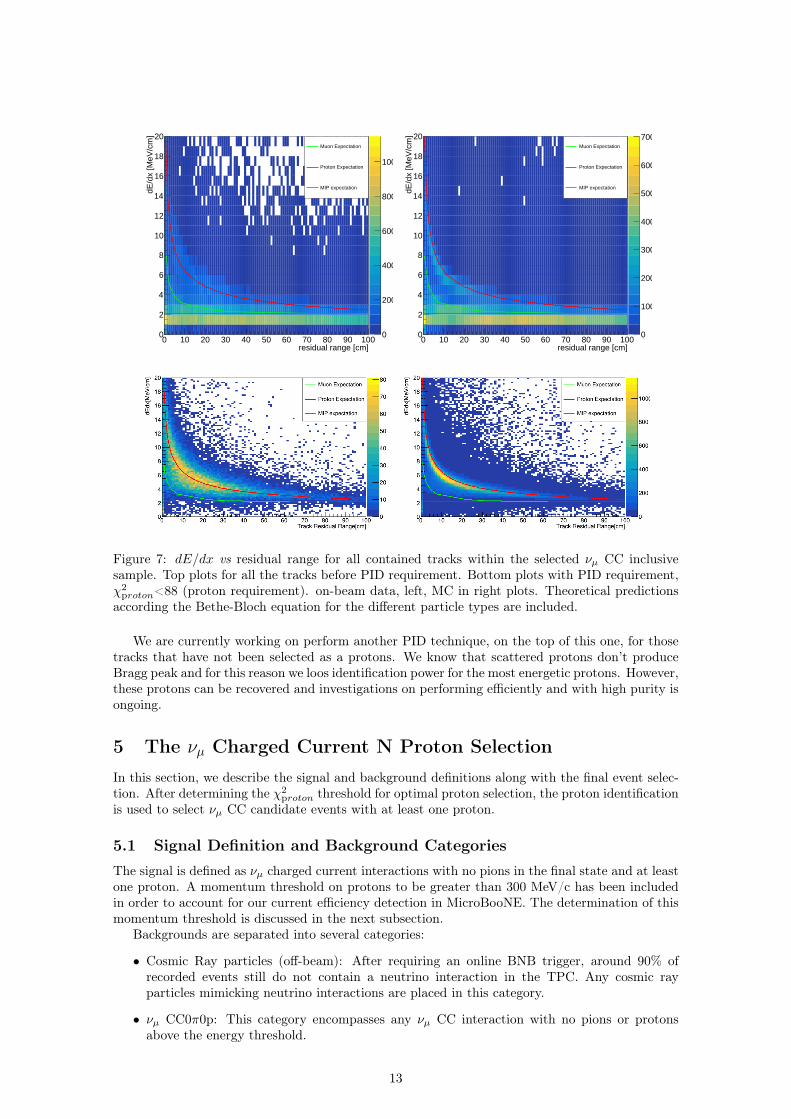
Several studies has been performed in order to understand better the data/MC discrepancies inour PID discriminant. Figure 7 shows the dE/dx versus residual range before any PID requirement(top plots) and after the PID requirement for the proton candidates, bottom plots. By looking intothe dE/dx vs residual range for all contained tracks when requiring χ2
proton<88 (proton require-ment) on on-beam data (left) we observe the main reason of the disagreement at low χ2
proton values:dE/dx values in data are more smeared than in our MC simulation. This larger smearing in databiases the χ2
proton values in data to higher values and the over expectation in MC at lower χ2proton
values. In Figure 7, data are compared to the theoretical predictions according the Bethe-Blochequation and agreement between the selected candidates and the central Bethe-Bloch predictioncan be seen.
12
residual range [cm]0 10 20 30 40 50 60 70 80 90 100
dE/d
x [M
eV/c
m]
0
2
4
6
8
10
12
14
16
18
20
0
200
400
600
800
1000
Muon Expectation
Proton Expectation
MIP expectation
residual range [cm]0 10 20 30 40 50 60 70 80 90 100
dE/d
x [M
eV/c
m]
0
2
4
6
8
10
12
14
16
18
20
0
1000
2000
3000
4000
5000
6000
7000Muon Expectation
Proton Expectation
MIP expectation
Figure 7: dE/dx vs residual range for all contained tracks within the selected νµ CC inclusivesample. Top plots for all the tracks before PID requirement. Bottom plots with PID requirement,χ2
proton<88 (proton requirement). on-beam data, left, MC in right plots. Theoretical predictionsaccording the Bethe-Bloch equation for the different particle types are included.
We are currently working on perform another PID technique, on the top of this one, for thosetracks that have not been selected as a protons. We know that scattered protons don’t produceBragg peak and for this reason we loos identification power for the most energetic protons. However,these protons can be recovered and investigations on performing efficiently and with high purity isongoing.
5 The νµ Charged Current N Proton SelectionIn this section, we describe the signal and background definitions along with the final event selec-tion. After determining the χ2
proton threshold for optimal proton selection, the proton identificationis used to select νµ CC candidate events with at least one proton.
5.1 Signal Definition and Background CategoriesThe signal is defined as νµ charged current interactions with no pions in the final state and at leastone proton. A momentum threshold on protons to be greater than 300 MeV/c has been includedin order to account for our current efficiency detection in MicroBooNE. The determination of thismomentum threshold is discussed in the next subsection.
Backgrounds are separated into several categories:
• Cosmic Ray particles (off-beam): After requiring an online BNB trigger, around 90% ofrecorded events still do not contain a neutrino interaction in the TPC. Any cosmic rayparticles mimicking neutrino interactions are placed in this category.
• νµ CC0π0p: This category encompasses any νµ CC interaction with no pions or protonsabove the energy threshold.
13
• νµCC other: This category consists of events where at least a pion was produced in the finalstate of the interaction.
• Other: All other event classes are considered to be "Other". This is primarily NC eventsand other interactions from outside of the fiducial volume, and also includes a small numberof νe events.
5.2 Event Selection SchemeTo select signal candidate events, we implemented the CC inclusive selection as pre-cuts, as de-scribed in section 3. The CC inclusive selection drastically reduces most of the background fromcosmics and NC events. To further separate the signal from background after the CC inclusiveselection, the following cuts were performed:
• Number of reconstructed tracks greater than 1: There must be at least two tracksassociated to the neutrino vertex candidate. The longest track is selected as the muoncandidate, all other tracks associated to the same neutrino vertex are considered as protoncandidates.
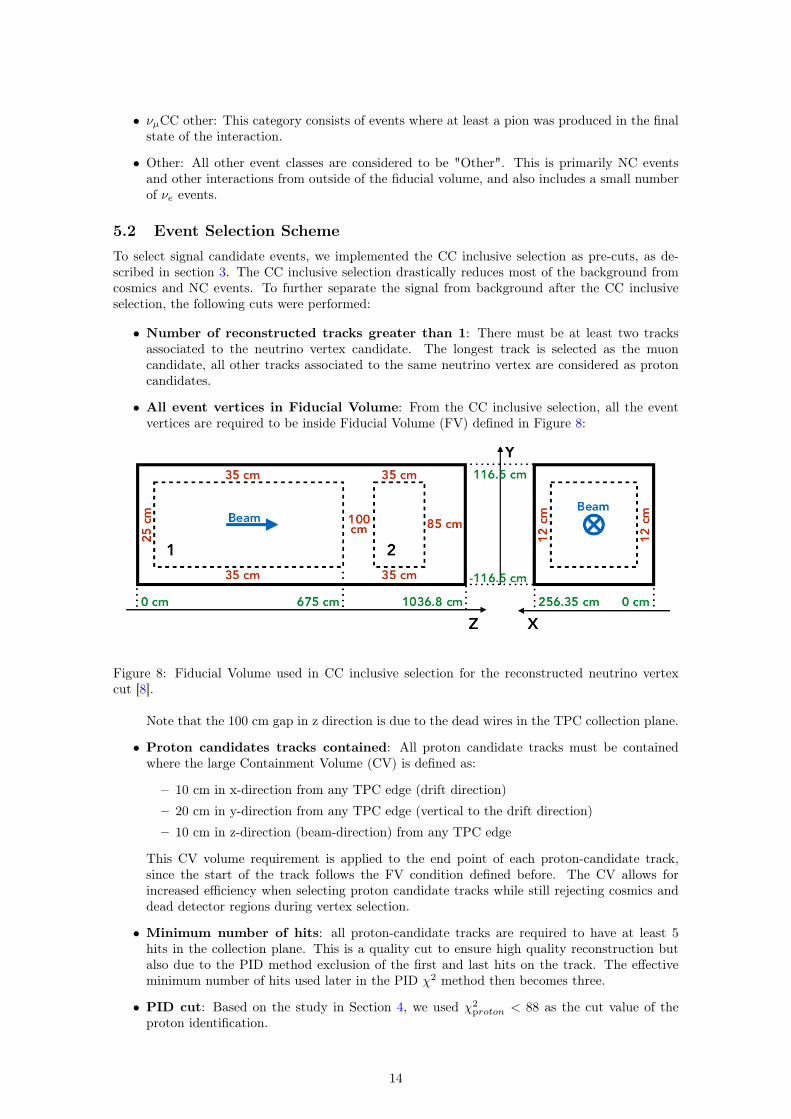
• All event vertices in Fiducial Volume: From the CC inclusive selection, all the eventvertices are required to be inside Fiducial Volume (FV) defined in Figure 8:
Figure 8: Fiducial Volume used in CC inclusive selection for the reconstructed neutrino vertexcut [8].
Note that the 100 cm gap in z direction is due to the dead wires in the TPC collection plane.
• Proton candidates tracks contained: All proton candidate tracks must be containedwhere the large Containment Volume (CV) is defined as:
– 10 cm in x-direction from any TPC edge (drift direction)
– 20 cm in y-direction from any TPC edge (vertical to the drift direction)
– 10 cm in z-direction (beam-direction) from any TPC edge
This CV volume requirement is applied to the end point of each proton-candidate track,since the start of the track follows the FV condition defined before. The CV allows forincreased efficiency when selecting proton candidate tracks while still rejecting cosmics anddead detector regions during vertex selection.
• Minimum number of hits: all proton-candidate tracks are required to have at least 5hits in the collection plane. This is a quality cut to ensure high quality reconstruction butalso due to the PID method exclusion of the first and last hits on the track. The effectiveminimum number of hits used later in the PID χ2 method then becomes three.
• PID cut: Based on the study in Section 4, we used χ2proton < 88 as the cut value of the
proton identification.
14
In constructing the event topology, the longest track is considered to be the muon candidateand can exit the detector. If it exits the detector, the momentum is estimated from the scatteringof the track along its path (referred to as Multiple Coulomb Scattering, or MCS [7]). If it iscontained in the containment volume, the momentum is calculated by the track range. Since allproton candidate tracks are contained, the momentum is based on the track length.
Table 5 shows the event composition of all the ν MC events using only MC truth information,no selection applied, it includes events outside the FV. CC Incl is the total number of true CCinclusive events (CC inclusive defined as all the CC events coming from νµ CC events with theneutrino vertex within the FV shown in the Figure 8). CC0πNp is the total number of chargedcurrent events with zero pions and at least one proton within the same FV. CC0πNp w/ pthreshis the total number of events with at least one proton momentum greater than 300 MeV/c withinthe FV. These samples are used to determine the signal efficiency and proton ID efficiency.
Total MC Evts CC Incl (in FV) CC0πNp (in FV) CC0πNp w/ pthresh (in FV)100% 16.8% 11.9% 8.7%
Table 5: The event composition in the MC sample from MC truth information without any re-quirement on reconstruction. No selection applied.
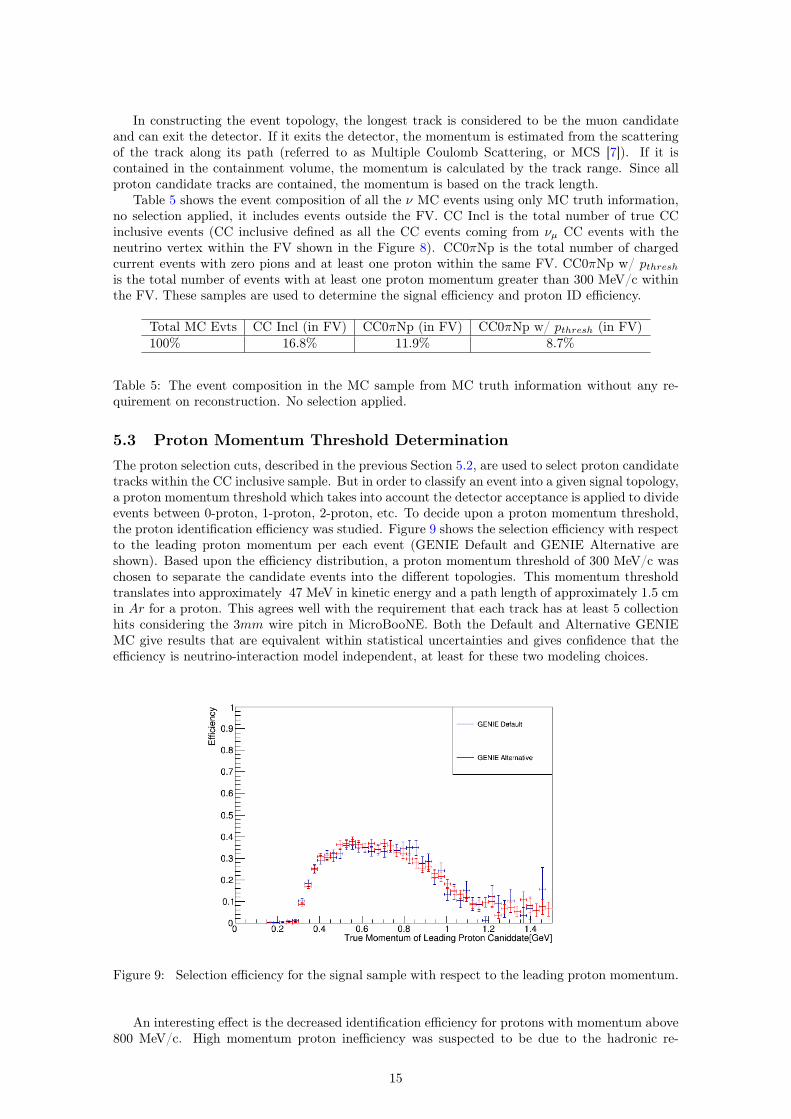
5.3 Proton Momentum Threshold DeterminationThe proton selection cuts, described in the previous Section 5.2, are used to select proton candidatetracks within the CC inclusive sample. But in order to classify an event into a given signal topology,a proton momentum threshold which takes into account the detector acceptance is applied to divideevents between 0-proton, 1-proton, 2-proton, etc. To decide upon a proton momentum threshold,the proton identification efficiency was studied. Figure 9 shows the selection efficiency with respectto the leading proton momentum per each event (GENIE Default and GENIE Alternative areshown). Based upon the efficiency distribution, a proton momentum threshold of 300 MeV/c waschosen to separate the candidate events into the different topologies. This momentum thresholdtranslates into approximately 47 MeV in kinetic energy and a path length of approximately 1.5 cmin Ar for a proton. This agrees well with the requirement that each track has at least 5 collectionhits considering the 3mm wire pitch in MicroBooNE. Both the Default and Alternative GENIEMC give results that are equivalent within statistical uncertainties and gives confidence that theefficiency is neutrino-interaction model independent, at least for these two modeling choices.
Figure 9: Selection efficiency for the signal sample with respect to the leading proton momentum.
An interesting effect is the decreased identification efficiency for protons with momentum above800 MeV/c. High momentum proton inefficiency was suspected to be due to the hadronic re-
15
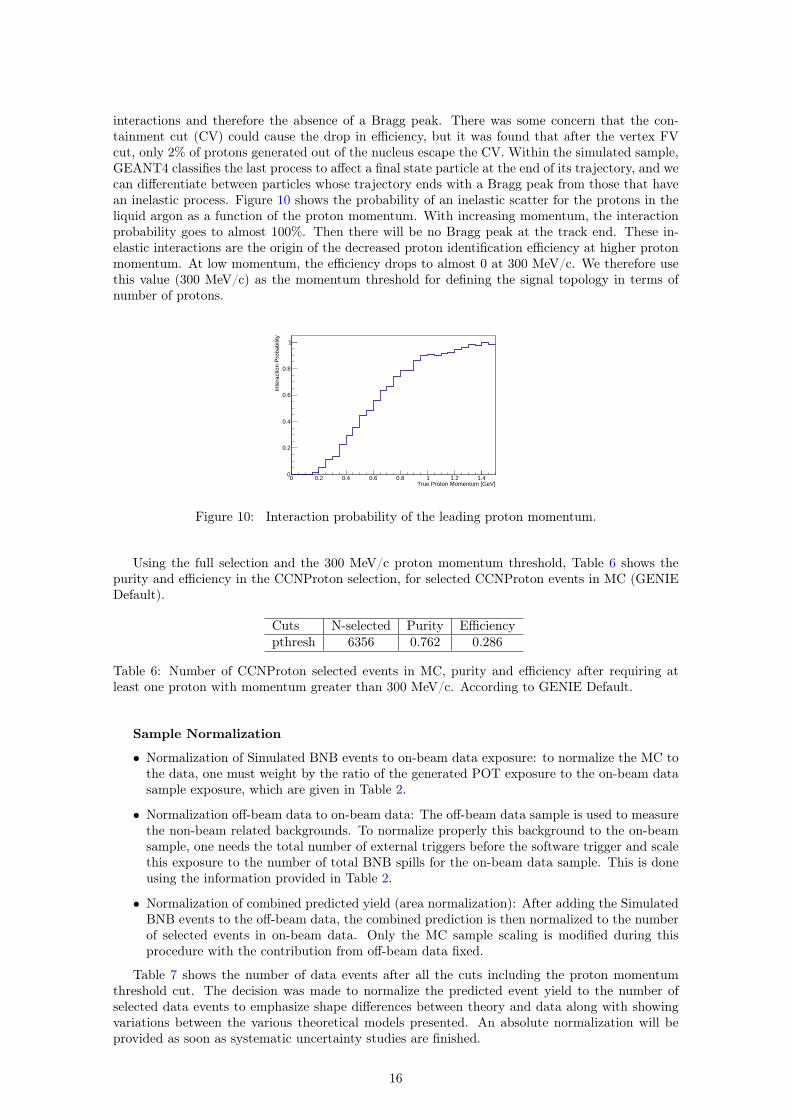
interactions and therefore the absence of a Bragg peak. There was some concern that the con-tainment cut (CV) could cause the drop in efficiency, but it was found that after the vertex FVcut, only 2% of protons generated out of the nucleus escape the CV. Within the simulated sample,GEANT4 classifies the last process to affect a final state particle at the end of its trajectory, and wecan differentiate between particles whose trajectory ends with a Bragg peak from those that havean inelastic process. Figure 10 shows the probability of an inelastic scatter for the protons in theliquid argon as a function of the proton momentum. With increasing momentum, the interactionprobability goes to almost 100%. Then there will be no Bragg peak at the track end. These in-elastic interactions are the origin of the decreased proton identification efficiency at higher protonmomentum. At low momentum, the efficiency drops to almost 0 at 300 MeV/c. We therefore usethis value (300 MeV/c) as the momentum threshold for defining the signal topology in terms ofnumber of protons.
True Proton Momentum [GeV]0 0.2 0.4 0.6 0.8 1 1.2 1.4
Inte
ract
ion
Pro
babi
lity
0
0.2
0.4
0.6
0.8
1
Figure 10: Interaction probability of the leading proton momentum.
Using the full selection and the 300 MeV/c proton momentum threshold, Table 6 shows thepurity and efficiency in the CCNProton selection, for selected CCNProton events in MC (GENIEDefault).
Cuts N-selected Purity Efficiencypthresh 6356 0.762 0.286
Table 6: Number of CCNProton selected events in MC, purity and efficiency after requiring atleast one proton with momentum greater than 300 MeV/c. According to GENIE Default.
Sample Normalization
• Normalization of Simulated BNB events to on-beam data exposure: to normalize the MC tothe data, one must weight by the ratio of the generated POT exposure to the on-beam datasample exposure, which are given in Table 2.
• Normalization off-beam data to on-beam data: The off-beam data sample is used to measurethe non-beam related backgrounds. To normalize properly this background to the on-beamsample, one needs the total number of external triggers before the software trigger and scalethis exposure to the number of total BNB spills for the on-beam data sample. This is doneusing the information provided in Table 2.
• Normalization of combined predicted yield (area normalization): After adding the SimulatedBNB events to the off-beam data, the combined prediction is then normalized to the numberof selected events in on-beam data. Only the MC sample scaling is modified during thisprocedure with the contribution from off-beam data fixed.
Table 7 shows the number of data events after all the cuts including the proton momentumthreshold cut. The decision was made to normalize the predicted event yield to the number ofselected data events to emphasize shape differences between theory and data along with showingvariations between the various theoretical models presented. An absolute normalization will beprovided as soon as systematic uncertainty studies are finished.
16
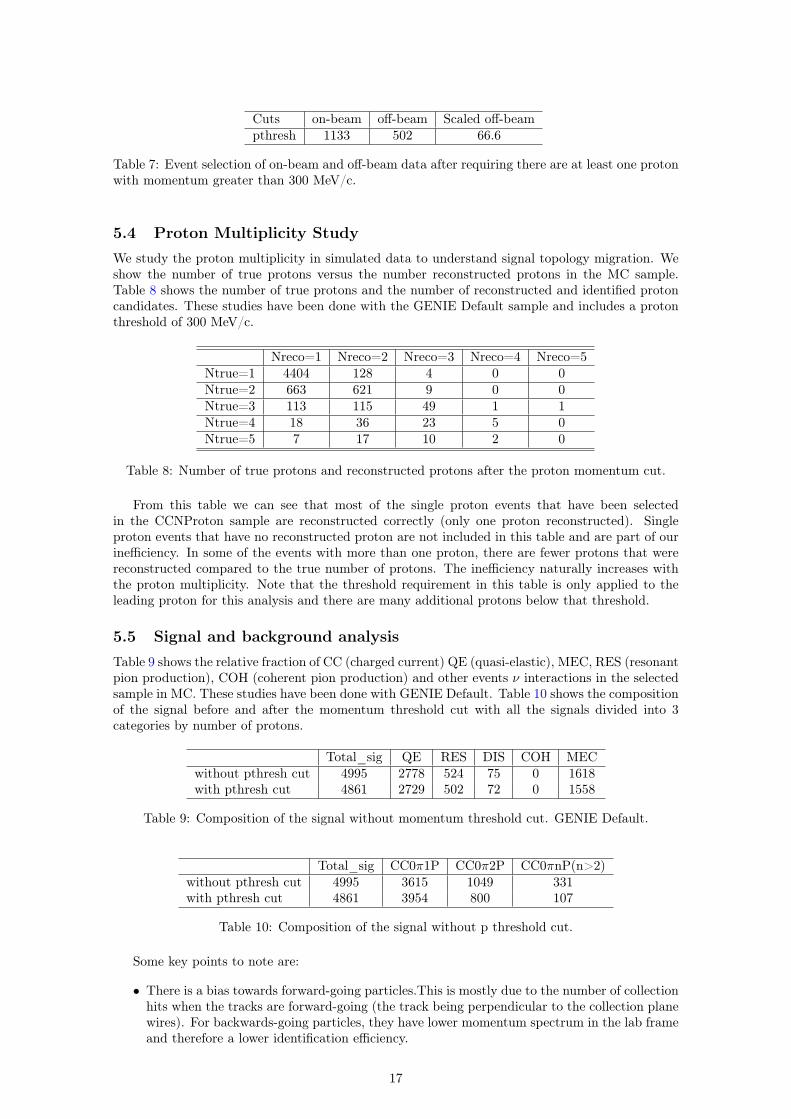
Cuts on-beam off-beam Scaled off-beampthresh 1133 502 66.6
Table 7: Event selection of on-beam and off-beam data after requiring there are at least one protonwith momentum greater than 300 MeV/c.
5.4 Proton Multiplicity StudyWe study the proton multiplicity in simulated data to understand signal topology migration. Weshow the number of true protons versus the number reconstructed protons in the MC sample.Table 8 shows the number of true protons and the number of reconstructed and identified protoncandidates. These studies have been done with the GENIE Default sample and includes a protonthreshold of 300 MeV/c.
Nreco=1 Nreco=2 Nreco=3 Nreco=4 Nreco=5Ntrue=1 4404 128 4 0 0Ntrue=2 663 621 9 0 0Ntrue=3 113 115 49 1 1Ntrue=4 18 36 23 5 0Ntrue=5 7 17 10 2 0
Table 8: Number of true protons and reconstructed protons after the proton momentum cut.
From this table we can see that most of the single proton events that have been selectedin the CCNProton sample are reconstructed correctly (only one proton reconstructed). Singleproton events that have no reconstructed proton are not included in this table and are part of ourinefficiency. In some of the events with more than one proton, there are fewer protons that werereconstructed compared to the true number of protons. The inefficiency naturally increases withthe proton multiplicity. Note that the threshold requirement in this table is only applied to theleading proton for this analysis and there are many additional protons below that threshold.
5.5 Signal and background analysisTable 9 shows the relative fraction of CC (charged current) QE (quasi-elastic), MEC, RES (resonantpion production), COH (coherent pion production) and other events ν interactions in the selectedsample in MC. These studies have been done with GENIE Default. Table 10 shows the compositionof the signal before and after the momentum threshold cut with all the signals divided into 3categories by number of protons.
Total_sig QE RES DIS COH MECwithout pthresh cut 4995 2778 524 75 0 1618with pthresh cut 4861 2729 502 72 0 1558
Table 9: Composition of the signal without momentum threshold cut. GENIE Default.
Total_sig CC0π1P CC0π2P CC0πnP(n>2)without pthresh cut 4995 3615 1049 331with pthresh cut 4861 3954 800 107
Table 10: Composition of the signal without p threshold cut.
Some key points to note are:
• There is a bias towards forward-going particles.This is mostly due to the number of collectionhits when the tracks are forward-going (the track being perpendicular to the collection planewires). For backwards-going particles, they have lower momentum spectrum in the lab frameand therefore a lower identification efficiency.
17
• There are drops in efficiency when the muon or proton is aligned parallel or towards todetection wires. This is a limitation of the current reconstruction algorithm and is a knowndeficiency.
To examine the BNB-induced and cosmic backgrounds in more detail, it is useful to separatethem into additional categories.
• CC0π0P: No pions were produced, also no protons above threshold.
• CC1πNP: One pion was produced and emitted in the final state of the interaction.
• CCNπNP: Multiple pions were produced and emitted in the final state of the interaction.
• CCνe: The candidate tracks are from an electron neutrino interaction with any other finalstate particles.
• NC: The candidate tracks are from an NC interaction. This is usually an NC π, with aproton and a charged pion in the final state.
• OOFV: True interaction vertex is outside the Fiducial Volume, but tracks coming from theneutrino interaction are selected.
• Cosmic: Only cosmic-induced tracks are selected.
• Mixed: Of the two or more tracks selected, at least one is from true neutrino interaction,but another is from cosmic origin. This kind of backgrounds are combined with backgroundfrom Cosmic and are shown in the column of the cosmic background in Table 11.
Cuts CC0π0P CC1πNP CCNπNP CCνe NC OOFV CosmicsCCincl 26% 28% 3.1% 0.3% 3.2% 33.3% 6.2%ntrks 12.3% 42.5% 5.2% 0.2% 3.3% 28.7% 6.8%contained 13.9% 45.0% 5.1% 0.2% 3.8% 28.0% 4.0%minColl 13.2% 45.6% 5.2% 0.3% 4.0% 27.8% 3.9%PID 4.2% 45.9% 4.0% 0.4% 7.2% 35.6% 2.7%pthresh 3.6% 46.3% 4.0% 0.5% 7.3% 35.5% 2.8%
Table 11: Composition of the beam-induced background and different selection cuts quoted aspercentages of the total beam-induced background. In this table, all the backgrounds are catego-rized into 7 categories instead of 3 as mentioned in section 5.1. Cuts are defined as: CCincl (CCinclusive sample cut), ntrks (number of reconstructed tracks greater than 1), contained (protoncandidates tracks contained), minColl (minimum number of hits), PID (PID cut), pthresh (protonenergy threshold definition)
From Table 11 we can see that most of the backgrounds are from CC one pion events, and eventsfrom outside Fiducial Volume. Work is ongoing to reject events where a pion in emitted from the νinteraction and interacts to produce a proton(s), as well as to tag neutral pions through observingphotons near the vertex. Some charged pions will reinteract too close to the neutrino-argon vertexfor the detector or reconstruction algorithms to resolve the separation into the primary protons.These backgrounds will have to be constrained by direct measurements of charged pion productionon argon in MicroBooNE and measurements of pion-argon scattering from test beam experiments(LArIAT).
The out-of-fiducial volume (OOFV) backgrounds can be reduced with an improved calibrationfor the space-charge effect, which is actively being developed.
5.5.1 Efficiency dependence on model
While we have identified some of the cuts made in this analysis that are known to lead to largechanges in the efficiency across some kinematic variables it is important to verify that variationsin the neutrino interaction models do not bias the proton identification efficiency.
Figure 11 and Figure 12 show the efficiency of the CCNProton sample as a function of 4kinematic variables. Many of these variables are coupled through the interaction physics, as well
18
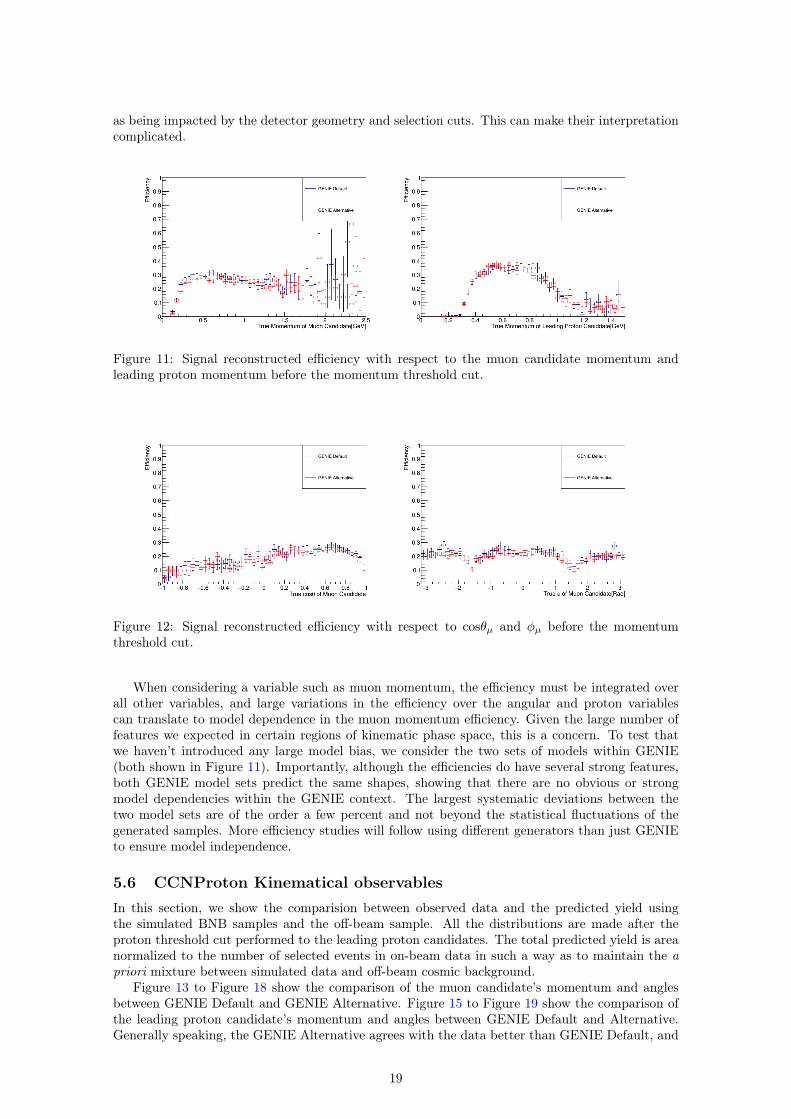
as being impacted by the detector geometry and selection cuts. This can make their interpretationcomplicated.
Figure 11: Signal reconstructed efficiency with respect to the muon candidate momentum andleading proton momentum before the momentum threshold cut.
Figure 12: Signal reconstructed efficiency with respect to cosθµ and φµ before the momentumthreshold cut.
When considering a variable such as muon momentum, the efficiency must be integrated overall other variables, and large variations in the efficiency over the angular and proton variablescan translate to model dependence in the muon momentum efficiency. Given the large number offeatures we expected in certain regions of kinematic phase space, this is a concern. To test thatwe haven’t introduced any large model bias, we consider the two sets of models within GENIE(both shown in Figure 11). Importantly, although the efficiencies do have several strong features,both GENIE model sets predict the same shapes, showing that there are no obvious or strongmodel dependencies within the GENIE context. The largest systematic deviations between thetwo model sets are of the order a few percent and not beyond the statistical fluctuations of thegenerated samples. More efficiency studies will follow using different generators than just GENIEto ensure model independence.
5.6 CCNProton Kinematical observablesIn this section, we show the comparision between observed data and the predicted yield usingthe simulated BNB samples and the off-beam sample. All the distributions are made after theproton threshold cut performed to the leading proton candidates. The total predicted yield is areanormalized to the number of selected events in on-beam data in such a way as to maintain the apriori mixture between simulated data and off-beam cosmic background.
Figure 13 to Figure 18 show the comparison of the muon candidate’s momentum and anglesbetween GENIE Default and GENIE Alternative. Figure 15 to Figure 19 show the comparison ofthe leading proton candidate’s momentum and angles between GENIE Default and Alternative.Generally speaking, the GENIE Alternative agrees with the data better than GENIE Default, and
19
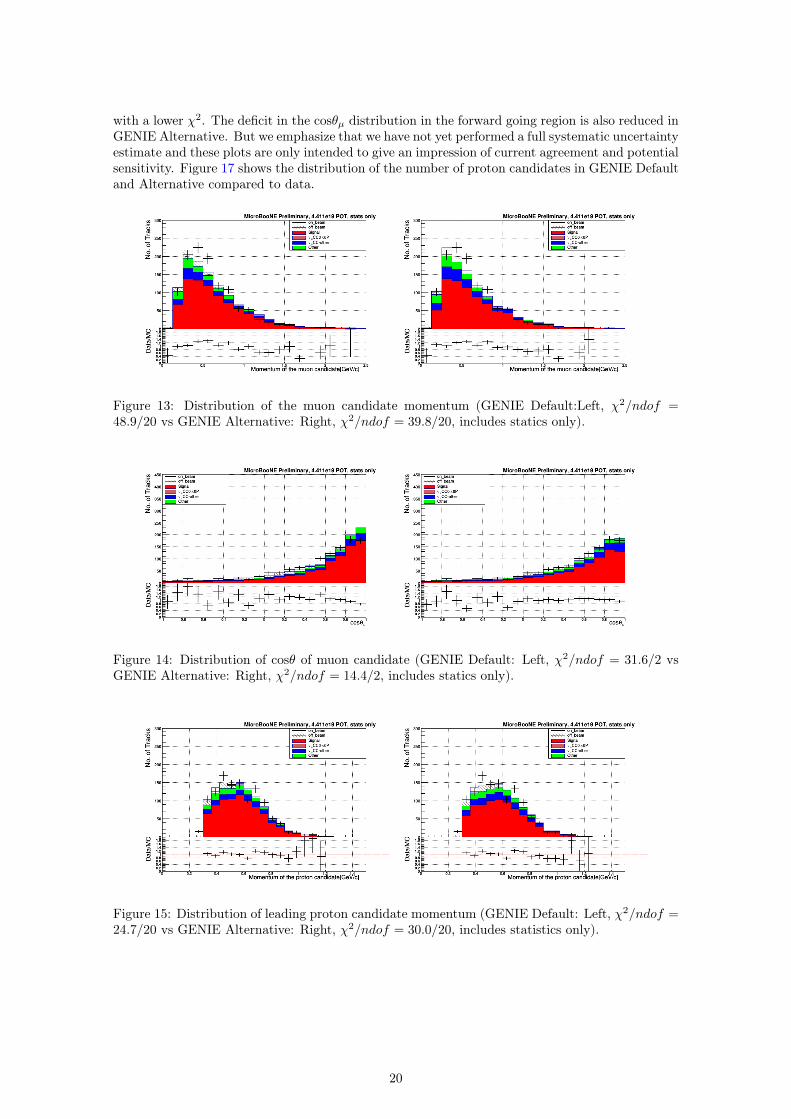
with a lower χ2. The deficit in the cosθµ distribution in the forward going region is also reduced inGENIE Alternative. But we emphasize that we have not yet performed a full systematic uncertaintyestimate and these plots are only intended to give an impression of current agreement and potentialsensitivity. Figure 17 shows the distribution of the number of proton candidates in GENIE Defaultand Alternative compared to data.
Figure 13: Distribution of the muon candidate momentum (GENIE Default:Left, χ2/ndof =48.9/20 vs GENIE Alternative: Right, χ2/ndof = 39.8/20, includes statics only).
Figure 14: Distribution of cosθ of muon candidate (GENIE Default: Left, χ2/ndof = 31.6/2 vsGENIE Alternative: Right, χ2/ndof = 14.4/2, includes statics only).
Figure 15: Distribution of leading proton candidate momentum (GENIE Default: Left, χ2/ndof =24.7/20 vs GENIE Alternative: Right, χ2/ndof = 30.0/20, includes statistics only).
20
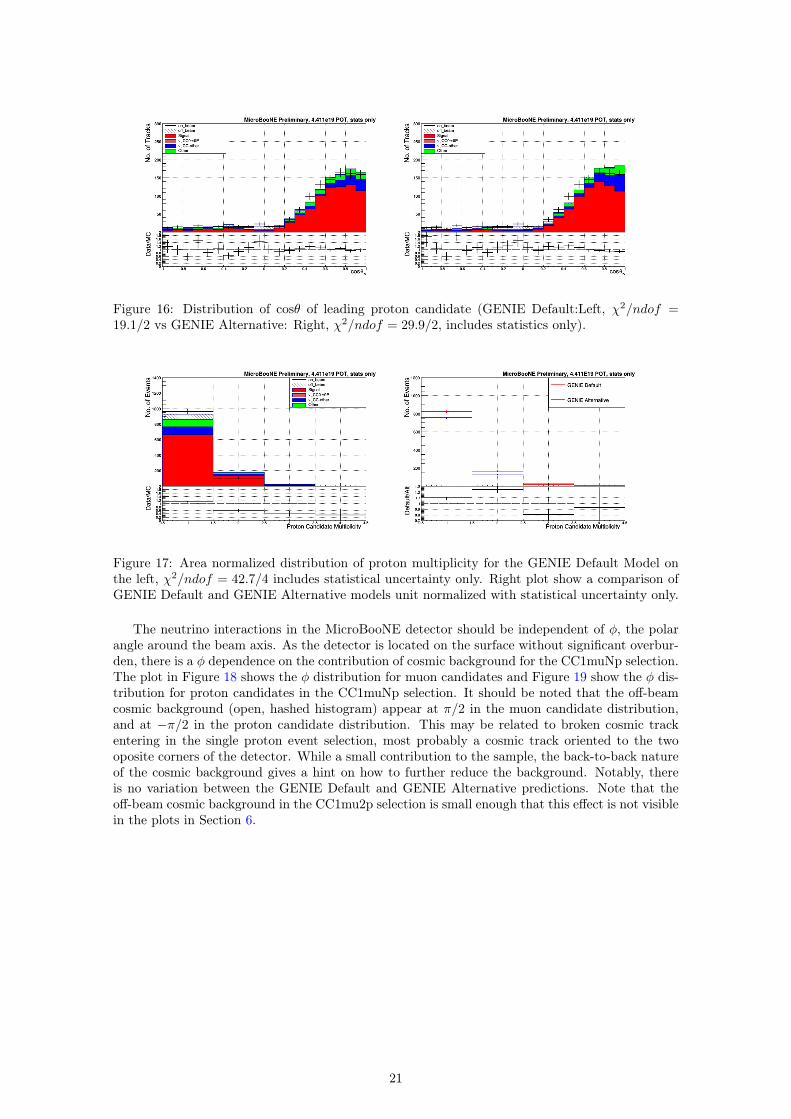
Figure 16: Distribution of cosθ of leading proton candidate (GENIE Default:Left, χ2/ndof =19.1/2 vs GENIE Alternative: Right, χ2/ndof = 29.9/2, includes statistics only).
Figure 17: Area normalized distribution of proton multiplicity for the GENIE Default Model onthe left, χ2/ndof = 42.7/4 includes statistical uncertainty only. Right plot show a comparison ofGENIE Default and GENIE Alternative models unit normalized with statistical uncertainty only.
The neutrino interactions in the MicroBooNE detector should be independent of φ, the polarangle around the beam axis. As the detector is located on the surface without significant overbur-den, there is a φ dependence on the contribution of cosmic background for the CC1muNp selection.The plot in Figure 18 shows the φ distribution for muon candidates and Figure 19 show the φ dis-tribution for proton candidates in the CC1muNp selection. It should be noted that the off-beamcosmic background (open, hashed histogram) appear at π/2 in the muon candidate distribution,and at −π/2 in the proton candidate distribution. This may be related to broken cosmic trackentering in the single proton event selection, most probably a cosmic track oriented to the twooposite corners of the detector. While a small contribution to the sample, the back-to-back natureof the cosmic background gives a hint on how to further reduce the background. Notably, thereis no variation between the GENIE Default and GENIE Alternative predictions. Note that theoff-beam cosmic background in the CC1mu2p selection is small enough that this effect is not visiblein the plots in Section 6.
21
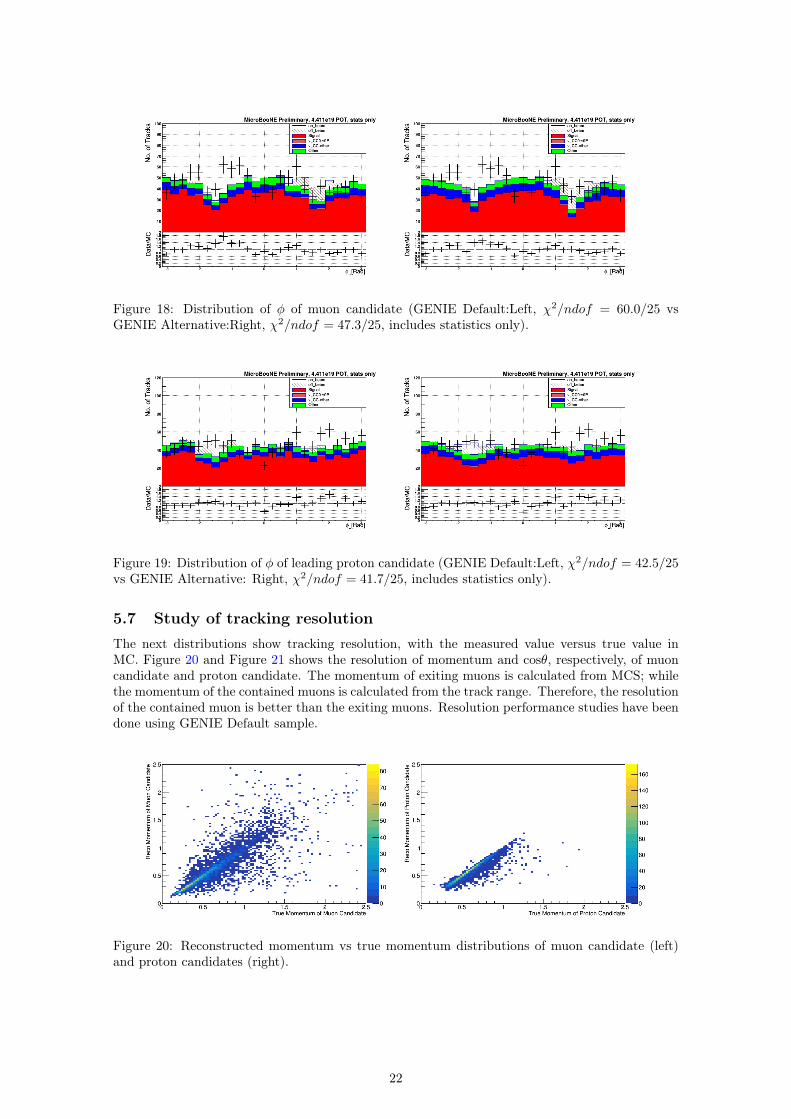
Figure 18: Distribution of φ of muon candidate (GENIE Default:Left, χ2/ndof = 60.0/25 vsGENIE Alternative:Right, χ2/ndof = 47.3/25, includes statistics only).
Figure 19: Distribution of φ of leading proton candidate (GENIE Default:Left, χ2/ndof = 42.5/25vs GENIE Alternative: Right, χ2/ndof = 41.7/25, includes statistics only).
5.7 Study of tracking resolutionThe next distributions show tracking resolution, with the measured value versus true value inMC. Figure 20 and Figure 21 shows the resolution of momentum and cosθ, respectively, of muoncandidate and proton candidate. The momentum of exiting muons is calculated from MCS; whilethe momentum of the contained muons is calculated from the track range. Therefore, the resolutionof the contained muon is better than the exiting muons. Resolution performance studies have beendone using GENIE Default sample.
Figure 20: Reconstructed momentum vs true momentum distributions of muon candidate (left)and proton candidates (right).
22
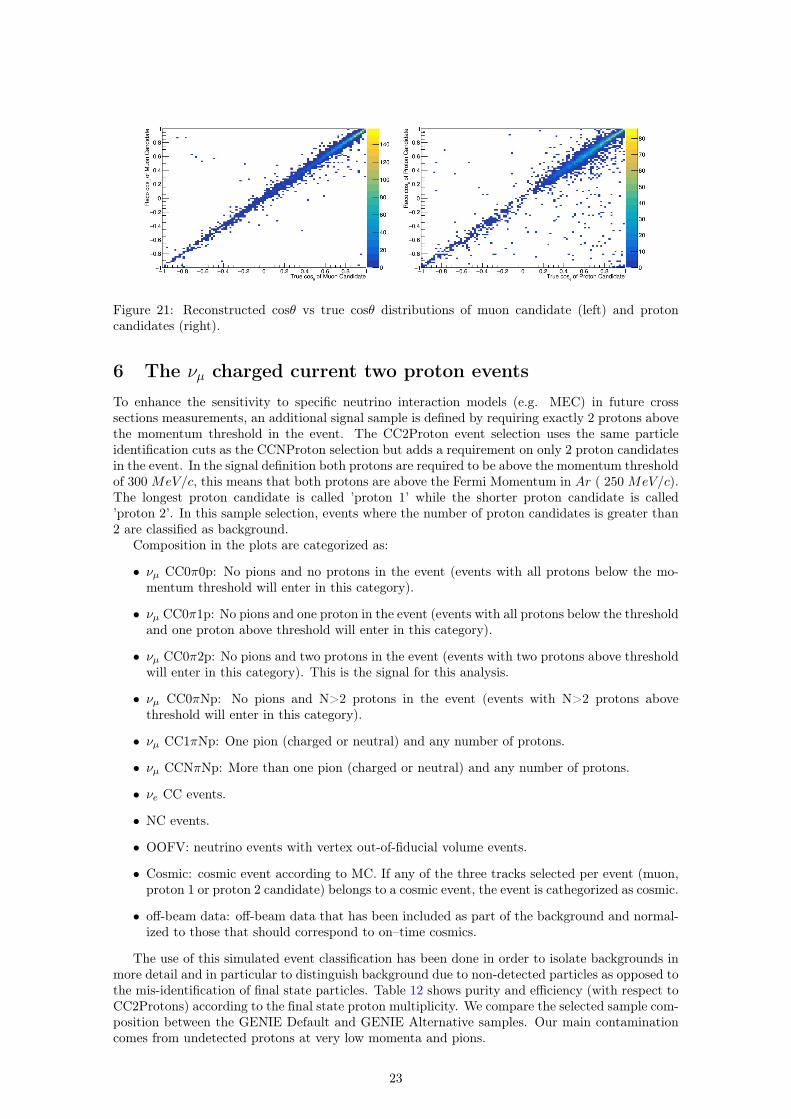
Figure 21: Reconstructed cosθ vs true cosθ distributions of muon candidate (left) and protoncandidates (right).
6 The νµ charged current two proton eventsTo enhance the sensitivity to specific neutrino interaction models (e.g. MEC) in future crosssections measurements, an additional signal sample is defined by requiring exactly 2 protons abovethe momentum threshold in the event. The CC2Proton event selection uses the same particleidentification cuts as the CCNProton selection but adds a requirement on only 2 proton candidatesin the event. In the signal definition both protons are required to be above the momentum thresholdof 300 MeV/c, this means that both protons are above the Fermi Momentum in Ar ( 250 MeV/c).The longest proton candidate is called ’proton 1’ while the shorter proton candidate is called’proton 2’. In this sample selection, events where the number of proton candidates is greater than2 are classified as background.
Composition in the plots are categorized as:
• νµ CC0π0p: No pions and no protons in the event (events with all protons below the mo-mentum threshold will enter in this category).
• νµ CC0π1p: No pions and one proton in the event (events with all protons below the thresholdand one proton above threshold will enter in this category).
• νµ CC0π2p: No pions and two protons in the event (events with two protons above thresholdwill enter in this category). This is the signal for this analysis.
• νµ CC0πNp: No pions and N>2 protons in the event (events with N>2 protons abovethreshold will enter in this category).
• νµ CC1πNp: One pion (charged or neutral) and any number of protons.
• νµ CCNπNp: More than one pion (charged or neutral) and any number of protons.
• νe CC events.
• NC events.
• OOFV: neutrino events with vertex out-of-fiducial volume events.
• Cosmic: cosmic event according to MC. If any of the three tracks selected per event (muon,proton 1 or proton 2 candidate) belongs to a cosmic event, the event is cathegorized as cosmic.
• off-beam data: off-beam data that has been included as part of the background and normal-ized to those that should correspond to on–time cosmics.
The use of this simulated event classification has been done in order to isolate backgrounds inmore detail and in particular to distinguish background due to non-detected particles as opposed tothe mis-identification of final state particles. Table 12 shows purity and efficiency (with respect toCC2Protons) according to the final state proton multiplicity. We compare the selected sample com-position between the GENIE Default and GENIE Alternative samples. Our main contaminationcomes from undetected protons at very low momenta and pions.
23
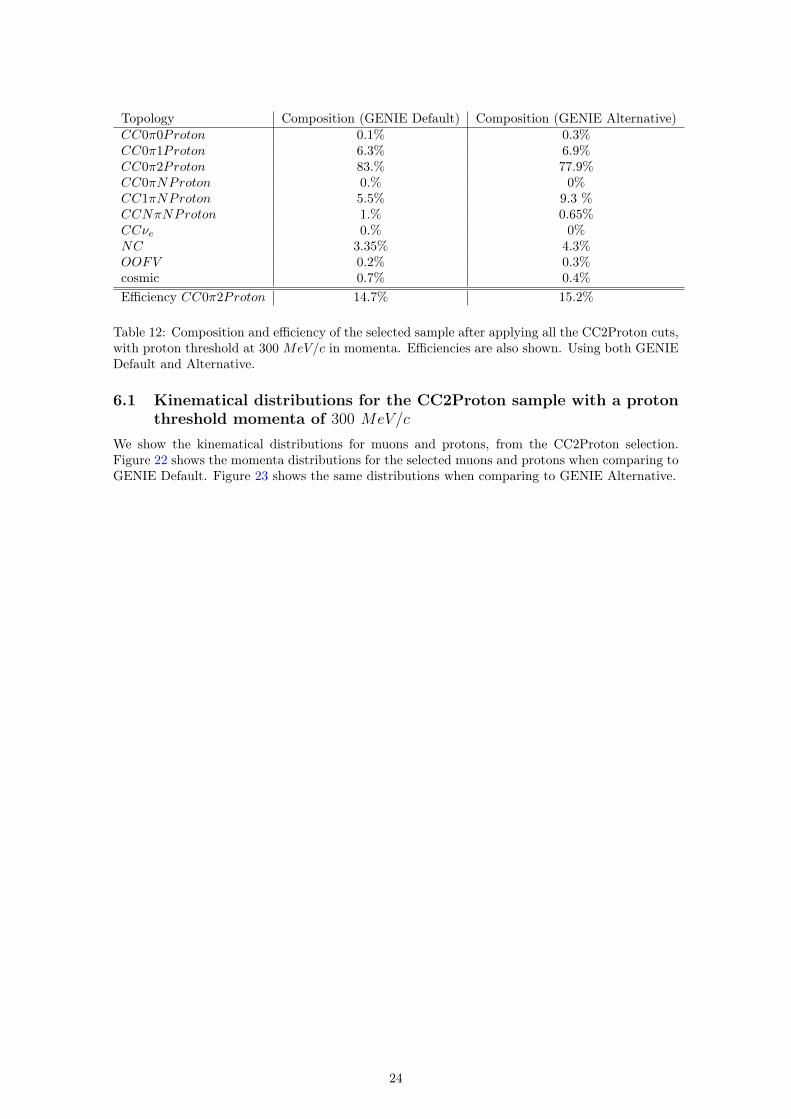
Topology Composition (GENIE Default) Composition (GENIE Alternative)CC0π0Proton 0.1% 0.3%CC0π1Proton 6.3% 6.9%CC0π2Proton 83.% 77.9%CC0πNProton 0.% 0%CC1πNProton 5.5% 9.3 %CCNπNProton 1.% 0.65%CCνe 0.% 0%NC 3.35% 4.3%OOFV 0.2% 0.3%cosmic 0.7% 0.4%Efficiency CC0π2Proton 14.7% 15.2%
Table 12: Composition and efficiency of the selected sample after applying all the CC2Proton cuts,with proton threshold at 300 MeV/c in momenta. Efficiencies are also shown. Using both GENIEDefault and Alternative.
6.1 Kinematical distributions for the CC2Proton sample with a protonthreshold momenta of 300 MeV/c
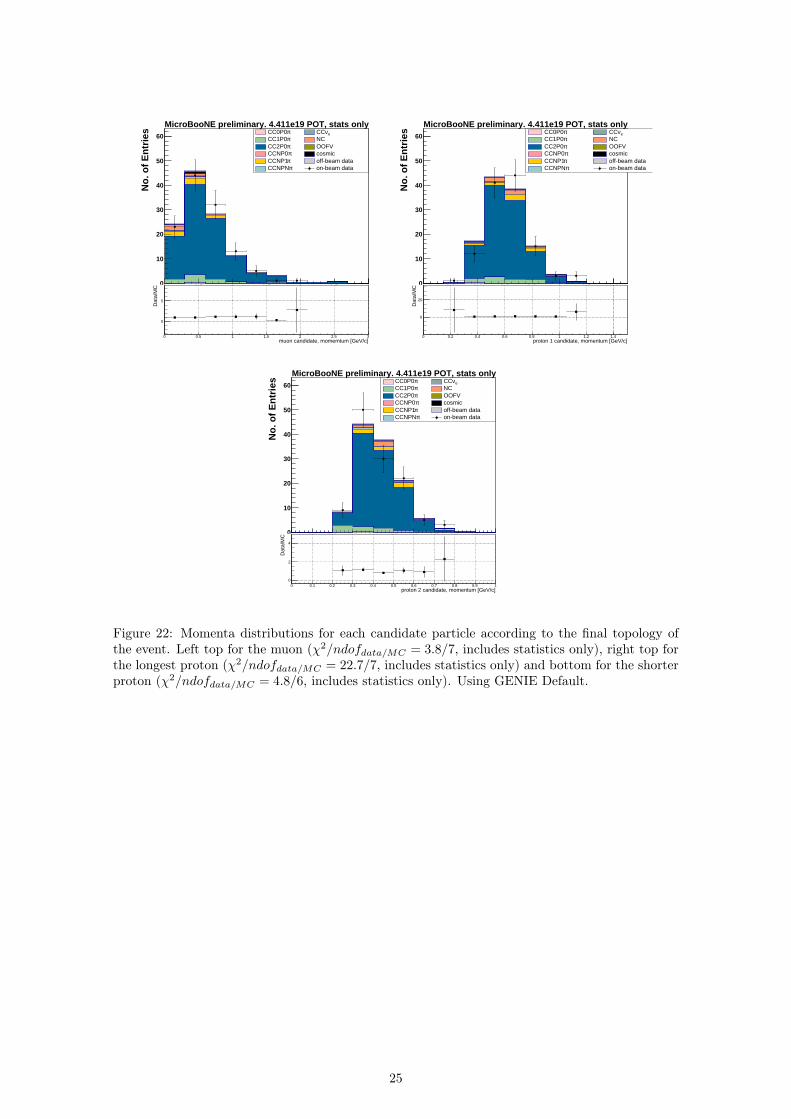
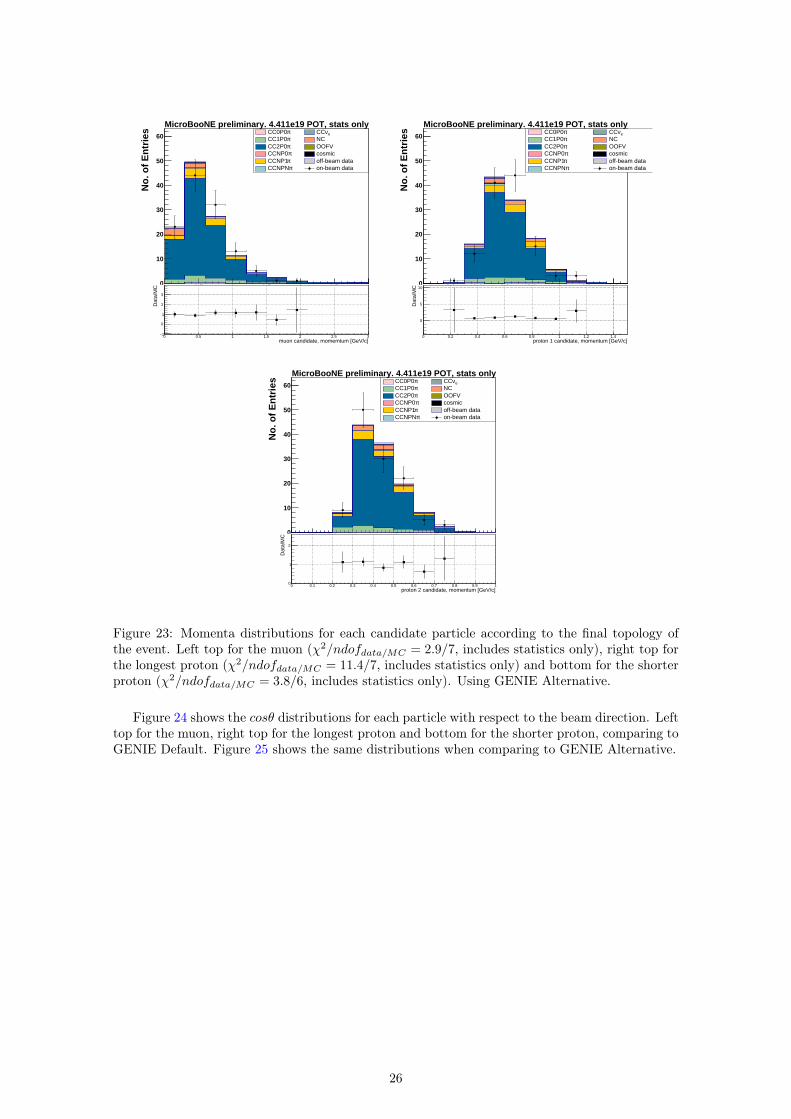
We show the kinematical distributions for muons and protons, from the CC2Proton selection.Figure 22 shows the momenta distributions for the selected muons and protons when comparing toGENIE Default. Figure 23 shows the same distributions when comparing to GENIE Alternative.
24
0 0.5 1 1.5 2 2.5 3
No
. of
En
trie
s
0
10
20
30
40
50
60πCC0P0 eνCCπCC1P0 NCπCC2P0 OOFVπCCNP0 cosmicπCCNP1 off-beam dataπCCNPN on-beam data
MicroBooNE preliminary. 4.411e19 POT, stats only
muon candidate, momemtum [GeV/c]0 0.5 1 1.5 2 2.5 3
Dat
a/M
C
0
5
0 0.2 0.4 0.6 0.8 1 1.2 1.4
No
. of
En
trie
s
0
10
20
30
40
50
60πCC0P0 eνCCπCC1P0 NCπCC2P0 OOFVπCCNP0 cosmicπCCNP1 off-beam dataπCCNPN on-beam data
MicroBooNE preliminary. 4.411e19 POT, stats only
proton 1 candidate, momentum [GeV/c]0 0.2 0.4 0.6 0.8 1 1.2 1.4
Dat
a/M
C
0
20
0 0.1 0.2 0.3 0.4 0.5 0.6 0.7 0.8 0.9 1
No
. of
En
trie
s
0
10
20
30
40
50
60πCC0P0 eνCCπCC1P0 NCπCC2P0 OOFVπCCNP0 cosmicπCCNP1 off-beam dataπCCNPN on-beam data
MicroBooNE preliminary. 4.411e19 POT, stats only
proton 2 candidate, momentum [GeV/c]0 0.1 0.2 0.3 0.4 0.5 0.6 0.7 0.8 0.9 1
Dat
a/M
C
0
2
4
Figure 22: Momenta distributions for each candidate particle according to the final topology ofthe event. Left top for the muon (χ2/ndofdata/MC = 3.8/7, includes statistics only), right top forthe longest proton (χ2/ndofdata/MC = 22.7/7, includes statistics only) and bottom for the shorterproton (χ2/ndofdata/MC = 4.8/6, includes statistics only). Using GENIE Default.
25
0 0.5 1 1.5 2 2.5 3
No
. of
En
trie
s
0
10
20
30
40
50
60πCC0P0 eνCCπCC1P0 NCπCC2P0 OOFVπCCNP0 cosmicπCCNP1 off-beam dataπCCNPN on-beam data
MicroBooNE preliminary. 4.411e19 POT, stats only
muon candidate, momemtum [GeV/c]0 0.5 1 1.5 2 2.5 3
Dat
a/M
C
1−
0
1
2
3
0 0.2 0.4 0.6 0.8 1 1.2 1.4
No
. of
En
trie
s
0
10
20
30
40
50
60πCC0P0 eνCCπCC1P0 NCπCC2P0 OOFVπCCNP0 cosmicπCCNP1 off-beam dataπCCNPN on-beam data
MicroBooNE preliminary. 4.411e19 POT, stats only
proton 1 candidate, momentum [GeV/c]0 0.2 0.4 0.6 0.8 1 1.2 1.4
Dat
a/M
C
0
5
10
0 0.1 0.2 0.3 0.4 0.5 0.6 0.7 0.8 0.9 1
No
. of
En
trie
s
0
10
20
30
40
50
60πCC0P0 eνCCπCC1P0 NCπCC2P0 OOFVπCCNP0 cosmicπCCNP1 off-beam dataπCCNPN on-beam data
MicroBooNE preliminary. 4.411e19 POT, stats only
proton 2 candidate, momentum [GeV/c]0 0.1 0.2 0.3 0.4 0.5 0.6 0.7 0.8 0.9 1
Dat
a/M
C
0
1
2
Figure 23: Momenta distributions for each candidate particle according to the final topology ofthe event. Left top for the muon (χ2/ndofdata/MC = 2.9/7, includes statistics only), right top forthe longest proton (χ2/ndofdata/MC = 11.4/7, includes statistics only) and bottom for the shorterproton (χ2/ndofdata/MC = 3.8/6, includes statistics only). Using GENIE Alternative.
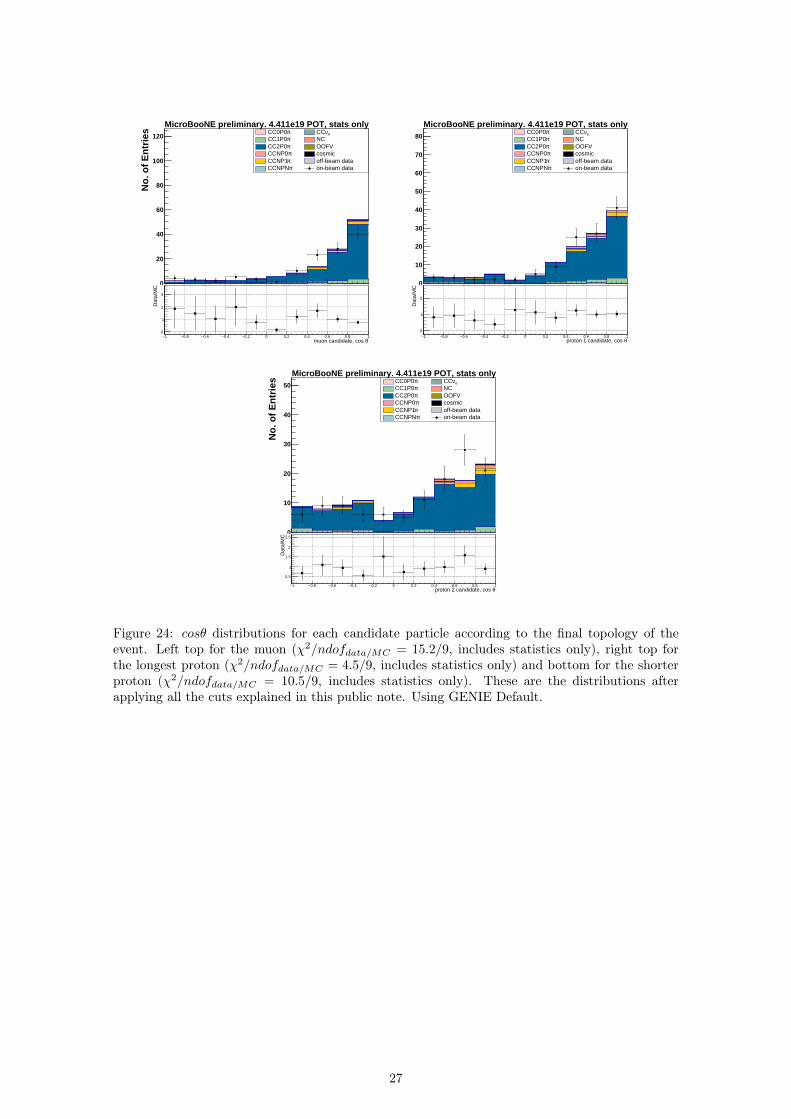
Figure 24 shows the cosθ distributions for each particle with respect to the beam direction. Lefttop for the muon, right top for the longest proton and bottom for the shorter proton, comparing toGENIE Default. Figure 25 shows the same distributions when comparing to GENIE Alternative.
26
1− 0.8− 0.6− 0.4− 0.2− 0 0.2 0.4 0.6 0.8 1
No
. of
En
trie
s
0
20
40
60
80
100
120πCC0P0 eνCCπCC1P0 NCπCC2P0 OOFVπCCNP0 cosmicπCCNP1 off-beam dataπCCNPN on-beam data
MicroBooNE preliminary. 4.411e19 POT, stats only
θmuon candidate, cos 1− 0.8− 0.6− 0.4− 0.2− 0 0.2 0.4 0.6 0.8 1
Dat
a/M
C
0
1
2
3 No. of Entries1− 0.8− 0.6− 0.4− 0.2− 0 0.2 0.4 0.6 0.8 10
10
20
30
40
50
60
70
80πCC0P0 eνCCπCC1P0 NCπCC2P0 OOFVπCCNP0 cosmicπCCNP1 off-beam dataπCCNPN on-beam data
MicroBooNE preliminary. 4.411e19 POT, stats only
θproton 1 candidate, cos 1− 0.8− 0.6− 0.4− 0.2− 0 0.2 0.4 0.6 0.8 1
Dat
a/M
C
0
1
2
1− 0.8− 0.6− 0.4− 0.2− 0 0.2 0.4 0.6 0.8 1
No
. of
En
trie
s
0
10
20
30
40
50πCC0P0 eνCCπCC1P0 NCπCC2P0 OOFVπCCNP0 cosmicπCCNP1 off-beam dataπCCNPN on-beam data
MicroBooNE preliminary. 4.411e19 POT, stats only
θproton 2 candidate, cos 1− 0.8− 0.6− 0.4− 0.2− 0 0.2 0.4 0.6 0.8 1
Dat
a/M
C
0.5
1
1.5
2
2.5
Figure 24: cosθ distributions for each candidate particle according to the final topology of theevent. Left top for the muon (χ2/ndofdata/MC = 15.2/9, includes statistics only), right top forthe longest proton (χ2/ndofdata/MC = 4.5/9, includes statistics only) and bottom for the shorterproton (χ2/ndofdata/MC = 10.5/9, includes statistics only). These are the distributions afterapplying all the cuts explained in this public note. Using GENIE Default.
27
1− 0.8− 0.6− 0.4− 0.2− 0 0.2 0.4 0.6 0.8 1
No
. of
En
trie
s
0
20
40
60
80
100πCC0P0 eνCCπCC1P0 NCπCC2P0 OOFVπCCNP0 cosmicπCCNP1 off-beam dataπCCNPN on-beam data
MicroBooNE preliminary. 4.411e19 POT, stats only
θmuon candidate, cos 1− 0.8− 0.6− 0.4− 0.2− 0 0.2 0.4 0.6 0.8 1
Dat
a/M
C
0
1
2
3 No. of Entries1− 0.8− 0.6− 0.4− 0.2− 0 0.2 0.4 0.6 0.8 10
10
20
30
40
50
60
70
80πCC0P0 eνCCπCC1P0 NCπCC2P0 OOFVπCCNP0 cosmicπCCNP1 off-beam dataπCCNPN on-beam data
MicroBooNE preliminary. 4.411e19 POT, stats only
θproton 1 candidate, cos 1− 0.8− 0.6− 0.4− 0.2− 0 0.2 0.4 0.6 0.8 1
Dat
a/M
C
0
0.5
1
1.5
2
1− 0.8− 0.6− 0.4− 0.2− 0 0.2 0.4 0.6 0.8 1
No
. of
En
trie
s
0
10
20
30
40
50πCC0P0 eνCCπCC1P0 NCπCC2P0 OOFVπCCNP0 cosmicπCCNP1 off-beam dataπCCNPN on-beam data
MicroBooNE preliminary. 4.411e19 POT, stats only
θproton 2 candidate, cos 1− 0.8− 0.6− 0.4− 0.2− 0 0.2 0.4 0.6 0.8 1
Dat
a/M
C
0.5
1
1.5
2
2.5
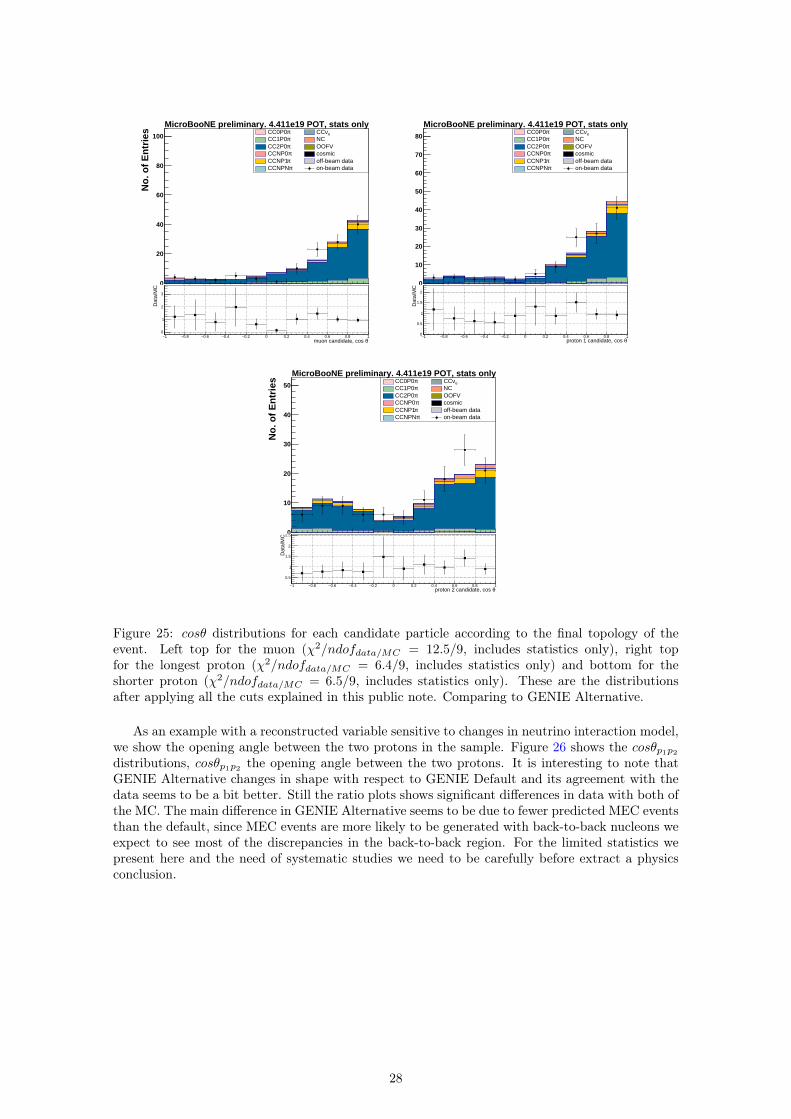
Figure 25: cosθ distributions for each candidate particle according to the final topology of theevent. Left top for the muon (χ2/ndofdata/MC = 12.5/9, includes statistics only), right topfor the longest proton (χ2/ndofdata/MC = 6.4/9, includes statistics only) and bottom for theshorter proton (χ2/ndofdata/MC = 6.5/9, includes statistics only). These are the distributionsafter applying all the cuts explained in this public note. Comparing to GENIE Alternative.
As an example with a reconstructed variable sensitive to changes in neutrino interaction model,we show the opening angle between the two protons in the sample. Figure 26 shows the cosθp1p2distributions, cosθp1p2 the opening angle between the two protons. It is interesting to note thatGENIE Alternative changes in shape with respect to GENIE Default and its agreement with thedata seems to be a bit better. Still the ratio plots shows significant differences in data with both ofthe MC. The main difference in GENIE Alternative seems to be due to fewer predicted MEC eventsthan the default, since MEC events are more likely to be generated with back-to-back nucleons weexpect to see most of the discrepancies in the back-to-back region. For the limited statistics wepresent here and the need of systematic studies we need to be carefully before extract a physicsconclusion.
28
1− 0.8− 0.6− 0.4− 0.2− 0 0.2 0.4 0.6 0.8 1
No
. of
En
trie
s
0
5
10
15
20
25
30
35
40πCC0P0 eνCCπCC1P0 NCπCC2P0 OOFVπCCNP0 cosmicπCCNP1 off-beam dataπCCNPN on-beam data
MicroBooNE preliminary. 4.411e19 POT, stats only
2
-p1
pθcos 1− 0.8− 0.6− 0.4− 0.2− 0 0.2 0.4 0.6 0.8 1
Dat
a/M
C
0
1
2
3
41− 0.8− 0.6− 0.4− 0.2− 0 0.2 0.4 0.6 0.8 1
No
. of
En
trie
s
0
5
10
15
20
25
30
35
40πCC0P0 eνCCπCC1P0 NCπCC2P0 OOFVπCCNP0 cosmicπCCNP1 off-beam dataπCCNPN on-beam data
MicroBooNE preliminary. 4.411e19 POT, stats only
2 -p
1pθcos
1− 0.8− 0.6− 0.4− 0.2− 0 0.2 0.4 0.6 0.8 1
Dat
a/M
C
1
2
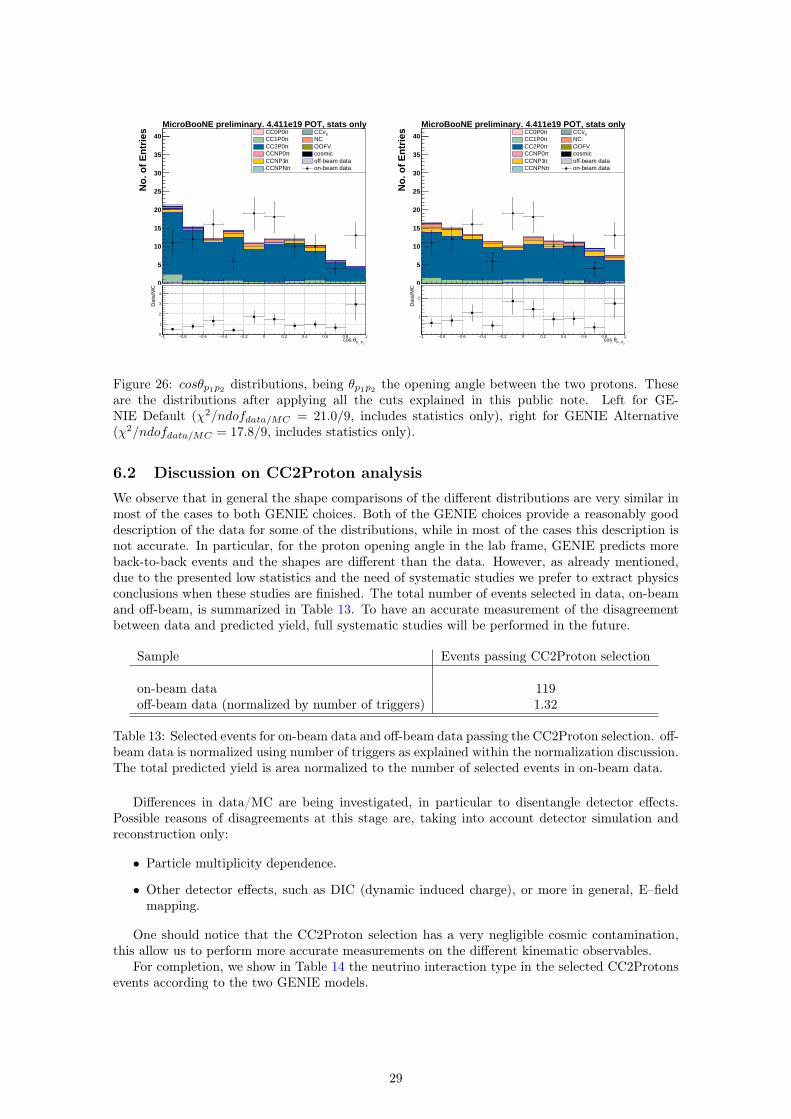
Figure 26: cosθp1p2 distributions, being θp1p2 the opening angle between the two protons. Theseare the distributions after applying all the cuts explained in this public note. Left for GE-NIE Default (χ2/ndofdata/MC = 21.0/9, includes statistics only), right for GENIE Alternative(χ2/ndofdata/MC = 17.8/9, includes statistics only).
6.2 Discussion on CC2Proton analysisWe observe that in general the shape comparisons of the different distributions are very similar inmost of the cases to both GENIE choices. Both of the GENIE choices provide a reasonably gooddescription of the data for some of the distributions, while in most of the cases this description isnot accurate. In particular, for the proton opening angle in the lab frame, GENIE predicts moreback-to-back events and the shapes are different than the data. However, as already mentioned,due to the presented low statistics and the need of systematic studies we prefer to extract physicsconclusions when these studies are finished. The total number of events selected in data, on-beamand off-beam, is summarized in Table 13. To have an accurate measurement of the disagreementbetween data and predicted yield, full systematic studies will be performed in the future.
Sample Events passing CC2Proton selection
on-beam data 119off-beam data (normalized by number of triggers) 1.32
Table 13: Selected events for on-beam data and off-beam data passing the CC2Proton selection. off-beam data is normalized using number of triggers as explained within the normalization discussion.The total predicted yield is area normalized to the number of selected events in on-beam data.
Differences in data/MC are being investigated, in particular to disentangle detector effects.Possible reasons of disagreements at this stage are, taking into account detector simulation andreconstruction only:
• Particle multiplicity dependence.
• Other detector effects, such as DIC (dynamic induced charge), or more in general, E–fieldmapping.
One should notice that the CC2Proton selection has a very negligible cosmic contamination,this allow us to perform more accurate measurements on the different kinematic observables.
For completion, we show in Table 14 the neutrino interaction type in the selected CC2Protonsevents according to the two GENIE models.
29
Reaction type GENIE Default GENIE AlternativeCCQE 13.3% 23.4 %Resonant 32.7% 47.3%DIS 5.9% 6.8%Coherent 0.1% 0%Meson Ex-change Current 45.4% 19.6%
Table 14: Topology compositions for selected events in MC GENIE Default and Alternative passingthe CC2Proton selection.
There is a clear difference in MEC production according to the different GENIE model choices.While in Default, MEC is dominant, it is not the case for the Alternative mode, in which resonantpion production is the dominant (mostly going into pion absorption within the nucleus).
7 ConclusionsWe have developed a fully automated selection of ν induced protons which has been applied toνµ induced proton events in MicroBooNE. Studies of particle identification and anomalies in thedata and MC agreement have been shown and discussed, while we claim that at this stage we arepresenting limited statistics with respect to the available data (see [8]) and systematics studieswill follow . We achieve a purity for protons using the selected PID of 92.5% and an efficiency ofthe method of 85.2%. The νµ CCNProton selection uses the νµ CC inclusive pre–selection beforeapplying additional requirements for identifying final state protons creating a high-purity sampleof CCNProton events and establishing a proton threshold of 300MeV/c in the signal. This is thelowest threshold achieved in LArTPC using a fully automated reconstruction.
The proton identification method uses the calorimetry information from the MicroBooNE de-tector, demonstrating the power of the LArTPC technology to perform PID efficiently even for lowenergy particles (momenta < 400 MeV/c). We achieve lower proton energy thresholds than otherneutrino experiments as T2K and MINERvA but as well a higher angular acceptance (4π) whichwill allow to better sensitivity to the different neutrino scattering models.
The calculated efficiency of 29% and purity of 77%, on the CCNProton selection, are adequatefor this study and will be improved before continuing on to cross section measurements. Some ofthe kinematic distributions demonstrate good agreement between our data and the simulation. Tounderstand all kinematic discrepancies, we need to further quantify detector effects and disentanglethen from neutrino scattering simulation.
The CC2Proton sample is a sub-sample of the CCNProton selection requiring a two proton–onlyselection. Performance under the different kinematic observables have been presented with respectto two different GENIE model choices. We are able to select 119 on-beam data events, with anoff-beam cosmic contamination of 1.32 events. This corresponds to the selected data events in the4.4 · 1019 POT sample used, while we expect to select ∼ 430eventsinthefullopendatasample(1.6·1020 POT).
In this public note, we have demonstrated that MicroBooNE can select protons coming fromneutrino interactions with high purity. We are also able to make measurements on the totalnumber of protons in the final state in the MicroBooNE experiment. While the current measuredefficiencies will be improved with upcoming reconstruction improvements, this analysis makes ourcurrent benchmark in proton identification in LArTPC with automatic reconstruction.
30
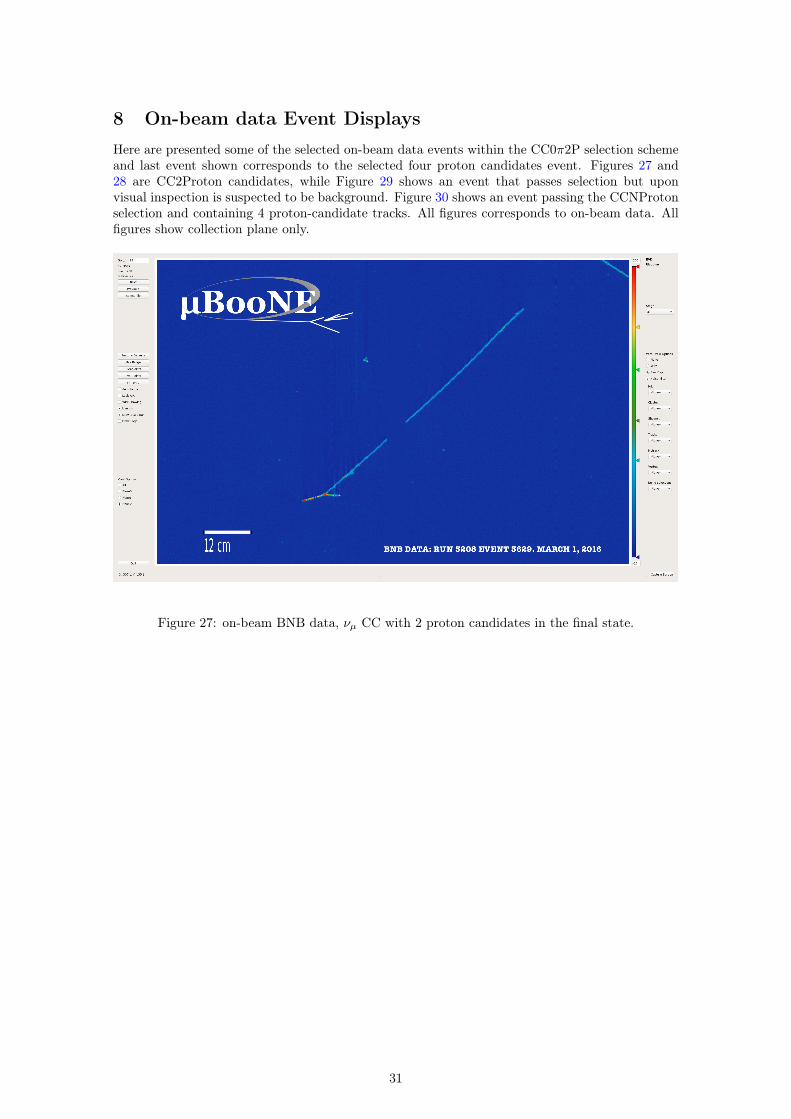
8 On-beam data Event DisplaysHere are presented some of the selected on-beam data events within the CC0π2P selection schemeand last event shown corresponds to the selected four proton candidates event. Figures 27 and28 are CC2Proton candidates, while Figure 29 shows an event that passes selection but uponvisual inspection is suspected to be background. Figure 30 shows an event passing the CCNProtonselection and containing 4 proton-candidate tracks. All figures corresponds to on-beam data. Allfigures show collection plane only.
Figure 27: on-beam BNB data, νµ CC with 2 proton candidates in the final state.
31
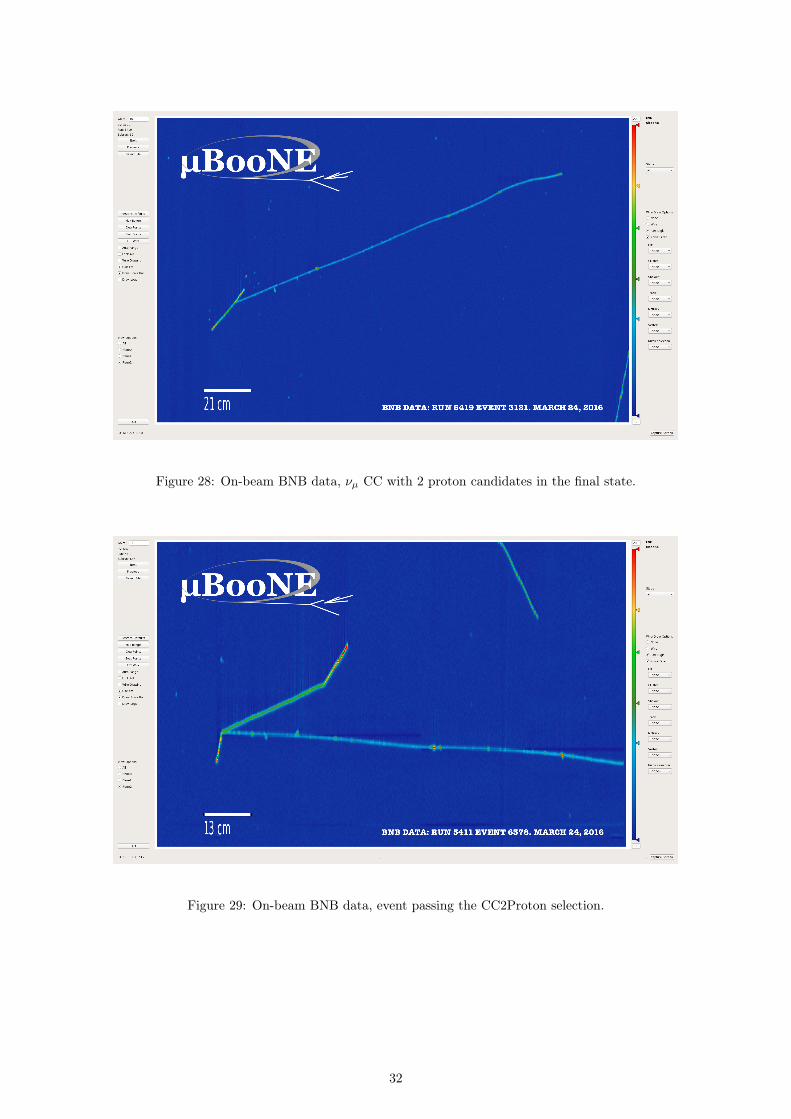
Figure 28: On-beam BNB data, νµ CC with 2 proton candidates in the final state.
Figure 29: On-beam BNB data, event passing the CC2Proton selection.
32
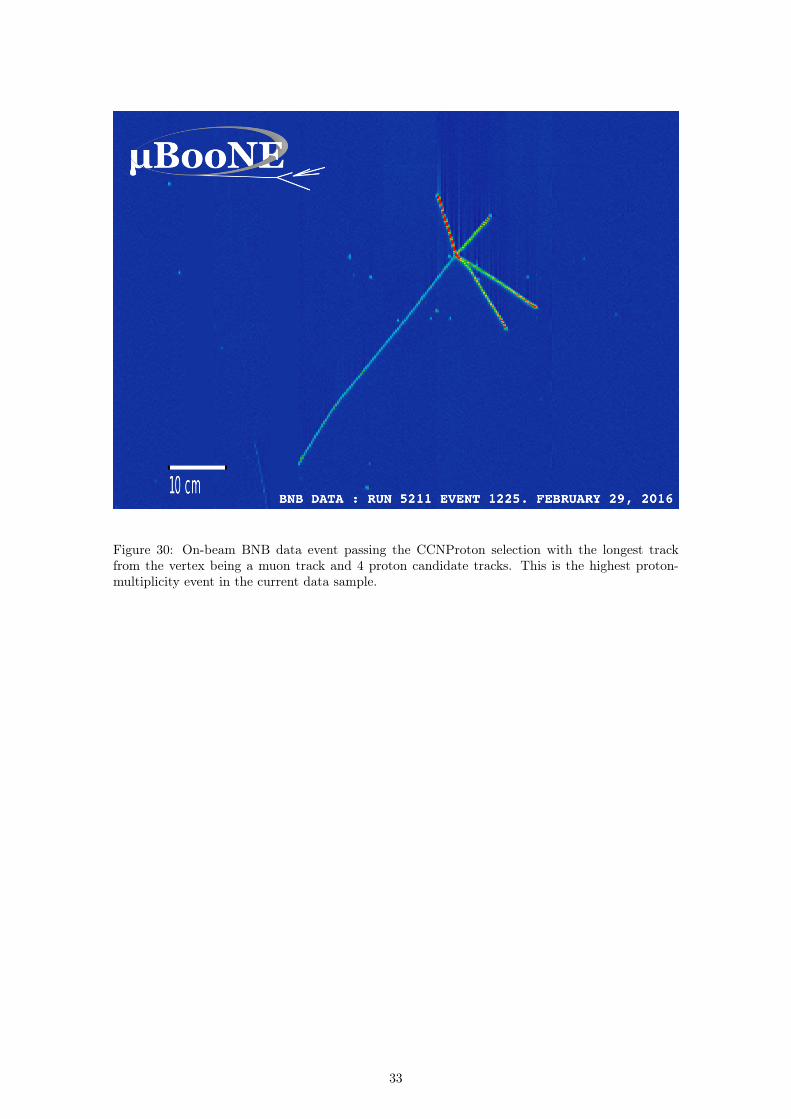
Figure 30: On-beam BNB data event passing the CCNProton selection with the longest trackfrom the vertex being a muon track and 4 proton candidate tracks. This is the highest proton-multiplicity event in the current data sample.
33
References[1] ArgoNeuT Collaboration. The detection of back-to-back proton pairs in charged-current
neutrino interactions with the argoneut detector in the numi low energy beam line.arXiv:1405.4261v1.
[2] ArgoNeuT Collaboration. First measurement of the cross section for νµ and ν̄µ induced singlecharged pion production on argon using argoneut. PHYSICAL REVIEW D 98, 052002 (2018).
[3] The ArgoNEUT Collaboration. arXiv:1306.1712.
[4] The ICARUS Collaboration. Study of electron recombination in liquid argon with the icarustpc. Nuclear Instruments and Methods in Physics Research A 523 (2004) 275–286.
[5] The MicroBooNE Collaboration. arXiv:1708.03135, Eur. Phys. J. C78, 1, 82 (2018).
[6] The MicroBooNE Collaboration. Detector calibration using through going and stopping muonsin the microboone lartpc. MICROBOONE-NOTE-1048-PUB.
[7] The MicroBooNE Collaboration. Determination of muon momentum in the microboone lar tpcusing an improved model of multiple coulomb scattering. JINST 12 P10010 (2017).
[8] The MicroBooNE Collaboration. First muon-neutrino charged-current inclusive differentialcross section measurement for microboone run 1 data. MICROBOONE-NOTE-1045-PUB.
[9] The MINERvA Collaboration. arXiv:1305.2243v4.
[10] The MiniBooNE collaboration. arXiv:1002:2680 [hep-ex], Phys. Rev. D81, 092005 (2010).
[11] The T2K Collaboration. arXiv:1602.03652v2 [hep-ex].
[12] R. Gran et al. Neutrino-nucleus quasi-elastic and 2p2h interactions up to 10 gev. Phys. Rev.D.88 (2018), p. 113007.
[13] The Wroclaw Neutrino Group. Nuwro - wrocław neutrino events generator.
[14] I. Ruiz Simo J.Nieves and M. J. Vicente Vacas. Phys. Rev. C, 83, 2011.
[15] I. Ruuiz Simo J.Nieves and M. J. Vicente Vacas. Phys. Rev. C, 83, 2004.
[16] T. Katori. Meson exchange current (mec) models in neutrino interaction generators. AIPConf. Proc. 1663 (2015), p. 030001.
[17] K. Niewczas and J. Sobczyk. Search for nucleon-nucleon correlations in neutrino-argon scat-tering. arXiv:1511.02502v2 [hex-exp] (2015).
34