Papers in Evolutionary Economic Geography - Utrecht Universityecon.geo.uu.nl/peeg/peeg1502.pdf ·...
37
http://econ.geog.uu.nl/peeg/peeg.html Papers in Evolutionary Economic Geography # 15.02 The geography and evolution of complex knowledge Pierre-Alexandre Balland and David L. Rigby
-
Upload
nguyenkhuong -
Category
Documents
-
view
225 -
download
0
Transcript of Papers in Evolutionary Economic Geography - Utrecht Universityecon.geo.uu.nl/peeg/peeg1502.pdf ·...

http://econ.geog.uu.nl/peeg/peeg.html
Papers in Evolutionary Economic Geography
# 15.02
The geography and evolution of complex knowledge
Pierre-Alexandre Balland and David L. Rigby
1
The geography and evolution of complex knowledge
Pierre-Alexandre Balland*β
& David L. Rigby§
*Department of Economic Geography, Utrecht University
βCIRCLE, Lund University
§Department of Geography, University of California Los Angeles
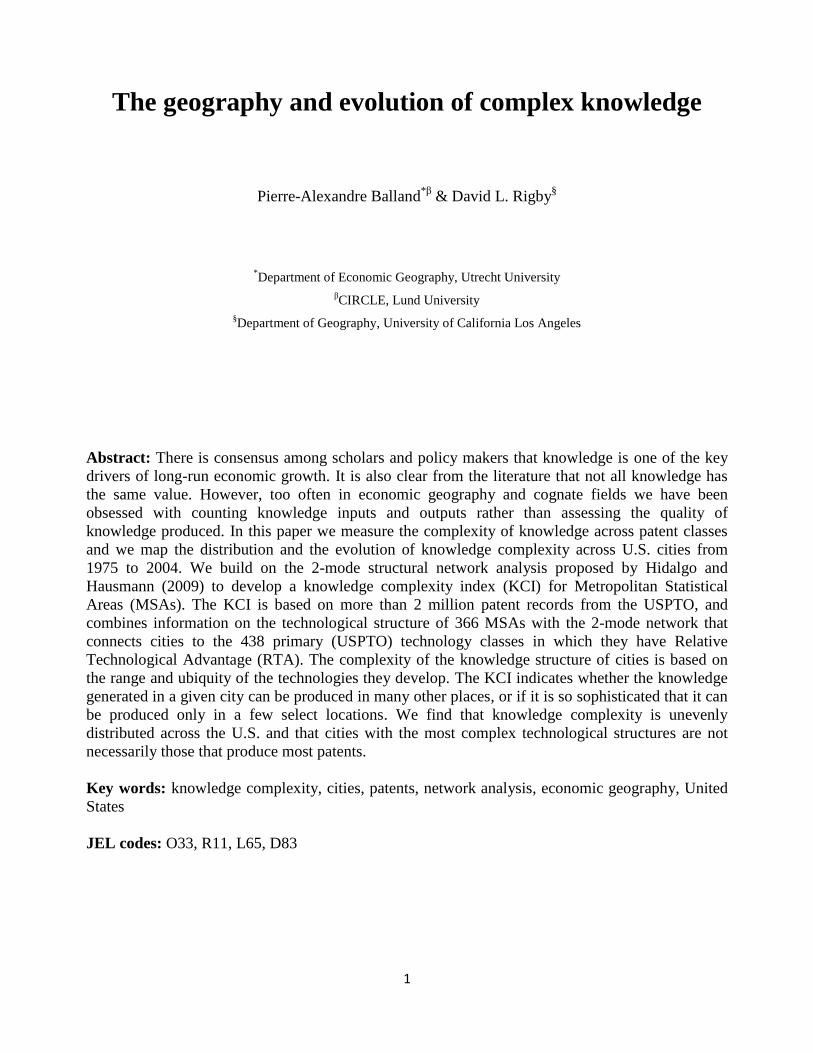
Abstract: There is consensus among scholars and policy makers that knowledge is one of the key
drivers of long-run economic growth. It is also clear from the literature that not all knowledge has
the same value. However, too often in economic geography and cognate fields we have been
obsessed with counting knowledge inputs and outputs rather than assessing the quality of
knowledge produced. In this paper we measure the complexity of knowledge across patent classes
and we map the distribution and the evolution of knowledge complexity across U.S. cities from
1975 to 2004. We build on the 2-mode structural network analysis proposed by Hidalgo and
Hausmann (2009) to develop a knowledge complexity index (KCI) for Metropolitan Statistical
Areas (MSAs). The KCI is based on more than 2 million patent records from the USPTO, and
combines information on the technological structure of 366 MSAs with the 2-mode network that
connects cities to the 438 primary (USPTO) technology classes in which they have Relative
Technological Advantage (RTA). The complexity of the knowledge structure of cities is based on
the range and ubiquity of the technologies they develop. The KCI indicates whether the knowledge
generated in a given city can be produced in many other places, or if it is so sophisticated that it can
be produced only in a few select locations. We find that knowledge complexity is unevenly
distributed across the U.S. and that cities with the most complex technological structures are not
necessarily those that produce most patents.
Key words: knowledge complexity, cities, patents, network analysis, economic geography, United
States
JEL codes: O33, R11, L65, D83
2
1. Introduction
“What is important in knowledge is not quantity, but quality. It is important to know what
knowledge is significant, what is less so, and what is trivial” (Leo Tolstoy; a calendar of wisdom).
It has become commonplace to regard the production of knowledge and the diffusion of that
knowledge across space as key to understanding the uneven geography of growth and development
(Schumpeter 1942; Solow 1956; Nelson and Winter 1982; Romer 1990; Corrado and Hulten 2010;
OECD 2013). While knowledge has always been a critical input to production, the centrality of its
role to capitalist competition has grown recently as transport costs for a wide variety of
commodities have been lowered and as global commodity markets have been increasingly
integrated (Dunning 2002; Dicken 2007). This does not mean that the usual foundations of
profitability have been flattened, that there are no longer lower cost sites of production for particular
goods, or richer markets, but rather that a growing number of firms from around the world have
increased access to such sites for more and more segments of their value. Within this environment,
knowledge that is spatially “sticky”, difficult to create or to move outside the region of its
production, has taken on added value (Lundvall and Johnson 1994; Markusen 1996; Gertler 2003).
For many firms and regions of the industrialized world, competitive advantage hinges on the
production of high-value, non-ubiquitous, complex and tacit knowledge (Maskell and Malmberg
1999; Asheim and Gertler 2005).
Why are some cities and regions more innovative or creative than others? Because of the
importance of knowledge in contemporary capitalism, and because of the role of cities in its
production, researchers in economics, geography, science and innovation studies as well as local
policy makers have focused attention on this question. It is crucial to identify differences in the
nature and the pace of innovation between cities to design efficient knowledge-based policy.
However, too often in the literature we have been obsessed with counting knowledge outputs rather
than assessing the quality of knowledge produced. In this paper, we separate the quantity and
quality of knowledge production by mapping the distribution and evolution of (technological)
knowledge complexity in U.S. cities from 1975 to 2004. We build on the 2-mode structural network
analysis proposed by Hidalgo and Hausmann (2009) to develop a knowledge complexity index
(KCI) for Metropolitan Statistical Areas (MSAs). The KCI is based on more than 2 million patent
records from the United States Patent and Trademark Office (USPTO), and combines information
3
on the technological structure of 366 MSAs with the 2-mode network that connects cities to the 438
technologies in which they have Relative Technological Advantage (RTA). Following this network
approach, we characterize the complexity of the knowledge structure of cities based on the range
and ubiquity of the technologies they develop. The KCI indicates whether the knowledge embodied
in a given city can easily be (re)produced in many other MSAs, or if it is so sophisticated that it can
only be produced by a few key cities. We find that knowledge complexity is unevenly distributed in
the U.S. and that cities with the most complex technological structure are not necessarily the ones
with the highest rates of patents per capita. Our results suggest that looking at knowledge quality on
top of knowledge quantity provides insights on the distribution of knowledge production that cannot
be captured by simply counting aggregate knowledge outputs such as patents.
The rest of the paper is organized as follows. In section 2 a brief review of relevant literature
is provided. Section 3 describes construction of the city-tech knowledge network from patent data,
the analytical backbone of our methodological framework. The structural analysis of this network
and the underlying principles of the knowledge complexity index are discussed in Section 4. Section
5 presents empirical evidence on the geography and evolution of knowledge complexity in U.S.
cities. Section 6 offers some preliminary conclusions and directions for future research.
2. Literature review
Economic geographers have long recognized geographical patterns of specialization in the
distribution of industries (Scott 1996; Ellison and Glaeser 1999), in techniques of production (Rigby
and Essletzbichler 1997; 2006), in organizational and institutional formations (Saxenian 1994;
Storper 1997), and in research and development (Audretsch and Feldman 1996). That subsets of
knowledge, or technological know-how, emerge in different places is strong evidence of the
existence of localized communities of practice (Lawson and Lorenz, 1999) that reflect place-
specific sets of technological competences, capabilities and institutional relations (Storper 1993;
Gertler 1995; Boschma and Frenken 2007).These capabilities are often built up over long periods of
time and they shape the environment within which subsequent choices are made (Essletzbichler and
Rigby 2007). Grabher (1993) argues that the path dependent nature of economic evolution locks
some regions into technological regimes that yield diminishing returns, while Saxenian (1994)
provides compelling evidence of regional variations in the capacity to maintain innovation. Long-
run creativity within regions is linked to institutional practices that foster open knowledge
4
architectures, absorptive capacity and connections to pools of knowledge generated elsewhere
(Cohen and Levintahl 1990; Bathelt et al., 2004; Asheim and Coenen 2005).
The persistence of regional differences in knowledge-bases suggests not only that invention
is cumulative in nature, resulting from the recombination of existing ideas and from processes of
search that tend to be localized, but also that knowledge subsets developed in one location are often
difficult to replicate elsewhere. David (1975) and Nelson and Winter (1982) argue that the
cumulative nature of much technological change is limited by the sunk costs of accumulating
experience. These claims are reinforced by models of search in which costs of exploration rise
steeply outside the boundaries of familiar knowledge terrain (Atkinson and Stiglitz 1969;
Binswanger 1974; Stuart and Podolny 1996; Antonelli 2005). In turn, these ideas have helped
popularize the image of knowledge development as a process of recombination (Evenson and
Kislev 1976; Weitzman 1998). Olsson and Frey (2002), and many others, build on the fitness
landscapes of Kauffman (1993) to argue that successful recombination is related to the number of
ideas in knowledge space, the distance and the extent of the interaction between them.
The difficulties of moving certain kinds of knowledge are discussed by Kogut and Zander
(1992), by Lundvall (1988) and Gertler (1995). Kogut and Zander (1992) offer a knowledge-based
view of the firm as an organizational unit adapted to replicating knowledge while limiting its
imitation by competitors. Defining knowledge as technological know-how (see also von Hippel
1988), they envision the firm as a coherent set of organizing principles, similar to the routines of
Cyert and March (1963) and Nelson and Winter (1982), that link and combine complex and tacit
knowledge held by skilled workers in collective sets of procedures, that often themselves embody a
tacit dimension. When these routines are shared across economic agents in agglomerations that are
united by traded and untraded inter-dependencies (Marshall 1920; Storper 1995), so our conception
of the knowledge-based region emerges (Lundvall and Johnson 1994; Tallman et al. 2004; Asheim
and Gertler 2005). In both these visions, knowledge-based firms and knowledge-based regions are
more than simply the sum of their (knowledge) parts. In an all too often used aphorism, adulterated
from Polanyi (1966), regions, like firms, know more than they can tell.
Though considerable theoretical effort has been directed towards uncovering what it takes to
be a learning region or a knowledge economy, much less attention has been given to the character
of knowledge produced within regions. One of the primary reasons we know so little about the
spatial composition of knowledge is that we lack precise measures of knowledge and technology
(Pavitt, 1982). Recent work has attempted to capture differences in the nature of knowledge cores
5
over space. Inspired by measures of the technological distance between firms (Jaffe 1986) and
measures of technological coherence (Teece et al. 1994), Graff (2007), Kogler et al. (2013) and
Rigby (2013) use patent data to measure distances between classes of technologies and provide
visualizations of national and local knowledge spaces and their evolution over time. Balland et al.
(2014) and Rigby (2013) explore how the structure of these spaces guide localized trajectories of
knowledge development through patterns of technological abandonment and diversification
following the product-space arguments of Hidalgo et al. (2007) and work on relatedness (Neffke
2009). Extensions of these same ideas underpin models of knowledge flow between regions (Jaffe
et al. 1993; Fischer et al. 2006) that is linked to geographical, social and cognitive proximity (Jaffe
et al. 1993; Breschi et al. 2003; Feldman et al 2013). Boschma (2005) reviews these arguments.
Patent data are also used to measure the wealth of regions from a knowledge perspective.
Acknowledging the standard criticisms of patent data (Griliches 1990), regional knowledge stocks
can be generated through perpetual inventory techniques, counting patents by their geography and
using the length of patent protection as an indicator of the “service life” of knowledge. However,
such simple accounting procedures pay little attention to the heterogeneity of the knowledge
embodied within individual patents and thus to patent values. That inventions differ in their capacity
to punctuate the incremental nature of much technological advance is broadly understood (Sahal
1981, Dosi 1982; Abernathy and Clark 1985; Christensen 1997). Fortunately, there have been
numerous attempts to assess the quality and the value of individual patents. Trajtenberg (1990)
measures patent values through forward citations and ties those measures to social valuations of
important innovations within the computer tomography sector. Hall et al. (2005) combine patent
records with COMPUSTAT firm data and show the correlation between citation-weighted patent
counts and the market value of firms. Harhoff et al. (1999) survey German patent holders and find a
strong correlation between the citation value of patents and estimates of the price at which they
would be willing to sell patents shortly after filing. Lerner (1994) links patent scope, the breadth of
knowledge claims, to the value of assignee firms. Harhoff et al. (2003) and Lanjouw and
Schankerman (2004) use citations, family-size, renewals and litigation in composite measures of
patent value. Ejermo (2009) employs similar methods to weight patent counts across Swedish
regions. In related research, Schoenmakers and Duysters (2010) trace the technological origins of
blockbuster patents to the number of knowledge domains they combine. Kelley et al. (2013) use a
similar definition in their examination of breakthrough patents in the drug and semiconductor
sectors. Verspagen (2007) also uses patents and citation data related to fuel cells to uncover critical
6
branching points in knowledge development that steer subsequent trajectories of technological
development. Castaldi et al. (2013) explore the geography of breakthrough patents in the United
States.
While patent valuations provide one indicator of the value of knowledge held by firms and
located in different regions, another critical dimension of the competitive advantage conveyed by
knowledge is its inimitability. Nickerson et al. (2007) argue that both value creation and capture sit
at the core of strategic management theory and the knowledge-based view of the firm. This raises
the question of what makes knowledge more or less difficult to replicate. For Simon (1962), the
complexity of different knowledge architectures influence their potential exclusivity and value. He
defines complex systems as comprising large numbers of components that interact in non-simple
ways and that are often non-decomposable. Kauffman’s (1993) fitness landscapes are defined across
similar dimensions. For Kauffman, the higher the interaction among a set of components, the more
rugged the search landscape, the higher the cost of search and the more valuable the optimal
solution. We might think about knowledge-based firms and regions in the same fashion: they
comprise many components that interact in non-trivial ways to produce high-value solutions to
complex problems. And, it is this complexity that aids value capture by rendering tacit much of
what they do. Indeed, it is the tacit dimension of complex knowledge production that makes it so
difficult to move between firms and between regions (Gertler 2003; Nickerson and Zenger 2004)
and that makes it valuable (Maskell and Malmberg 1999). Recognition that complex and tacit
knowledge is relatively immobile has spurred a number of papers on knowledge sourcing. Almeida
(1996) uses field interviews and patent citation data to explore local and non-local knowledge
sourcing in the U.S. semi-conductor industry. He reports that innovative regions act like magnets to
foreign multi-nationals, especially when technological knowledge is perceived to be sticky. Chung
and Alcacer (2002) confirm that in research-intensive sectors, foreign firms from both
technologically leading and lagging nations are attracted by R&D spending in U.S. states. Cantwell
and Piscitello (2002) reveal that foreign multi-nationals in Europe are more likely to locate their
foreign research plants within regions that have attractive knowledge-bases. Tempering these
claims, Singh (2008) shows that MNCs with geographically distributed R&D activities have lower
quality innovations, and suggests that this likely results from the difficulties of integrating
knowledge from different sources. Todtling et al. (2011), building on earlier work by Trippl et al.
(2009), explore local knowledge sourcing within the ICT sector across a large and a small
7
metropolitan region of Austria. They report that the structure of local knowledge networks shapes
the patterns of knowledge access and the types of knowledge acquired.
Which regions hold the most valuable knowledge, especially knowledge that is complex and
tacit and thus difficult to access? So far it has proven difficult to answer this question, at least in
part because we have no readily available measures of the complexity or the tacit nature of
knowledge located in particular places. Developing the work of Kauffman (1993) within the
management literature, and extending the arguments of Levinthal (1997) and Rivkin (2000),
Fleming and Sorenson (2001) offer a model of search-based, recombinant innovation that rests on
the complexity of knowledge. Using patent data, they provide a measure of complexity using
estimates of the difficulty of combining knowledge subsets represented by different technology sub-
classes in USPTO data. In a subsequent paper, Sorenson (2005) links measures of the complexity of
patent classes to industries and investigates the relationship between industry agglomeration and the
complexity of industrial knowledge. He shows that when industrial knowledge complexity
increases, social networks play a critical role in knowledge transfer and learning and the centripetal
forces of such networks maintain agglomeration. When knowledge complexity is lower and social
networks less important to technology flows and learning, industries are more likely to disperse. In
work on the product-space of countries, Hidalgo and Hausmann (2009) develop a different measure
of product and place complexity based on the product-level diversity of national economies and the
ubiquity (or range) of countries across which individual products are produced. To date, no one has
used either of these techniques to examine the complexity of knowledge located in cities and
regions of the U.S., or most anywhere else.
3. The city-tech knowledge network
The analytical backbone of this framework is the city-tech knowledge network that connects cities to
the technological knowledge they develop. This is a 2-mode network (Borgatti, 2009), the structure
of which emerges out of the connections between nodes of different types1, in this case between
cities and technologies (see Figure 1). This type of network is also referred to as a bipartite, bimodal
or an affiliation network in the network science literature (Opsahl, 2013). Typical examples of 2-
mode networks are individual-event networks (Davis et al., 1941), interlocking directorates (Robins
and Alexander, 2004), predator-prey networks (Allesina and Tang, 2012) or firm-projects networks
1 Connections between nodes of the same mode, i.e. city-city or technology-technology ties are not considered.
8
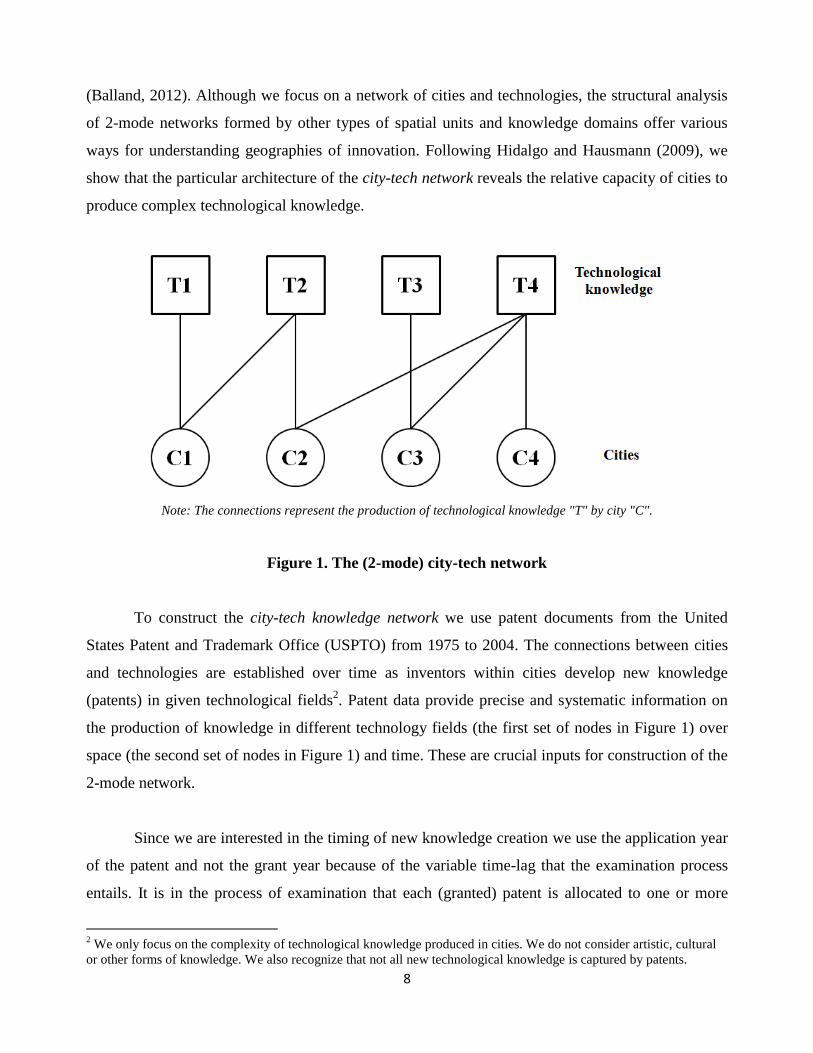
(Balland, 2012). Although we focus on a network of cities and technologies, the structural analysis
of 2-mode networks formed by other types of spatial units and knowledge domains offer various
ways for understanding geographies of innovation. Following Hidalgo and Hausmann (2009), we
show that the particular architecture of the city-tech network reveals the relative capacity of cities to
produce complex technological knowledge.
Note: The connections represent the production of technological knowledge "T" by city "C".
Figure 1. The (2-mode) city-tech network
To construct the city-tech knowledge network we use patent documents from the United
States Patent and Trademark Office (USPTO) from 1975 to 2004. The connections between cities
and technologies are established over time as inventors within cities develop new knowledge
(patents) in given technological fields2. Patent data provide precise and systematic information on
the production of knowledge in different technology fields (the first set of nodes in Figure 1) over
space (the second set of nodes in Figure 1) and time. These are crucial inputs for construction of the
2-mode network.
Since we are interested in the timing of new knowledge creation we use the application year
of the patent and not the grant year because of the variable time-lag that the examination process
entails. It is in the process of examination that each (granted) patent is allocated to one or more
2 We only focus on the complexity of technological knowledge produced in cities. We do not consider artistic, cultural
or other forms of knowledge. We also recognize that not all new technological knowledge is captured by patents.
9
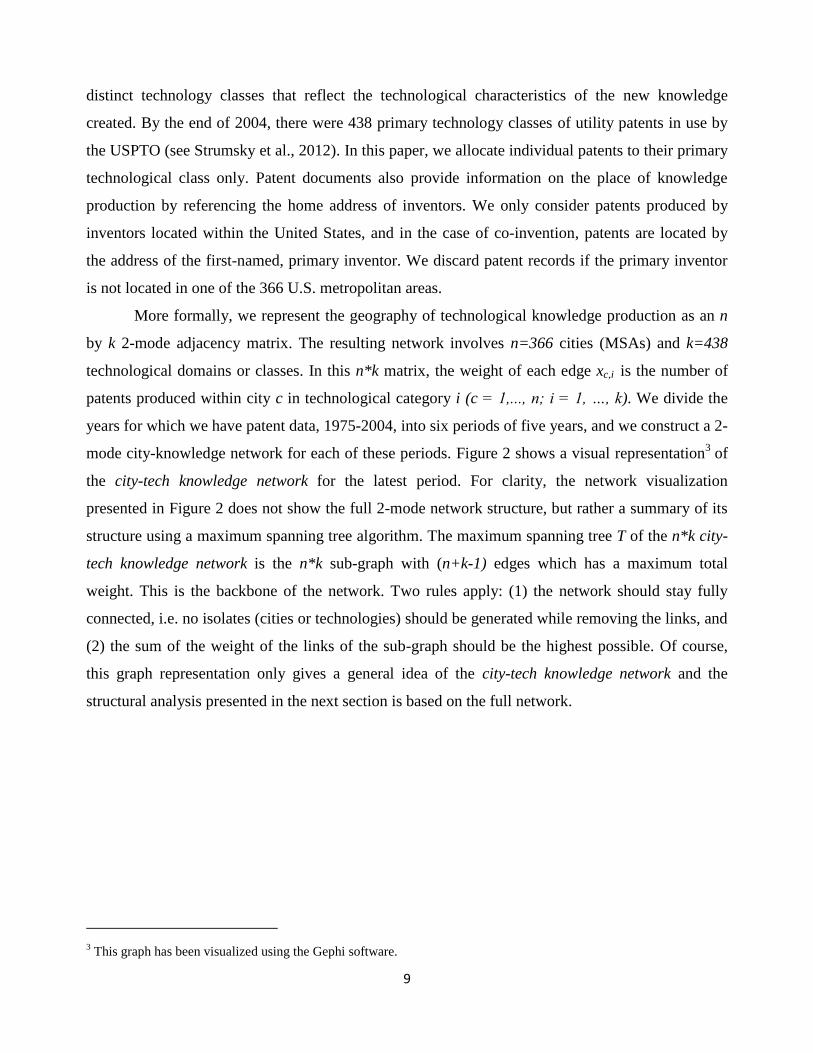
distinct technology classes that reflect the technological characteristics of the new knowledge
created. By the end of 2004, there were 438 primary technology classes of utility patents in use by
the USPTO (see Strumsky et al., 2012). In this paper, we allocate individual patents to their primary
technological class only. Patent documents also provide information on the place of knowledge
production by referencing the home address of inventors. We only consider patents produced by
inventors located within the United States, and in the case of co-invention, patents are located by
the address of the first-named, primary inventor. We discard patent records if the primary inventor
is not located in one of the 366 U.S. metropolitan areas.
More formally, we represent the geography of technological knowledge production as an n
by k 2-mode adjacency matrix. The resulting network involves n=366 cities (MSAs) and k=438
technological domains or classes. In this n*k matrix, the weight of each edge xc,i is the number of
patents produced within city c in technological category i (c = 1,..., n; i = 1, …, k). We divide the
years for which we have patent data, 1975-2004, into six periods of five years, and we construct a 2-
mode city-knowledge network for each of these periods. Figure 2 shows a visual representation3 of
the city-tech knowledge network for the latest period. For clarity, the network visualization
presented in Figure 2 does not show the full 2-mode network structure, but rather a summary of its
structure using a maximum spanning tree algorithm. The maximum spanning tree T of the n*k city-
tech knowledge network is the n*k sub-graph with (n+k-1) edges which has a maximum total
weight. This is the backbone of the network. Two rules apply: (1) the network should stay fully
connected, i.e. no isolates (cities or technologies) should be generated while removing the links, and
(2) the sum of the weight of the links of the sub-graph should be the highest possible. Of course,
this graph representation only gives a general idea of the city-tech knowledge network and the
structural analysis presented in the next section is based on the full network.
3 This graph has been visualized using the Gephi software.
10
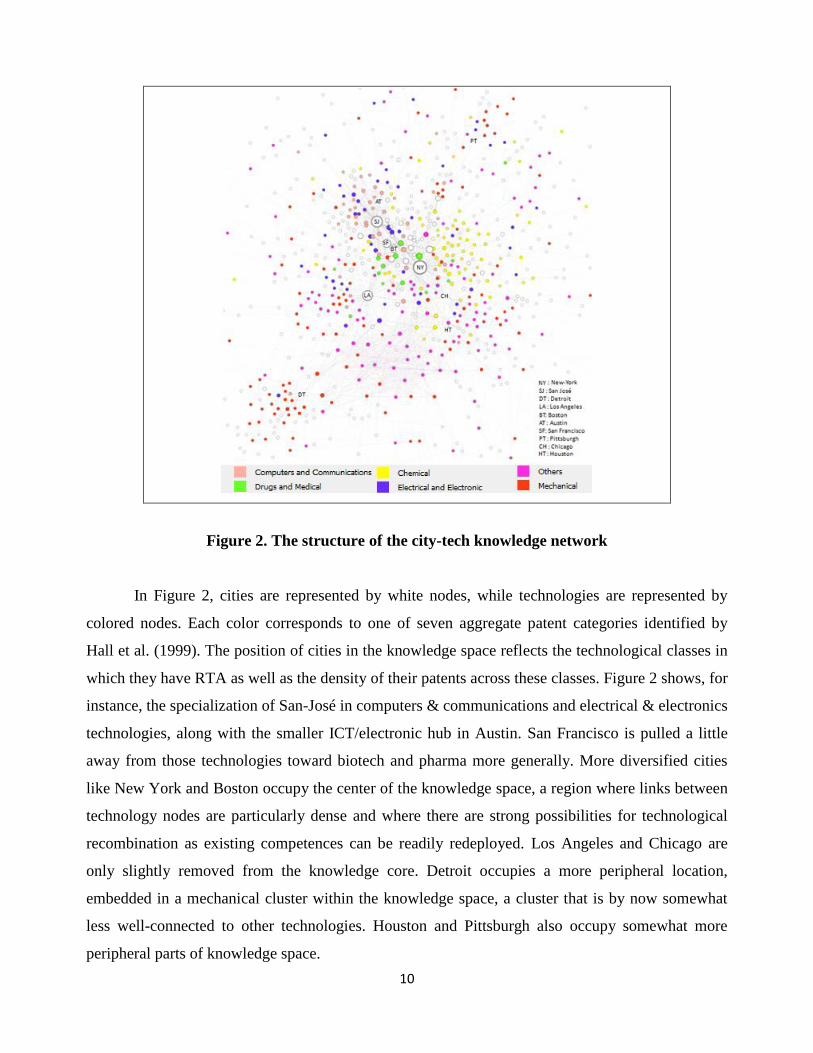
Figure 2. The structure of the city-tech knowledge network
In Figure 2, cities are represented by white nodes, while technologies are represented by
colored nodes. Each color corresponds to one of seven aggregate patent categories identified by
Hall et al. (1999). The position of cities in the knowledge space reflects the technological classes in
which they have RTA as well as the density of their patents across these classes. Figure 2 shows, for
instance, the specialization of San-José in computers & communications and electrical & electronics
technologies, along with the smaller ICT/electronic hub in Austin. San Francisco is pulled a little
away from those technologies toward biotech and pharma more generally. More diversified cities
like New York and Boston occupy the center of the knowledge space, a region where links between
technology nodes are particularly dense and where there are strong possibilities for technological
recombination as existing competences can be readily redeployed. Los Angeles and Chicago are
only slightly removed from the knowledge core. Detroit occupies a more peripheral location,
embedded in a mechanical cluster within the knowledge space, a cluster that is by now somewhat
less well-connected to other technologies. Houston and Pittsburgh also occupy somewhat more
peripheral parts of knowledge space.
11
As is often the case in complex networks research, the visual representation of the 2-mode
network is limited by the number of nodes and ties that can be identified. Despite major advances in
layout algorithms for large scale networks, visualization can only offer preliminary insights into the
structure of the city-tech knowledge network. We turn to a more comprehensive, statistical analysis
of that structure below.
4. Knowledge complexity index
Simultaneously combining information on (1) which cities produce specific technologies and (2)
how common specific technologies are across cities, it is possible to construct an indicator that
captures the level of knowledge complexity of a city's technological portfolio for a given period of
time. This knowledge complexity index (KCI) is based on the “method of reflections” developed by
Hidalgo and Hausmann (2009). In their pioneering work, Hidalgo and Hausmann show that the
economic complexity of a country’s output is reflected by the particular composition of its export
basket, taking into account the relative composition of the export baskets of all other countries. The
main idea in their analytical framework is that more complex economies produce more exclusive
goods, i.e. non-ubiquitous commodities that are sourced in relatively few countries in total.
Countries with complex economic structures experience a privileged source of comparative
advantage, a form of spatial-technological-monopoly from which they extract rents. Countries that
produce goods that are widely imitated by others, commodities that are ubiquitous, tend to have low
scores in terms of economic complexity. Following this approach, we analyze the particular
architecture of the city-tech knowledge network and we show that a city has a complex
technological composition if it produces knowledge that relatively few other cities are able to
imitate.
To construct our index of knowledge complexity, we only consider cities that are significant
producer of a particular technological knowledge. As a result, it should be noted that the city-tech
knowledge network that is used to compute the KCI is based only on technological classes in which
a city has a relative technological advantage (RTA) in terms of patenting activity. The network can
be represented as a n*k 2-mode adjacency matrix , where reflects whether or not
city c has RTA in the production of technological knowledge i (c = 1,..., n; i = 1, …, k). A city c has
RTA in technology i at time t if the share of technology i in the city's technological portfolio is
higher than the share of technology i in the entire U.S. patent portfolio. More formally,
if:
12
Following the method of reflections, the KCI sequentially combines two variables: the diversity of
cities and the ubiquity of technological classes. These two variables correspond to the 2-mode
degree centrality of both sets of nodes in the city-tech knowledge network. The degree centrality of
cities (kc,0) is given by the number of technological classes in which each city has RTA (diversity):
(1)
where is defined above. Similarly, the degree centrality of technological classes (ki,0) is given
by the number of cities that exhibit RTA in a particular class (ubiquity):
(2)
The knowledge complexity index combines information on both the 2-mode degree
distribution of cities (diversity) and the 2-mode degree distribution of the technologies produced
(ubiquity). We follow Hidalgo and Hausmann (2009) and sequentially combine the diversity of
cities and ubiquity of technological classes computing simultaneously the following 2 equations
over a series of n iterations:
(3)
(4)
To provide some further interpretation of this method, in a second iteration, for n = 1, in
equation (3) represents the average ubiquity of the technologies in which city c has RTA. In similar
fashion, in equation (4) measures the average diversity of cities that have RTA in technology i.
In the next iteration, for captures the average diversity of cities that have export baskets
similar to city c, and reveals the average ubiquity of the technologies developed in cities that
13
have RTA in technology class i. Each additional step in yields a finer-grained estimate of
the knowledge complexity of a city using information on the complexity of the technologies in
which the city exhibits RTA. Each additional step in provides a finer-grained estimate of
the knowledge complexity of a technology using information on the complexity of cities that have
RTA in that technology. While higher order iterations in this technique become progressively more
difficult to define, the method of reflections provides more and more precise measures of the KCI of
cities and technologies, as noise and size effects are eliminated. The iterations are stopped when the
ranking of cities and technologies is stable from one step to another (i.e. no further information can
be extracted from the structure of the city-tech network). The KCI of cities presented in this paper is
based on n = 20 iterations4.
A reformulation of the ‘method of reflections’ as a fixed-point theorem based on Markov
chain analysis5 is provided by Caldarelli et al. (2012). Note that application of this alternative
methodology does not substantially alter our results. New metrics derived from this mathematical
reformulation are outlined in Tacchella et al. (2012).
5. The geography and evolution of complex knowledge
In this section, we present results of the structural analysis of the city-tech knowledge network with
a particular focus on cities6. Some of the results are displayed for the 5-year period 2000-2004,
though the patterns we describe are robust across all periods of observation.
An essential statistical indicator of global network structure is the degree distribution of
nodes. As specified above, the degree of cities in the 2-mode network is simply given by the
number of technologies in which a city has a relative technological advantage (kc,0). The degree
distribution gives the fraction of cities in the city-tech knowledge network with a given degree k.
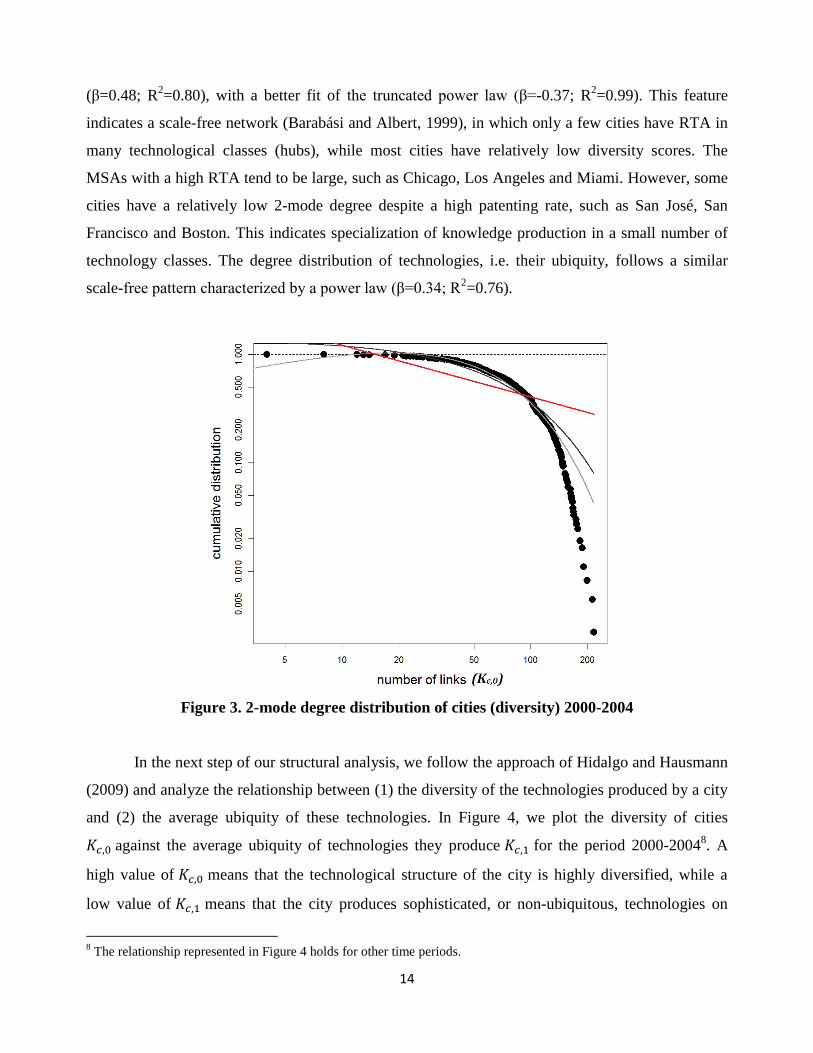
Figure 3 plots the cumulative degree distribution of cities for the period 2000-2004 and fits
exponential (in black), power law (in red) and truncated power law (in light grey) functions to the
data7. As it is often the case in 2-mode networks, the distribution is characterized by a power law
4 The correlation between Kc,18 and Kc, 20 is 0.99.
5 We would like to thank Bernhard Truffer for pointing out the limitation of the method of reflections and suggesting an
alternative algebraic solution. Vanessa Bouaroudj helped us write the R code that implements this mathematical
reformulation.
6 Following this approach, we could analyze the complexity of technological classes, but this is beyond the scope of the
present paper.
7 This figure has been plotted using the "bipartite" package, part of the R environment for statistical computing and
graphics.
14
(β=0.48; R2=0.80), with a better fit of the truncated power law (β=-0.37; R
2=0.99). This feature
indicates a scale-free network (Barabási and Albert, 1999), in which only a few cities have RTA in
many technological classes (hubs), while most cities have relatively low diversity scores. The
MSAs with a high RTA tend to be large, such as Chicago, Los Angeles and Miami. However, some
cities have a relatively low 2-mode degree despite a high patenting rate, such as San José, San
Francisco and Boston. This indicates specialization of knowledge production in a small number of
technology classes. The degree distribution of technologies, i.e. their ubiquity, follows a similar
scale-free pattern characterized by a power law (β=0.34; R2=0.76).
Figure 3. 2-mode degree distribution of cities (diversity) 2000-2004
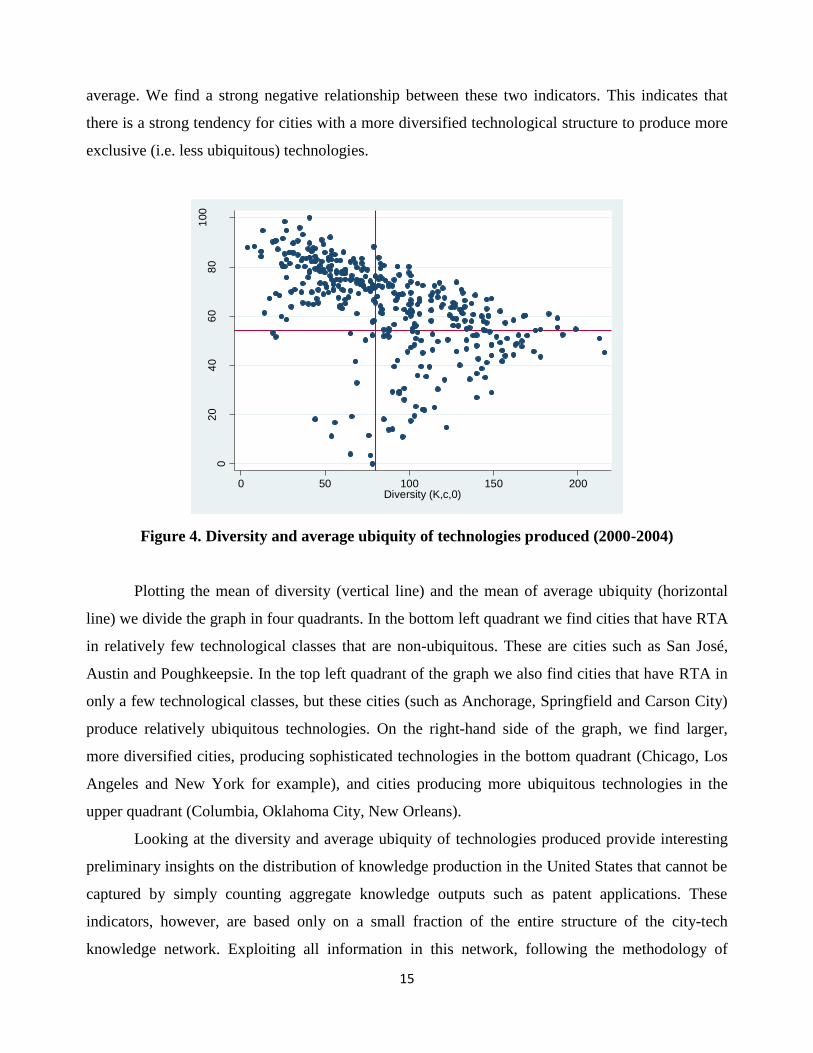
In the next step of our structural analysis, we follow the approach of Hidalgo and Hausmann
(2009) and analyze the relationship between (1) the diversity of the technologies produced by a city
and (2) the average ubiquity of these technologies. In Figure 4, we plot the diversity of cities
against the average ubiquity of technologies they produce for the period 2000-20048. A
high value of means that the technological structure of the city is highly diversified, while a
low value of means that the city produces sophisticated, or non-ubiquitous, technologies on
8 The relationship represented in Figure 4 holds for other time periods.
15
average. We find a strong negative relationship between these two indicators. This indicates that
there is a strong tendency for cities with a more diversified technological structure to produce more
exclusive (i.e. less ubiquitous) technologies.
Figure 4. Diversity and average ubiquity of technologies produced (2000-2004)
Plotting the mean of diversity (vertical line) and the mean of average ubiquity (horizontal
line) we divide the graph in four quadrants. In the bottom left quadrant we find cities that have RTA
in relatively few technological classes that are non-ubiquitous. These are cities such as San José,
Austin and Poughkeepsie. In the top left quadrant of the graph we also find cities that have RTA in
only a few technological classes, but these cities (such as Anchorage, Springfield and Carson City)
produce relatively ubiquitous technologies. On the right-hand side of the graph, we find larger,
more diversified cities, producing sophisticated technologies in the bottom quadrant (Chicago, Los
Angeles and New York for example), and cities producing more ubiquitous technologies in the
upper quadrant (Columbia, Oklahoma City, New Orleans).
Looking at the diversity and average ubiquity of technologies produced provide interesting
preliminary insights on the distribution of knowledge production in the United States that cannot be
captured by simply counting aggregate knowledge outputs such as patent applications. These
indicators, however, are based only on a small fraction of the entire structure of the city-tech
knowledge network. Exploiting all information in this network, following the methodology of
02
04
06
08
01
00
Ave
rag
e u
biq
uity o
f te
chn
olo
gic
al cla
sse
s (
K,c
,1)
0 50 100 150 200Diversity (K,c,0)
16
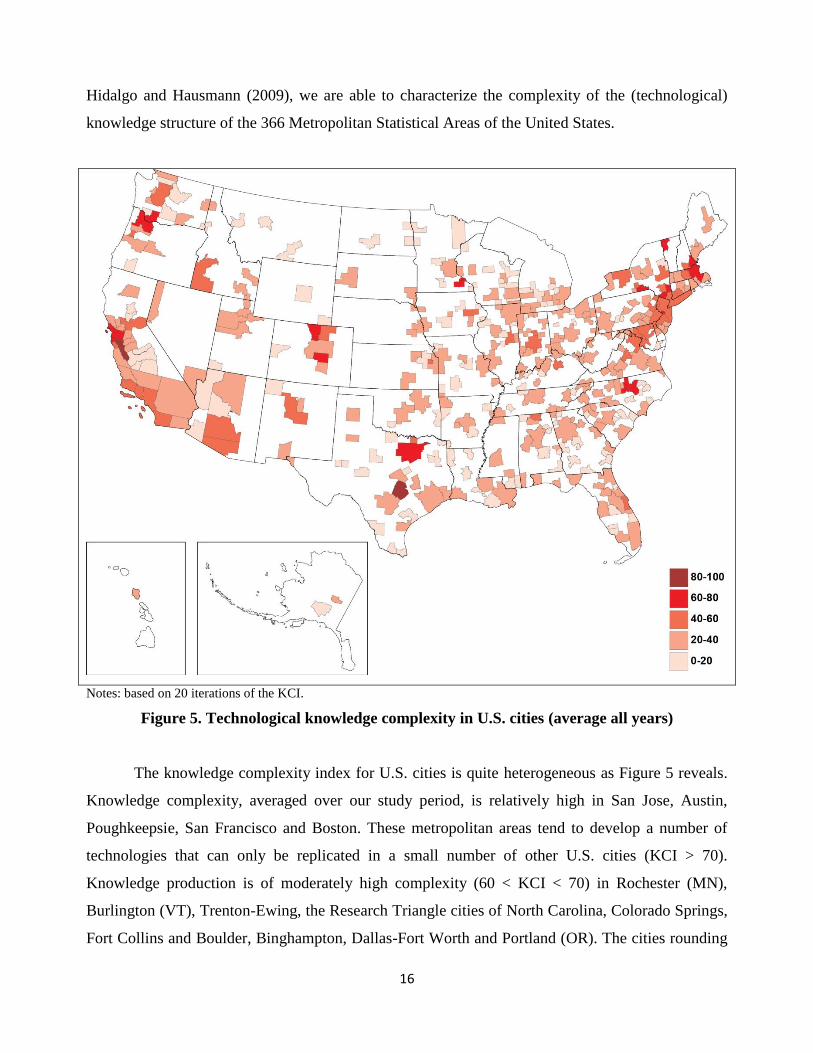
Hidalgo and Hausmann (2009), we are able to characterize the complexity of the (technological)
knowledge structure of the 366 Metropolitan Statistical Areas of the United States.
Notes: based on 20 iterations of the KCI.
Figure 5. Technological knowledge complexity in U.S. cities (average all years)
The knowledge complexity index for U.S. cities is quite heterogeneous as Figure 5 reveals.
Knowledge complexity, averaged over our study period, is relatively high in San Jose, Austin,
Poughkeepsie, San Francisco and Boston. These metropolitan areas tend to develop a number of
technologies that can only be replicated in a small number of other U.S. cities (KCI > 70).
Knowledge production is of moderately high complexity (60 < KCI < 70) in Rochester (MN),
Burlington (VT), Trenton-Ewing, the Research Triangle cities of North Carolina, Colorado Springs,
Fort Collins and Boulder, Binghampton, Dallas-Fort Worth and Portland (OR). The cities rounding
17
out the top 10% in terms of average knowledge complexity since 1980 include Washington DC and
New York City, Boise, Corvallis, Santa Cruz, Seattle, Phoenix and Tucson, Albany, Ithaca,
Kingston and Rochester (NY), Manchester, Greeley, Worcester and Philadelphia.
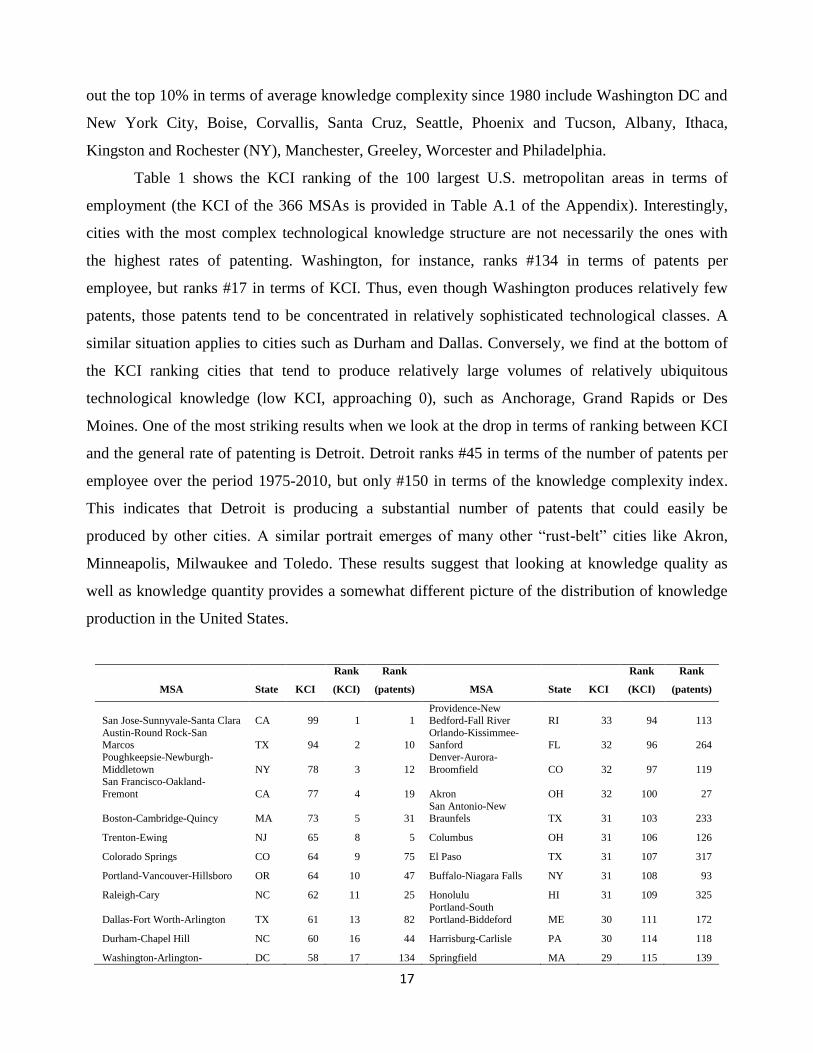
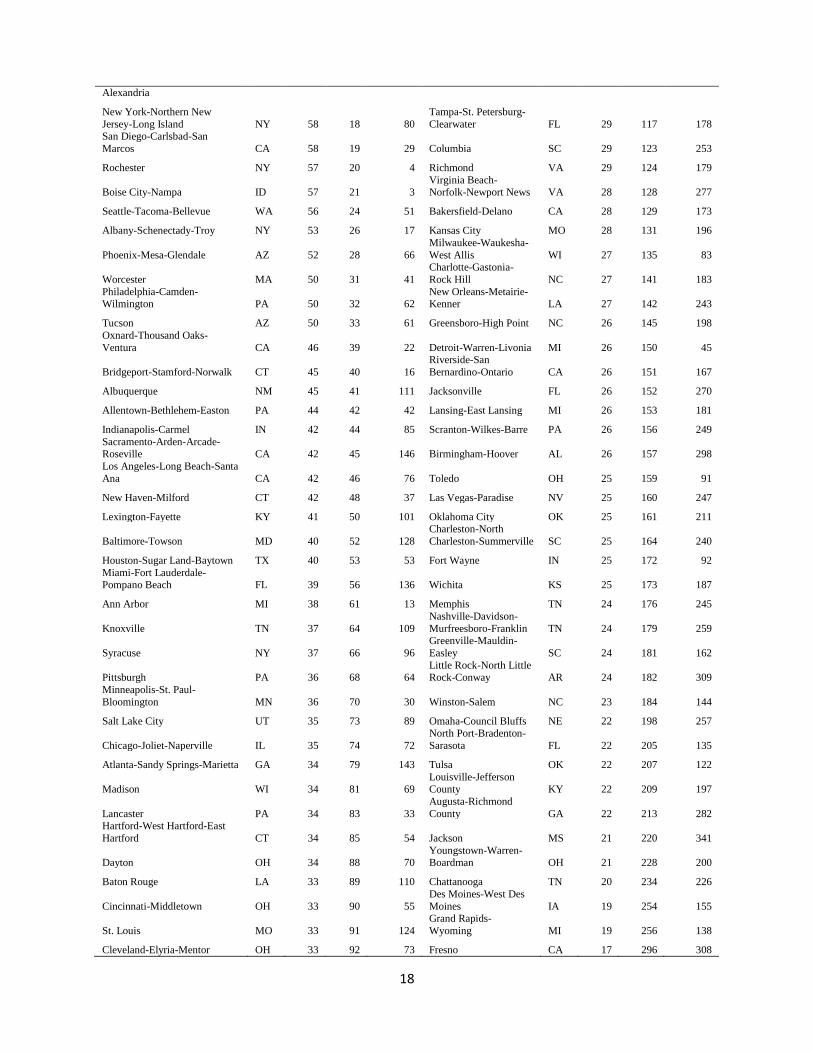
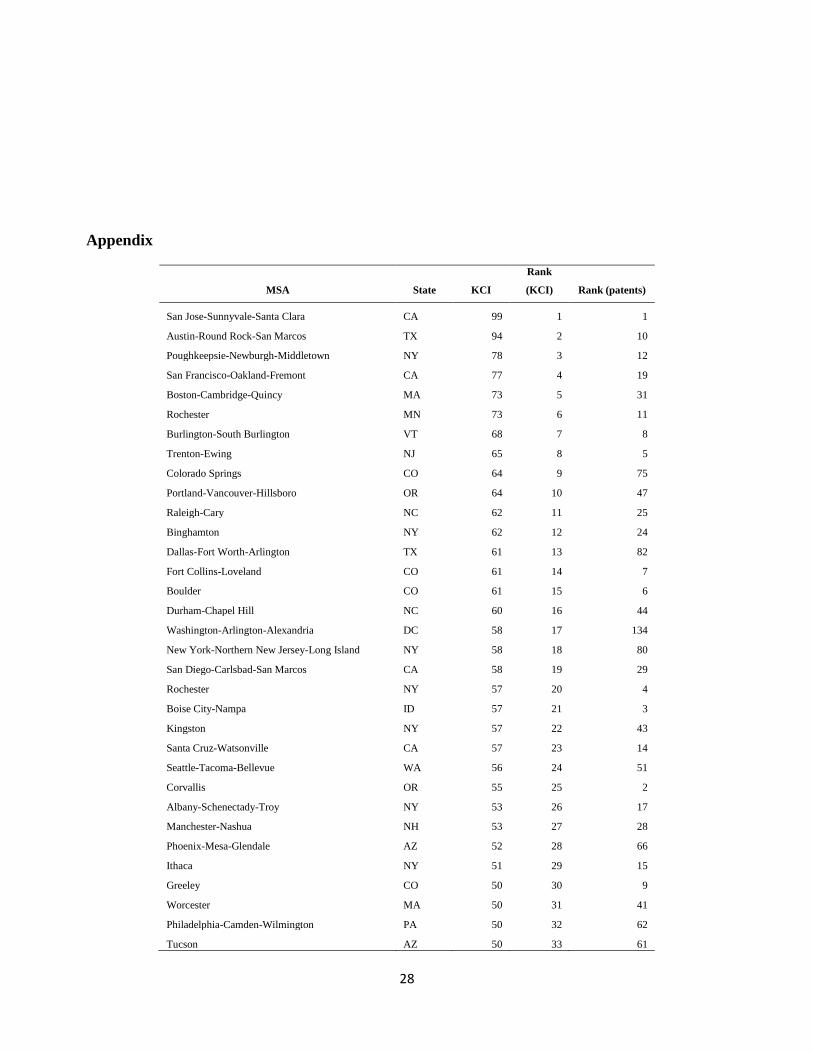
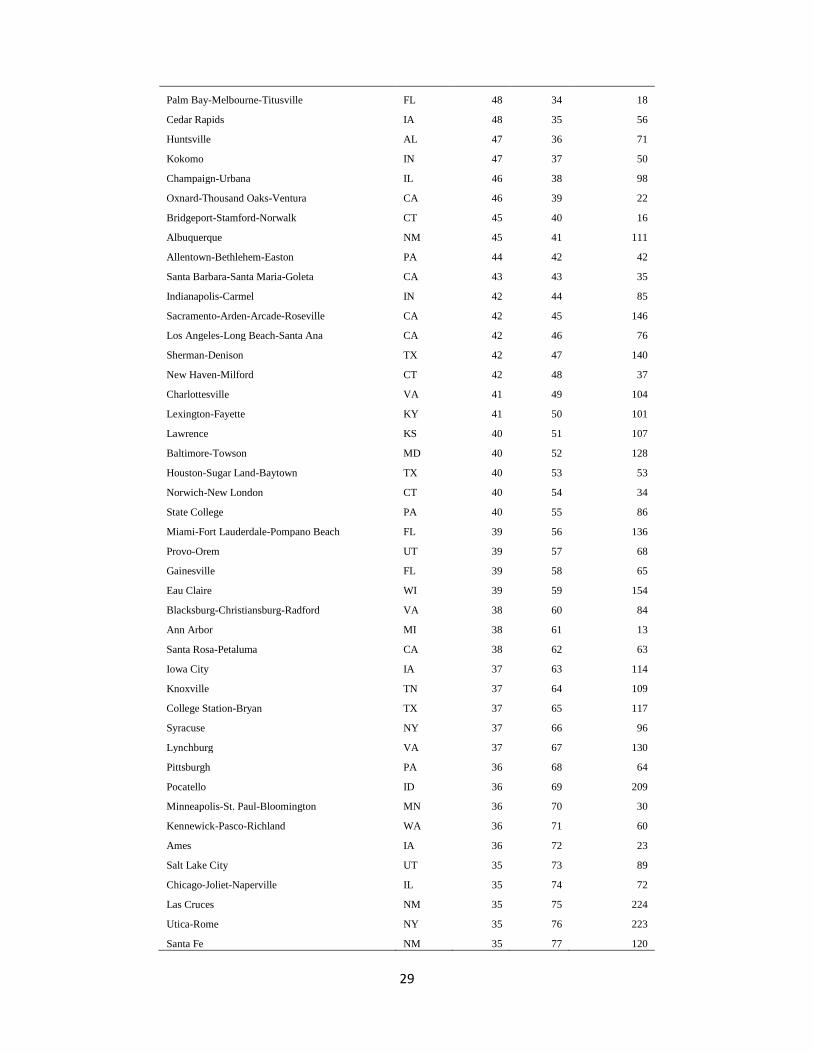
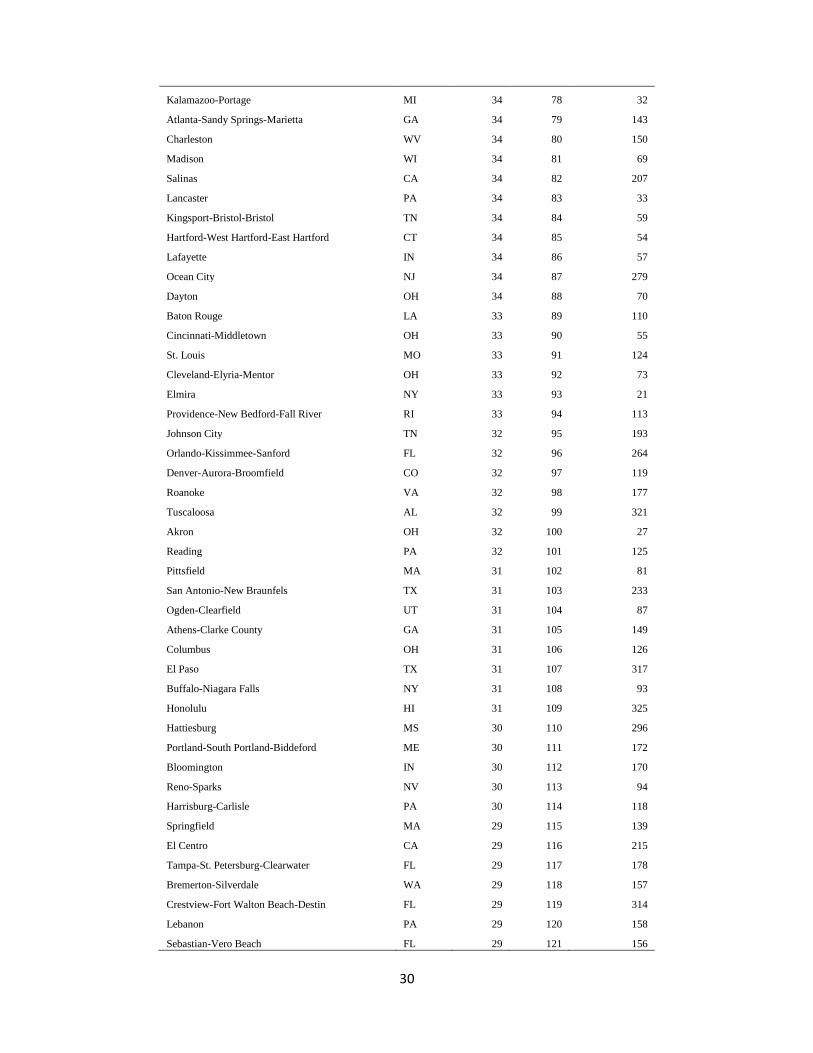
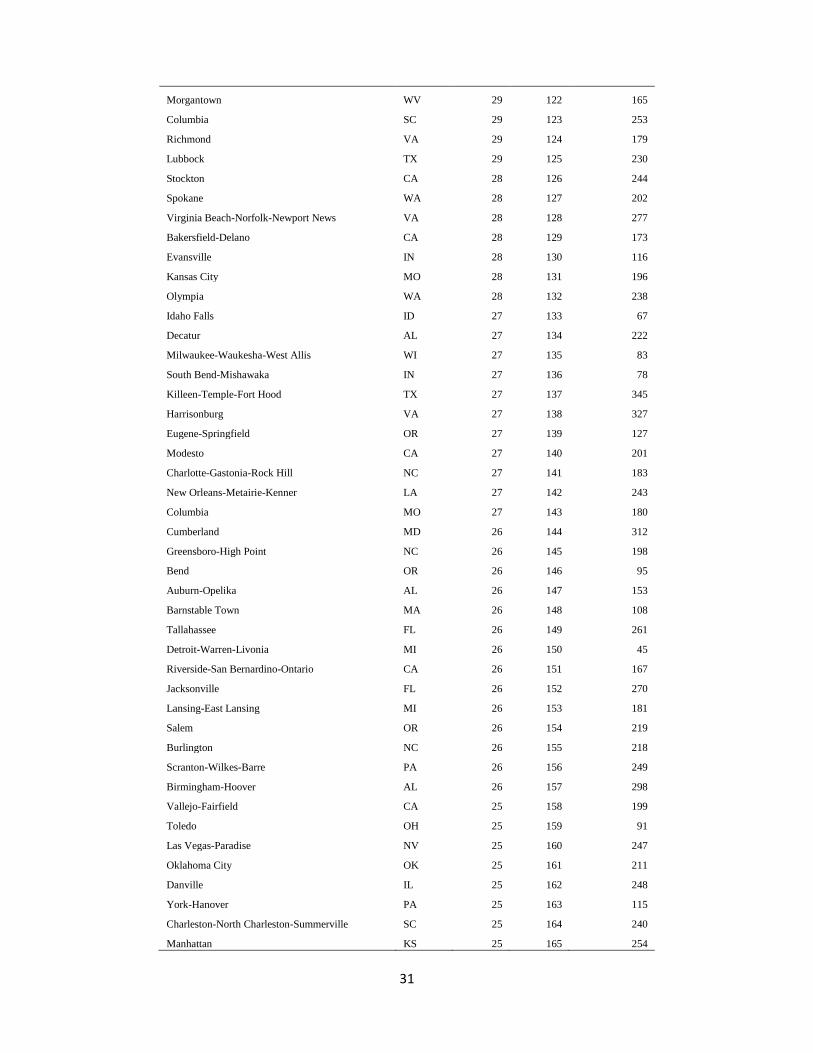
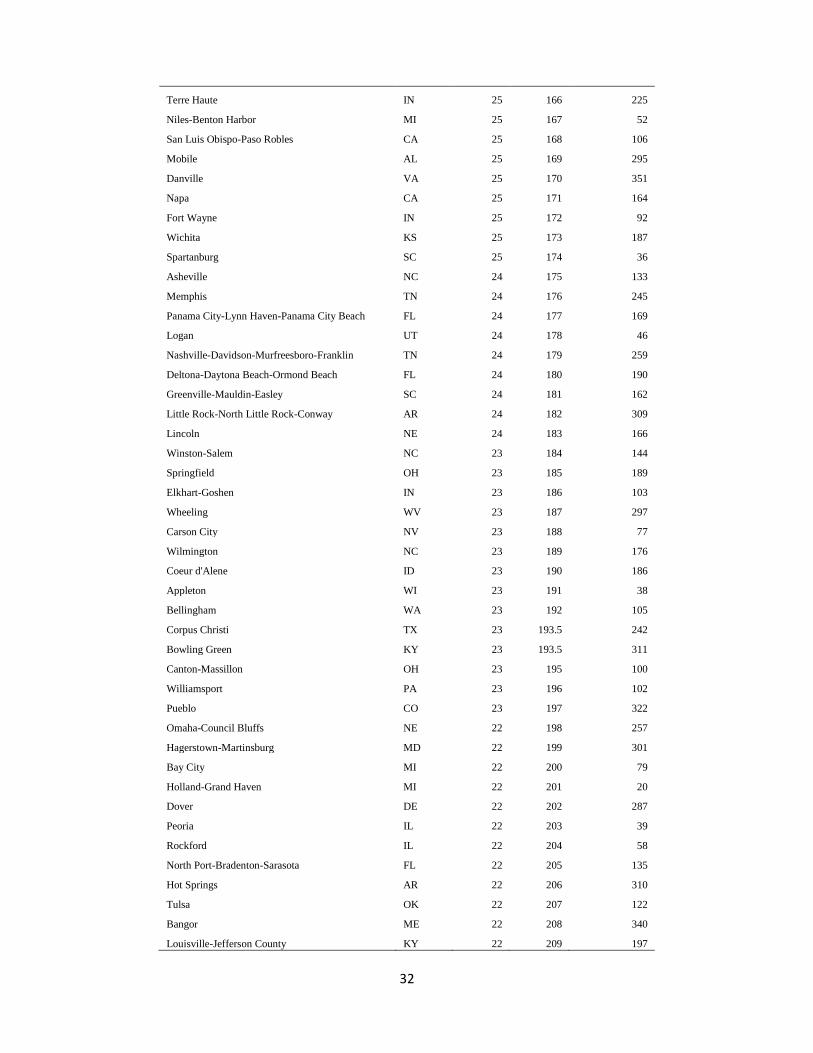
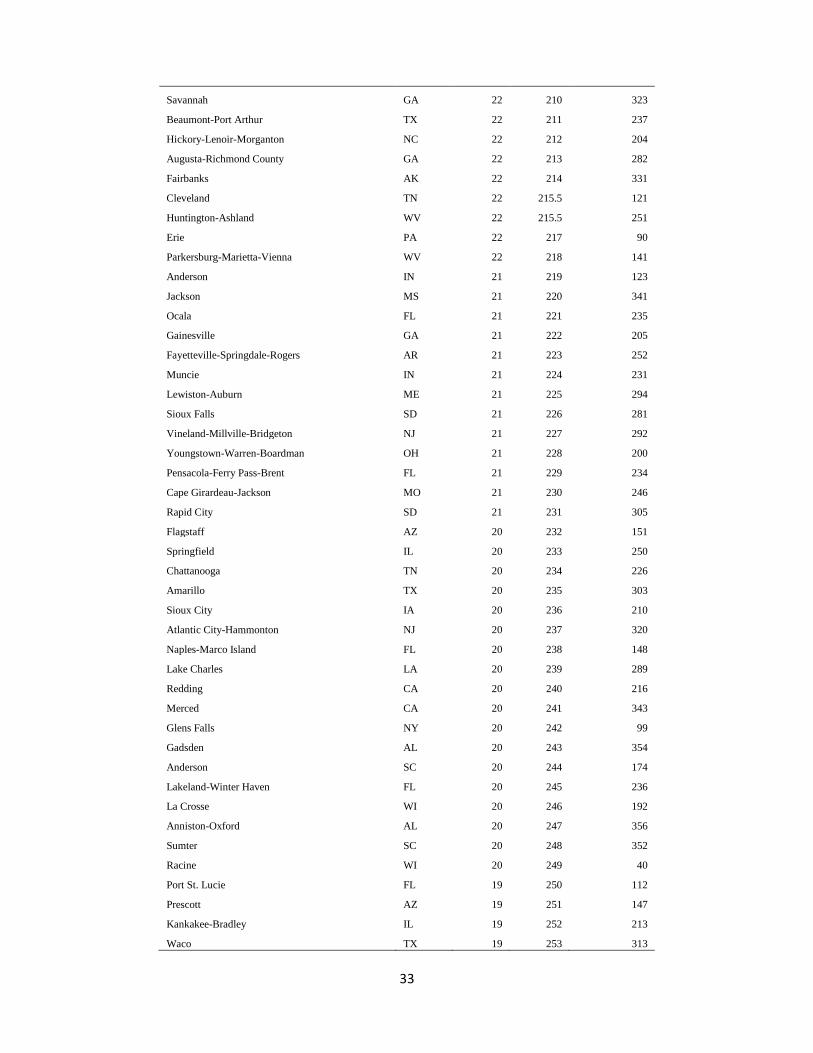
Table 1 shows the KCI ranking of the 100 largest U.S. metropolitan areas in terms of
employment (the KCI of the 366 MSAs is provided in Table A.1 of the Appendix). Interestingly,
cities with the most complex technological knowledge structure are not necessarily the ones with
the highest rates of patenting. Washington, for instance, ranks #134 in terms of patents per
employee, but ranks #17 in terms of KCI. Thus, even though Washington produces relatively few
patents, those patents tend to be concentrated in relatively sophisticated technological classes. A
similar situation applies to cities such as Durham and Dallas. Conversely, we find at the bottom of
the KCI ranking cities that tend to produce relatively large volumes of relatively ubiquitous
technological knowledge (low KCI, approaching 0), such as Anchorage, Grand Rapids or Des
Moines. One of the most striking results when we look at the drop in terms of ranking between KCI
and the general rate of patenting is Detroit. Detroit ranks #45 in terms of the number of patents per
employee over the period 1975-2010, but only #150 in terms of the knowledge complexity index.
This indicates that Detroit is producing a substantial number of patents that could easily be
produced by other cities. A similar portrait emerges of many other “rust-belt” cities like Akron,
Minneapolis, Milwaukee and Toledo. These results suggest that looking at knowledge quality as
well as knowledge quantity provides a somewhat different picture of the distribution of knowledge
production in the United States.
MSA State KCI
Rank
(KCI)
Rank
(patents) MSA State KCI
Rank
(KCI)
Rank
(patents)
San Jose-Sunnyvale-Santa Clara CA 99 1 1 Providence-New Bedford-Fall River RI 33 94 113
Austin-Round Rock-San Marcos TX 94 2 10
Orlando-Kissimmee-Sanford FL 32 96 264
Poughkeepsie-Newburgh-
Middletown NY 78 3 12
Denver-Aurora-
Broomfield CO 32 97 119
San Francisco-Oakland-
Fremont CA 77 4 19 Akron OH 32 100 27
Boston-Cambridge-Quincy MA 73 5 31 San Antonio-New Braunfels TX 31 103 233
Trenton-Ewing NJ 65 8 5 Columbus OH 31 106 126
Colorado Springs CO 64 9 75 El Paso TX 31 107 317
Portland-Vancouver-Hillsboro OR 64 10 47 Buffalo-Niagara Falls NY 31 108 93
Raleigh-Cary NC 62 11 25 Honolulu HI 31 109 325
Dallas-Fort Worth-Arlington TX 61 13 82
Portland-South
Portland-Biddeford ME 30 111 172
Durham-Chapel Hill NC 60 16 44 Harrisburg-Carlisle PA 30 114 118
Washington-Arlington- DC 58 17 134 Springfield MA 29 115 139
18
Alexandria
New York-Northern New
Jersey-Long Island NY 58 18 80
Tampa-St. Petersburg-
Clearwater FL 29 117 178 San Diego-Carlsbad-San
Marcos CA 58 19 29 Columbia SC 29 123 253
Rochester NY 57 20 4 Richmond VA 29 124 179
Boise City-Nampa ID 57 21 3 Virginia Beach-Norfolk-Newport News VA 28 128 277
Seattle-Tacoma-Bellevue WA 56 24 51 Bakersfield-Delano CA 28 129 173
Albany-Schenectady-Troy NY 53 26 17 Kansas City MO 28 131 196
Phoenix-Mesa-Glendale AZ 52 28 66
Milwaukee-Waukesha-
West Allis WI 27 135 83
Worcester MA 50 31 41
Charlotte-Gastonia-
Rock Hill NC 27 141 183
Philadelphia-Camden-Wilmington PA 50 32 62
New Orleans-Metairie-Kenner LA 27 142 243
Tucson AZ 50 33 61 Greensboro-High Point NC 26 145 198
Oxnard-Thousand Oaks-
Ventura CA 46 39 22 Detroit-Warren-Livonia MI 26 150 45
Bridgeport-Stamford-Norwalk CT 45 40 16
Riverside-San
Bernardino-Ontario CA 26 151 167
Albuquerque NM 45 41 111 Jacksonville FL 26 152 270
Allentown-Bethlehem-Easton PA 44 42 42 Lansing-East Lansing MI 26 153 181
Indianapolis-Carmel IN 42 44 85 Scranton-Wilkes-Barre PA 26 156 249
Sacramento-Arden-Arcade-Roseville CA 42 45 146 Birmingham-Hoover AL 26 157 298
Los Angeles-Long Beach-Santa
Ana CA 42 46 76 Toledo OH 25 159 91
New Haven-Milford CT 42 48 37 Las Vegas-Paradise NV 25 160 247
Lexington-Fayette KY 41 50 101 Oklahoma City OK 25 161 211
Baltimore-Towson MD 40 52 128
Charleston-North
Charleston-Summerville SC 25 164 240
Houston-Sugar Land-Baytown TX 40 53 53 Fort Wayne IN 25 172 92
Miami-Fort Lauderdale-Pompano Beach FL 39 56 136 Wichita KS 25 173 187
Ann Arbor MI 38 61 13 Memphis TN 24 176 245
Knoxville TN 37 64 109
Nashville-Davidson-
Murfreesboro-Franklin TN 24 179 259
Syracuse NY 37 66 96
Greenville-Mauldin-
Easley SC 24 181 162
Pittsburgh PA 36 68 64 Little Rock-North Little Rock-Conway AR 24 182 309
Minneapolis-St. Paul-
Bloomington MN 36 70 30 Winston-Salem NC 23 184 144
Salt Lake City UT 35 73 89 Omaha-Council Bluffs NE 22 198 257
Chicago-Joliet-Naperville IL 35 74 72
North Port-Bradenton-
Sarasota FL 22 205 135
Atlanta-Sandy Springs-Marietta GA 34 79 143 Tulsa OK 22 207 122
Madison WI 34 81 69
Louisville-Jefferson
County KY 22 209 197
Lancaster PA 34 83 33
Augusta-Richmond
County GA 22 213 282 Hartford-West Hartford-East
Hartford CT 34 85 54 Jackson MS 21 220 341
Dayton OH 34 88 70 Youngstown-Warren-Boardman OH 21 228 200
Baton Rouge LA 33 89 110 Chattanooga TN 20 234 226
Cincinnati-Middletown OH 33 90 55
Des Moines-West Des
Moines IA 19 254 155
St. Louis MO 33 91 124
Grand Rapids-
Wyoming MI 19 256 138
Cleveland-Elyria-Mentor OH 33 92 73 Fresno CA 17 296 308
19
Table 1. Knowledge complexity index of the 100 largest MSAs (1975-2010)
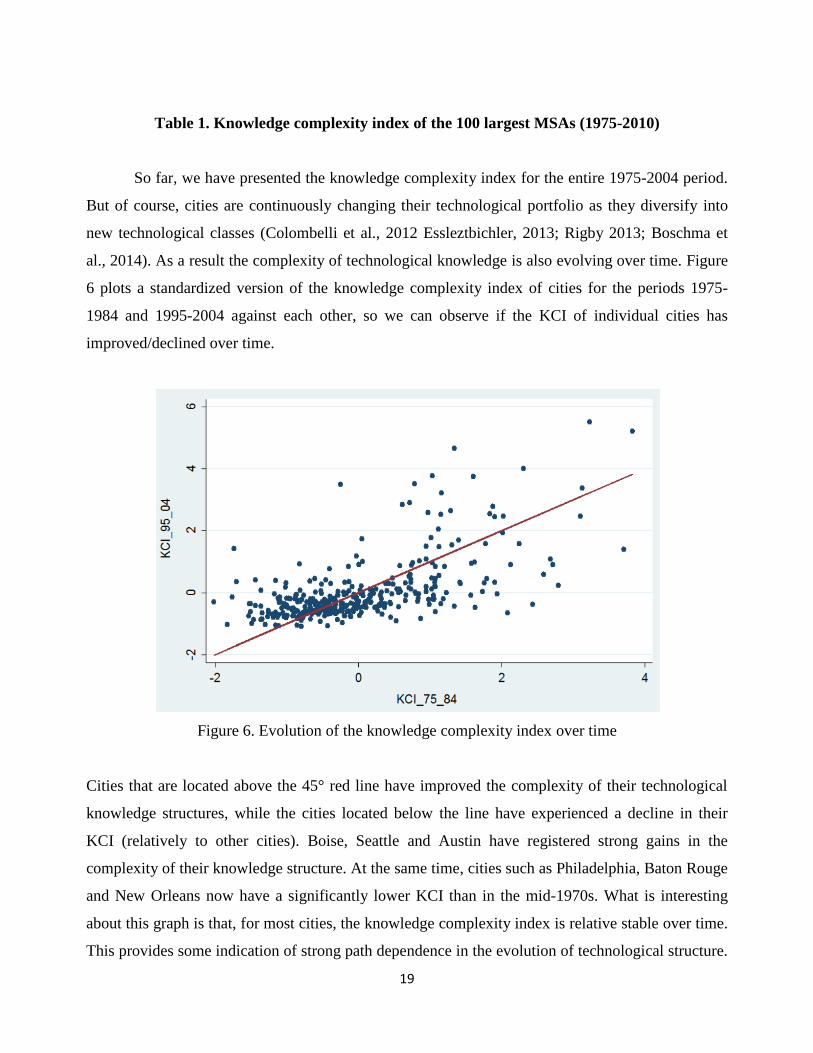
So far, we have presented the knowledge complexity index for the entire 1975-2004 period.
But of course, cities are continuously changing their technological portfolio as they diversify into
new technological classes (Colombelli et al., 2012 Essleztbichler, 2013; Rigby 2013; Boschma et
al., 2014). As a result the complexity of technological knowledge is also evolving over time. Figure
6 plots a standardized version of the knowledge complexity index of cities for the periods 1975-
1984 and 1995-2004 against each other, so we can observe if the KCI of individual cities has
improved/declined over time.
Figure 6. Evolution of the knowledge complexity index over time
Cities that are located above the 45° red line have improved the complexity of their technological
knowledge structures, while the cities located below the line have experienced a decline in their
KCI (relatively to other cities). Boise, Seattle and Austin have registered strong gains in the
complexity of their knowledge structure. At the same time, cities such as Philadelphia, Baton Rouge
and New Orleans now have a significantly lower KCI than in the mid-1970s. What is interesting
about this graph is that, for most cities, the knowledge complexity index is relative stable over time.
This provides some indication of strong path dependence in the evolution of technological structure.
20
If we focus exclusively on newly added technological classes, a similar pattern emerges. The
average complexity of the newly added technological classes in a city, from one period to the next,
is strongly correlated to lagged KCI. These data support the arguments about knowledge
development being a cumulative process of recombining existing skills and competencies.
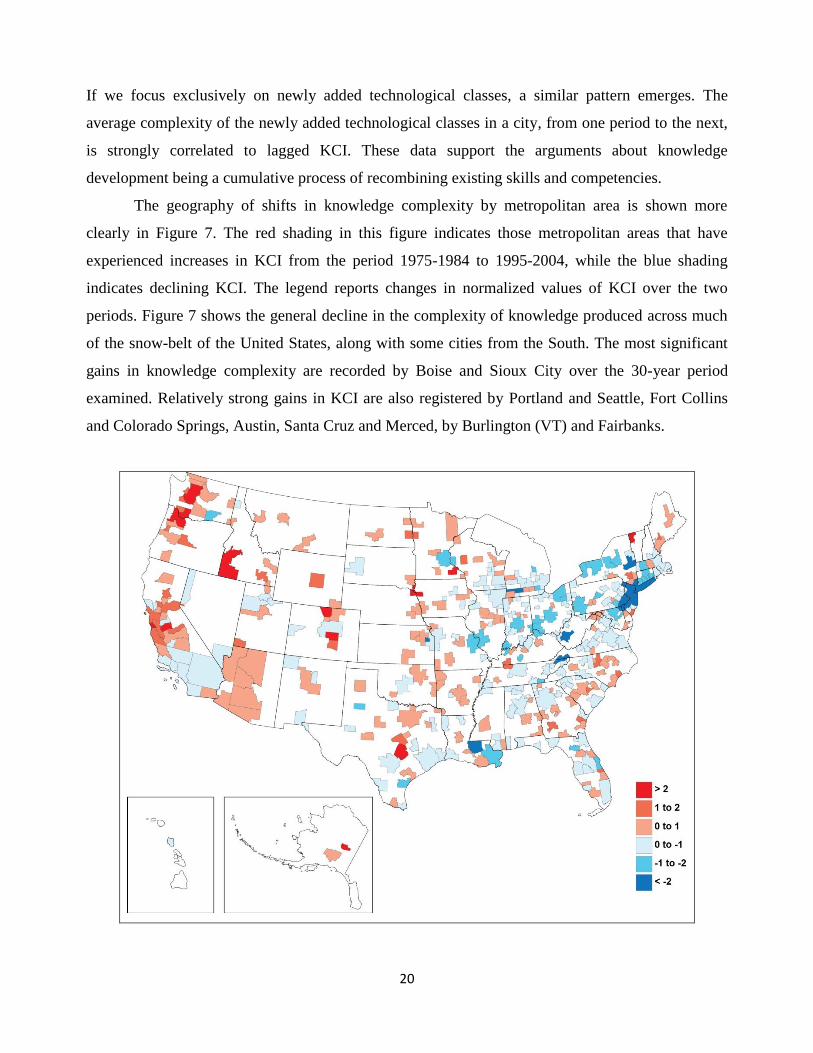
The geography of shifts in knowledge complexity by metropolitan area is shown more
clearly in Figure 7. The red shading in this figure indicates those metropolitan areas that have
experienced increases in KCI from the period 1975-1984 to 1995-2004, while the blue shading
indicates declining KCI. The legend reports changes in normalized values of KCI over the two
periods. Figure 7 shows the general decline in the complexity of knowledge produced across much
of the snow-belt of the United States, along with some cities from the South. The most significant
gains in knowledge complexity are recorded by Boise and Sioux City over the 30-year period
examined. Relatively strong gains in KCI are also registered by Portland and Seattle, Fort Collins
and Colorado Springs, Austin, Santa Cruz and Merced, by Burlington (VT) and Fairbanks.
21
Figure 7: Changes in KCI 1975-1984 to 1995-2004
The largest declines in KCI are registered by Kalamazoo, Charleston (WV), Philadelphia and
Trenton-Ewing, Kingsport-Bristol (TN-VA), Albany and New York City, Lawrence and Baton
Rouge.
6. Conclusion and discussion
Knowledge is an increasingly critical dimension of competitive advantage. While past work has
explored the geography of patenting, this work largely treats individual patents as homogeneous,
assuming that each patent adds only as much technological potential to a region’s economy as the
next. However, not all patents hold the same value. Recent work has shown how the knowledge
cores of countries and regions might be differentiated using patent data and measures of the
technological relatedness between patents in different classes. In this paper we extend the method of
reflections of Hidalgo and Hausmann (2009) to generate measures of the knowledge complexity of
patents generated across U.S. metropolitan areas since 1975.
Our analysis reveals that there are wide geographical variations in knowledge complexity,
with only a few metro regions producing the most complex new technologies at any one time. There
is considerable rank stability in the positions of most cities in terms of the complexity of knowledge
embodied in patents across the five-year periods that we examined. However, many snow-belt
cities, and cities in the South, have witnessed a slow decline in the complexity of the knowledge
that they are producing. Across a number of metropolitan areas in the West, and a few selected
cities in the East, the complexity of knowledge produced has generally increased over the last thirty
years or so. These shifts in knowledge complexity are connected to cross-sectional differences in
gross metropolitan product per capita and thus to average income levels, as well as to rates of
economic growth.
The cities producing the most complex new technologies appear to be capturing a growing
share of all new knowledge generated within the United States. There is evidence that networks of
inventors across the U.S. are being reconfigured and growing in density around the complex
knowledge hubs that we identify. Of course, not all knowledge is spatially sticky. Low complexity,
more routinized, forms of knowledge are still being produced across many U.S. metropolitan areas.
However, the development of low complexity knowledge is increasingly footloose and provides an
22
insecure foundation of competitive advantage. Much more work remains to be done on these issues
and what they imply for the future of U.S. cities.
References
Abernathy, W. and K. Clark 1985. Innovation: Mapping the winds of creative destruction. Research
Policy 14: 3-22.
Allesina, S. and S. Tang 2012. Stability criteria for complex ecosystems. Nature 483: 205-208.
Almeida, P. 1996. Knowledge sourcing by foreign multinationals: Patent citation analysis in the
U.S. semiconductor industry. Strategic Management Journal 17: 155-165.
Antonelli, C. 2005. Models of knowledge and systems of governance. Journal of Institutional
Economics 1: 51-73.
Asheim, B. and M. Gertler 2005. The geography of innovation: Regional innovation systems, in
Fagerberg, J., Mowery, D. and R. Nelson (eds.) The Oxford Handbook of Innovation. Oxford:
Oxford University Press.
Asheim, B. and L. Coenen 2005. Knowledge bases and regional innovation systems: Comparing
Nordic clusters. Research Policy 34: 1173-1190.
Atkinson, A. and J. Stiglitz 1969. A new view of technical change. Economic Journal 79: 573-578.
Audretsch, D. and M. Feldman 1996. R&D spillovers and the geography of innovation and
production. American Economic Review 86: 630-640.
Balland, P.A. (2012) Proximity and the Evolution of Collaboration Networks: Evidence from
Research and Development Projects within the Global Navigation Satellite System (GNSS)
Industry, Regional Studies 46: 741-756.
Boschma, R., Balland, P.A. and D. Kogler 2014. Relatedness and technological change in cities:
The rise and fall of technological knowledge in U.S. metropolitan areas from 1981 to 2010.
Industrial and Corporate Change DOI:10.1093/icc/dtu012.
Barabási, A. and R. Albert 1999. Emergence of scaling in random networks. Science 286: 509-512.
Bathelt, H., Malmberg, A. and P. Maskell 2004. Clusters and knowledge: Local buzz, global
pipelines and the process of knowledge creation. Progress in Human Geography 28: 131-156.
Binswanger, H. 1974. A microeconomic approach to induced innovation. The Economic Journal
84: 940-958.
Borgatti, S. 2009. 2-Mode concepts in social network analysi. In R.A. Meyers (Ed.) Encyclopedia of
Complexity and System Science. Springer, pp. 8279-8291.
Boschma, R. 2005. Proximity and innovation: A critical assessment. Regional Studies 39: 61-74.
23
Boschma, R. and K. Frenken 2007. A theoretical framework for evolutionary economic geography:
Industrial dynamics and urban growth as a branching process. Journal of Economic Geography 7:
635-649.
Breschi, S., Lissoni, F., and F. Malerba 2003. Knowledge-relatedness in firm technological
diversification. Research Policy 32: 69-87.
Caldarelli, G., Cristelli, M., Gabrielli, A., Pietronero, L., Scala, A. and A. Tacchella 2012. A
network analysis of countries’ export flows: Firm grounds for the building blocks of the economy.
Plos One 7: 1-11.
Cantwell, J. and C. Piscitello 2002. The location of technological activities of MNCs in European
regions: The role of spillovers and local competencies. Journal of International Management 8: 69-
96.
Castaldi, C., Frenken, K. and B. Los 2013. Related variety, unrelated variety and technological
breakthroughs: An analysis of U.S. state-level patenting. Papers in Evolutionary Economic
Geography #13.02. Utrecht University.
Christensen, C. 1997. The Innovator’s Dilemma. Boston: Harvard Business School Press.
Chung, W. and J. Alcacer 2002. Knowledge seeking and location choice of foreign direct
investment in the United States. Management Science 48: 1534-1554.
Cohen, W. and D. Levinthal 1990. Absorptive capacity: A new perspective on learning and
innovation. Administrative Science Quarterly 35: 128-152.
Colombelli, A., Krafft, J. and F. Quatraro 2012. The emergence of new technology-based sectors at
the regional level: A proximity-based analysis of nanotechnology. Papers in Evolutionary
Economic Geography #12.11, Utrecht University.
Corrado, C. and C. Hulten 2010. How do you measure a “technological revolution”? American
Economic Review 100: 99-104.
Cyert, R. and J. March 1963. A Behavioral Theory of the Firm. Englewood Cliffs, NJ: Prentice-
Hall.
David, P. 1975. Technical Choice, Innovation and Economic Growth. Cambridge, MA: Cambridge
University Press.
Davis, A., Gardner, B. and M. Gardner 1941. Deep South. Chicago: University of Chicago Press.
Dosi, G. 1982. Technological paradigms and technological trajectories: A suggested interpretation
of the determinants and directions of technical change, Research Policy 11: 147-162.
Dunning J. 2002. Regions, Globalization and the Knowledge-Based Economy. Oxford: Oxford
University Press.
24
Dicken, P. 2007. Global Shift: Mapping the Changing Contours of the World Economy. Newbury
Park: Sage.
Ejermo, O. 2009. Regional innovation measured by patent data – does quality matter? Industry and
Innovation 16: 141-165.
Ellison, G. and E. Glaeser 1999. The geographic concentration of industry: Does natural advantage
explain agglomeration? American Economic Review 89: 311-316.
Essletzbichler, J. and D. Rigby 2007. Exploring Evolutionary Economic Geographies. Journal of
Economic Geography 7: 549-571.
Evenson, R. and Y. Kislev 1976. A stochastic model of applied research, Journal of Political
Economy 84: 265-282.
Feldman, M., Kogler, D. and D. Rigby 2014. rKnowledge: The spatial diffusion of rDNA
techniques. Regional Studies
Fischer, M., Scherngell, T. and E. Jansnerger 2006. The geography of knowledge spillovers
between high-technology firms in Europe: Evidence from a spatial interaction modeling
perspective. Geographical Analysis 38: 288-309.
Fleming, L. and O. Sorenson 2001. Technology as a complex adaptive system: Evidence from
patent data. Research Policy 30: 1019-1039.
Gertler, M. 1995. Being there: Proximity, organization and culture in the development and adoption
of advanced manufacturing technologies. Economic Geography 71: 1-26.
Gertler, M. 2003. Tacit knowledge and the economic geography of context, or the undefinable
tacitness of being (there). Journal of Economic Geography 3: 75-99.
Grabher, G. 1993. The weakness of strong ties: The lock-in of regional development in the Ruhr
area, in Grabher , G. (ed.) The Embedded Firm: On the Socioeconomics of Industrial Networks.
London: Routledge , pp 255-277.
Graff, H. 2006. Networks in the Innovation Process. Cheltenham, UK: Edward Elgar.
Griliches, Z. 1990. Patent statistics as economic indicators: a survey. Journal of Economic
Literature 28: 1661-1707.
Hall, B., Jaffe, A. and M. Trajtenberg 2005. Market value and patent citations. The RAND Journal
of Economics 36: 16-38.
Harhoff , D., Narin, F., Scherer, F. and K. Vopel 1999. Citation frequency and the value of patended
inventions. The Review of Economics and Statistics 81: 511-515.
Harhoff, D., Schere, F. and K. Vopel 2003. Citations, family size, opposition and the value of patent
rights. Research Policy 32: 1343-1363.
25
Hidalgo, C., Klinger, B., Barabassi, A. and R. Hausmann 2007. The product space conditions the
development of nations. Science 27: 482-487.
Hidalgo, C. and R. Hausmann 2009. The building blocks of economic complexity. Proceedings of
the National Academy of Sciences 106: 10570-10575.
Jaffe, A., Trajtenberg, M., and R. Henderson 1993. Geographical localization of knowledge
spillovers as evidenced by patent citations. Quarterly Journal of Economics 108: 577-598.
Kauffman, S. 1993. The Origins of Order. New York: Oxford University Press.
Kogler, D., Rigby, D. and I. Tucker 2013. Mapping knowledge space and technological relatedness
in U.S. cities. European Planning Studies 21: 1374-1391.
Kogut, B. and U. Zander 1992. Knowledge of the firm, combinative capabilities, and the replication
of technology. Organization Science 3: 383-397.
Lanjouw, J. and M. Schankerman 2004. Patent quality and research productivity: Measuring
innovation with multiple indicators. The Economic Journal 114: 441-465.
Lawson, C. and E. Lorenz 1999. Collective learning, tacit knowledge and regional innovative
capacity. Regional Studies 33: 305-317.
Lerner, J. 1994. The importance of patent scope: An empirical analysis. The RAND Journal of
Economics 25: 319-333.
Levinthal, D. 1997. Adaptation on rugged landscapes. Management Science 43: 934-950.
Lundvall, B. and B. Johnson 1994. The learning economy. Journal of Industry Studies 1: 23-42.
Marshall, A. 1920. Principles of Economics. London: Macmillan.
Maskell, P. and A. Malmberg 1999. The competitiveness of firms and regions: ‘ubiquitification’
and the importance of localized learning. European Urban and Regional Planning Studies 6: 9-25.
Neffke, F. 2009. Productive Places: The Influence of Technical Change and Relatedness on
Agglomeration Externalities. PhD Thesis. Utrecht University, Utrecht.
Nelson, R. and S. Winter 1982. An Evolutionary Theory of Economic Change. Cambridge, MA:
Harvard University Press.
Nickerson, J. and T. Zenger 2004. A knowledge-based theory of the firm – the problem-solving
perspective. Organization Science 15: 617-632.
Nickerson, J. Silverman, B. and T. Zenger 2007. The ‘problem’ of creating and capturing value.
Strategic Organization 5: 211-225.
Olsson, O. and B. Frey 2002. Entrepreneurship as recombinant growth. Small Business Economics
19: 69-80.
26
Opsahl, T. 2013. Triadic closure in two-mode networks: Redefining the global and local clustering
coefficients. Social Networks 35: 159-167.
Pavitt, K. 1982. R&D, patenting and innovative activities: A statistical exploration. Research Policy
11: 33-51.
Polanyi, M. 1966. The Tacit Dimension. New York: Doubleday.
Rigby, D. 2013. Technological relatedness and knowledge space: Entry and exit of U.S. cities from
knowledge space. Regional Studies DOI=10.1080/00343404.2013.854878.
Rigby, D. and J. Essletzbichler 1997. Evolution, process variety, and regional trajectories of
technological change. Economic Geography 73: 269-284.
Rigby, D. and J. Essletzbichler 2006. Technological variety, technological change and a geography
of production techniques. Journal of Economic Geography 6: 45-70.
Rivkin, J. 2000. Imitation of complex strategies. Management Science 46: 824-844.
Robins, G. and M. Alexander 2004. Small worlds among interlocking directors: Network structure
and distance in bipartite graphs. Computational and Mathematical Organization Theory 10: 69–94.
Romer, P. 1990. Endogenous technological change. Journal of Political Economy 98: S71-S102.
Sahal, D. 1981. Patterns of Technological Innovation. Reading, MA: Addison Wesley.
Saxenian, A. 1994. Regional Advantage: Culture and Competition in Silicon Valley and Route 128.
Cambridge, MA: Harvard University Press.
Schoenmakers, W. and G. Duysters 2010. The technological origins of radical inventions. Research
Policy 39: 1051-1059.
Scott, A. 1996. Regional motors of the global economy. Futures 28: 391-411.
Schumpeter, J. 1942. Capitalism, Socialism, and Democracy. New York: Harper and Row.
Simon, H. 1962. The architecture of complexity. Proceedings of the American Philosophical
Society 106: 467-482.
Singh, J. 2005. Collaborative networks as determinants of knowledge diffusion patterns.
Management Science 51: 756-770.
Singh, J. 2008. Distributed R&D, cross-regional knowledge integration and quality of innovative
output. Research Policy 37: 77-96.
Solow, R. 1956. A contribution to the theory of economic growth. Quarterly Journal of Economics
66: 65-94.
27
Sorenson, O. 2005. Social networks, informational complexity and industrial geography. In
Audretsch, D., Fornahl, D. and C. Zellner (eds.) The Role of Labour Mobility and Informal
Networks for Knowledge Transfer. New York: Springer, pp. 79-95.
Storper, M. 1993. Regional “Worlds” of production: Learning and innovation in the technology
districts of France, Italy and the USA. Regional Studies 27: 433-455.
Storper, M. 1995. The resurgence of regional economies, ten years later: The region as a nexus of
untraded interdependencies. European Urban and Regional Studies 2: 191-221.
Storper, M. 1997. The Regional World: Territorial Development in a Global Economy. New York:
Guilford.
Strumsky, D., Lobo, J. and S. van der Leeuw 2012. Using patent technology codes to study
technological change. Economics of Innovation and New Technology 21: 267-286.
Stuart, T. and J. Podolny 1996. Local search and the evolution of technological capabilities.
Strategic Management Journal 17: 21-38.
Tacchella, A., Cristelli, M., Caldarelli, G., Gabrielli, A. and L. Pietronero, 2012. A new metrics for
countries’ fitness and products’ complexity. Nature Scientific Reports 2: 1-7.
Tallman, S., Jenkins, M., Henry, N. and S. Pinch 2004. Knowledge clusters and competitive
advantage. Academy of Management Review 29: 258-271.
Teece, D., Rumelt, R., Dosi G. and S. Winter 1994. Understanding corporate coherence: theory and
evidence. Journal of Economic Behavior and Organization 23: 1-30.
Todtling, F. Lengauer, L. and C. Hoglinger 2011. Knowledge sourcing and innovation in “Thick”
and “Thin” regional innovation systems – comparing ICT firms in two Austrian regions. European
Planning Studies 19: 1245-1276.
Trajtenberg, M. 1990. A penny for your quotes: Patent citations and the value of innovations. The
RAND Journal of Economics 21: 172-187.
Trippl, M., Todtling, F. and L. Lengauer 2009. Knowledge sourcing beyond buzz and pipelines:
Evidence from the Vienna software sector. Economic Geography 85: 443-462.
Verspagen, B. 2007. Mapping technological trajectories as patent citation networks: A study on the
history of fuel cell research. Advances in Complex Systems 10: 93-115.
Von Hippel, E. 1988. The Sources of Innovation. Oxford: Oxford University Press.
Weitzman, M. 1998. Recombinant growth. The Quarterly Journal of Economics 2: 331-360.
28
Appendix
MSA State KCI
Rank
(KCI) Rank (patents)
San Jose-Sunnyvale-Santa Clara CA 99 1 1
Austin-Round Rock-San Marcos TX 94 2 10
Poughkeepsie-Newburgh-Middletown NY 78 3 12
San Francisco-Oakland-Fremont CA 77 4 19
Boston-Cambridge-Quincy MA 73 5 31
Rochester MN 73 6 11
Burlington-South Burlington VT 68 7 8
Trenton-Ewing NJ 65 8 5
Colorado Springs CO 64 9 75
Portland-Vancouver-Hillsboro OR 64 10 47
Raleigh-Cary NC 62 11 25
Binghamton NY 62 12 24
Dallas-Fort Worth-Arlington TX 61 13 82
Fort Collins-Loveland CO 61 14 7
Boulder CO 61 15 6
Durham-Chapel Hill NC 60 16 44
Washington-Arlington-Alexandria DC 58 17 134
New York-Northern New Jersey-Long Island NY 58 18 80
San Diego-Carlsbad-San Marcos CA 58 19 29
Rochester NY 57 20 4
Boise City-Nampa ID 57 21 3
Kingston NY 57 22 43
Santa Cruz-Watsonville CA 57 23 14
Seattle-Tacoma-Bellevue WA 56 24 51
Corvallis OR 55 25 2
Albany-Schenectady-Troy NY 53 26 17
Manchester-Nashua NH 53 27 28
Phoenix-Mesa-Glendale AZ 52 28 66
Ithaca NY 51 29 15
Greeley CO 50 30 9
Worcester MA 50 31 41
Philadelphia-Camden-Wilmington PA 50 32 62
Tucson AZ 50 33 61
29
Palm Bay-Melbourne-Titusville FL 48 34 18
Cedar Rapids IA 48 35 56
Huntsville AL 47 36 71
Kokomo IN 47 37 50
Champaign-Urbana IL 46 38 98
Oxnard-Thousand Oaks-Ventura CA 46 39 22
Bridgeport-Stamford-Norwalk CT 45 40 16
Albuquerque NM 45 41 111
Allentown-Bethlehem-Easton PA 44 42 42
Santa Barbara-Santa Maria-Goleta CA 43 43 35
Indianapolis-Carmel IN 42 44 85
Sacramento-Arden-Arcade-Roseville CA 42 45 146
Los Angeles-Long Beach-Santa Ana CA 42 46 76
Sherman-Denison TX 42 47 140
New Haven-Milford CT 42 48 37
Charlottesville VA 41 49 104
Lexington-Fayette KY 41 50 101
Lawrence KS 40 51 107
Baltimore-Towson MD 40 52 128
Houston-Sugar Land-Baytown TX 40 53 53
Norwich-New London CT 40 54 34
State College PA 40 55 86
Miami-Fort Lauderdale-Pompano Beach FL 39 56 136
Provo-Orem UT 39 57 68
Gainesville FL 39 58 65
Eau Claire WI 39 59 154
Blacksburg-Christiansburg-Radford VA 38 60 84
Ann Arbor MI 38 61 13
Santa Rosa-Petaluma CA 38 62 63
Iowa City IA 37 63 114
Knoxville TN 37 64 109
College Station-Bryan TX 37 65 117
Syracuse NY 37 66 96
Lynchburg VA 37 67 130
Pittsburgh PA 36 68 64
Pocatello ID 36 69 209
Minneapolis-St. Paul-Bloomington MN 36 70 30
Kennewick-Pasco-Richland WA 36 71 60
Ames IA 36 72 23
Salt Lake City UT 35 73 89
Chicago-Joliet-Naperville IL 35 74 72
Las Cruces NM 35 75 224
Utica-Rome NY 35 76 223
Santa Fe NM 35 77 120
30
Kalamazoo-Portage MI 34 78 32
Atlanta-Sandy Springs-Marietta GA 34 79 143
Charleston WV 34 80 150
Madison WI 34 81 69
Salinas CA 34 82 207
Lancaster PA 34 83 33
Kingsport-Bristol-Bristol TN 34 84 59
Hartford-West Hartford-East Hartford CT 34 85 54
Lafayette IN 34 86 57
Ocean City NJ 34 87 279
Dayton OH 34 88 70
Baton Rouge LA 33 89 110
Cincinnati-Middletown OH 33 90 55
St. Louis MO 33 91 124
Cleveland-Elyria-Mentor OH 33 92 73
Elmira NY 33 93 21
Providence-New Bedford-Fall River RI 33 94 113
Johnson City TN 32 95 193
Orlando-Kissimmee-Sanford FL 32 96 264
Denver-Aurora-Broomfield CO 32 97 119
Roanoke VA 32 98 177
Tuscaloosa AL 32 99 321
Akron OH 32 100 27
Reading PA 32 101 125
Pittsfield MA 31 102 81
San Antonio-New Braunfels TX 31 103 233
Ogden-Clearfield UT 31 104 87
Athens-Clarke County GA 31 105 149
Columbus OH 31 106 126
El Paso TX 31 107 317
Buffalo-Niagara Falls NY 31 108 93
Honolulu HI 31 109 325
Hattiesburg MS 30 110 296
Portland-South Portland-Biddeford ME 30 111 172
Bloomington IN 30 112 170
Reno-Sparks NV 30 113 94
Harrisburg-Carlisle PA 30 114 118
Springfield MA 29 115 139
El Centro CA 29 116 215
Tampa-St. Petersburg-Clearwater FL 29 117 178
Bremerton-Silverdale WA 29 118 157
Crestview-Fort Walton Beach-Destin FL 29 119 314
Lebanon PA 29 120 158
Sebastian-Vero Beach FL 29 121 156
31
Morgantown WV 29 122 165
Columbia SC 29 123 253
Richmond VA 29 124 179
Lubbock TX 29 125 230
Stockton CA 28 126 244
Spokane WA 28 127 202
Virginia Beach-Norfolk-Newport News VA 28 128 277
Bakersfield-Delano CA 28 129 173
Evansville IN 28 130 116
Kansas City MO 28 131 196
Olympia WA 28 132 238
Idaho Falls ID 27 133 67
Decatur AL 27 134 222
Milwaukee-Waukesha-West Allis WI 27 135 83
South Bend-Mishawaka IN 27 136 78
Killeen-Temple-Fort Hood TX 27 137 345
Harrisonburg VA 27 138 327
Eugene-Springfield OR 27 139 127
Modesto CA 27 140 201
Charlotte-Gastonia-Rock Hill NC 27 141 183
New Orleans-Metairie-Kenner LA 27 142 243
Columbia MO 27 143 180
Cumberland MD 26 144 312
Greensboro-High Point NC 26 145 198
Bend OR 26 146 95
Auburn-Opelika AL 26 147 153
Barnstable Town MA 26 148 108
Tallahassee FL 26 149 261
Detroit-Warren-Livonia MI 26 150 45
Riverside-San Bernardino-Ontario CA 26 151 167
Jacksonville FL 26 152 270
Lansing-East Lansing MI 26 153 181
Salem OR 26 154 219
Burlington NC 26 155 218
Scranton-Wilkes-Barre PA 26 156 249
Birmingham-Hoover AL 26 157 298
Vallejo-Fairfield CA 25 158 199
Toledo OH 25 159 91
Las Vegas-Paradise NV 25 160 247
Oklahoma City OK 25 161 211
Danville IL 25 162 248
York-Hanover PA 25 163 115
Charleston-North Charleston-Summerville SC 25 164 240
Manhattan KS 25 165 254
32
Terre Haute IN 25 166 225
Niles-Benton Harbor MI 25 167 52
San Luis Obispo-Paso Robles CA 25 168 106
Mobile AL 25 169 295
Danville VA 25 170 351
Napa CA 25 171 164
Fort Wayne IN 25 172 92
Wichita KS 25 173 187
Spartanburg SC 25 174 36
Asheville NC 24 175 133
Memphis TN 24 176 245
Panama City-Lynn Haven-Panama City Beach FL 24 177 169
Logan UT 24 178 46
Nashville-Davidson-Murfreesboro-Franklin TN 24 179 259
Deltona-Daytona Beach-Ormond Beach FL 24 180 190
Greenville-Mauldin-Easley SC 24 181 162
Little Rock-North Little Rock-Conway AR 24 182 309
Lincoln NE 24 183 166
Winston-Salem NC 23 184 144
Springfield OH 23 185 189
Elkhart-Goshen IN 23 186 103
Wheeling WV 23 187 297
Carson City NV 23 188 77
Wilmington NC 23 189 176
Coeur d'Alene ID 23 190 186
Appleton WI 23 191 38
Bellingham WA 23 192 105
Corpus Christi TX 23 193.5 242
Bowling Green KY 23 193.5 311
Canton-Massillon OH 23 195 100
Williamsport PA 23 196 102
Pueblo CO 23 197 322
Omaha-Council Bluffs NE 22 198 257
Hagerstown-Martinsburg MD 22 199 301
Bay City MI 22 200 79
Holland-Grand Haven MI 22 201 20
Dover DE 22 202 287
Peoria IL 22 203 39
Rockford IL 22 204 58
North Port-Bradenton-Sarasota FL 22 205 135
Hot Springs AR 22 206 310
Tulsa OK 22 207 122
Bangor ME 22 208 340
Louisville-Jefferson County KY 22 209 197
33
Savannah GA 22 210 323
Beaumont-Port Arthur TX 22 211 237
Hickory-Lenoir-Morganton NC 22 212 204
Augusta-Richmond County GA 22 213 282
Fairbanks AK 22 214 331
Cleveland TN 22 215.5 121
Huntington-Ashland WV 22 215.5 251
Erie PA 22 217 90
Parkersburg-Marietta-Vienna WV 22 218 141
Anderson IN 21 219 123
Jackson MS 21 220 341
Ocala FL 21 221 235
Gainesville GA 21 222 205
Fayetteville-Springdale-Rogers AR 21 223 252
Muncie IN 21 224 231
Lewiston-Auburn ME 21 225 294
Sioux Falls SD 21 226 281
Vineland-Millville-Bridgeton NJ 21 227 292
Youngstown-Warren-Boardman OH 21 228 200
Pensacola-Ferry Pass-Brent FL 21 229 234
Cape Girardeau-Jackson MO 21 230 246
Rapid City SD 21 231 305
Flagstaff AZ 20 232 151
Springfield IL 20 233 250
Chattanooga TN 20 234 226
Amarillo TX 20 235 303
Sioux City IA 20 236 210
Atlantic City-Hammonton NJ 20 237 320
Naples-Marco Island FL 20 238 148
Lake Charles LA 20 239 289
Redding CA 20 240 216
Merced CA 20 241 343
Glens Falls NY 20 242 99
Gadsden AL 20 243 354
Anderson SC 20 244 174
Lakeland-Winter Haven FL 20 245 236
La Crosse WI 20 246 192
Anniston-Oxford AL 20 247 356
Sumter SC 20 248 352
Racine WI 20 249 40
Port St. Lucie FL 19 250 112
Prescott AZ 19 251 147
Kankakee-Bradley IL 19 252 213
Waco TX 19 253 313
34
Des Moines-West Des Moines IA 19 254 155
Mansfield OH 19 255 229
Grand Rapids-Wyoming MI 19 256 138
Lima OH 19 257 293
Greenville NC 19 258 263
Chico CA 19 259 239
Davenport-Moline-Rock Island IA 19 260 160
Medford OR 19 261 195
Columbus GA 19 262 350
Altoona PA 19 263 307
Montgomery AL 19 264 339
Flint MI 19 265 131
Topeka KS 19 266 336
Grand Junction CO 19 267 185
Florence SC 19 268 206
Myrtle Beach-North Myrtle Beach-Conway SC 19 269 329
Decatur IL 19 270 145
Rome GA 19 271 260
Mankato-North Mankato MN 19 272 194
Janesville WI 19 273 132
Macon GA 19 274 288
Florence-Muscle Shoals AL 19 275 203
Monroe MI 18 276 49
Missoula MT 18 277 232
Longview TX 18 278 175
Cape Coral-Fort Myers FL 18 279 191
Midland TX 18 280 171
Saginaw-Saginaw Township North MI 18 281 129
Cheyenne WY 18 282 318
Dalton GA 18 283 275
Morristown TN 18 284 255
Fond du Lac WI 18 285 88
Fargo ND 18 286 212
Steubenville-Weirton OH 18 287 274
Joplin MO 18 288 184
Oshkosh-Neenah WI 18 289 26
Valdosta GA 18 290 353
Gulfport-Biloxi MS 17 291 316
Elizabethtown KY 17 292 334
Dothan AL 17 293 347
Brownsville-Harlingen TX 17 294 360
Yuma AZ 17 295 332
Fresno CA 17 296 308
Owensboro KY 17 297 283
35
Bloomington-Normal IL 17 298 241
Columbus IN 17 299 48
Visalia-Porterville CA 17 300 324
Green Bay WI 17 301 208
Duluth MN 17 302 285
Yuba City CA 16 303 268
Longview WA 16 304 221
Punta Gorda FL 16 305 168
Lewiston ID 16 306 315
Muskegon-Norton Shores MI 16 307 137
McAllen-Edinburg-Mission TX 16 308 363
Springfield MO 16 309 217
Johnstown PA 16 310 306
Wichita Falls TX 16 311 269
Lake Havasu City-Kingman AZ 16 312 265
Jefferson City MO 16 313 338
Goldsboro NC 16 314 358
Odessa TX 16 315 188
St. George UT 16 316 220
Anchorage AK 16 317 280
St. Cloud MN 16 318 262
Lafayette LA 16 319 161
Tyler TX 15 320 258
Sandusky OH 15 321 142
Fayetteville NC 15 322 362
Grand Forks ND 15 323 284
Lawton OK 15 324 361
Jackson MI 15 325 97
Sheboygan WI 15 326 74
Hinesville-Fort Stewart GA 15 327 366
Winchester VA 15 328 266
Abilene TX 15 329 337
Albany GA 15 330 346
Shreveport-Bossier City LA 15 331 302
Warner Robins GA 15 332 355
Monroe LA 15 333 256
Great Falls MT 14 334 333
Madera-Chowchilla CA 14 335 271
Wausau WI 14 336 182
Pascagoula MS 14 337 330
St. Joseph MO 14 338 286
Laredo TX 14 339 364
Pine Bluff AR 13 340 357
Michigan City-La Porte IN 13 341 159
36
Jonesboro AR 13 342 304
Wenatchee-East Wenatchee WA 13 343 326
Billings MT 13 344 300
Farmington NM 13 345 276
Battle Creek MI 13 346 278
Salisbury MD 13 347 290
Waterloo-Cedar Falls IA 13 348 152
Victoria TX 13 349 335
Yakima WA 12 350 272
Fort Smith AR 12 351 319
Palm Coast FL 12 352 214
Rocky Mount NC 12 353 349
Hanford-Corcoran CA 12 354 359
Clarksville TN 12 355 344
Mount Vernon-Anacortes WA 12 356 273
Jacksonville NC 12 357 365
Jackson TN 11 358 227
Alexandria LA 11 359 328
Brunswick GA 11 360 299
Casper WY 11 361 291
Dubuque IA 10 362 163
San Angelo TX 10 363 348
Houma-Bayou Cane-Thibodaux LA 10 364 228
Bismarck ND 9 365 267
Texarkana TX 6 366 342
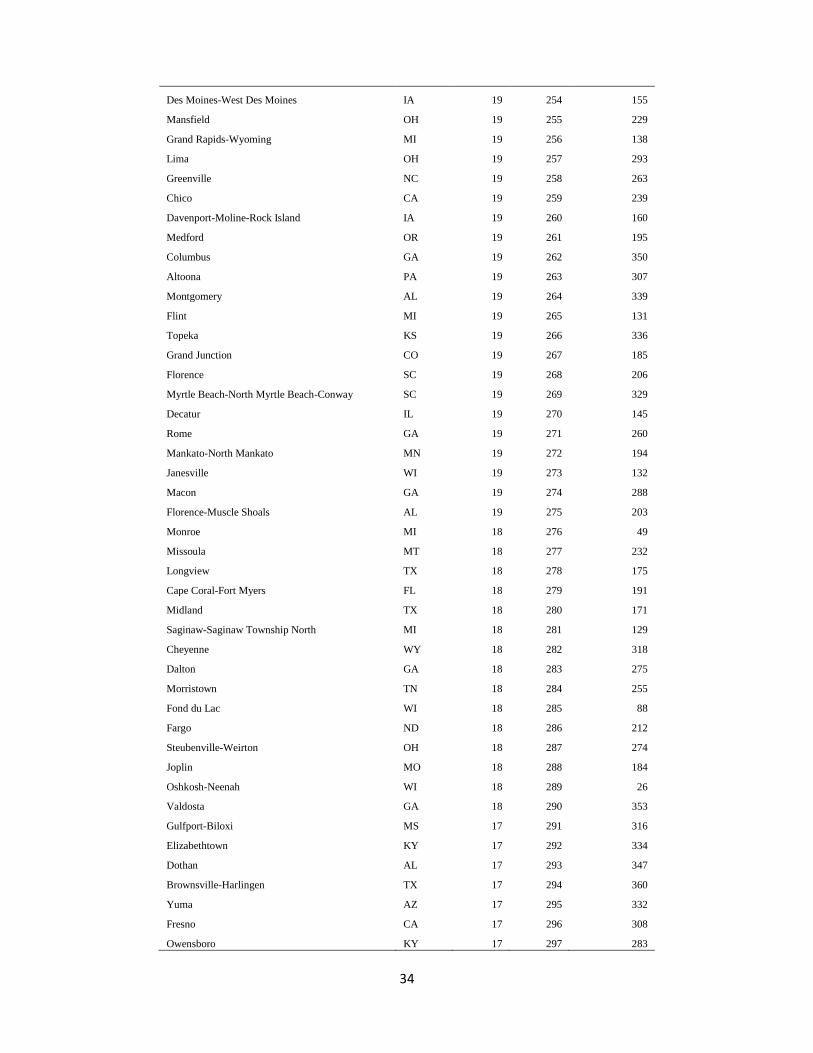
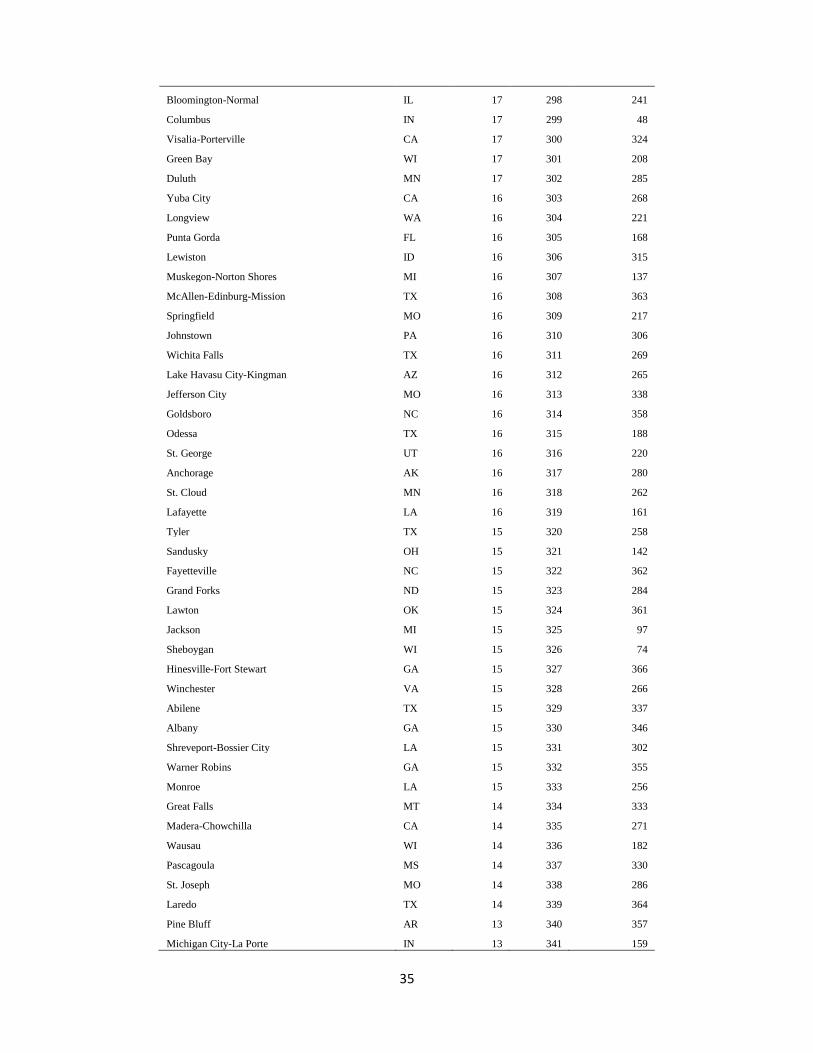
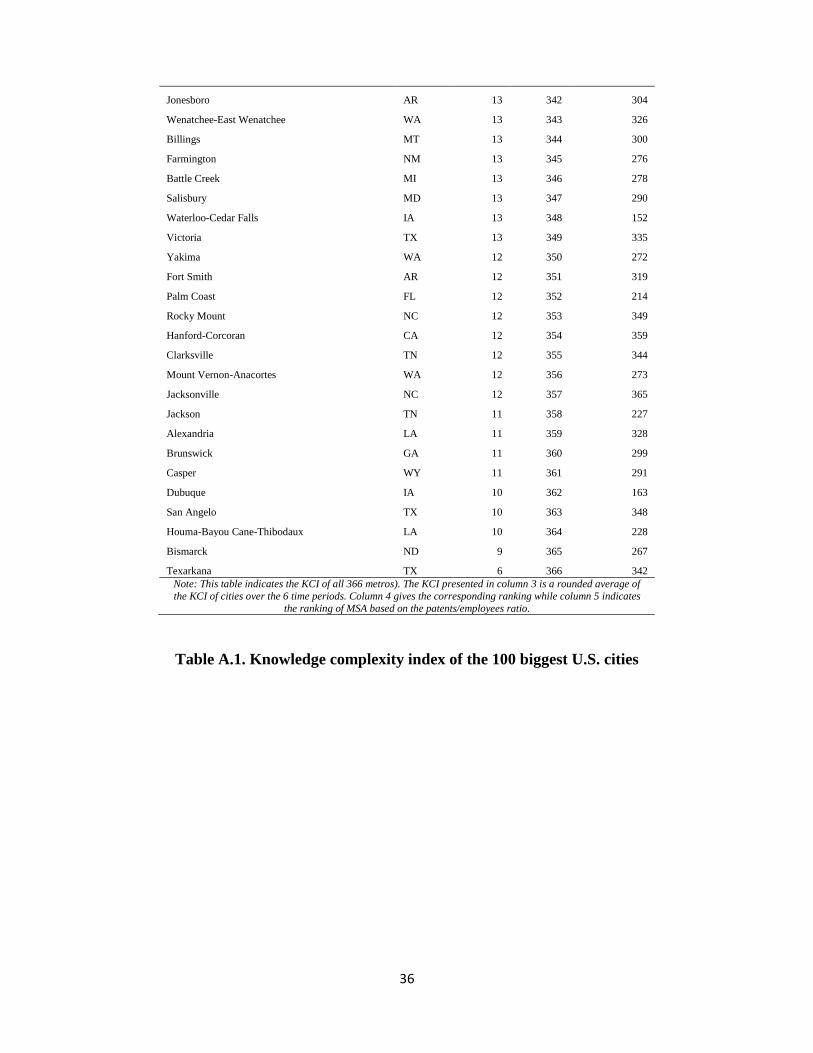
Note: This table indicates the KCI of all 366 metros). The KCI presented in column 3 is a rounded average of
the KCI of cities over the 6 time periods. Column 4 gives the corresponding ranking while column 5 indicates
the ranking of MSA based on the patents/employees ratio.
Table A.1. Knowledge complexity index of the 100 biggest U.S. cities