P2P6P10 Hcy Ctrl P2P6 P10 Ctrl Hcy Supplement Fig. I A B Suppl. Fig. I. Cell cycle and apoptotic...
6
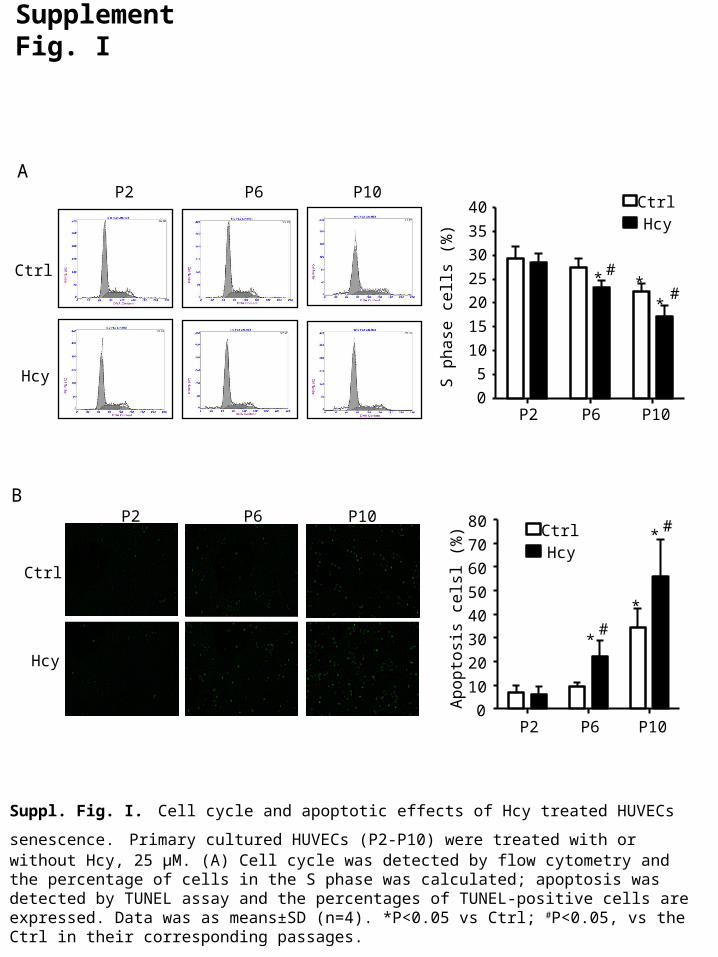
P2 P6 P10 Hcy Ctrl P2 P6 P10 Ctrl Hcy Supplement Fig. I A B Suppl. Fig. I. Cell cycle and apoptotic effects of Hcy treated HUVECs senescence. Primary cultured HUVECs (P2-P10) were treated with or without Hcy, 25 μM. (A) Cell cycle was detected by flow cytometry and the percentage of cells in the S phase was calculated; apoptosis was detected by TUNEL assay and the percentages of TUNEL-positive cells are expressed. Data was as means±SD (n=4). *P<0.05 vs Ctrl; # P<0.05, vs the Ctrl in their corresponding passages. 0 5 10 15 20 25 30 35 40 P2 P6 P10 Ctrl Hcy S phase cells (%) 0 10 20 30 40 50 60 70 P2 P6 P10 80 Apoptosis celsl (%) Ctrl Hcy * * * # # # # * * *
-
Upload
owen-edwards -
Category
Documents
-
view
217 -
download
0
Transcript of P2P6P10 Hcy Ctrl P2P6 P10 Ctrl Hcy Supplement Fig. I A B Suppl. Fig. I. Cell cycle and apoptotic...
P2 P6 P10
Hcy
Ctrl
P2 P6 P10
Ctrl
Hcy
Supplement Fig. I
A
B
Suppl. Fig. I. Cell cycle and apoptotic effects of Hcy treated HUVECs senescence. Primary cultured HUVECs (P2-P10) were treated with or without Hcy, 25 μM. (A) Cell cycle was detected by flow cytometry and the percentage of cells in the S phase was calculated; apoptosis was detected by TUNEL assay and the percentages of TUNEL-positive cells are expressed. Data was as means±SD (n=4). *P<0.05 vs Ctrl; #P<0.05, vs the Ctrl in their corresponding passages.
0
5
10
15
20
25
30
35
40
P2 P6 P10
CtrlHcy
S p
ha
se c
ells
(%
)
0
10
20
30
40
50
60
70
P2 P6 P10
80
Ap
op
tosi
s ce
lsl (
%)
CtrlHcy
* **
#
#
#
#
*
*
*
Supplement Fig. II
Ctr
l
FA
LA
R
Hcy
FA
+H
cy
LA
R+
Hcy
0
2
4
6
8
iNO
S m
RN
A e
xpre
ssio
n
A
0.0
0.5
1.0
1.5
2.0
Ctr
l
FA
LA
R
Hcy
FA
+H
cy
LA
R+
Hcy
2.5
eN
OS
mR
NA
exp
ress
ion
B
# #
**
**
# #
*
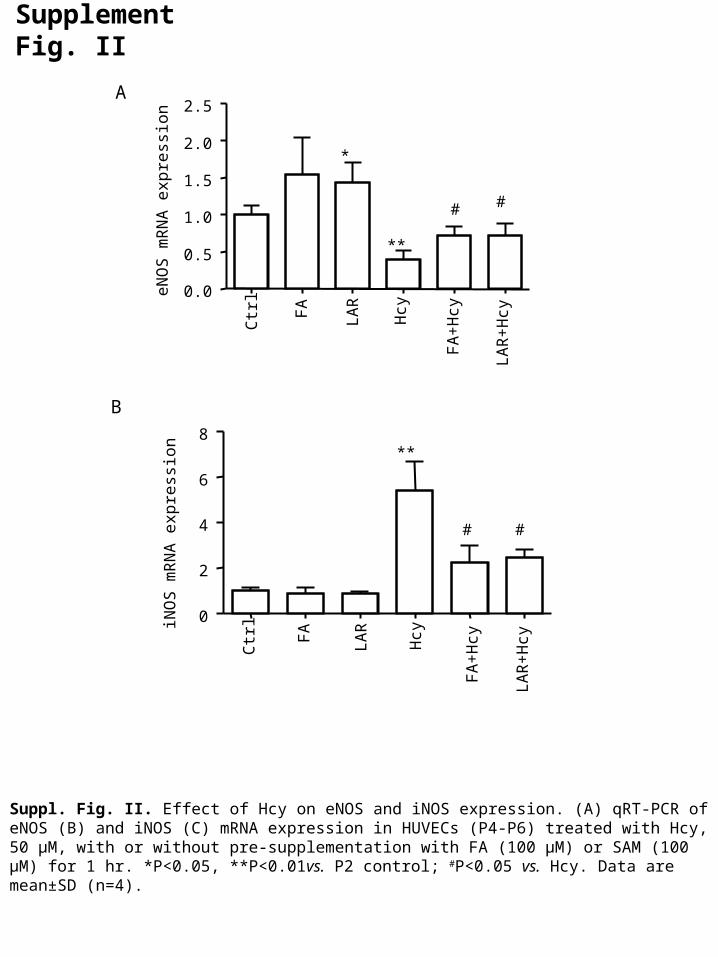
Suppl. Fig. II. Effect of Hcy on eNOS and iNOS expression. (A) qRT-PCR of eNOS (B) and iNOS (C) mRNA expression in HUVECs (P4-P6) treated with Hcy, 50 μM, with or without pre-supplementation with FA (100 μM) or SAM (100 μM) for 1 hr. *P<0.05, **P<0.01vs. P2 control; #P<0.05 vs. Hcy. Data are mean±SD (n=4).
Supplement Fig. III
C D
020406080
100
Ang II
M U5-azaM U
CtrlM U
HcyM UDM
E
(Fo
ld o
f co
ntr
ol)
**
Me
thyl
atio
n r
atio
(%)
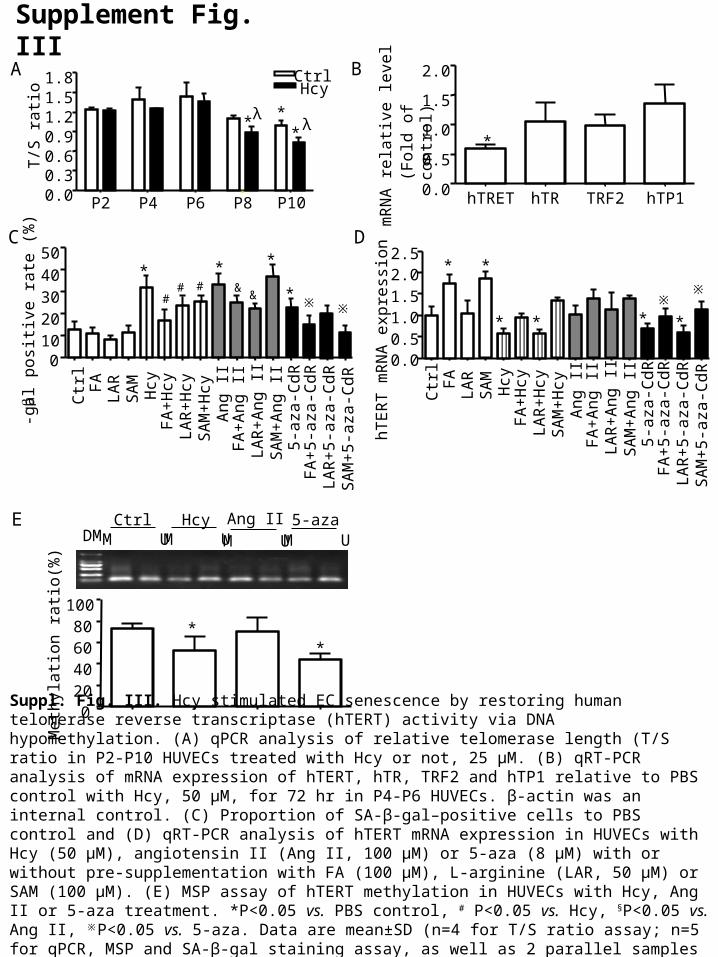
Suppl. Fig. III. Hcy stimulated EC senescence by restoring human telomerase reverse transcriptase (hTERT) activity via DNA hypomethylation. (A) qPCR analysis of relative telomerase length (T/S ratio in P2-P10 HUVECs treated with Hcy or not, 25 μM. (B) qRT-PCR analysis of mRNA expression of hTERT, hTR, TRF2 and hTP1 relative to PBS control with Hcy, 50 μM, for 72 hr in P4-P6 HUVECs. β-actin was an internal control. (C) Proportion of SA-β-gal–positive cells to PBS control and (D) qRT-PCR analysis of hTERT mRNA expression in HUVECs with Hcy (50 μM), angiotensin II (Ang II, 100 μM) or 5-aza (8 μM) with or without pre-supplementation with FA (100 μM), L-arginine (LAR, 50 μM) or SAM (100 μM). (E) MSP assay of hTERT methylation in HUVECs with Hcy, Ang II or 5-aza treatment. *P<0.05 vs. PBS control, # P<0.05 vs. Hcy, §P<0.05 vs. Ang II, ※P<0.05 vs. 5-aza. Data are mean±SD (n=4 for T/S ratio assay; n=5 for qPCR, MSP and SA-β-gal staining assay, as well as 2 parallel samples were measured each time).
A
hTRET hTR TRF2 hTP10.0
0.5
1.0
1.5
2.0
mR
NA
re
lativ
e le
vel
*
B
P2 P4 P6 P8 P100.00.30.60.91.21.51.8 Ctrl
T/S
ra
tio
**
*
Hcy
λλ
Ctr
lF
AL
AR
SA
MH
cyF
A+
Hcy
LA
R+
Hcy
SA
M+
Hcy
An
g I
IF
A+
An
g I
IL
AR
+A
ng
II
SA
M+
An
g I
I5
-aza
-Cd
RF
A+
5-a
za-C
dR
LA
R+
5-a
za-C
dR
SA
M+
5-a
za-C
dR
010203040
50
-g
al p
osi
tive
ra
te (
%)
* * *
*## # &
& ※ ※
hT
ER
T m
RN
A e
xpre
ssio
n0.00.51.01.52.02.5
※※
* * **
* *
Ctr
lF
AL
AR
SA
MH
cyF
A+
Hcy
LA
R+
Hcy
SA
M+
Hcy
An
g I
IF
A+
An
g I
IL
AR
+A
ng
II
SA
M+
An
g I
I5
-aza
-Cd
RF
A+
5-a
za-C
dR
LA
R+
5-a
za-C
dR
SA
M+
5-a
za-C
dR
Supplement Fig. IV
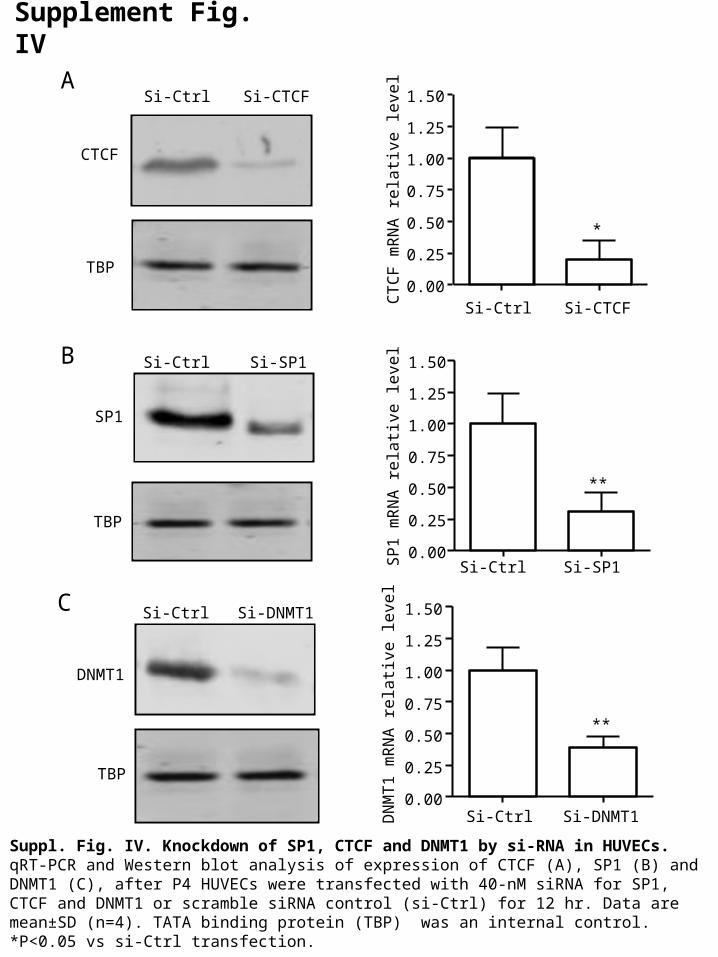
Suppl. Fig. IV. Knockdown of SP1, CTCF and DNMT1 by si-RNA in HUVECs. qRT-PCR and Western blot analysis of expression of CTCF (A), SP1 (B) and DNMT1 (C), after P4 HUVECs were transfected with 40-nM siRNA for SP1, CTCF and DNMT1 or scramble siRNA control (si-Ctrl) for 12 hr. Data are mean±SD (n=4). TATA binding protein (TBP) was an internal control. *P<0.05 vs si-Ctrl transfection.
SP1
Si-Ctrl Si-SP10.00
0.25
0.50
0.75
1.00
1.25
1.50
SP
1 m
RN
A r
ela
tive
leve
lSi-Ctrl Si-SP1
**
A
B
C
DNMT1
Si-Ctrl Si-DNMT10.00
0.25
0.50
0.75
1.00
1.25
1.50
DN
MT
1 m
RN
A r
ela
tive
leve
l
Si-Ctrl Si-DNMT1
**
Si-Ctrl Si-CTCF0.00
0.25
0.50
0.75
1.00
1.25
1.50
CT
CF
mR
NA
re
lativ
e le
vel
CTCF
Si-Ctrl Si-CTCF
*
TBP
TBP
TBP
HcyCtrl
CTCF
IP: CTCF IgG
SP1
Input
SP1
SP1
CTCF
IgG
CTCF
IgG
Hcy Ctrl
HcyCtrl
IP: SP1 IgG
Supplement Fig. V
A
B
C
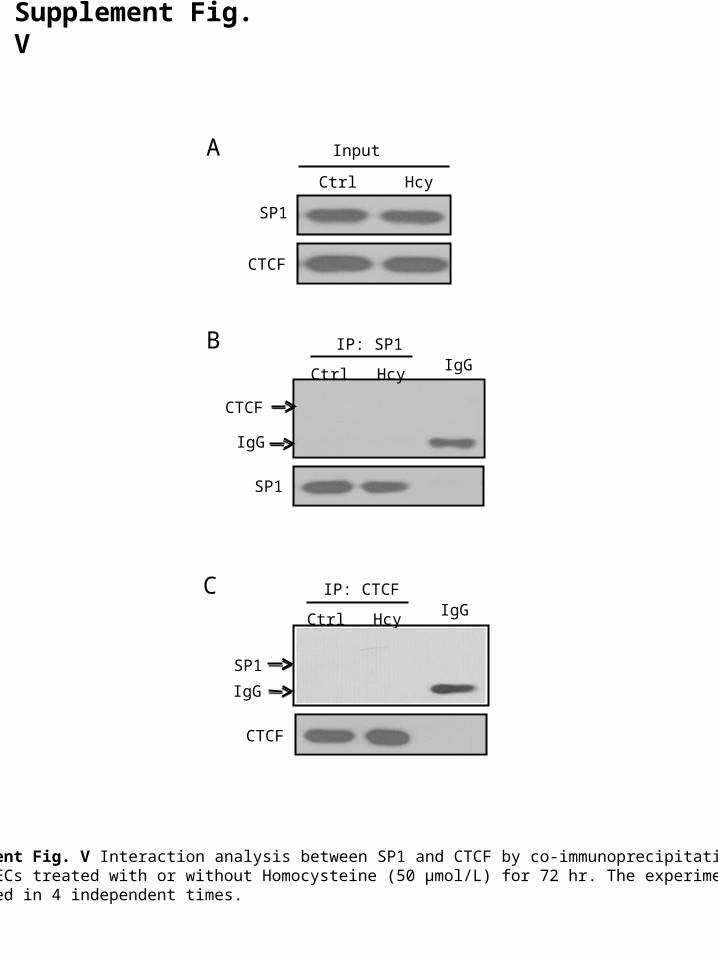
Supplement Fig. V Interaction analysis between SP1 and CTCF by co-immunoprecipitation in P4 HUVECs treated with or without Homocysteine (50 μmol/L) for 72 hr. The experiments were performed in 4 independent times.
A
0
2
4
6
8
NO
X4
mR
NA
exp
ress
ion
Ctrl HHcy Ctrl HHcy
4 W 8 W
Supplement Fig. VI
NOX4
DIPA
NOX4
DIPA
4 W 8 W
Ctrl
HHcy
*
*
B
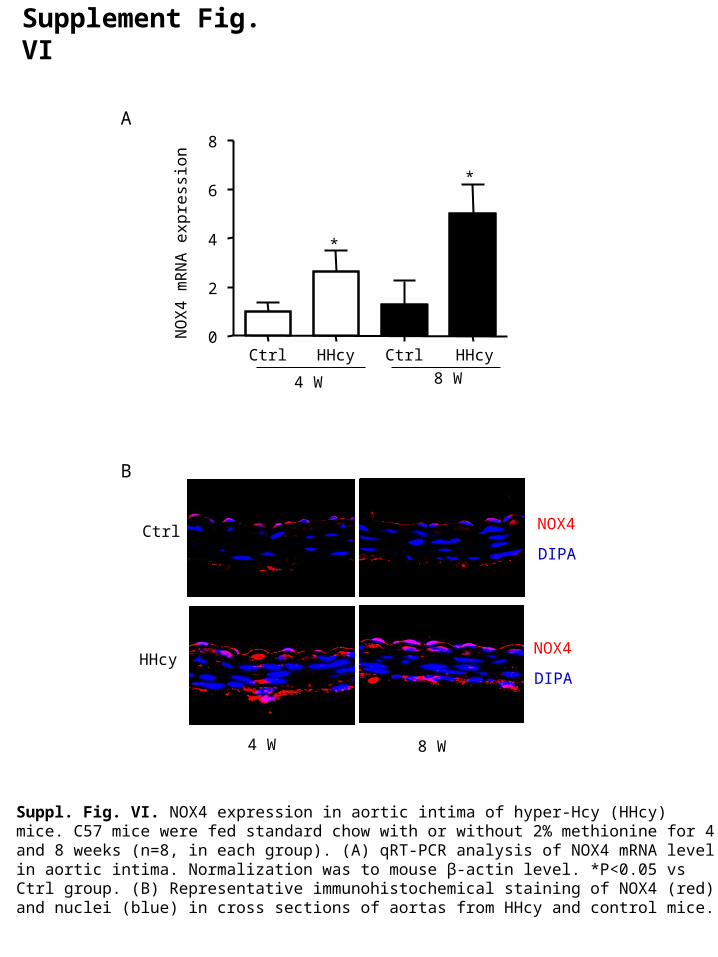
Suppl. Fig. VI. NOX4 expression in aortic intima of hyper-Hcy (HHcy) mice. C57 mice were fed standard chow with or without 2% methionine for 4 and 8 weeks (n=8, in each group). (A) qRT-PCR analysis of NOX4 mRNA level in aortic intima. Normalization was to mouse β-actin level. *P<0.05 vs Ctrl group. (B) Representative immunohistochemical staining of NOX4 (red) and nuclei (blue) in cross sections of aortas from HHcy and control mice.