Fig. 1.1. Earth pressure at-rest on the basement wall near ...
92
Rock Face Rock Face d H Soil Backfill Basement Wall σo ? Soil Backfill Fig. 1.1. Earth pressure at-rest on the basement wall near vertical rock faces 50
Transcript of Fig. 1.1. Earth pressure at-rest on the basement wall near ...
Rock Face
Rock Face
d
H Soil Backfill
Basement Wall
σo ? Soil Backfill
Fig. 1.1. Earth pressure at-rest on the basement wall near vertical rock
faces
50
Bridge Girder
Soil Backfill
Rock Face
Bridge Abutment
d
Fig. 1.2. Bridge abutment near a vertical rock face
51
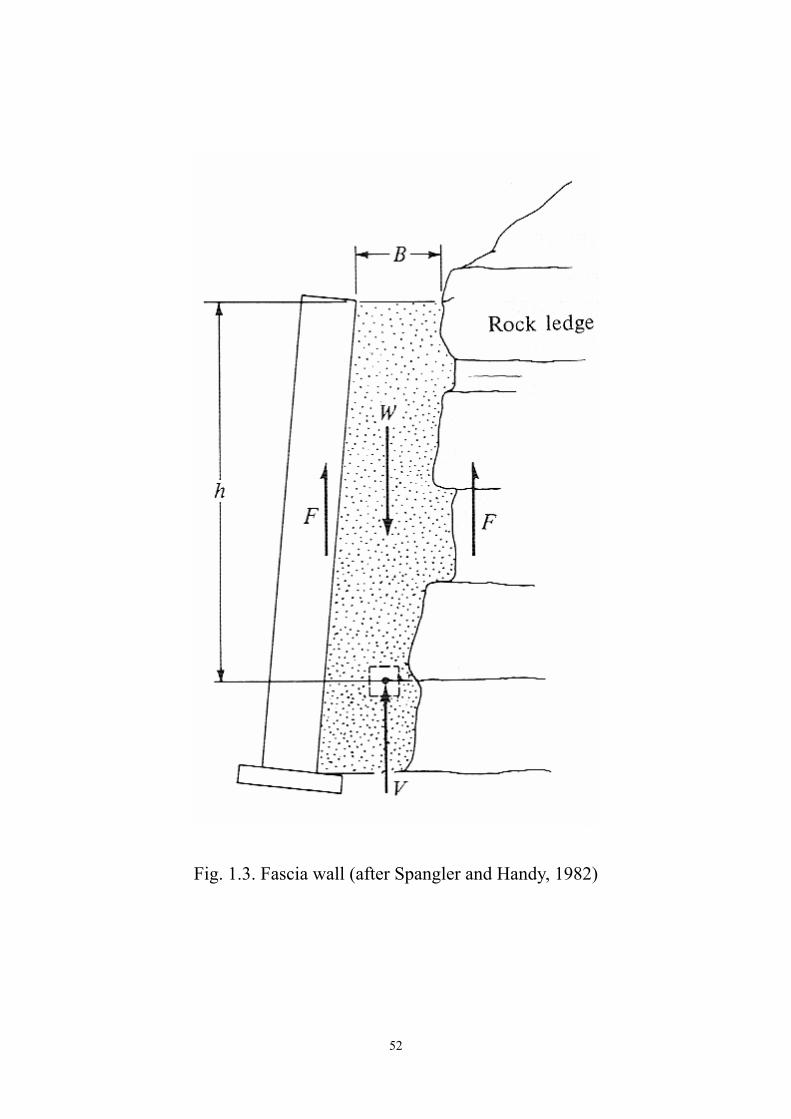
Fig. 1.3. Fascia wall (after Spangler and Handy, 1982)
52
o
o
o
o
o
o
o
o
o
o
o
o
o
o
o
o
o
o
o
o
o
o
o
o
o
o
o
o
o
o
o
o
o
o
o
o
o
o
o
o
o
o
o
o
o
o
o
o
oo
o
o
o
o
o
o
o
o
o
o
o
o
o
o
o
o
o
o
o
o
o
o
o
o
o
o
o
o
o
o
o
o
o
o
o
o
o
o
o
o
o
o
o
o
o
o
o
o
o
o
o
o
o
o
o
o
o
o
o
o
o
o
o
o
o
o
o
o
o
o
o
o
o
o
o
o
o
o
o
o
o
o
o
o
o
o
o
o
o
o
o
o
o
o
o
o
o
o
o
o
o
o
o
o
o
o
o
o
o
o
o
o
o
o
o
o
o
o
o
o
o
o
o
o
o
o
o
o
o
o
o
o
o
o
o
o
o
o
o
o
o
o
o
o
o
o
o
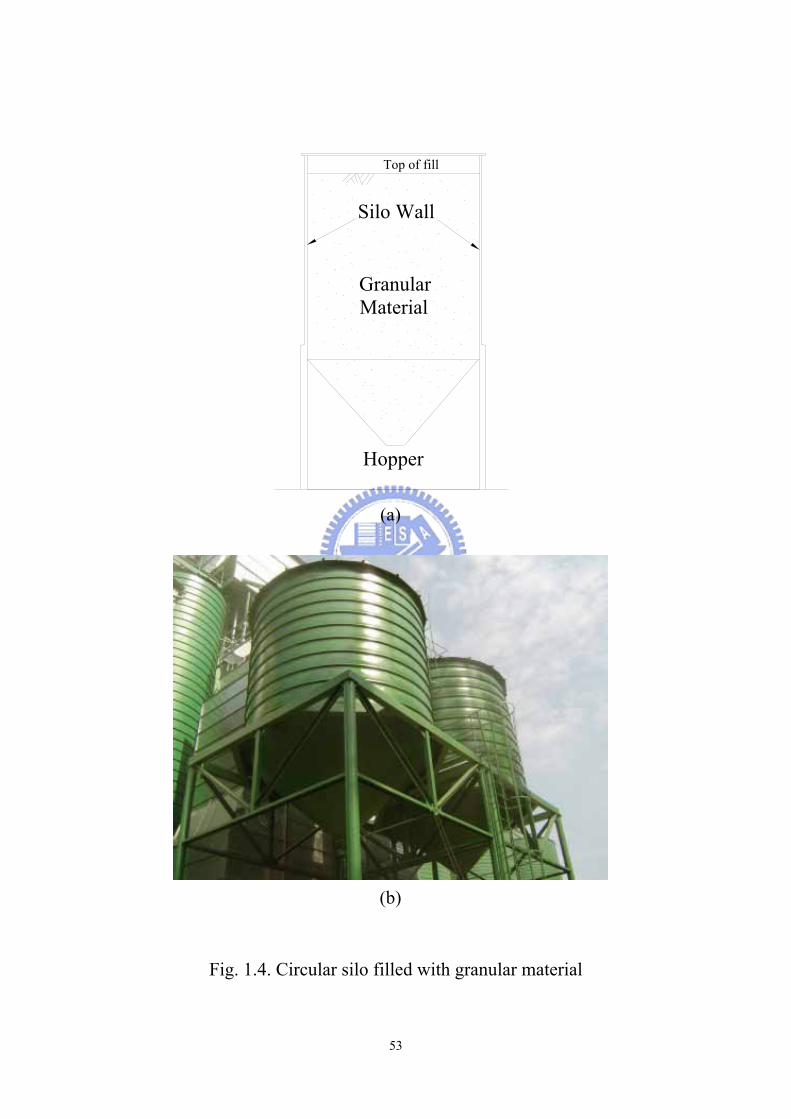
oGranular Material
Silo Wall
Hopper
o
oo
Top of fill
(a)
(b)
Fig. 1.4. Circular silo filled with granular material
53
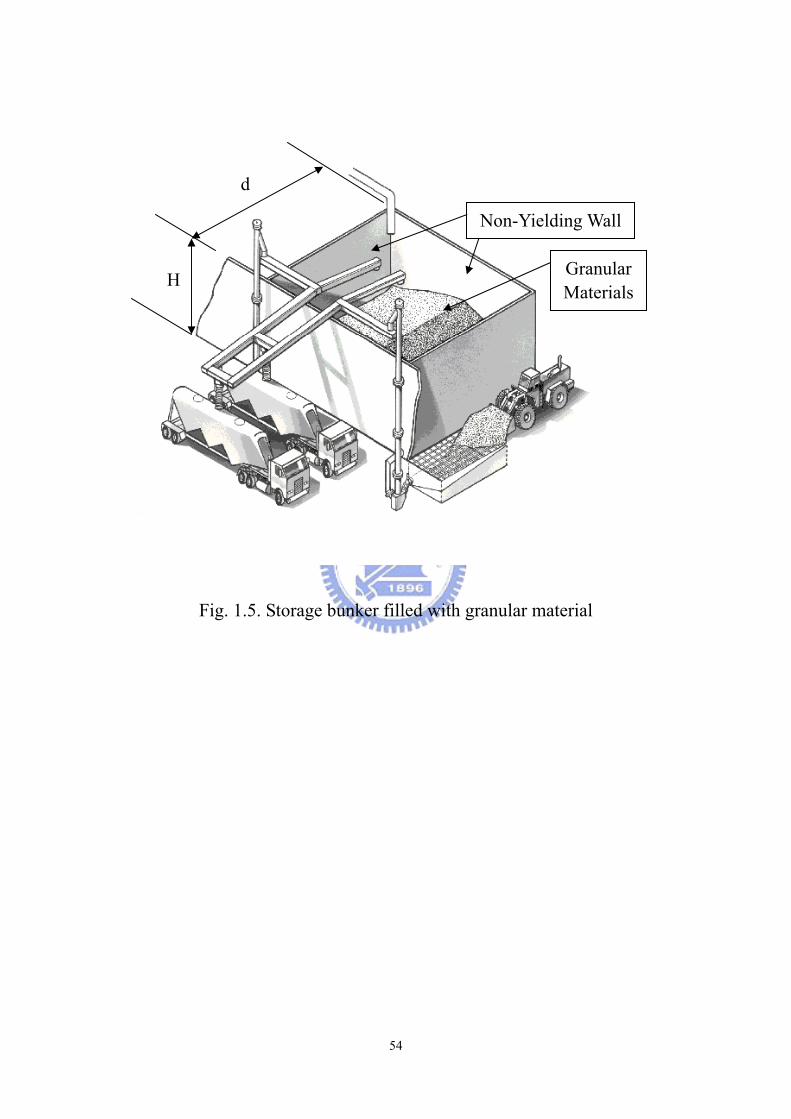
Non-Yielding Wall
d
Granular Materials
H
Fig. 1.5. Storage bunker filled with granular material
54

Fig. 2.1. Development of in-situ stresses
55
σ
σσ
σ
σ
σ σ
σ
γ
h h
v
v
G.L.
(a)
Soil
1
1
3 3
(b)
=z
z
vσ
σh
=
=
A
Ground Level
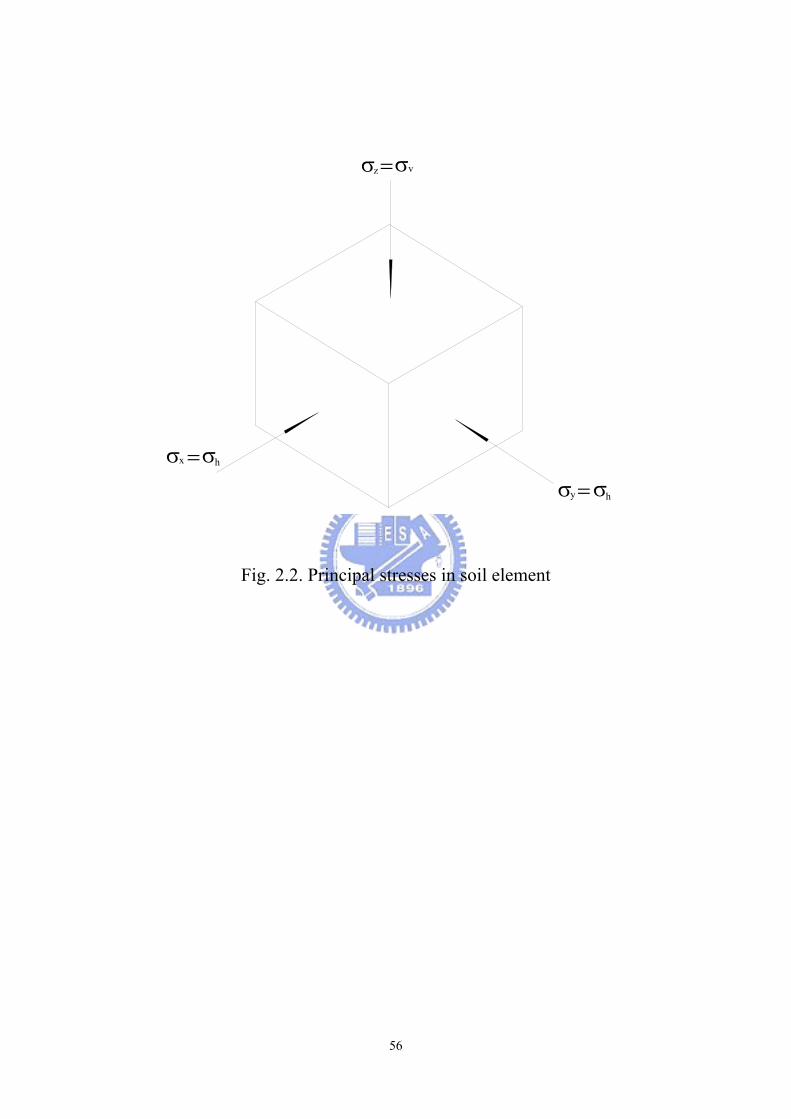
Fig. 2.2. Principal stresses in soil element
x
y
z v
hσσ
σ σ
σσ
=
=
= h
56
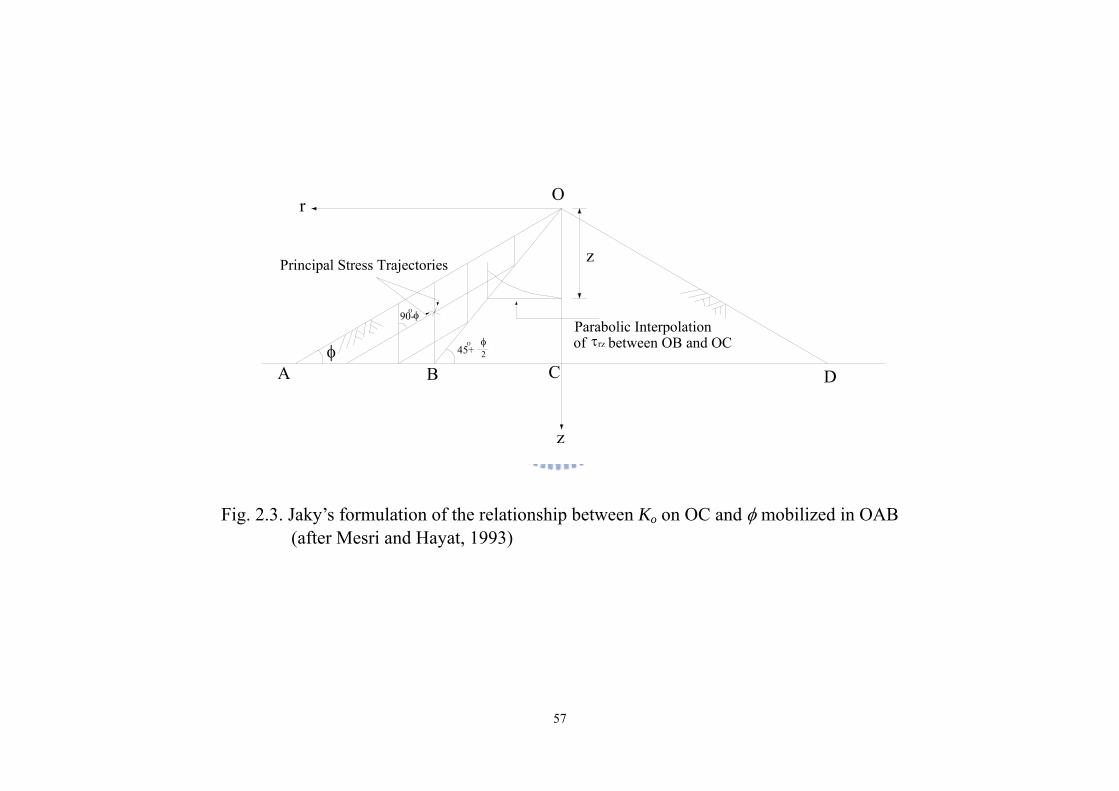
Fig. 2.3. Jaky’s formulation of the relationship between Ko on OC and φ mobilized in OAB (after Mesri and Hayat, 1993)
57
φτφ
φ
Principal Stress Trajectories
90-
45+ 2
A B C D
O
z
z
r
r
z
Parabolic Interpolationof between OB and OC
O
O
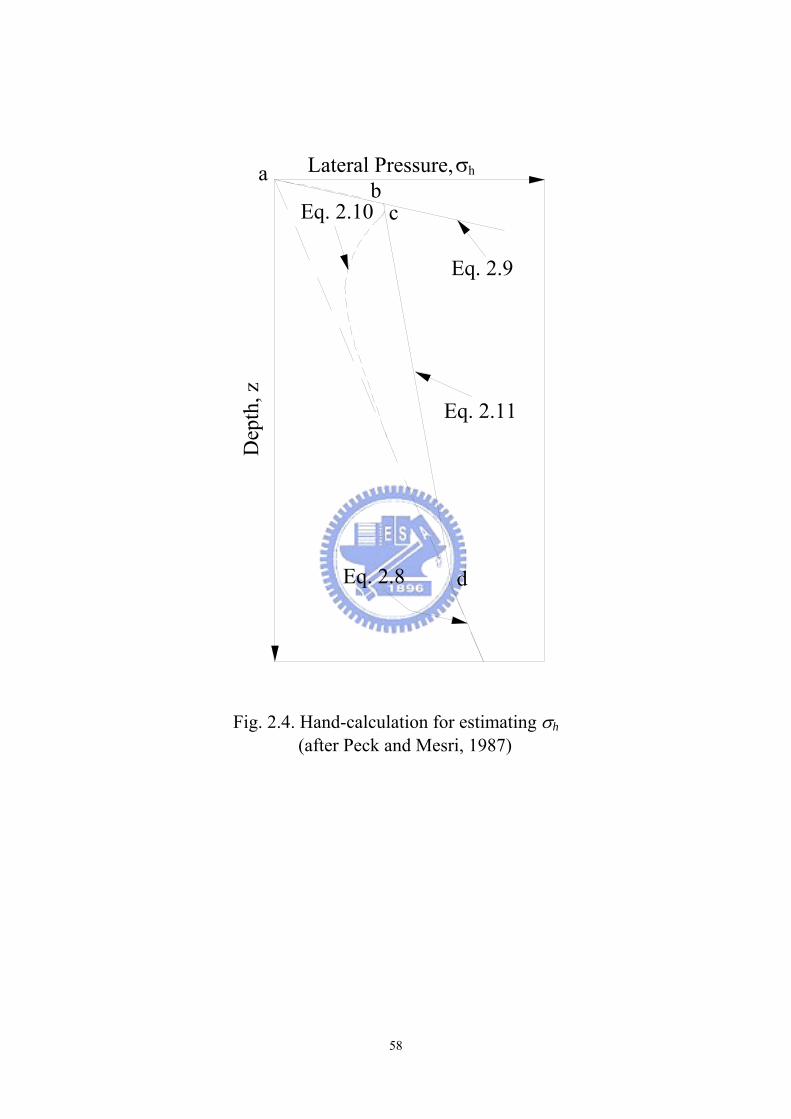
Lateral Pressure,
Dep
th, z
ab
c
d
σh
Eq. 2.8
Eq. 2.9
Eq. 2.11
Eq. 2.10
Fig. 2.4. Hand-calculation for estimating σh (after Peck and Mesri, 1987)
58
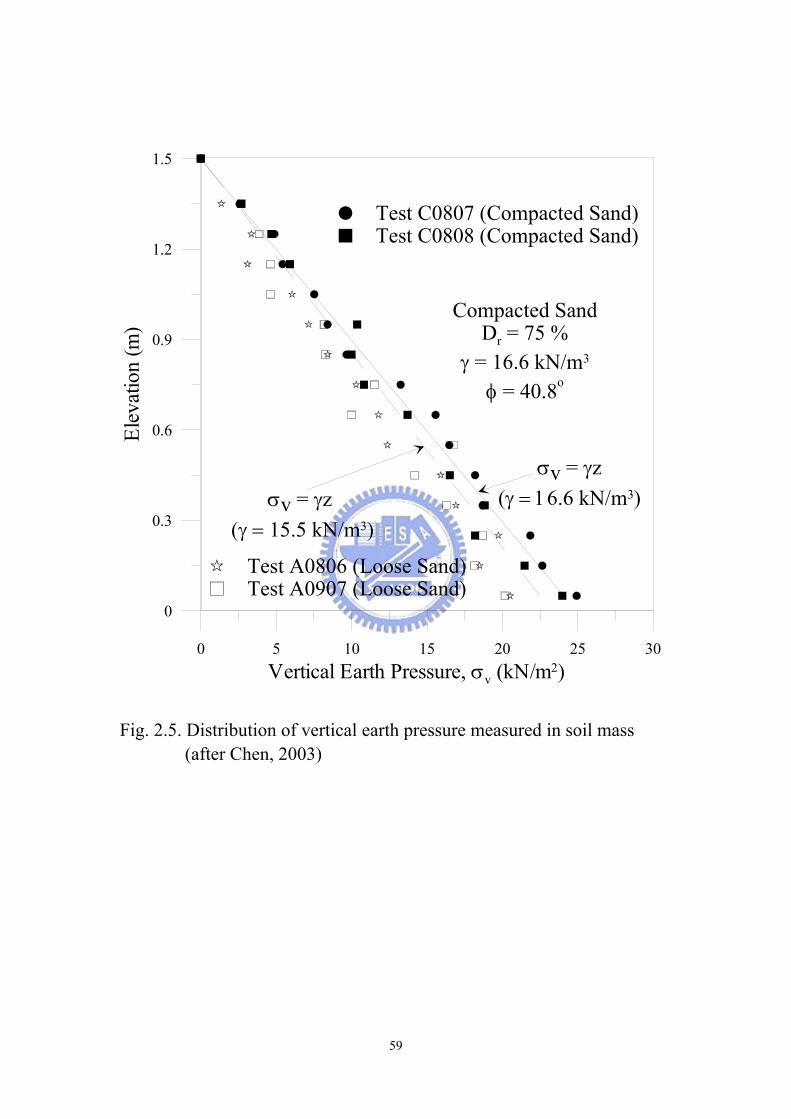
0 5 10 15 20 25 30Vertical Earth Pressure, σv (kN/m2)
0
0.3
0.6
0.9
1.2
1.5
Elev
atio
n (m
)
σv = γz(γ = 16.6 kN/m3)σv = γz
(γ = 15.5 kN/m3)
, Test C0807 (Compacted Sand)* Test C0808 (Compacted Sand)
? Test A0806 (Loose Sand)’ Test A0907 (Loose Sand)
Compacted SandDr = 75 %
γ = 16.6 kN/m3
φ = 40.8o
Fig. 2.5. Distribution of vertical earth pressure measured in soil mass
(after Chen, 2003)
59
0 5 10 15
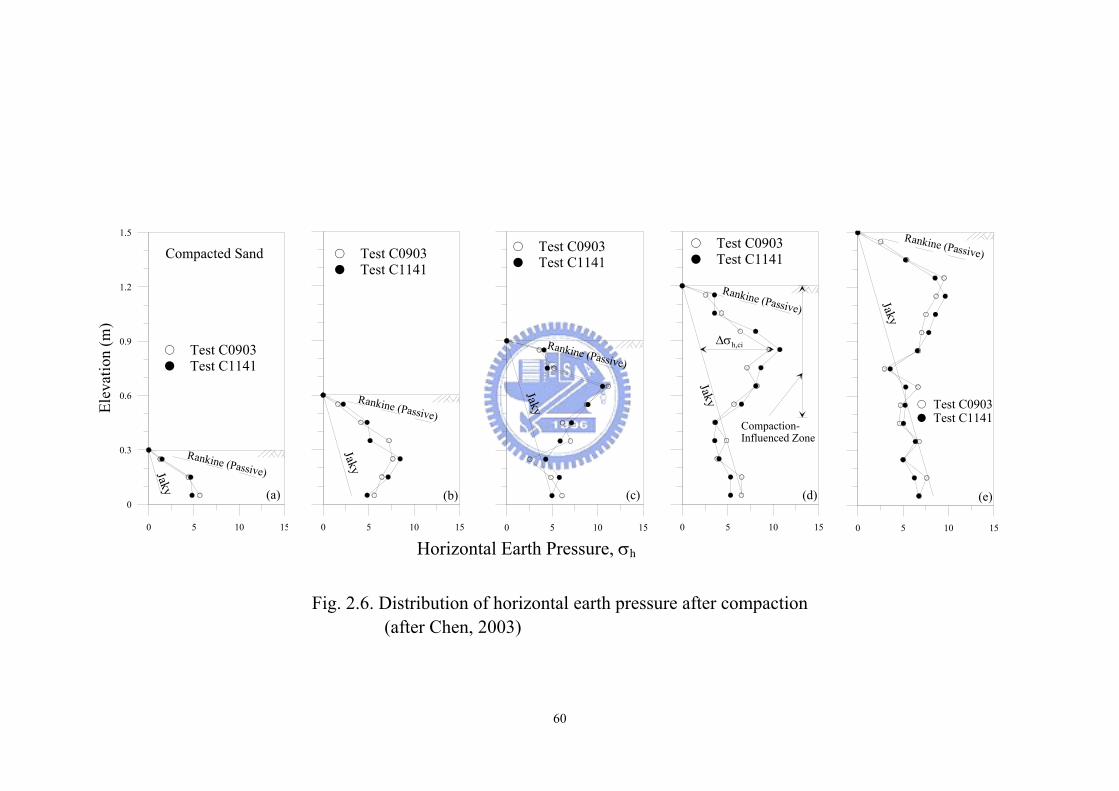
Rankine (Passive)
Jaky
(b)
+ Test C0903, Test C1141
0 5 10 15
Rankine (Passive)
Jaky
(c)
+ Test C0903, Test C1141
0 5 10 15
Rankine (Passive)
JakyCompaction-Influenced Zone
(d)
+ Test C0903, Test C1141
∆σh,ci
0 5 10 15
Rankine (Passive)
Jaky
(e)
+ Test C0903, Test C1141
0 5 10 15
0
0.3
0.6
0.9
1.2
1.5
Elev
atio
n (m
)
Rankine (Passive)Jaky
Compacted Sand
+ Test C0903, Test C1141
(a)
Horizontal Earth Pressure, σh 2
Fig. 2.6. Distribution of horizontal earth pressure after compaction (after Chen, 2003)
60
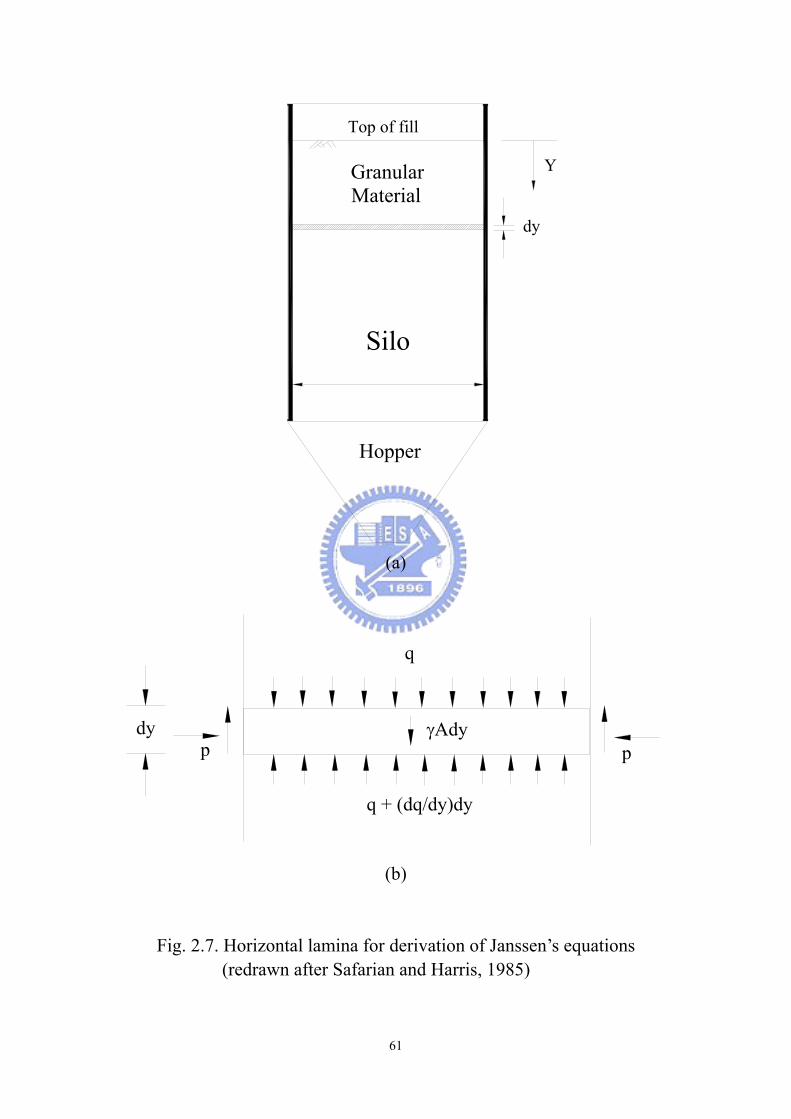
Silo
Hopper
Top of fill
Y
dy
Granular Material
(a)
dyp p
γAdy
q
q + (dq/dy)dy
(b)
Fig. 2.7. Horizontal lamina for derivation of Janssen’s equations (redrawn after Safarian and Harris, 1985)
61
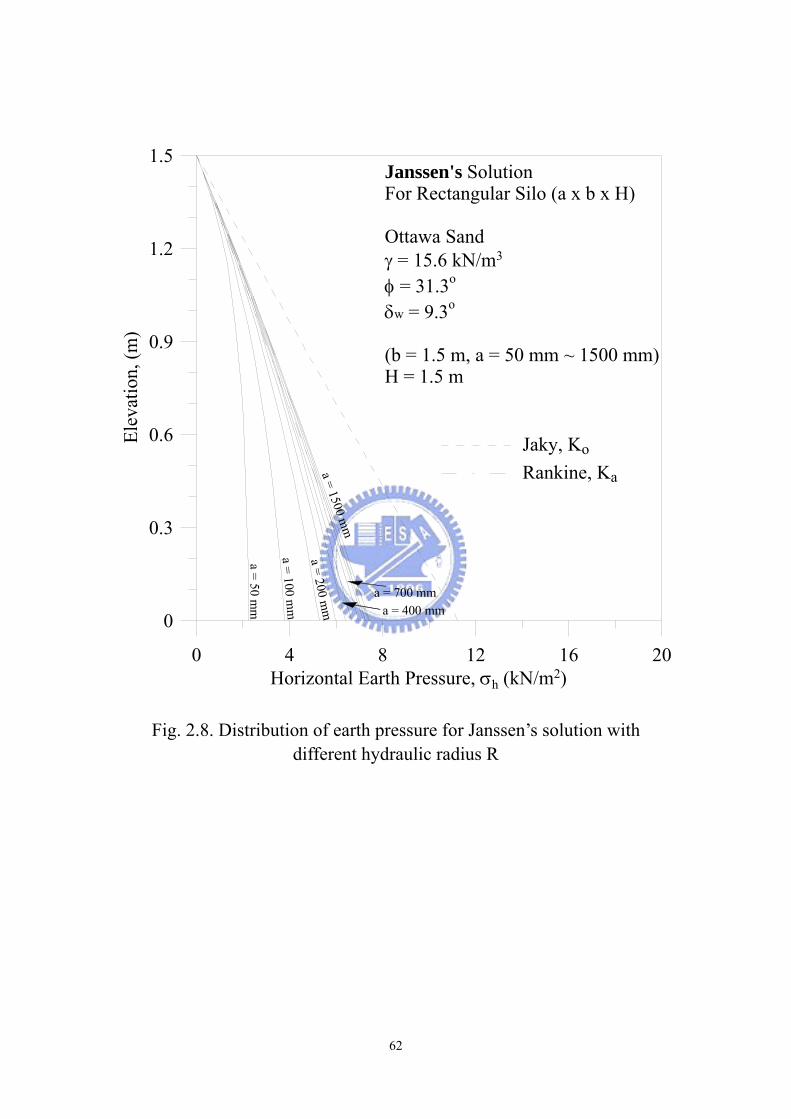
0 4 8 12 16 20Horizontal Earth Pressure, σh (kN/m2)
0
0.3
0.6
0.9
1.2
1.5El
evat
ion,
(m)
Jaky, Ko
Rankine, Ka
Janssen's SolutionFor Rectangular Silo (a x b x H)
Ottawa Sandγ = 15.6 kN/m3
φ = 31.3o
δw = 9.3o
(b = 1.5 m, a = 50 mm ~ 1500 mm)H = 1.5 m
a = 50 mm
a = 1500 mm
a = 100 mm
a = 200 mm a = 400 mm
a = 700 mm
Fig. 2.8. Distribution of earth pressure for Janssen’s solution with different hydraulic radius R
62
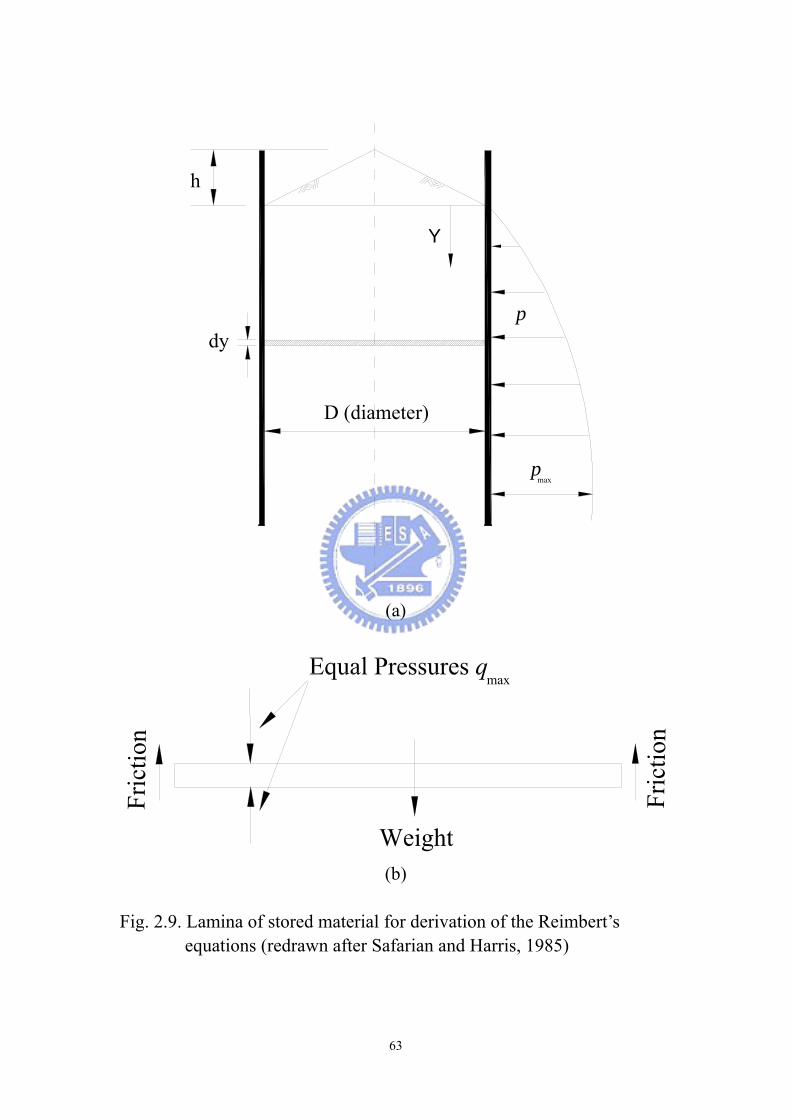
h
D (diameter)
pdy
Y
maxp
(a)
Weight
Fric
tion
Fric
tion
max
(b) Fig. 2.9. Lamina of stored material for derivation of the Reimbert’s
equations (redrawn after Safarian and Harris, 1985)
63
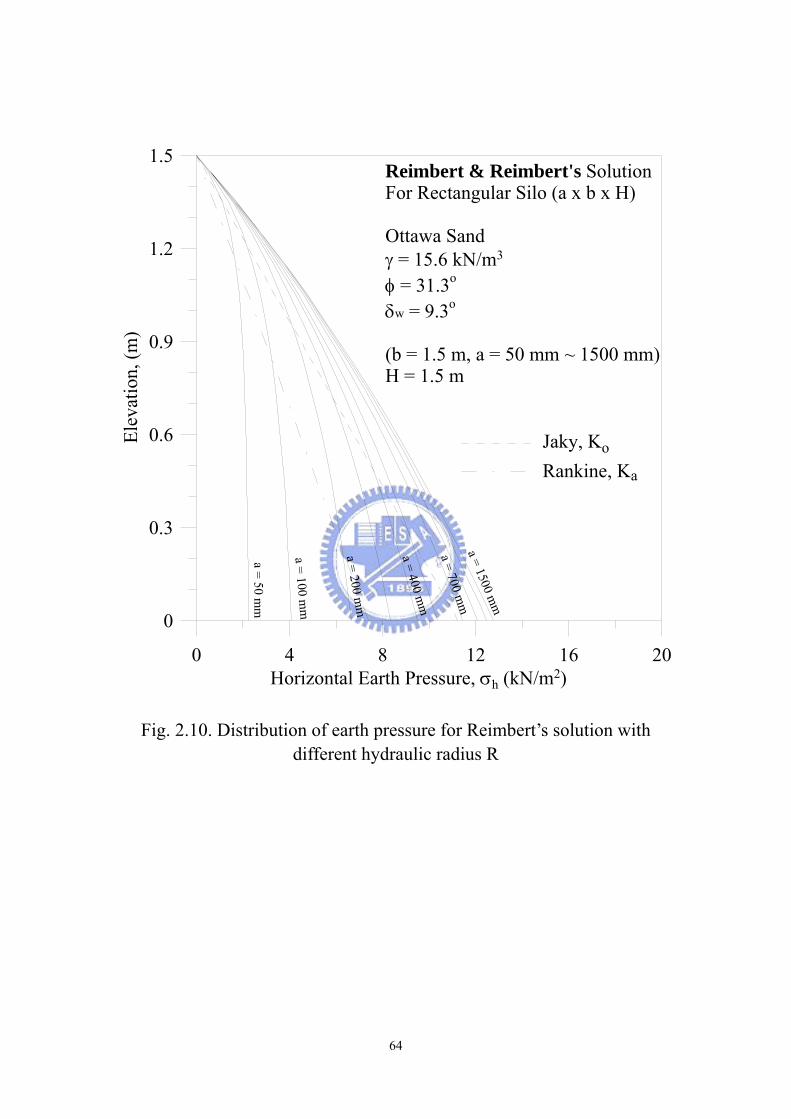
0 4 8 12 16 20Horizontal Earth Pressure, σh (kN/m2)
0
0.3
0.6
0.9
1.2
1.5El
evat
ion,
(m)
Jaky, KoRankine, Ka
Reimbert & Reimbert's SolutionFor Rectangular Silo (a x b x H)
Ottawa Sandγ = 15.6 kN/m3
φ = 31.3o
δw = 9.3o
(b = 1.5 m, a = 50 mm ~ 1500 mm)H = 1.5 m
a = 50 mm
a = 1500 mm
a = 100 mm
a = 200 mm
a = 400 mm
a = 700 mm
Fig. 2.10. Distribution of earth pressure for Reimbert’s solution with different hydraulic radius R
64
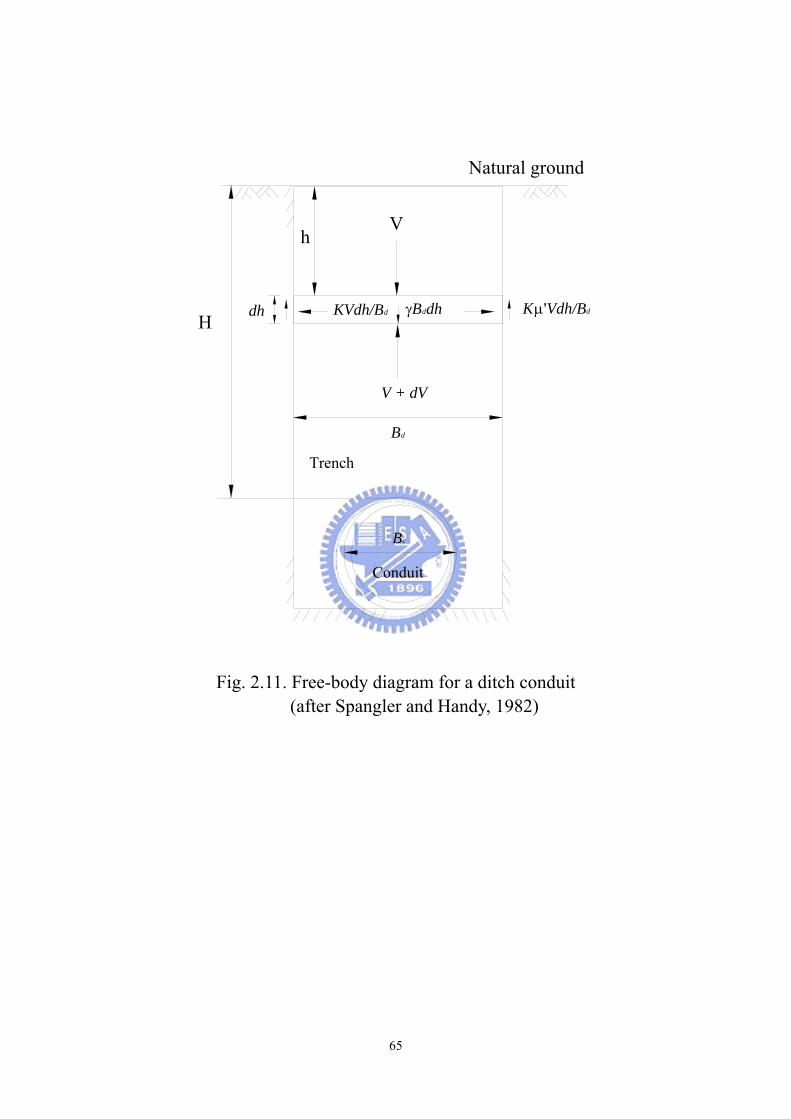
Natural ground
Hdh
h
Bd
Bc
V
V + dV
γBddhKVdh/Bd Kµ'Vdh/Bd
Trench
Conduit
Fig. 2.11. Free-body diagram for a ditch conduit (after Spangler and Handy, 1982)
65
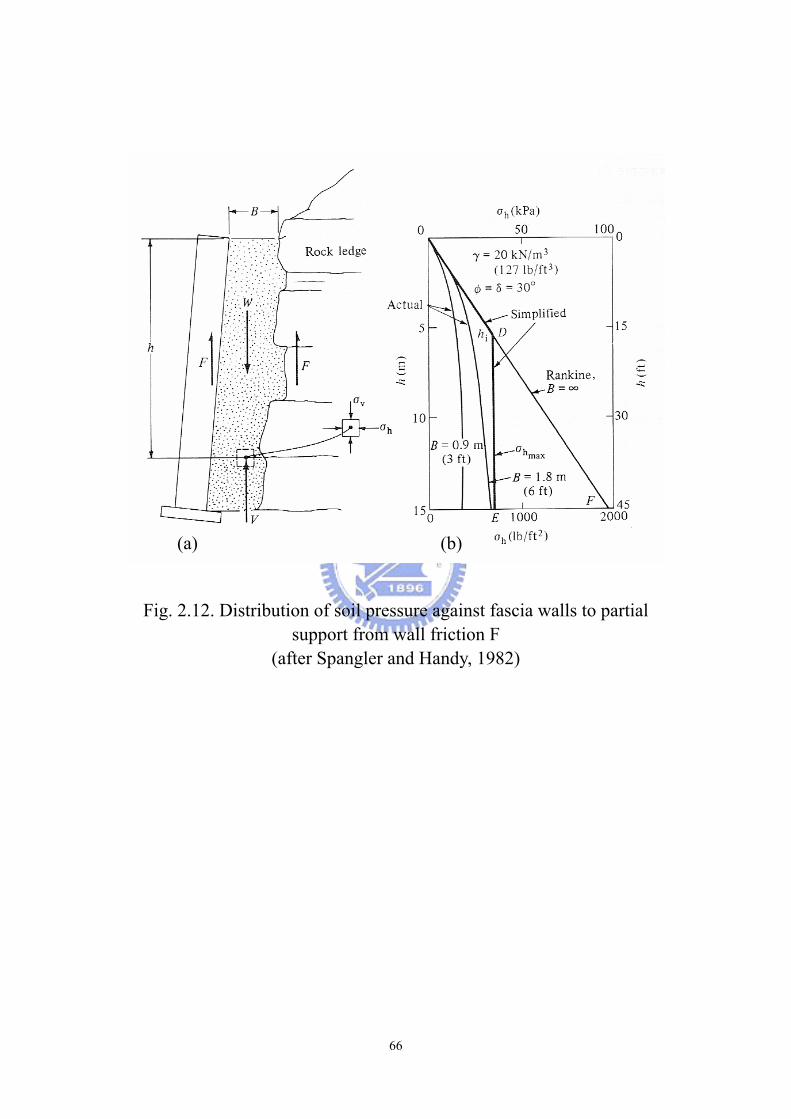
(a) (b)
Fig. 2.12. Distribution of soil pressure against fascia walls to partial
support from wall friction F (after Spangler and Handy, 1982)
66
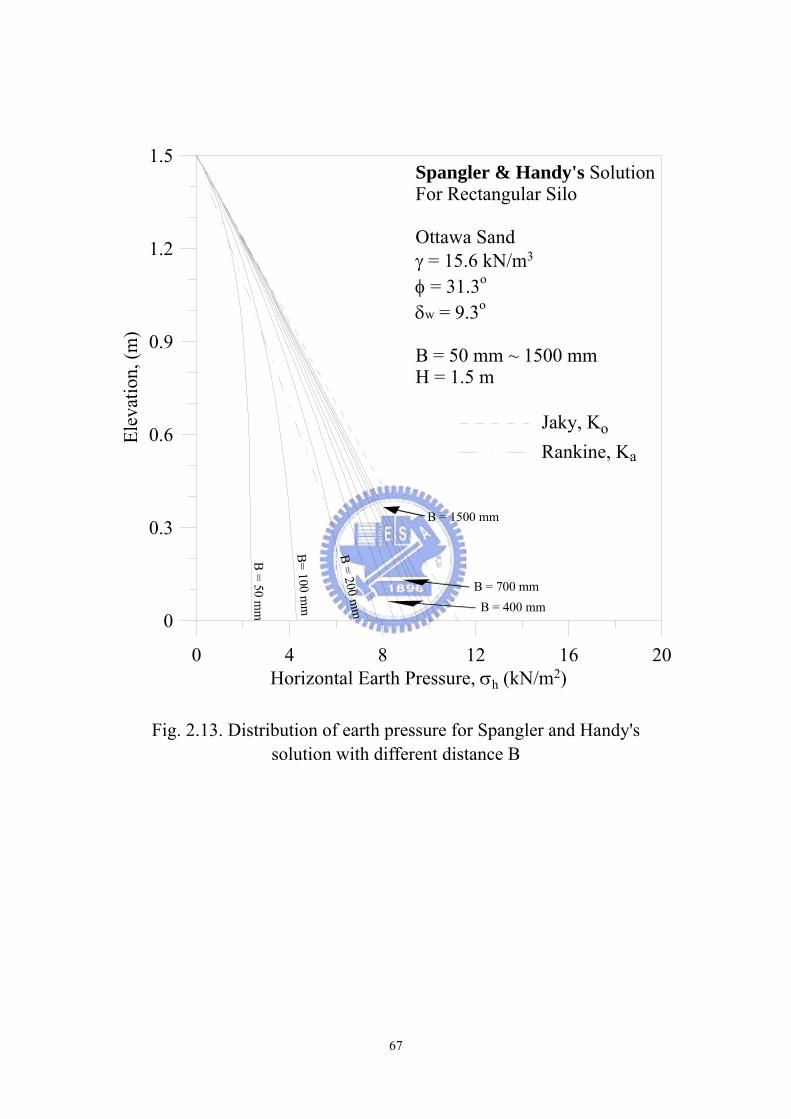
0 4 8 12 16 20Horizontal Earth Pressure, σh (kN/m2)
0
0.3
0.6
0.9
1.2
1.5El
evat
ion,
(m)
Jaky, KoRankine, Ka
Spangler & Handy's SolutionFor Rectangular Silo
Ottawa Sandγ = 15.6 kN/m3
φ = 31.3o
δw = 9.3o
B = 50 mm ~ 1500 mmH = 1.5 m
B = 50 m
m
B= 100 m
m
B = 200 mm
B = 1500 mm
B = 400 mmB = 700 mm
Fig. 2.13. Distribution of earth pressure for Spangler and Handy's solution with different distance B
67
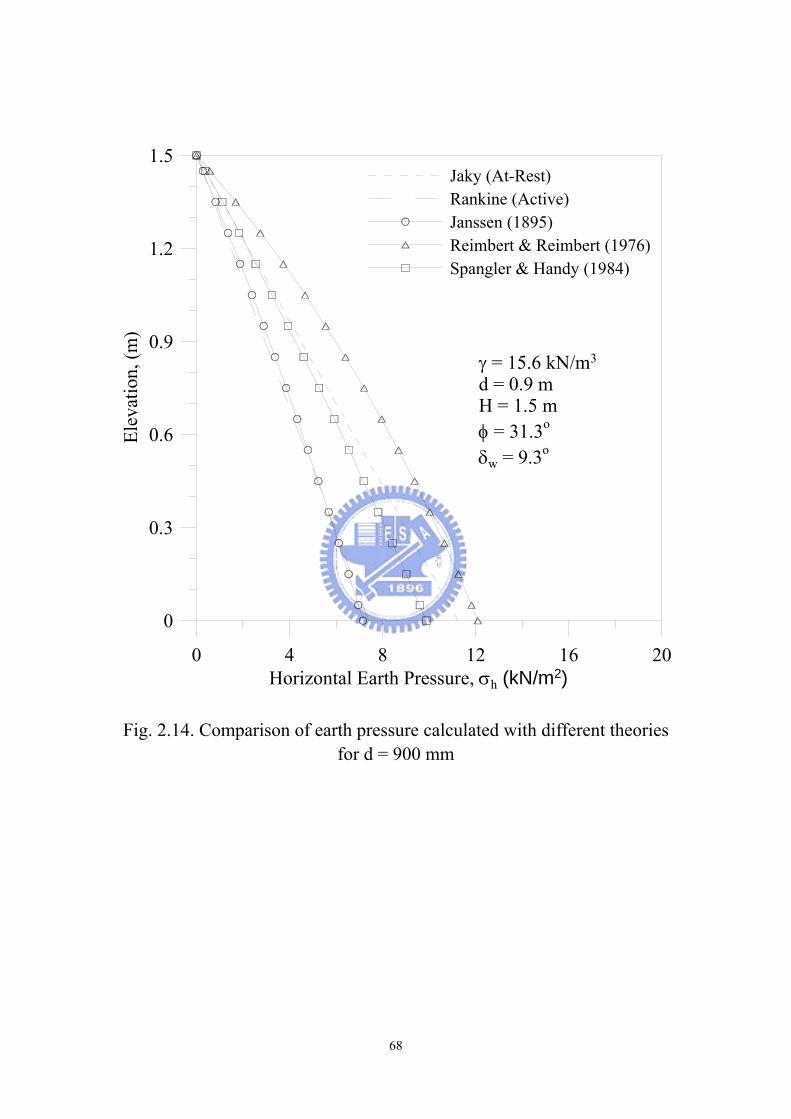
0 4 8 12 16 20Horizontal Earth Pressure, σh (kN/m2)
0
0.3
0.6
0.9
1.2
1.5El
evat
ion,
(m)
Jaky (At-Rest)Rankine (Active)Janssen (1895)Reimbert & Reimbert (1976)Spangler & Handy (1984)
γ = 15.6 kN/m3
d = 0.9 mH = 1.5 mφ = 31.3o
δw = 9.3o
Fig. 2.14. Comparison of earth pressure calculated with different theories
for d = 900 mm
68
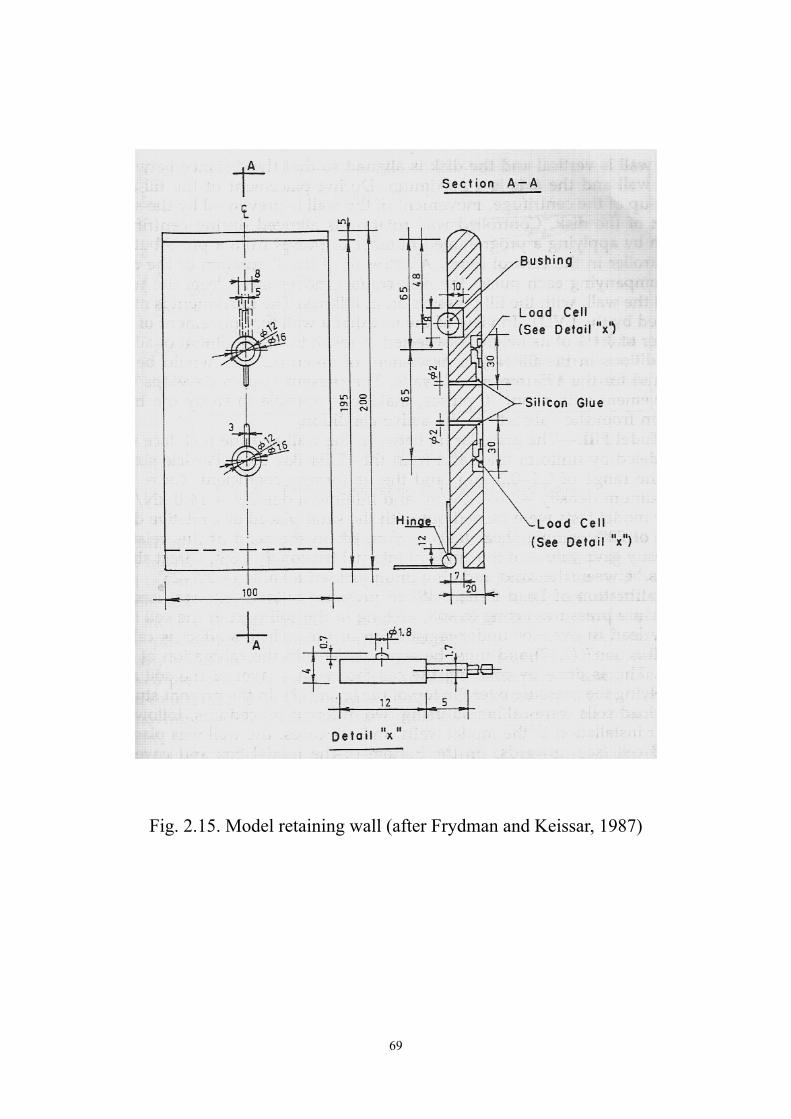
Fig. 2.15. Model retaining wall (after Frydman and Keissar, 1987)
69
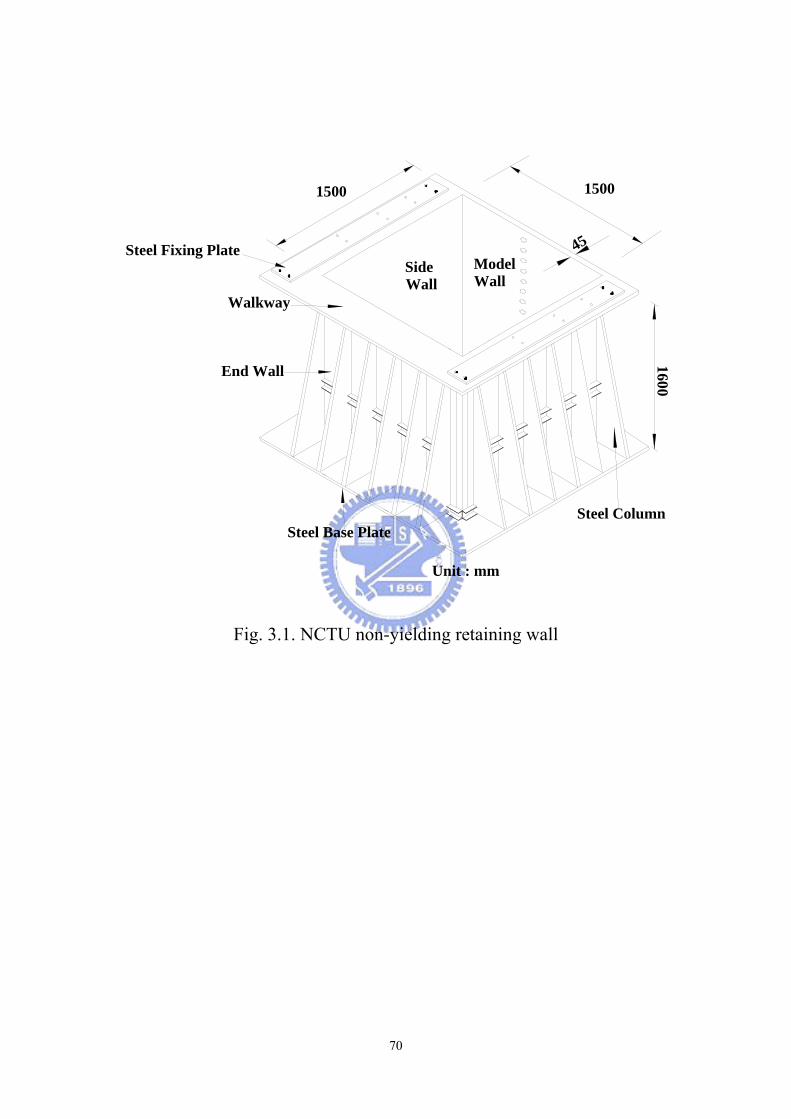
Model Wall
Walkway
SideWall
End Wall
Steel Fixing Plate
1600
Unit : mm
45
Steel ColumnSteel Base Plate
15001500
Fig. 3.1. NCTU non-yielding retaining wall
70
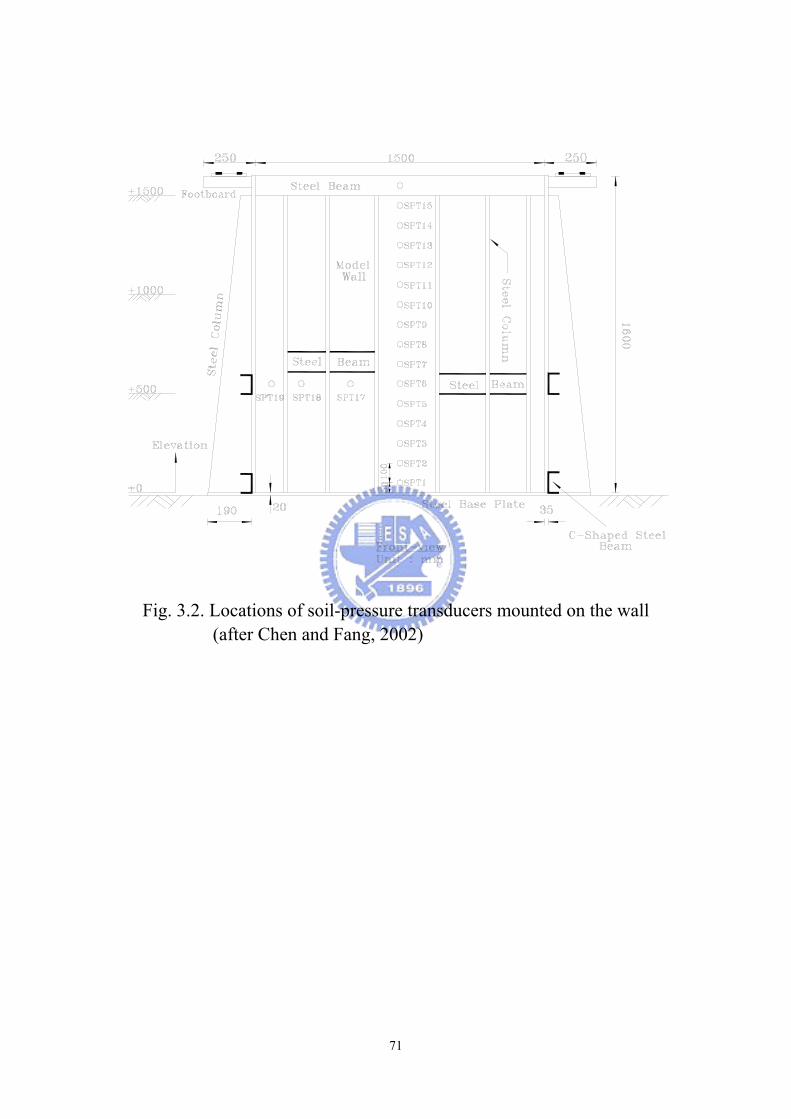
Fig. 3.2. Locations of soil-pressure transducers mounted on the wall (after Chen and Fang, 2002)
71
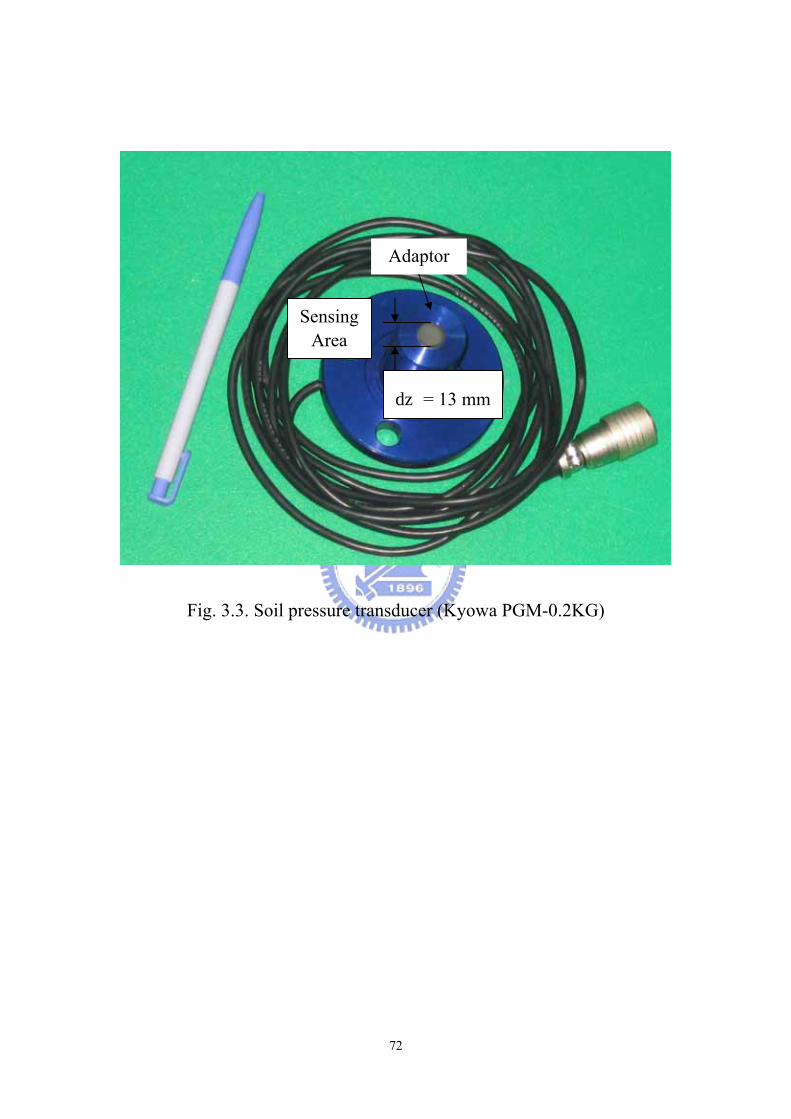
Adaptor
SensingArea
Fig. 3.3. Soil pressure trans
Φ = 13 mm
ducer (Kyowa PGM-0.2KG)
72
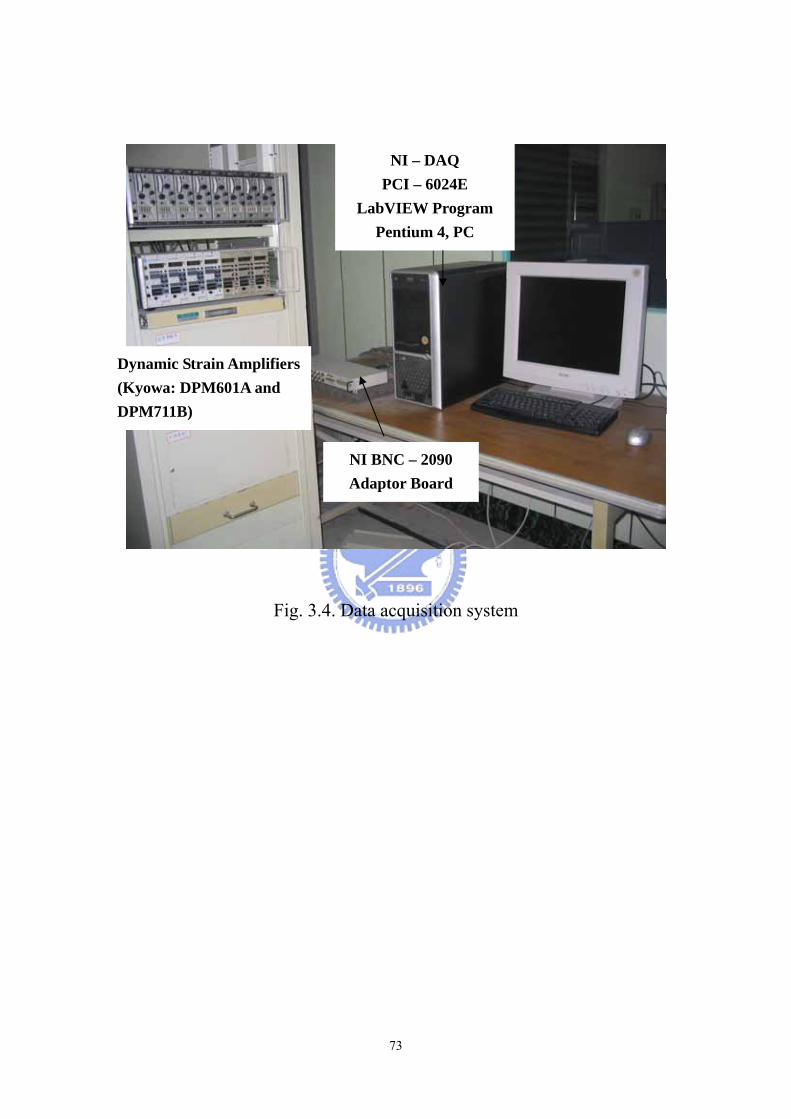
NI – DAQ PCI – 6024E
LabVIEW Program Pentium 4, PC
Dynamic Strain Amplifiers (Kyowa: DPM601A and DPM711B)
NI BNC – 2090 Adaptor Board
Fig. 3.4. Data acquisition system
73
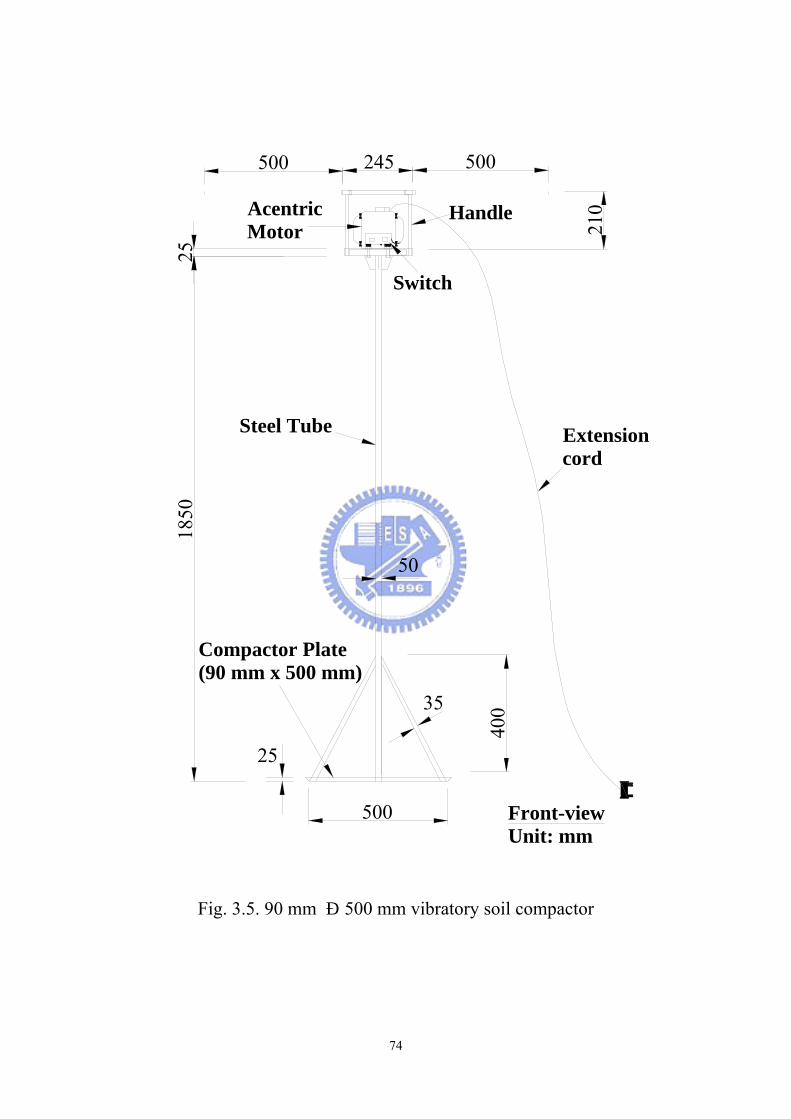
Front-viewUnit: mm
500
1850
400
500 50025
245
210
Extension cord
Acentric Motor
Switch
Compactor Plate (90 mm x 500 mm)
Handle
Steel Tube
35
25
50
Fig. 3.5. 90 mm × 500 mm vibratory soil compactor
74
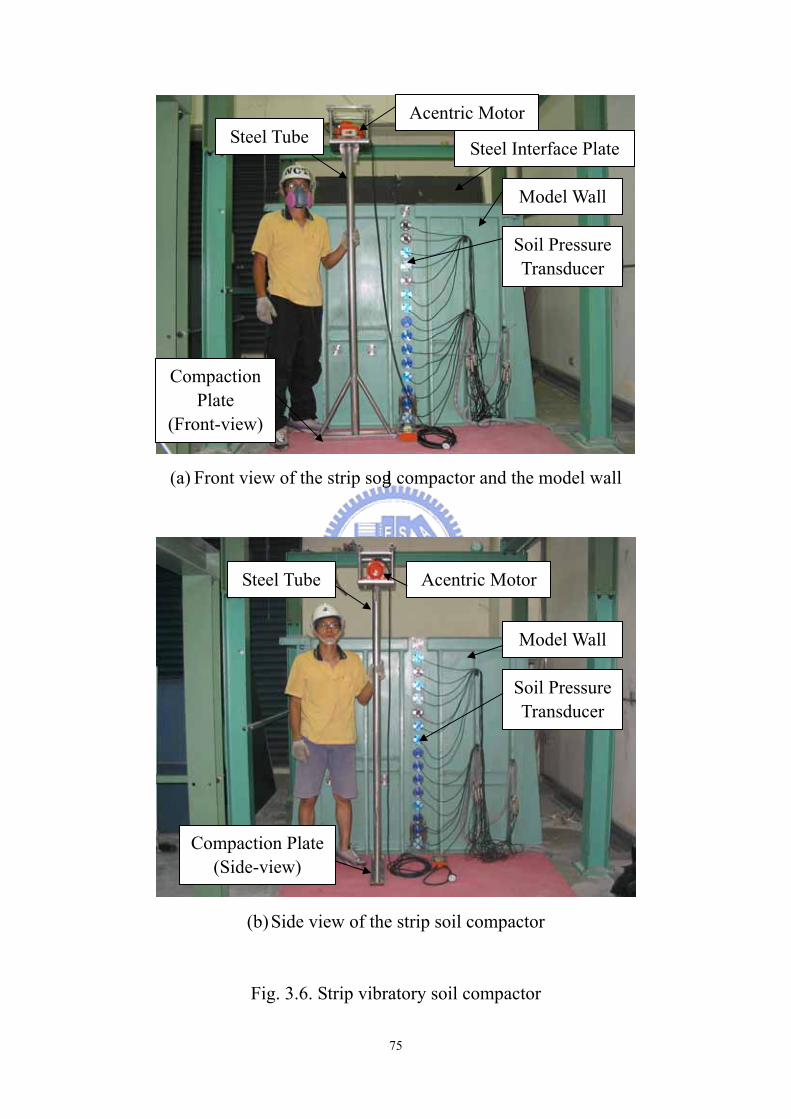
Acentric Motor Steel Tube
Model Wall
Soil Pressure Transducer
Steel Interface Plate
Compaction Plate
(Front-view)
(a) Front view of the strip soil compactor and the model wall
Model Wall
Soil Pressure Transducer
Acentric Motor Steel Tube
Compaction Plate (Side-view)
(b) Side view of the strip soil compactor
Fig. 3.6. Strip vibratory soil compactor
75
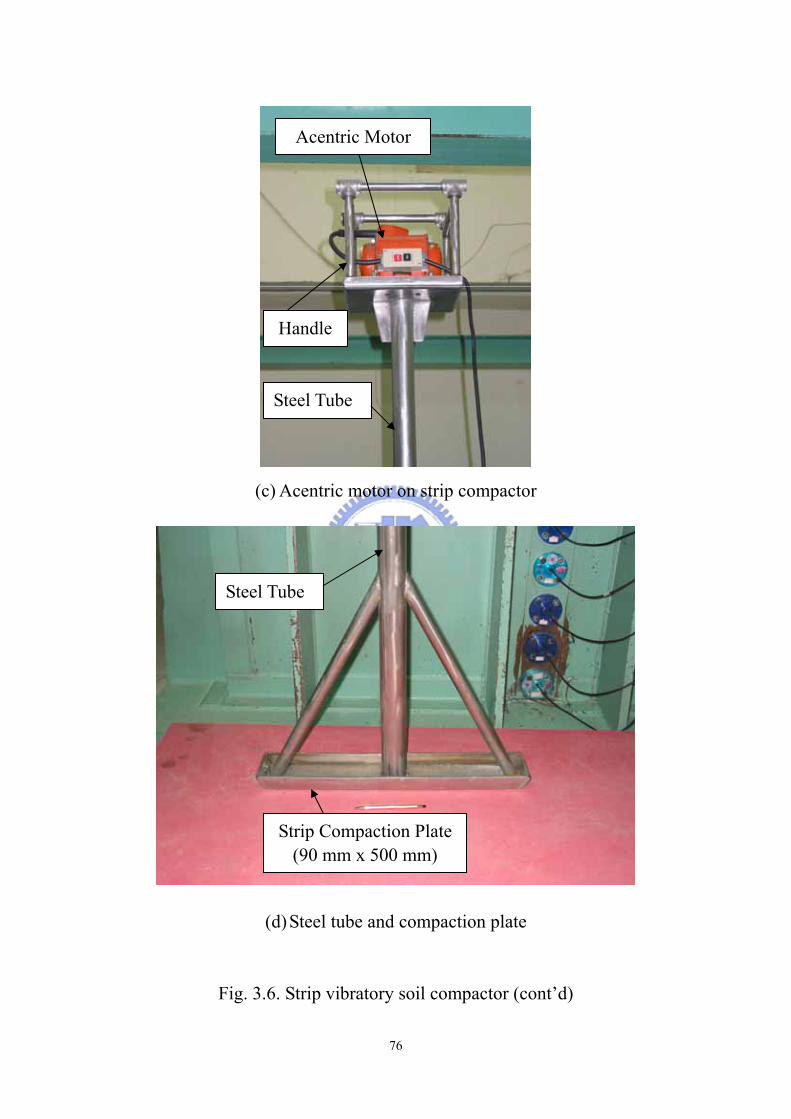
Acentric Motor
Handle
(c) Acentric motor on strip compactor
Steel Tube
Steel Tube
Strip Compaction Plate (90 mm x 500 mm)
(d) Steel tube and compaction plate
Fig. 3.6. Strip vibratory soil compactor (cont’d)
76

50
100
150
200
10 20 30 40
60Hz
50Hz
R
Radius = 41 mmThickness = 1 mm
No. of Acentric Plate
Ace
ntric
For
ce (k
gf)
0 0 10 20 30 40
Fig. 3.7. Acentric force as a function of number of acentric plate
(Mikasa KJ75)
77

unit:mm
Steel Interface Plate with Safety-Walk
2100
2100
422
320
427
430
315
Steel L-Beam (65 x 65 x 8 mm)
Steel Plate(4.5 mm thick)
Steel L-Beam (65 x 65 x 8 mm)
(a) Front-view (b) Back-view
Steel Beam Reinforcement
Steel Plate with Safety-Walk
Unit : mm
1497
Unit : mm
Steel Platewith Safety-Walk
Steel L-Beam Reinforcement
(c) Side-view (d) Top-view
Fig. 4.1. 2100 mm × 1497 mm steel interface plate
78
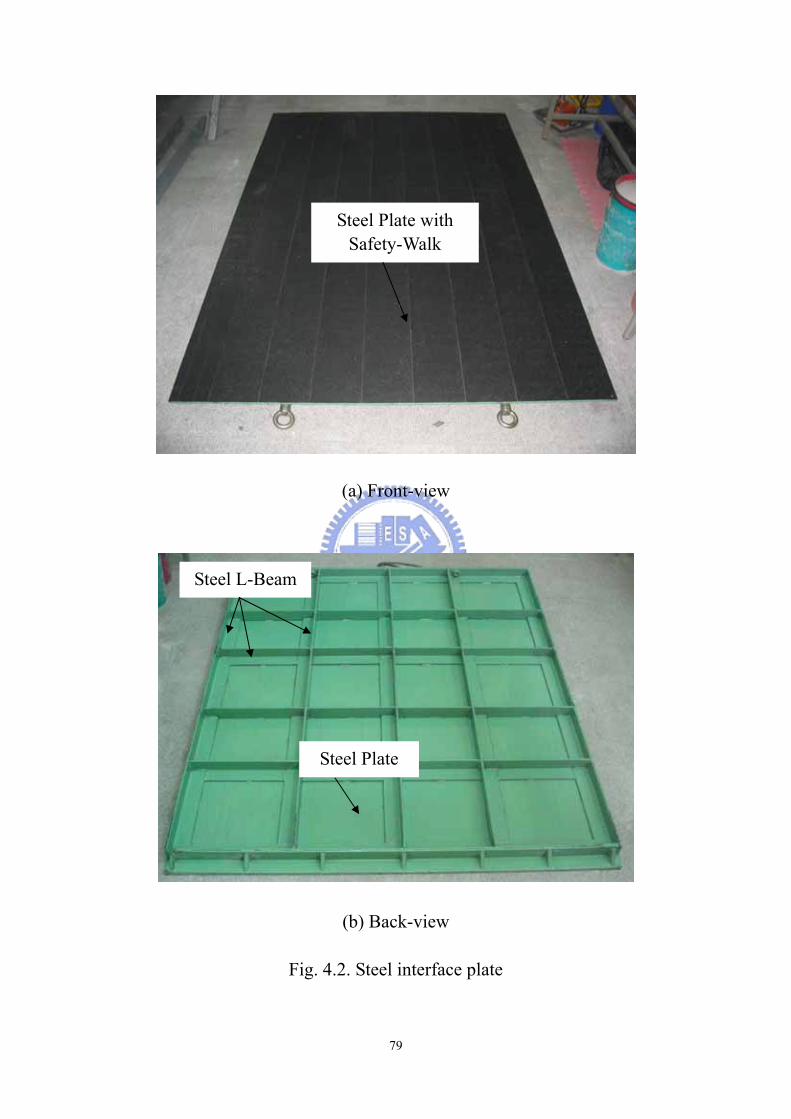
Steel Plate with Safety-Walk
(a) Front-view
Steel L-Beam
Steel Plate
(b) Back-view
Fig. 4.2. Steel interface plate
79
80
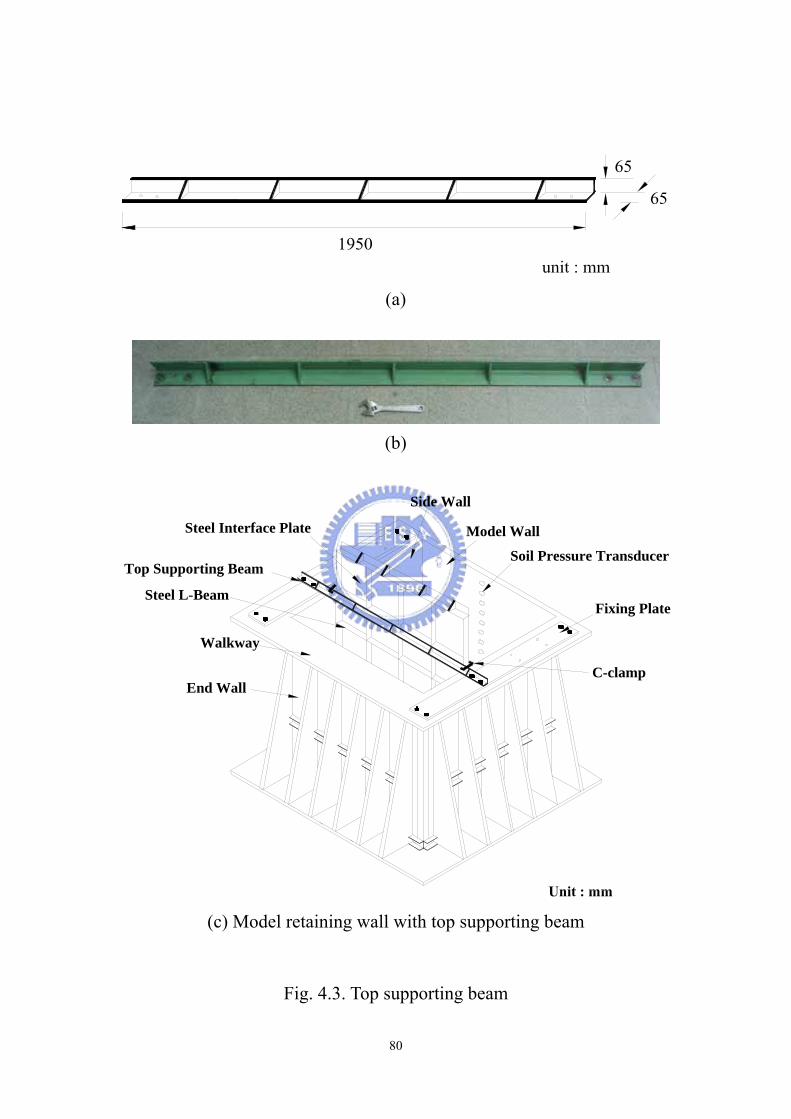
(a)
(b)
Walkway
Top Supporting Beam
End Wall
Fixing Plate
Steel Interface Plate
Side Wall
Model Wall
Soil Pressure Transducer
Steel L-Beam
C-clamp
(c) Model retaining wall with top supporting beam
Fig. 4.3. Top supporting beam
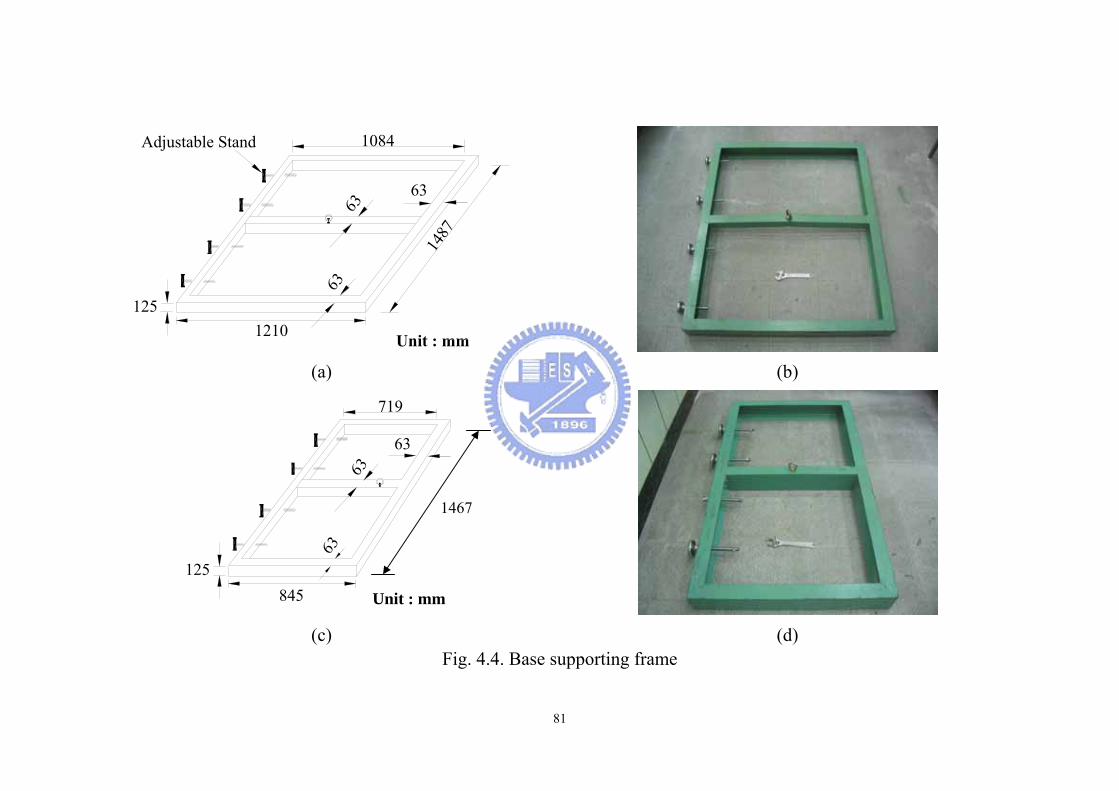
1210
1084
1487
125
63
63
63
Adjustable Stand
(a) (b)
Unit : mm
63
63
63
719
845 (c) (d)
1467
Fig. 4.4. Base supporting frame
81
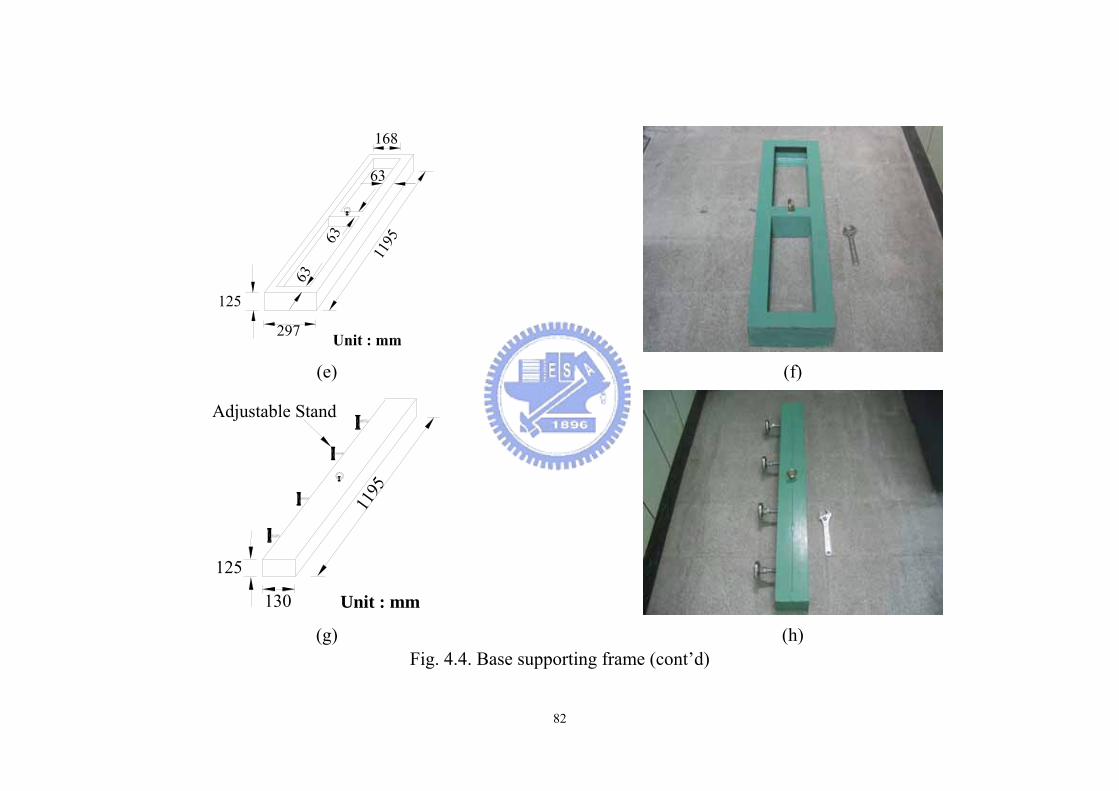
297
1195
125
63
6363
(e) (f)
Unit : mm130
1195
125
Adjustable Stand
(g) (h)
Fig. 4.4. Base supporting frame (cont’d)
82
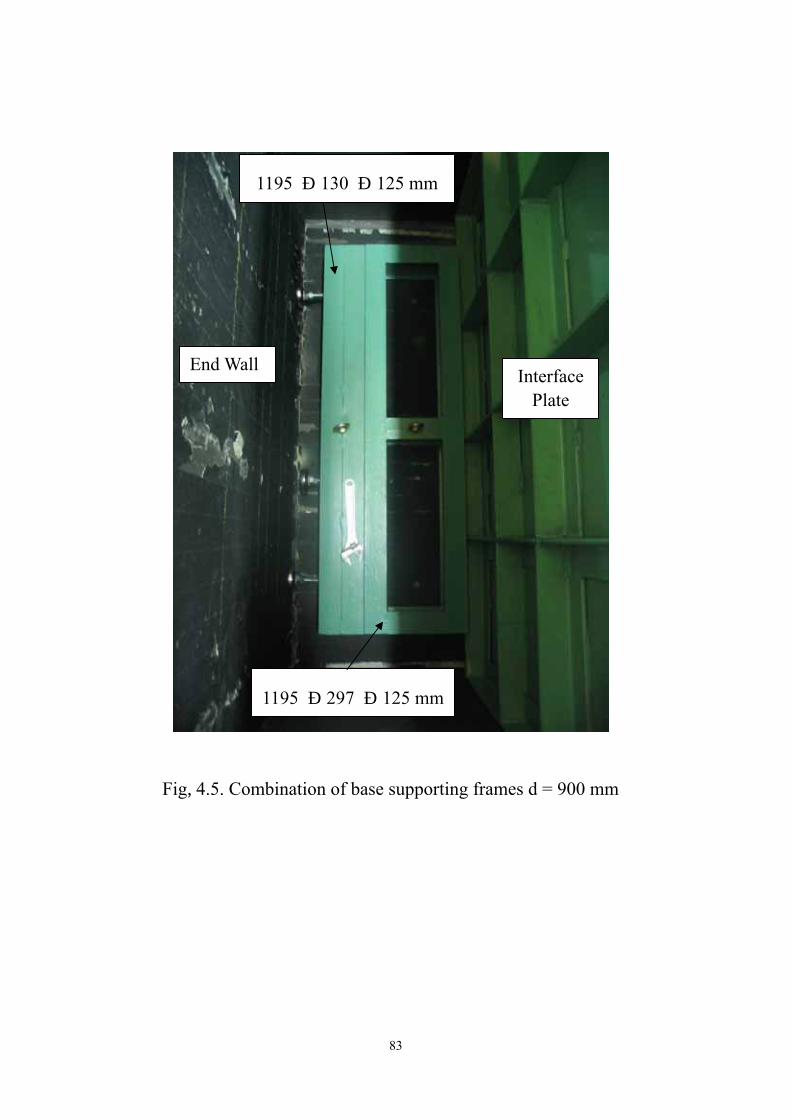
Fig. 4.5. Co
End Wa
m
1195 × 130 × 125 mm
ll Interface Plate
bination of base supporting frames d = 900 mm
1195 × 297 × 125 mm
83

H =
150
0
Unit: mm
SPT1
SPT2
SPT3
SPT4
SPT5
SPT6
SPT7
SPT8
SPT9
SPT10
SPT11
SPT12
SPT13
SPT14
SPT15
Model Wall
Side View
d = 900
Steel Interface PlateTop Supporting Beam
C-clamp
Base Supporting Frame(130 x 1195 x 125 mm)
Soil Pressure Transducer
Base Spacing Plate(17.5 mm thick)
Fixing Plate
Soil Bin
Base Supporting Frame(297 x 1195 x 125 mm)
(a) Side-view
Model Wall
unit : mmTop - View
L =
1500 Soil Pressure
Transducer
Base Supporting Frame(130 x 1195 x 125 mm)
d = 900Top Supporting Beam C-clamp
Base Spacing Plate
Base Spacing Plate
Vertical Interface Plate
Soil Bin
(400 x 700 x 17.5 mm)
(200 x 300 x 17.5 mm)
Base Supporting Frame(297 x 1195 x 125 mm)
(b) Top-view
Fig. 4.6. Model retaining wall near a vertical interface plate with d = 900
mm
84
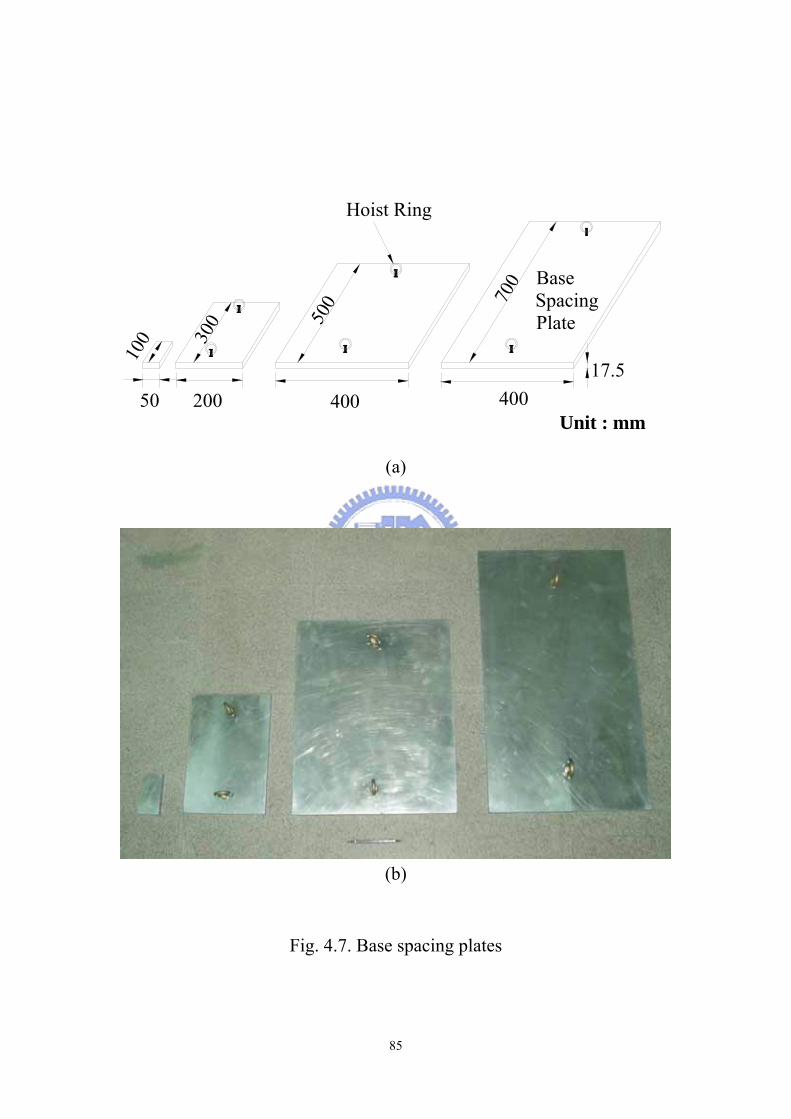
17.540020050
Unit : mm
Hoist Ring
400
100 30
0 500 70
0 Base Spacing Plate
(a)
(b)
Fig. 4.7. Base spacing plates
85
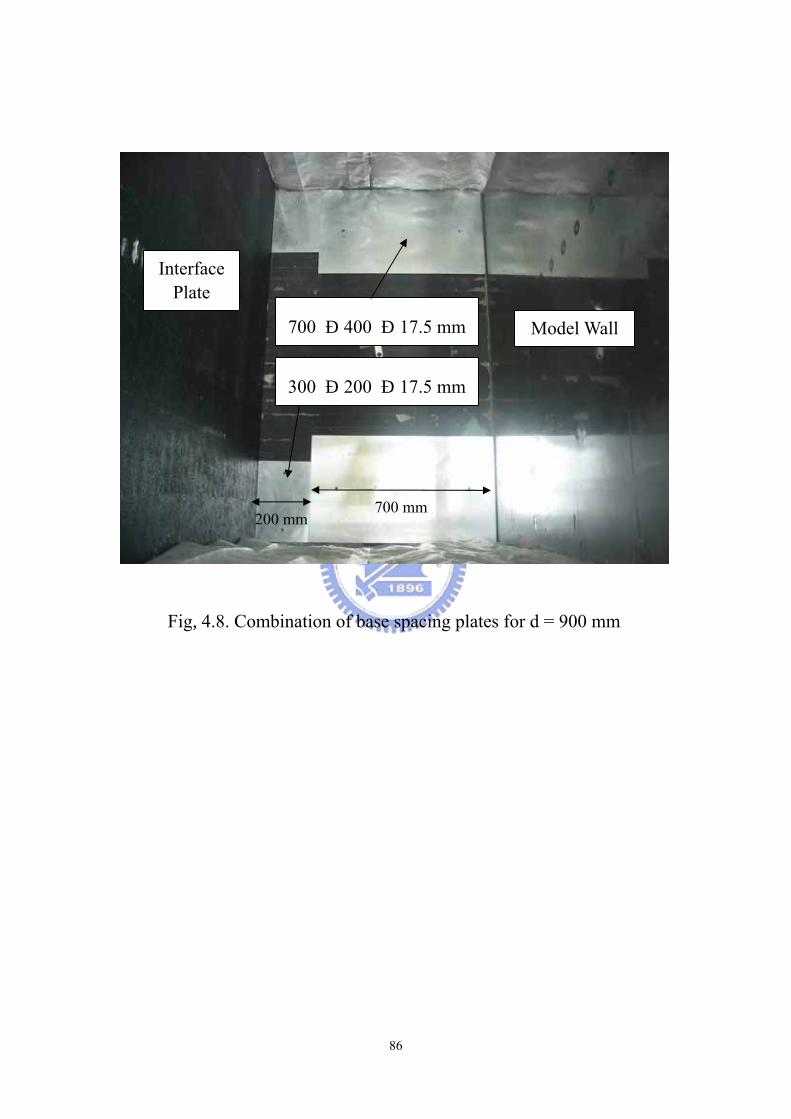
Fig. 4.8. Comb
Interface Plate
200
700 × 400 × 17.5 mm Model Wall
ination of base spacing plates for d = 900 mm
300 × 200 × 17.5 mm
700 mm mm
86

Steel Interface Plate With Safety-Walk
Plastic Sheets Lubricating
Layer
Model Wall
Top Supporting
Beam
Fig. 4.9. For d = 900 mm between interface plate and model wall
87
H =
150
0
Unit: mm
SPT1
SPT2
SPT3
SPT4
SPT5
SPT6
SPT7
SPT8
SPT9
SPT10
SPT11
SPT12
SPT13
SPT14
SPT15
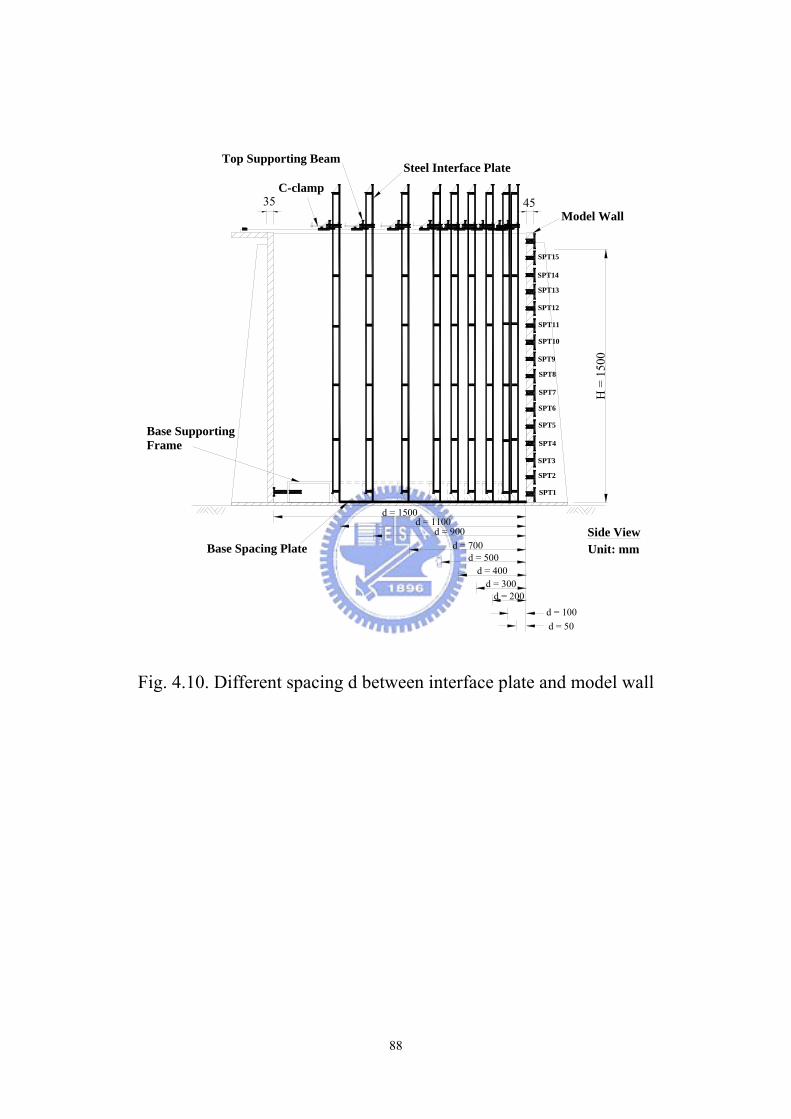
35 45Model Wall
Side View
Steel Interface PlateTop Supporting Beam
C-clamp
Base Supporting Frame
Base Spacing Plate
d = 1500d = 1100
d = 900d = 700
d = 500d = 400
d = 300d = 200
d = 100d = 50
Fig. 4.10. Different spacing d between interface plate and model wall
88
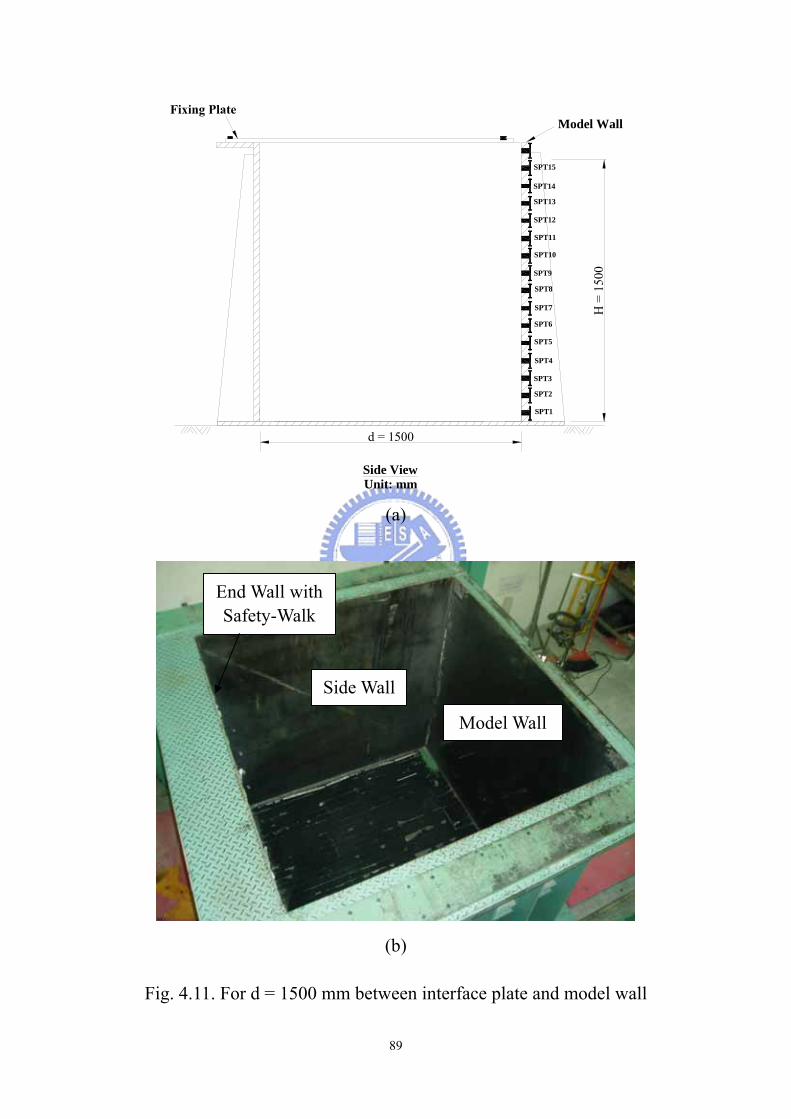
H =
150
0
Unit: mm
SPT1
SPT2
SPT3
SPT4
SPT5
SPT6
SPT7
SPT8
SPT9
SPT10
SPT11
SPT12
SPT13
SPT14
SPT15
Model Wall
Side View
d = 1500
(a)
(b)
Side Wall
End Wall with Safety-Walk
Model Wall
Fig. 4.11. For d = 1500 mm between interface plate and model wall
89
90
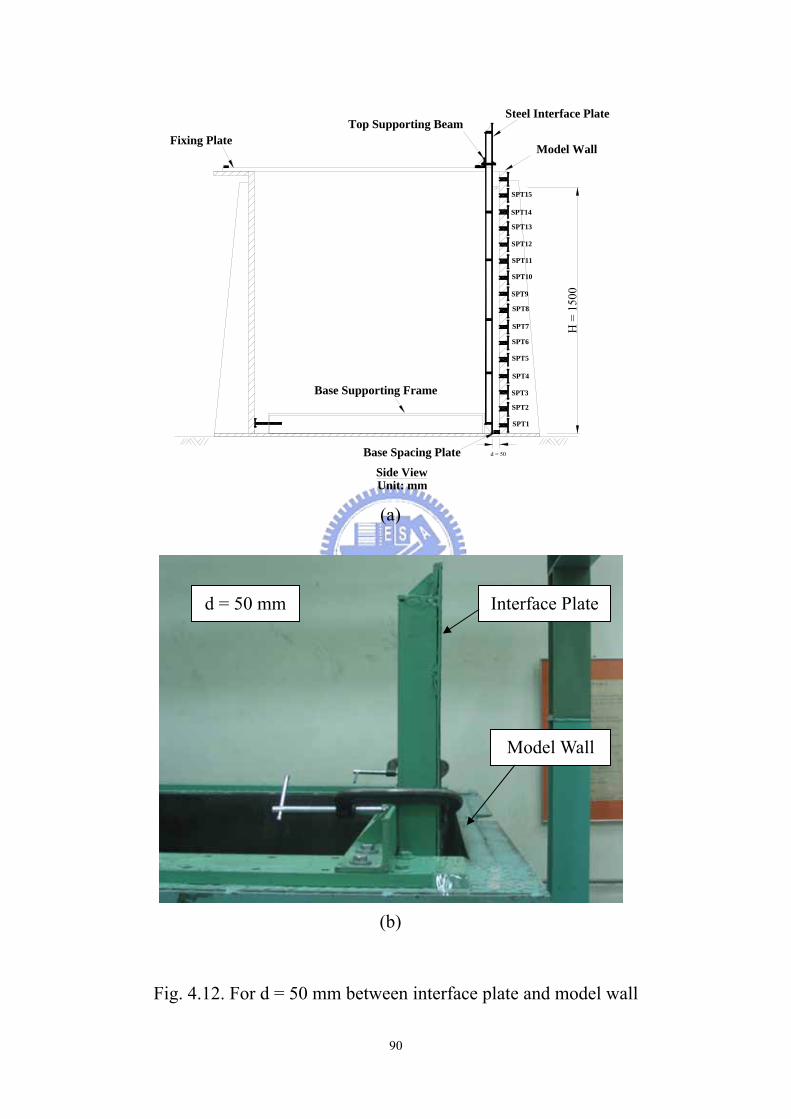
H =
150
0
Unit: mm
SPT1
SPT2
SPT3
SPT4
SPT5
SPT6
SPT7
SPT8
SPT9
SPT10
SPT11
SPT12
SPT13
SPT14
SPT15
Model Wall
Side View
Steel Interface PlateTop Supporting Beam
Base Supporting Frame
Base Spacing Plate
Fixing Plate
d = 50
(a)
(b)
Fig. 4.12. For d = 50 mm between interface plate and model wall
d = 50 mm Interface Plate
Model Wall

10.00 1.00 0.10 0.01Particle Diameter, mm
0
20
40
60
80
100Pe
rcen
t Fi
ner
by W
eigh
t (%
) Ottawa Silica SandASTM C-778
Fig. 5.1. Grain size distribution of Ottawa sand (after Chen, 2001)
91
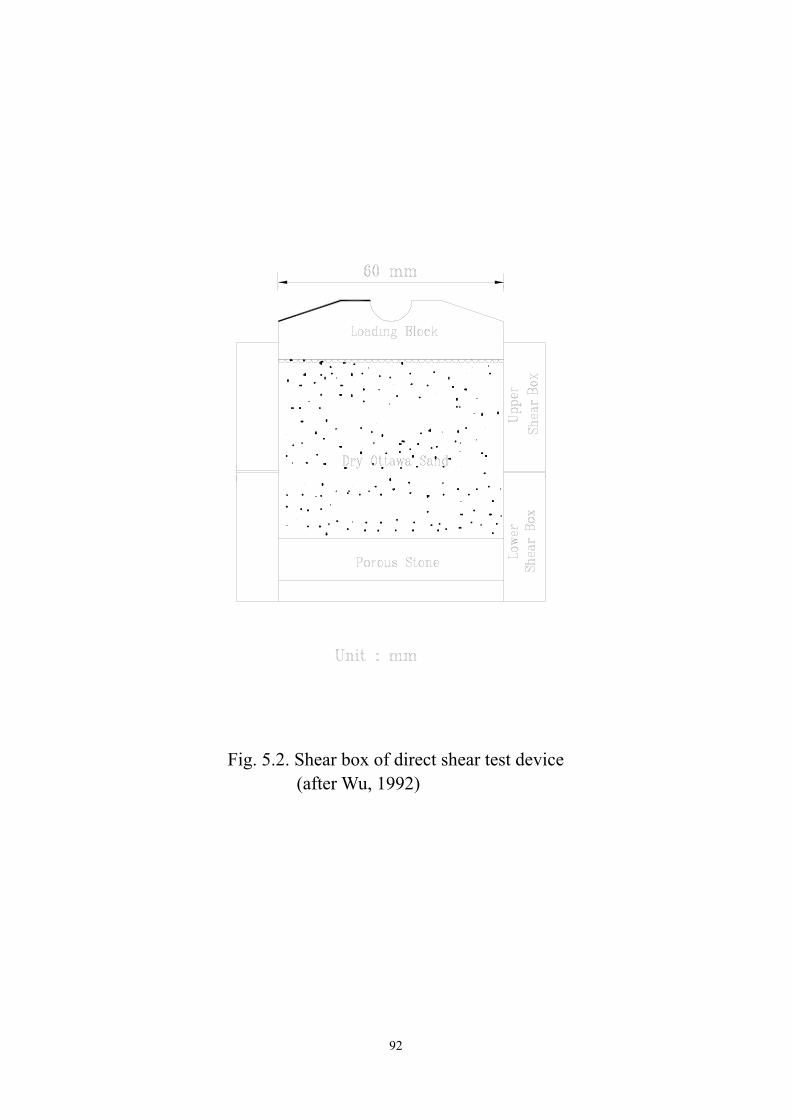
Fig. 5.2. Shear box of direct shear test device
(after Wu, 1992)
92
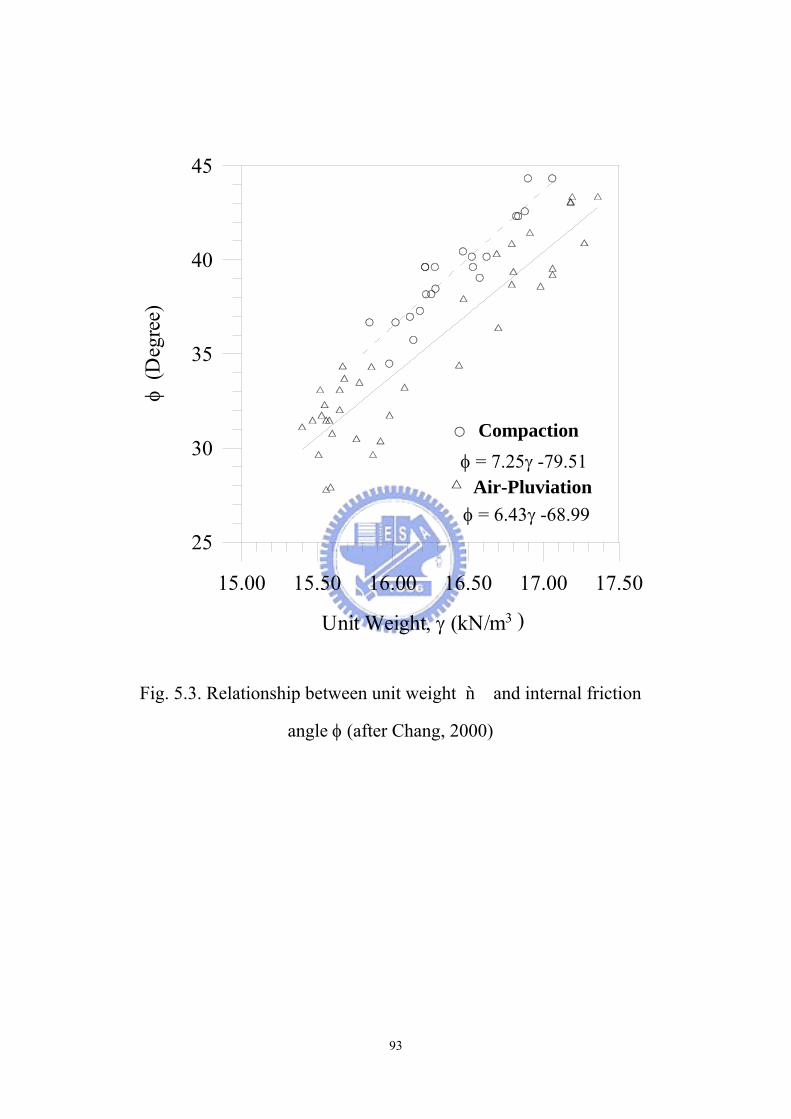
φ = 6.43γ -68.99Air-Pluviation
Compactionφ = 7.25γ -79.51
15.00 15.50 16.00 16.50 17.00 17.50
Unit Weight, γ (kN/m3 )
25
30
35
40
45φ
(Deg
ree)
Fig. 5.3. Relationship between unit weight γ and internal friction
angle φ (after Chang, 2000)
93
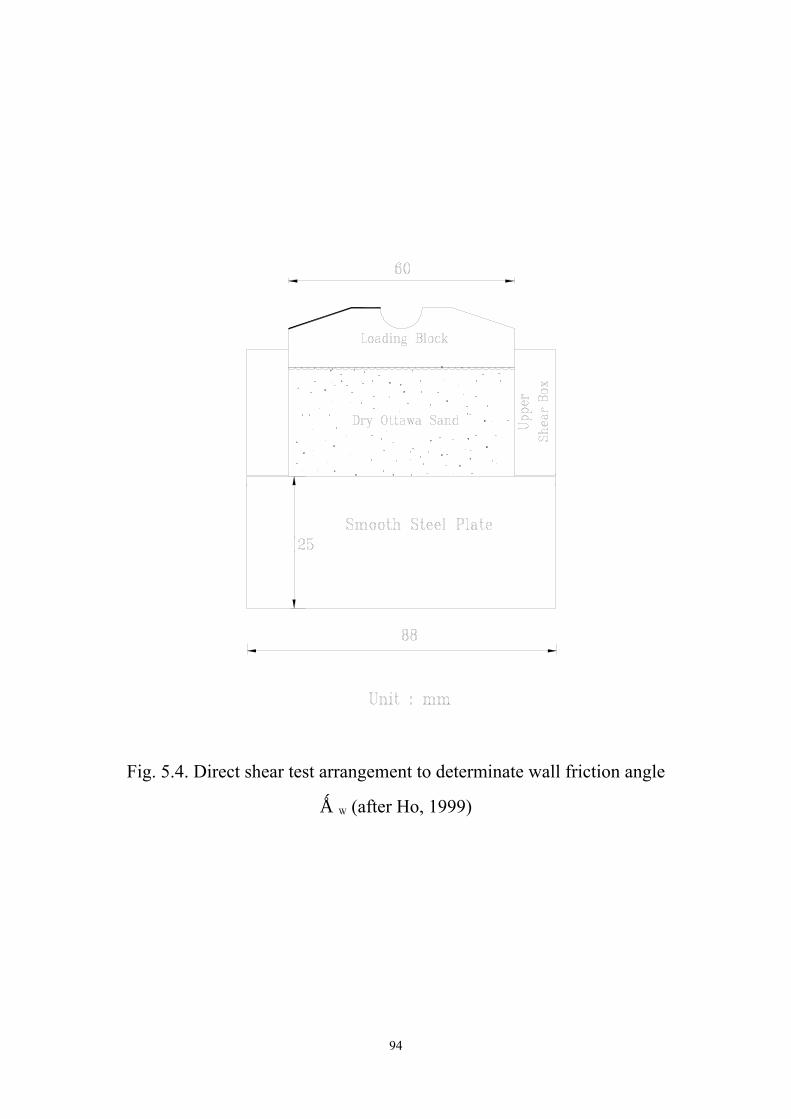
Fig. 5.4. Direct shear test arrangement to determinate wall friction angle
δW (after Ho, 1999)
94
15.50 15.75 16.00 16.25 16.50 16.75 17.00 17.25Unit Weight , γ (kN/m3)
8.0
9.0
10.0
11.0
12.0
13.0
14.0
15.0δ w
(deg
ree)
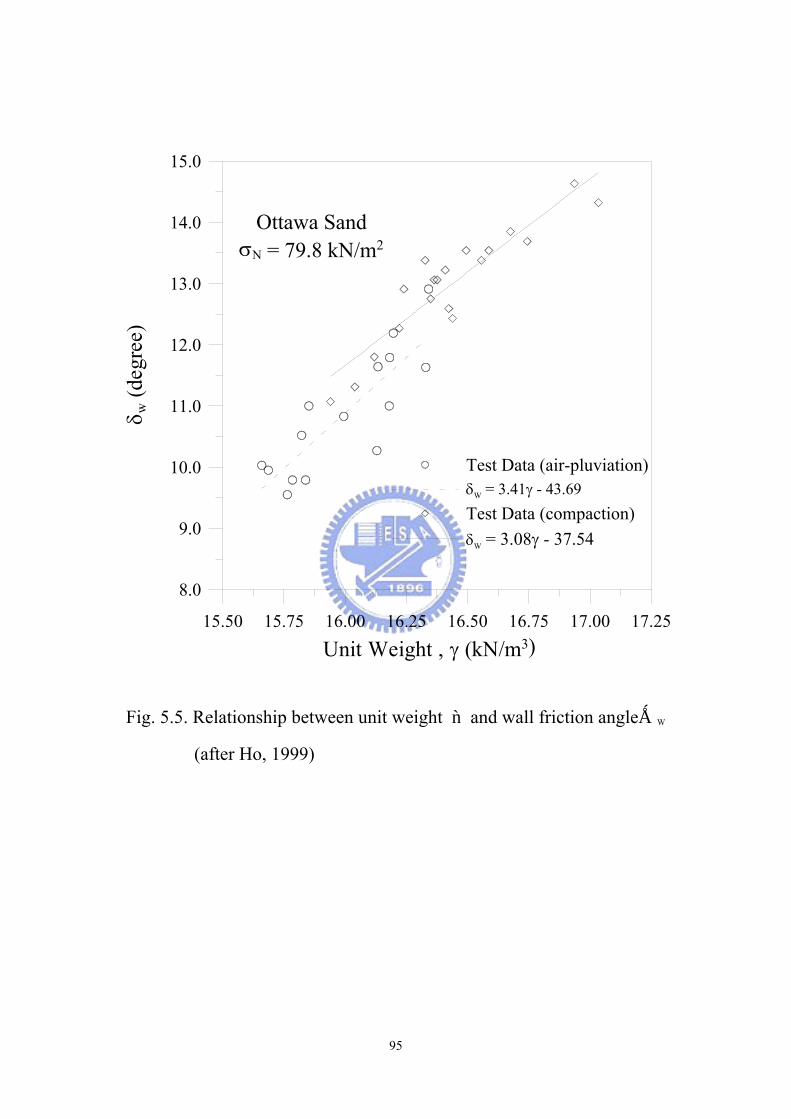
Test Data (air-pluviation)δW = 3.41γ - 43.69Test Data (compaction)δW = 3.08γ - 37.54
Ottawa SandσN = 79.8 kN/m2
Fig. 5.5. Relationship between unit weight γand wall friction angleδW
(after Ho, 1999)
95
96
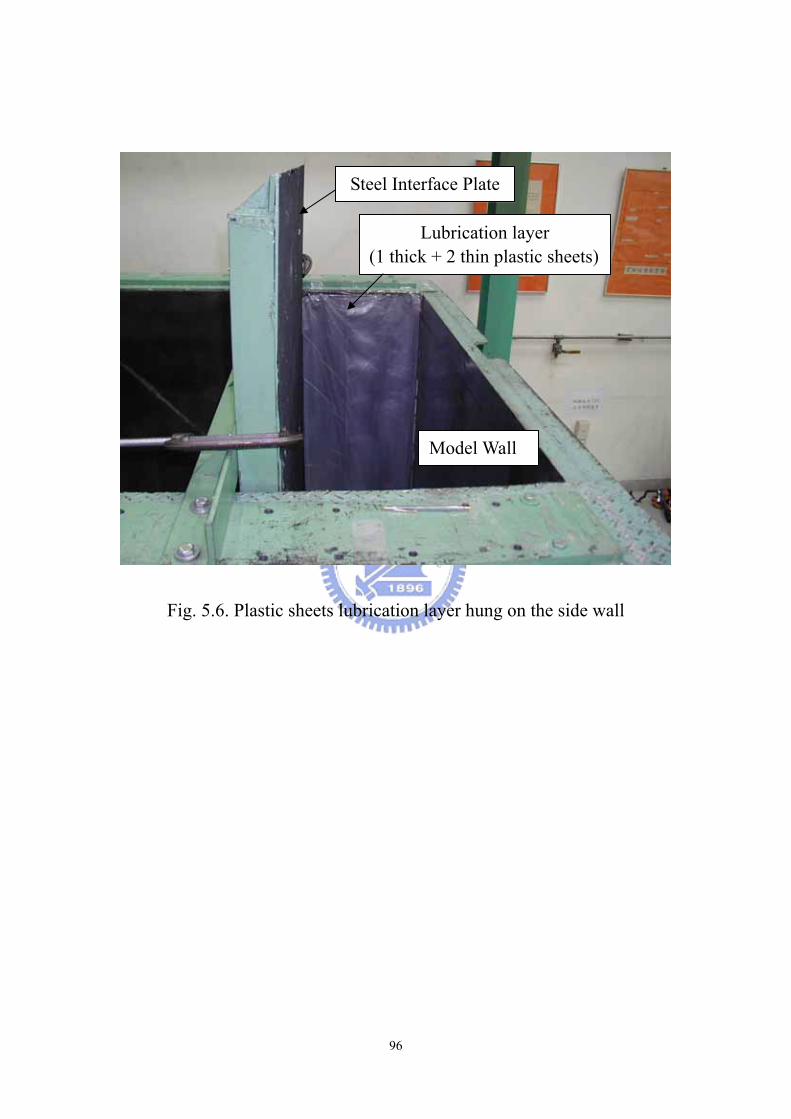
Fig. 5.6. Plastic sheets lubrication layer hung on the side wall
Lubrication layer (1 thick + 2 thin plastic sheets)
Steel Interface Plate
Model Wall
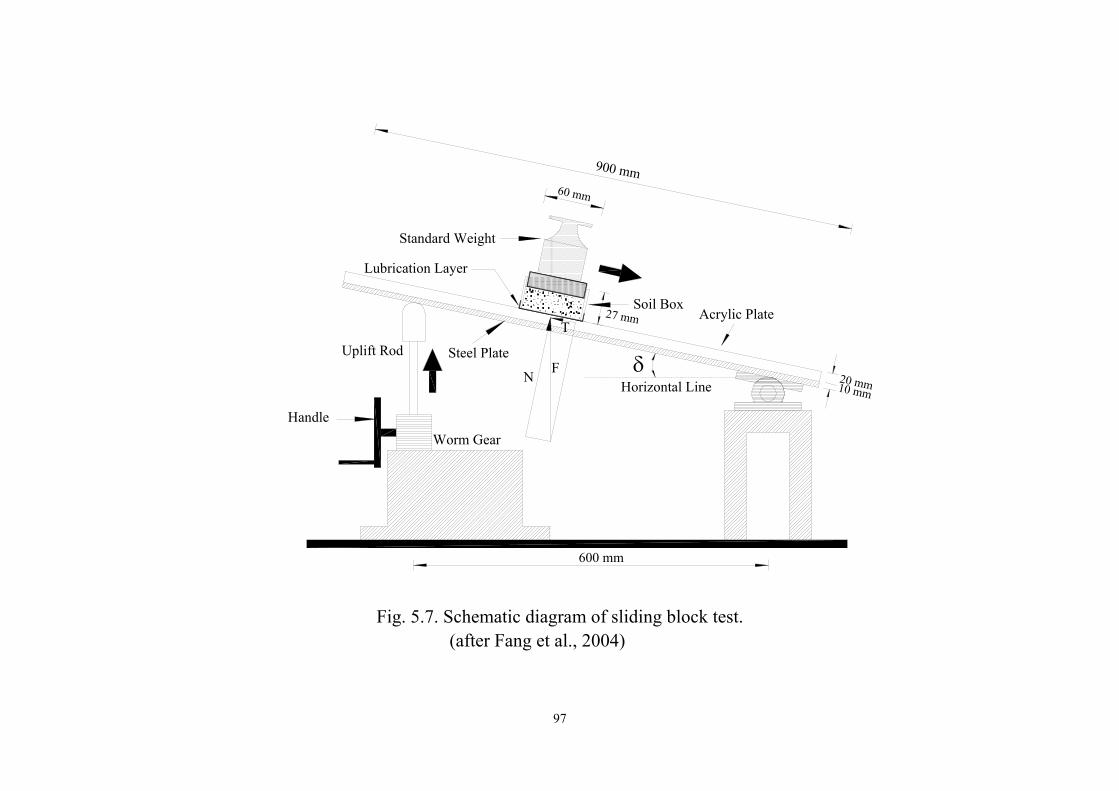
Fig. 5.7. Schematic diagram of sliding block test. (after Fang et al., 2004)
97
δ
Lubrication Layer
Handle
Standard Weight
Soil Box
Uplift Rod
Worm Gear
Horizontal LineN
T
F
27 mm
60 mm
Acrylic Plate
20 mm10 mm
Steel Plate
900 mm
600 mm

Uplift rod
Worm gear
Handle
Ball bearing
←
Plastic sheet ↘ ↙ Soil box↙ Sliding plate
Standard weight↓
Fig. 5.8. Sliding block test apparatus
(after Fang et al., 2004)
98

Sliding Block Test Plastic-sheet method 1 thick + 2 thin sheeting
1 10Normal Stress, σ (
5
15
0
10
20Fr
ictio
n A
ngle
, δ (d
egre
e)
Fig. 5.9. Variation of interface friction angle
(after Fang et al., 2004)
99
o
δ = 7 5100kN/m2)
δp = 7.5°
δp with normal stress
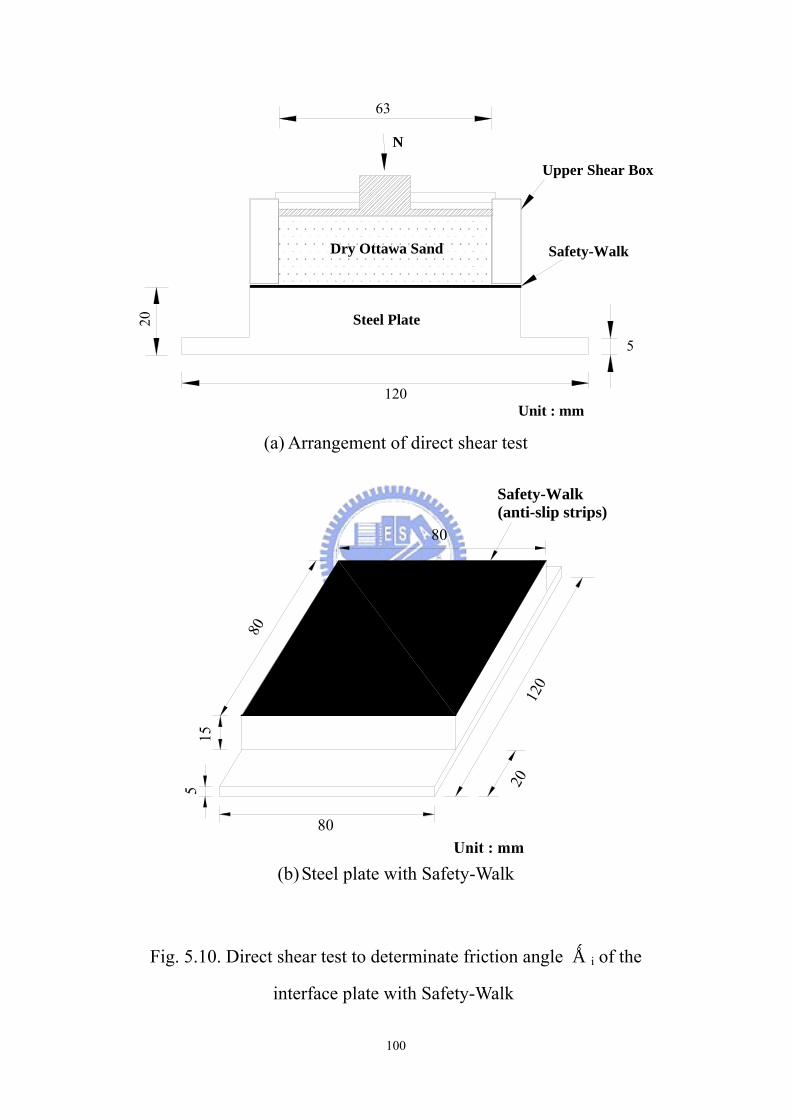
120
20
63
Dry Ottawa Sand
Steel Plate
Safety-Walk
N
5
Upper Shear Box
Unit : mm
(a) Arrangement of direct shear test
80
120
15
20
80
80
Safety-Walk(anti-slip strips)
(b) Steel plate with Safety-Walk
Fig. 5.10. Direct shear test to determinate friction angle δi of the
interface plate with Safety-Walk
100
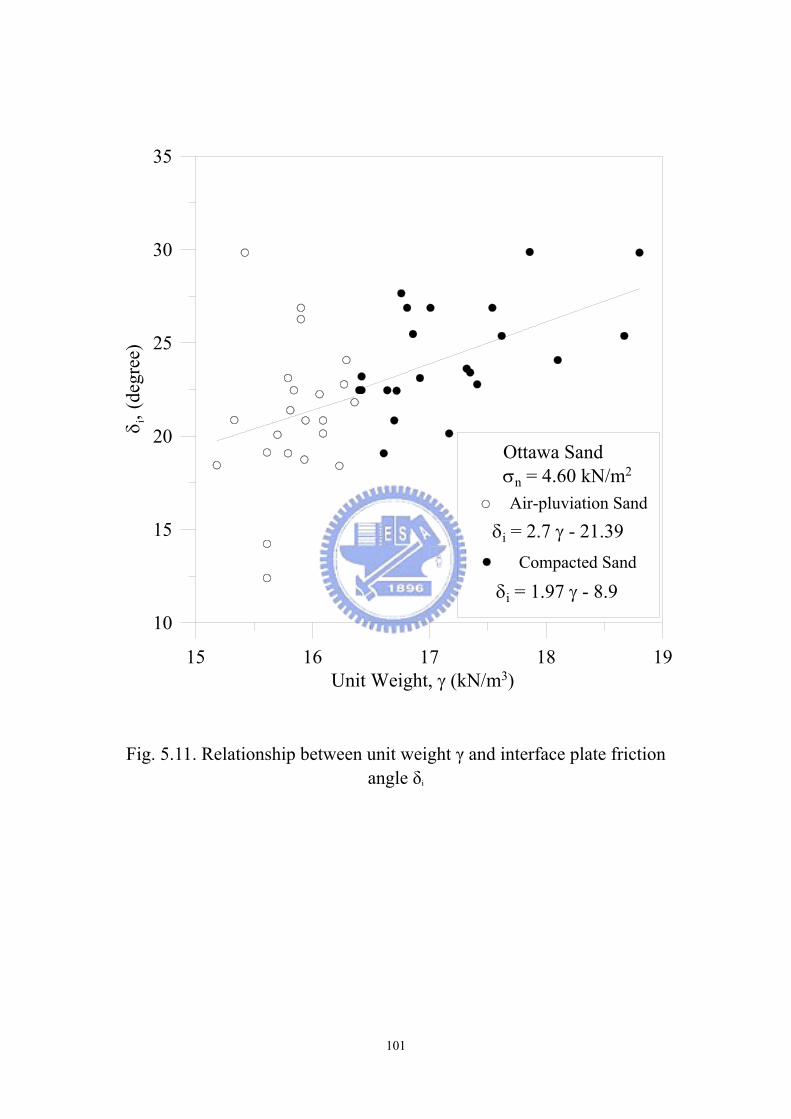
15 16 17 18 19Unit Weight, γ (kN/m3)
10
15
20
25
30
35δ i
, (de
gree
)
Air-pluviation Sand
Compacted Sand
δi = 2.7 γ - 21.39
δi = 1.97 γ - 8.9
Ottawa Sandσn = 4.60 kN/m2
Fig. 5.11. Relationship between unit weight γ and interface plate friction
angle δi
101
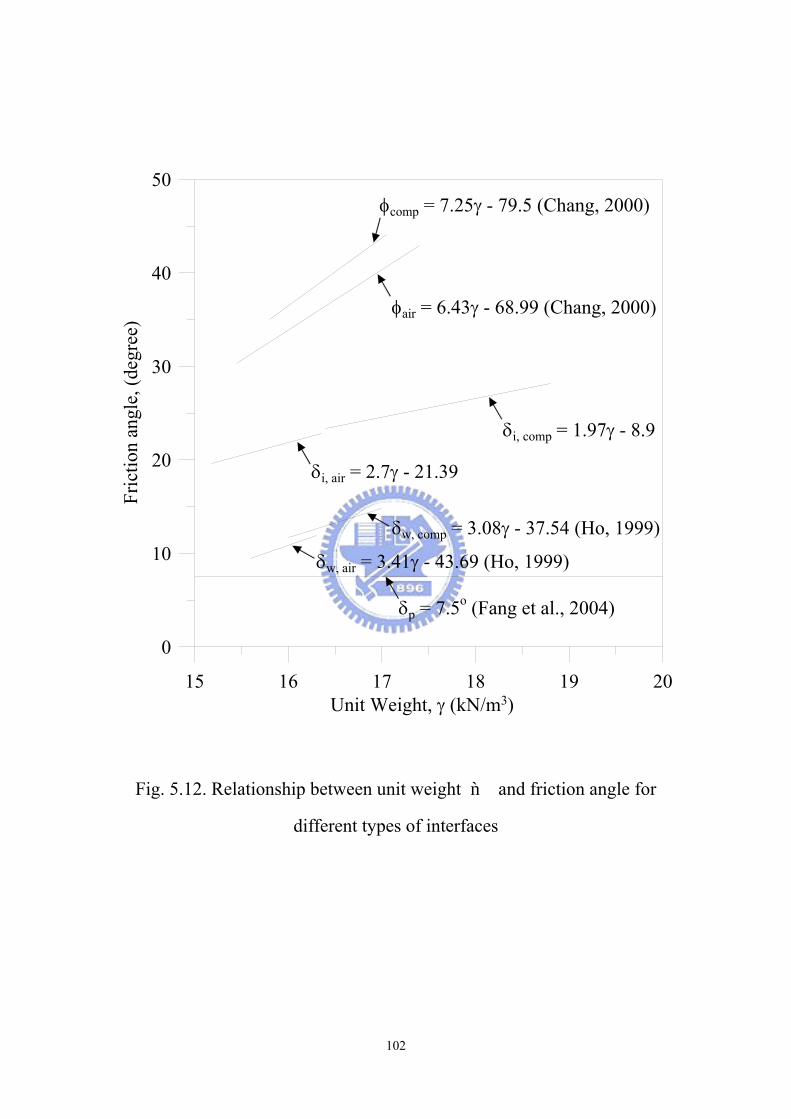
15 16 17 18 19 20Unit Weight, γ (kN/m3)
0
10
20
30
40
50
Fric
tion
angl
e, (d
egre
e)
δp = 7.5o (Fang et al., 2004)
φair = 6.43γ - 68.99 (Chang, 2000)
φcomp = 7.25γ - 79.5 (Chang, 2000)
δi, comp = 1.97γ - 8.9
δi, air = 2.7γ - 21.39
δw, comp = 3.08γ - 37.54 (Ho, 1999)
δw, air = 3.41γ - 43.69 (Ho, 1999)
ip between unit weight γ aFig. 5.12. Relationsh nd friction angle for
different types of interfaces
102
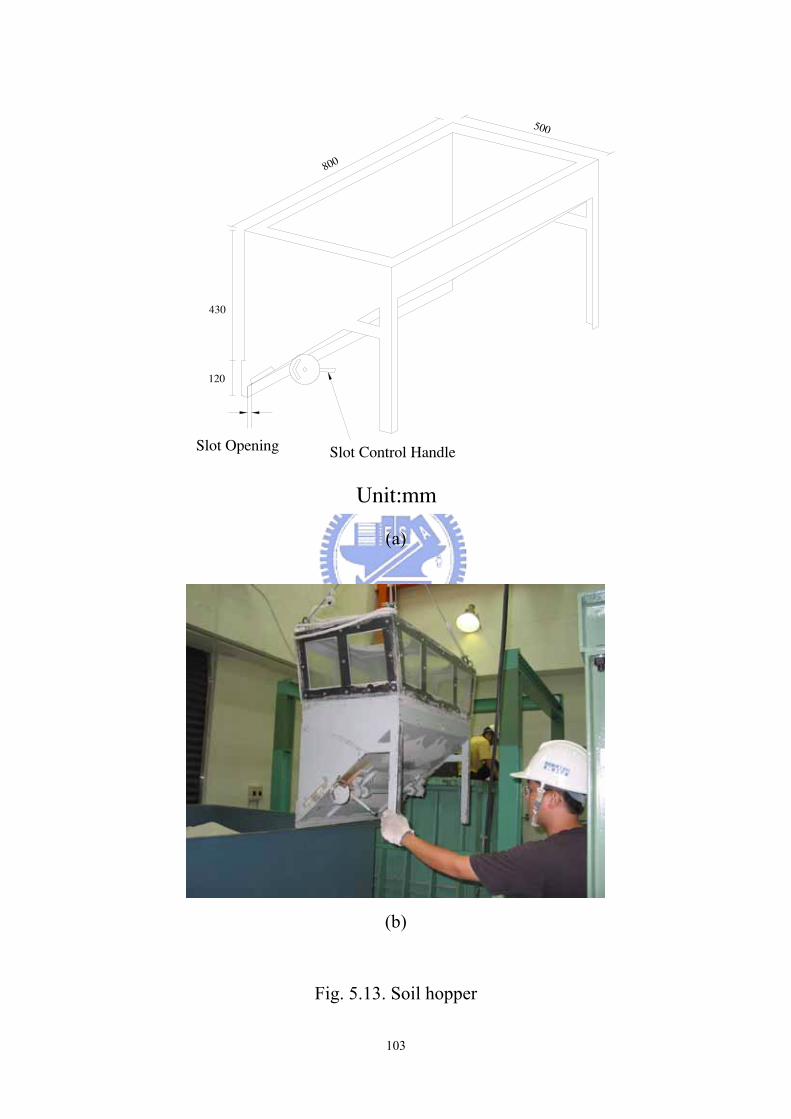
Unit:mm
500
800
430
120
Slot Control HandleSlot Opening
(a)
(b)
Fig. 5.13. Soil hopper
103
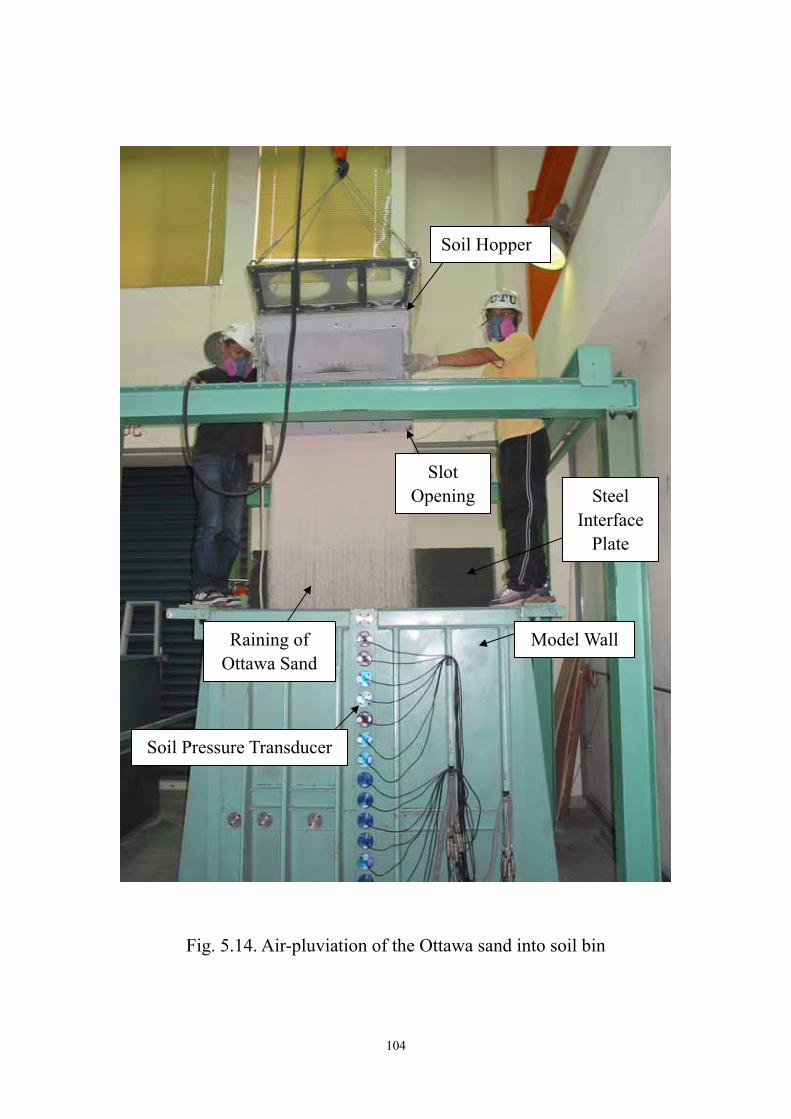
Raining of Ottawa Sand
Model Wall
Slot Opening Steel
Interface Plate
Soil Pressure Transducer
Soil Hopper
Fig. 5.14. Air-pluviation of the Ottawa sand into soil bin
104
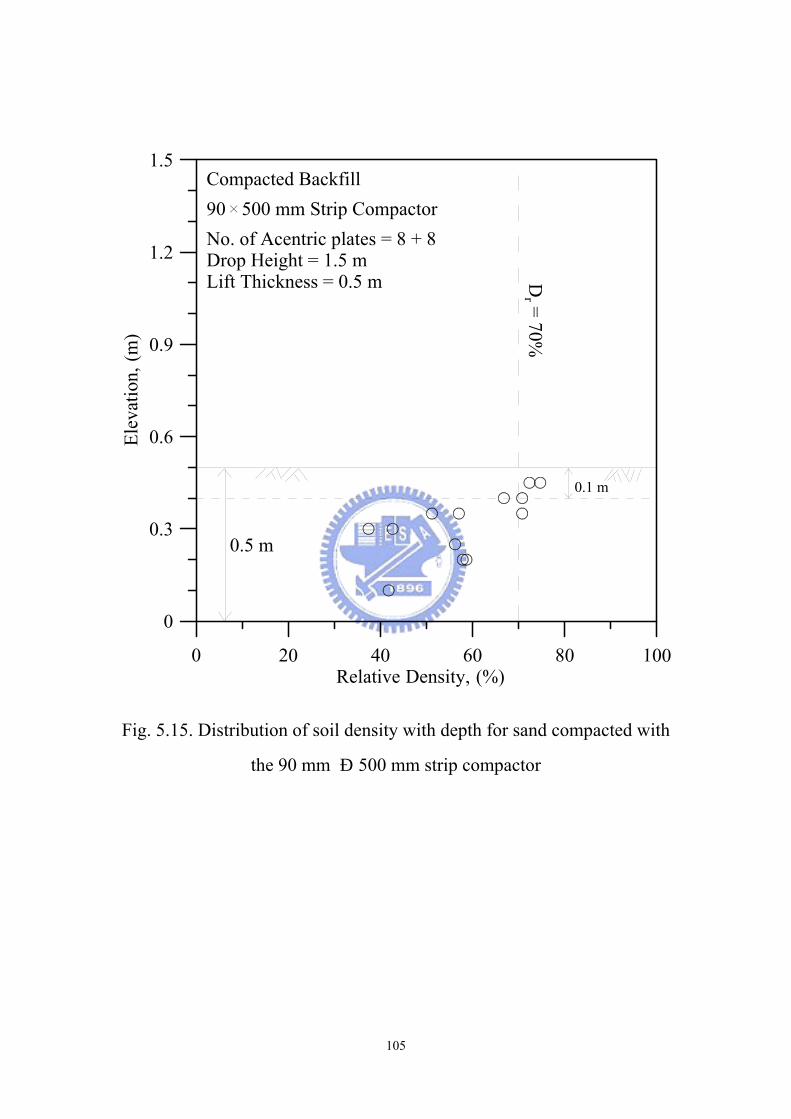
0 20 40 60 80 100Relative Density, (%)
0
0.3
0.6
0.9
1.2
1.5El
evat
ion,
(m)
Compacted Backfill90k500 mm Strip CompactorNo. of Acentric plates = 8 + 8Drop Height = 1.5 mLift Thickness = 0.5 m D
r = 70%
0.1 m
0.5 m
Fig. 5.15. Distribution of soil density with depth for sand compacted with
the 90 mm × 500 mm strip compactor
105

Soil Pressure Transducer
Plastic-Sheets Lubricating Layer
90 mm x 500 mm Strip Compactor Plate
Steel Tube
Model Wall
Fig. 5.16. Backfill compacted with 90 mm × 500 mm strip compactor
106
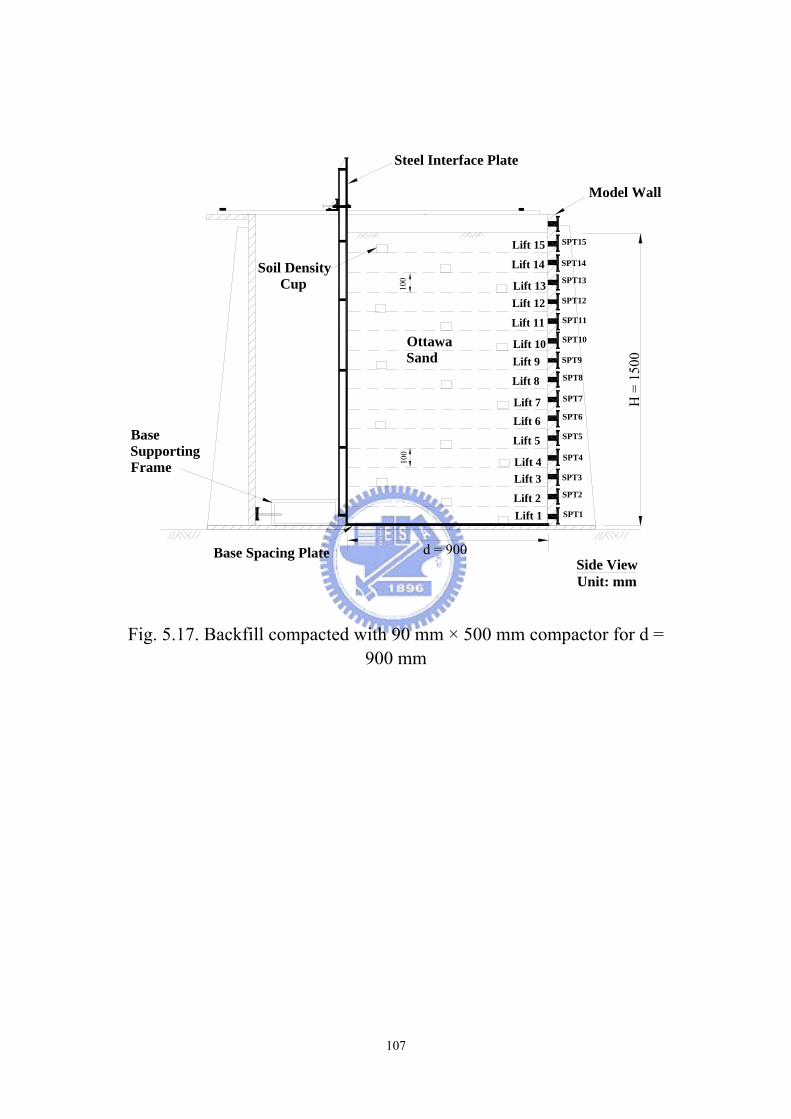
H =
150
0
Unit: mm
SPT1
SPT2
SPT3
SPT4
SPT5
SPT6
SPT7
SPT8
SPT9
SPT10
SPT11
SPT12
SPT13
SPT14
SPT15
Model Wall
Side View
Lift 3
Lift 2Lift 1
Lift 6
Lift 5
Lift 4
Lift 9
Lift 8
Lift 7
Lift 12
Lift 11
Lift 10
Lift 13
Lift 14
Lift 15
d = 900
Steel Interface Plate
Base Supporting Frame
Ottawa Sand
Soil Density Cup
Base Spacing Plate
100
100
Fig. 5.17. Backfill compacted with 90 mm × 500 mm compactor for d =
900 mm
107
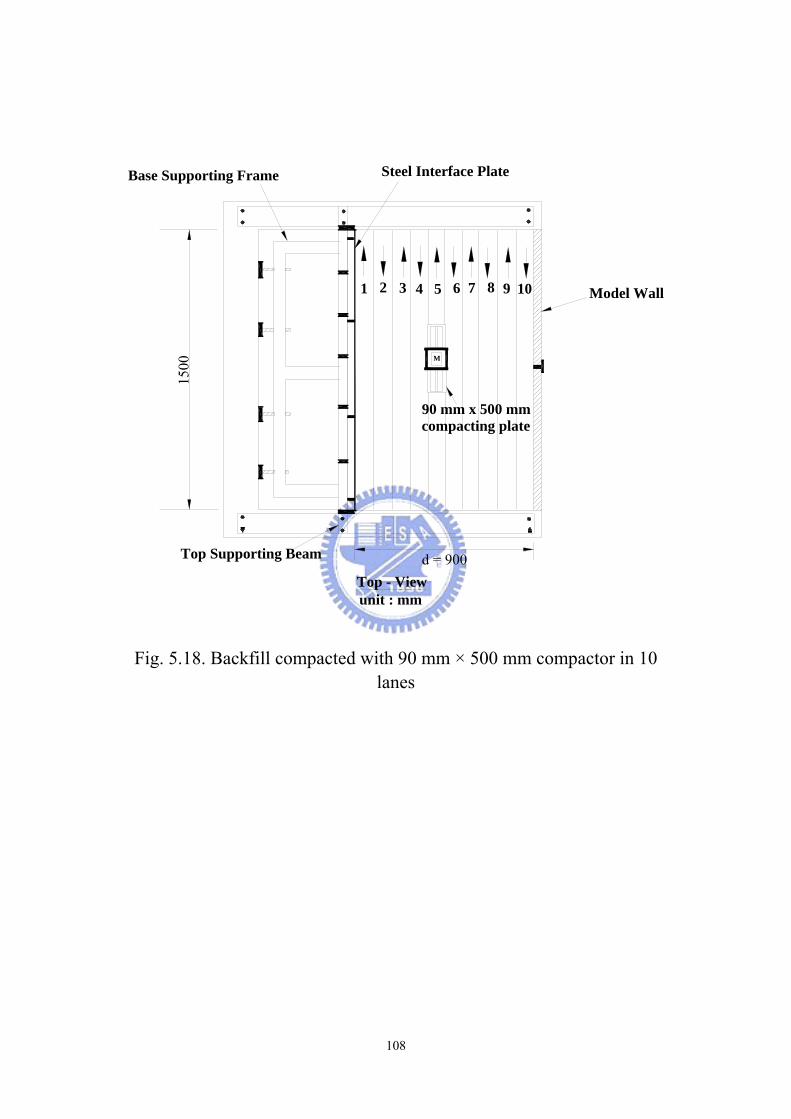
Model Wall
unit : mmTop - View
1500
Base Supporting Frame
d = 900Top Supporting Beam
1 2 43 65 87 109
Steel Interface Plate
M
90 mm x 500 mm compacting plate
Fig. 5.18. Backfill compacted with 90 mm × 500 mm compactor in 10 lanes
108
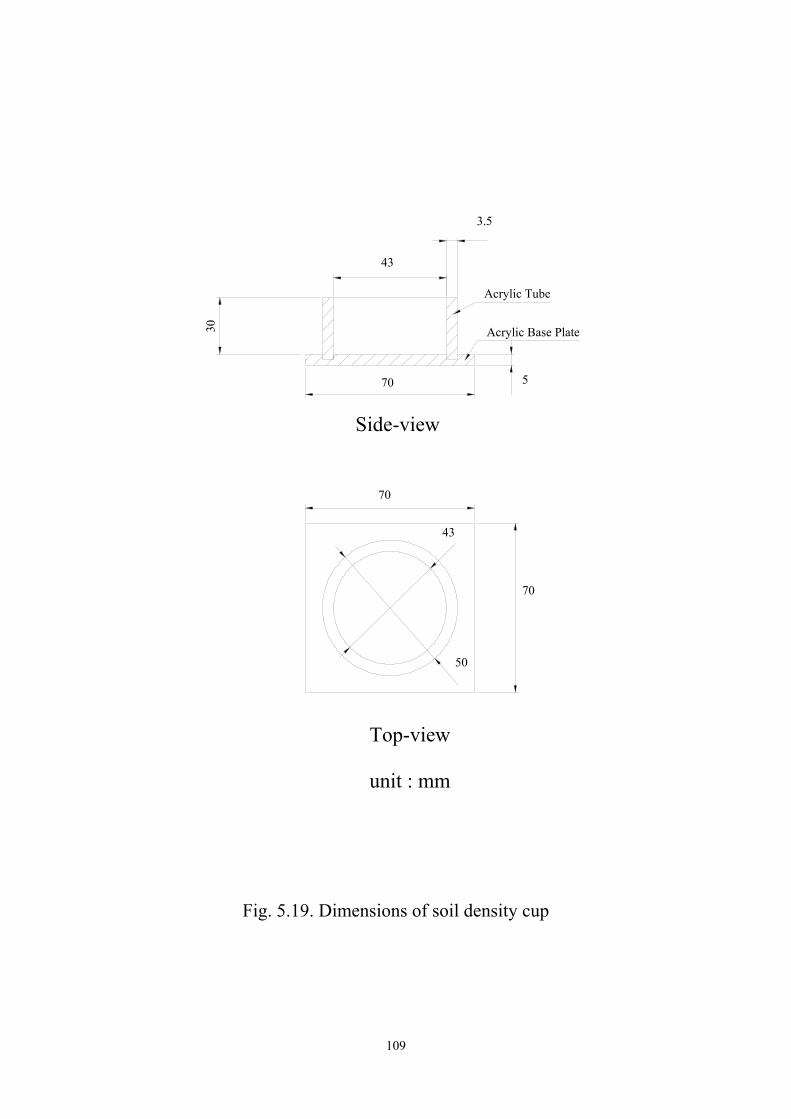
Fig. 5.19. Dimensions of soil density cup
109
unit : mm
Top-view
Side-view
Acrylic Tube
Acrylic Base Plate30
5
43
3.5
70
70
70
43
50
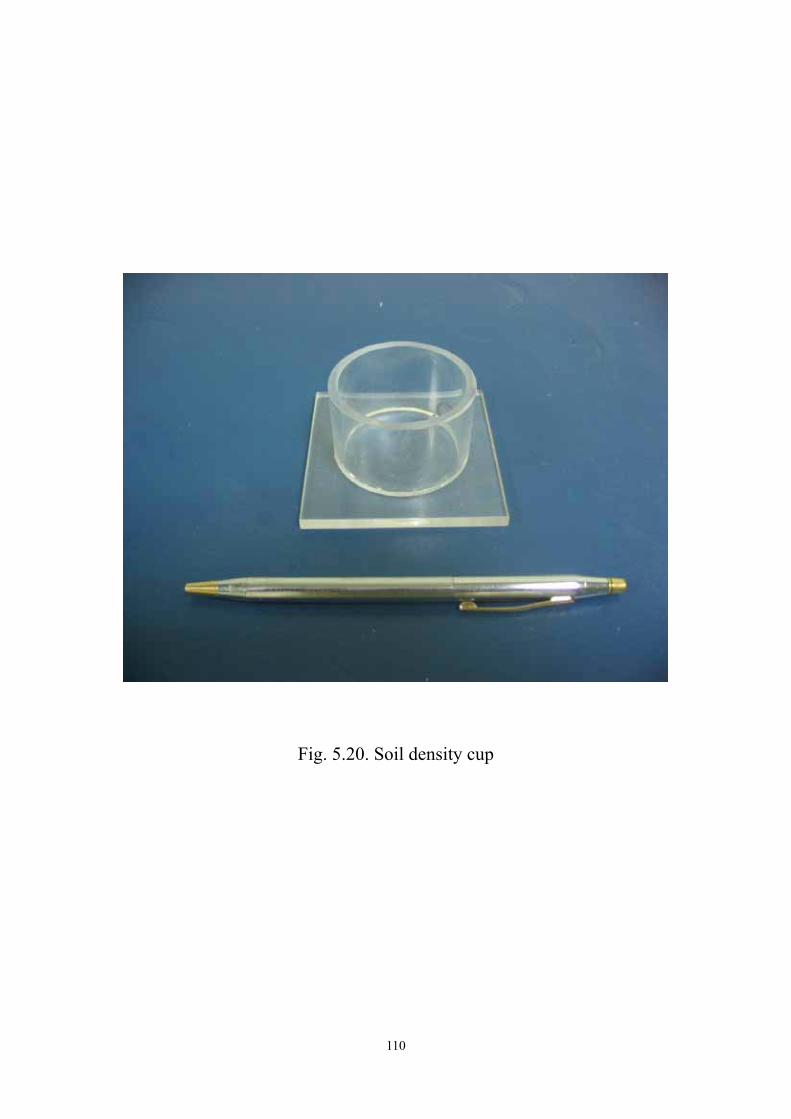
Fig. 5.20. Soil density cup
110
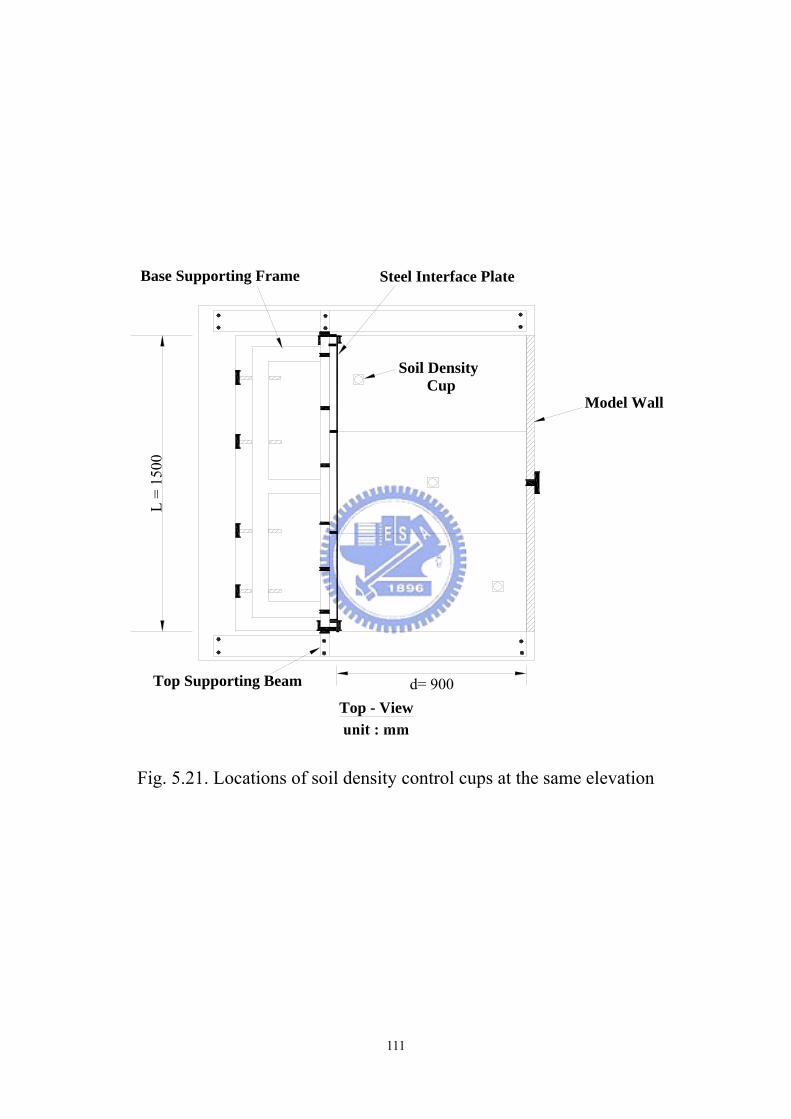
Model Wall
Steel Interface Plate
Top - View
L =
1500
Soil Density Cup
Base Supporting Frame
d= 900Top Supporting Beam
Fig. 5.21. Locations of soil density control cups at the same elevation
111

(a) Placement of soil density cup
(b) Cup filled and Buried in Backfill
(c) Compaction of soil
(d) Soil density dug out
VWs
d =γ
(e) Soil mass in cup weighted (f) Calculation of dry density
Fig. 5.22. Procedure of density control test
112
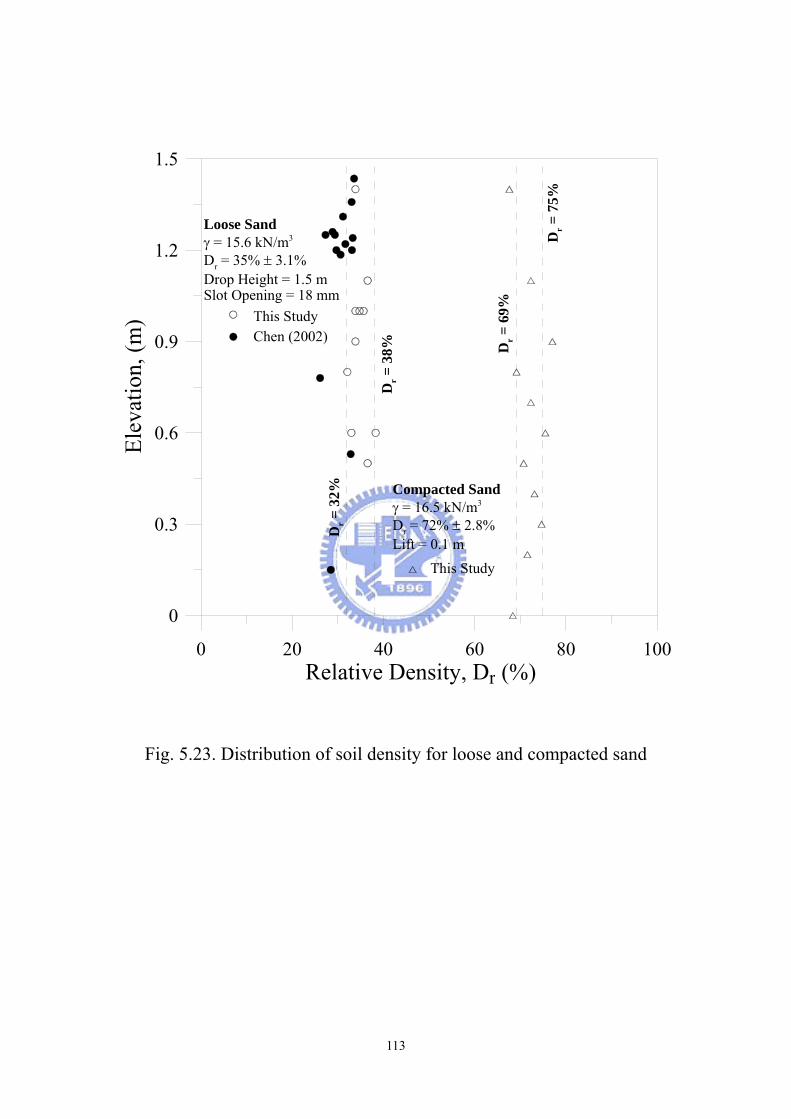
0 20 40 60 80Relative Density, D
100r (%)
0
0.3
0.6
0.9
1.2
1.5El
evat
ion,
(m) This Study
Chen (2002)
Compacted Sandγ = 16.5 kN/m3
Dr = 72% ± 2.8%Lift = 0.1 m
Loose Sandγ = 15.6 kN/m3
Dr = 35% ± 3.1%Drop Height = 1.5 mSlot Opening = 18 mm
Dr =
32%
Dr =
38% D
r = 6
9%
Dr =
75%
This Study
Fig. 5.23. Distribution of soil density for loose and compacted sand
113
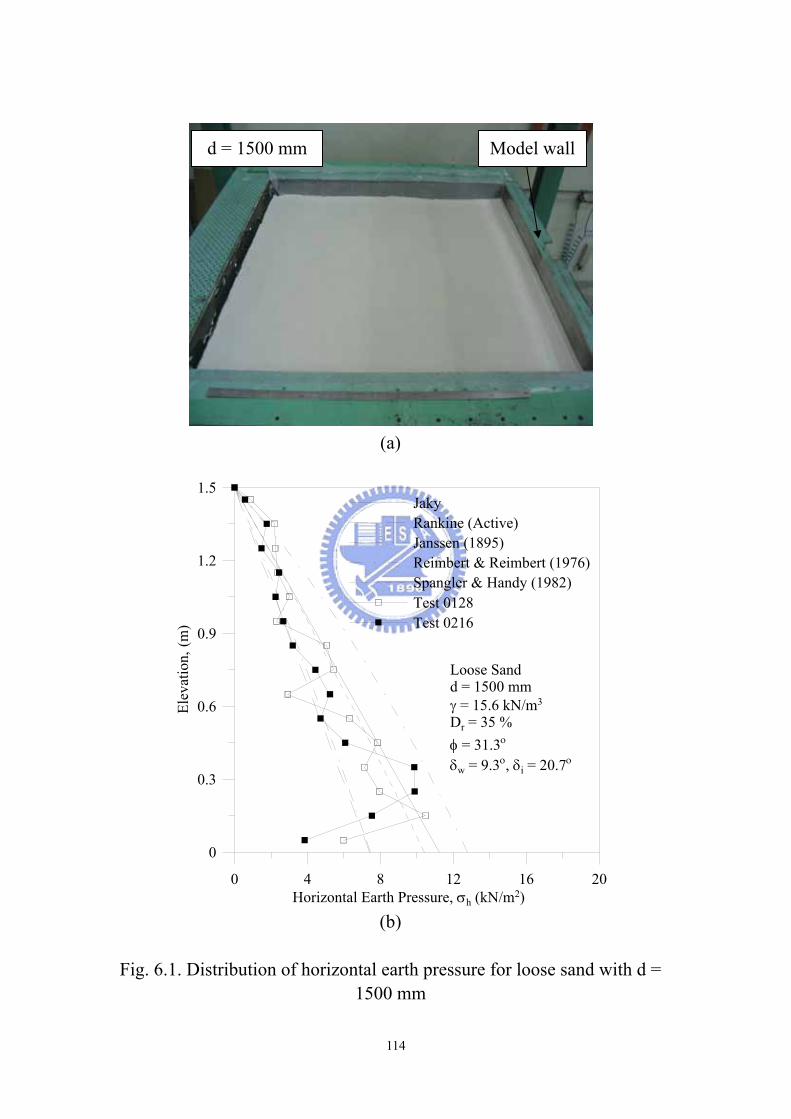
(a)
0 4 8 12 16 20Horizontal Earth Pressure, σh (kN/m2)
0
0.3
0.6
0.9
1.2
1.5
Elev
atio
n, (m
)
JakyRankine (Active)Janssen (1895)Reimbert & Reimbert (1976)Spangler & Handy (1982)Test 0128Test 0216
Loose Sandd = 1500 mmγ = 15.6 kN/m3
Dr = 35 %φ = 31.3ο
δw = 9.3ο, δi = 20.7ο
(b)
Fig. 6.1. Distribution of horizontal earth pressure for loose sand with d =
1500 mm
d = 1500 mm Model wall
114

0 4 8 12 16 20Horizontal Earth Pressure, σh (kN/m2)
0
0.3
0.6
0.9
1.2
1.5
Elev
atio
n, (m
)
JakyRankine (Active)Janssen (1895)Reimbert & Reimbert (1976)Spangler & Handy (1982)Test 0616Test 0619
Loose Sandd = 1100 mmγ = 15.6 kN/m3
Dr = 35 %φ = 31.3ο
δw = 9.3ο, δi = 20.7ο
Fig. 6.2. Distribution of horizontal earth pressure for loose sand with d =
1100 mm
0 4 8 12 16Horizontal Earth Pressure, σh (kN/m2)
20
0
0.3
0.6
0.9
1.2
1.5
Elev
atio
n, (m
)
JakyRankine (Active)Janssen (1895)Reimbert & Reimbert (1976)Spangler & Handy (1982)Test 0503
Loose Sandd = 900 mmγ = 15.6 kN/m3
Dr = 35 %φ = 31.3ο
δw = 9.3ο, δi = 20.7ο
Fig. 6.3. Distribution of horizontal earth pressure for loose sand with d =
900 mm
115
0 4 8 12 16Horizontal Earth Pressure, σh (kN/m2)
20
0
0.3
0.6
0.9
1.2
1.5
Elev
atio
n, (m
)
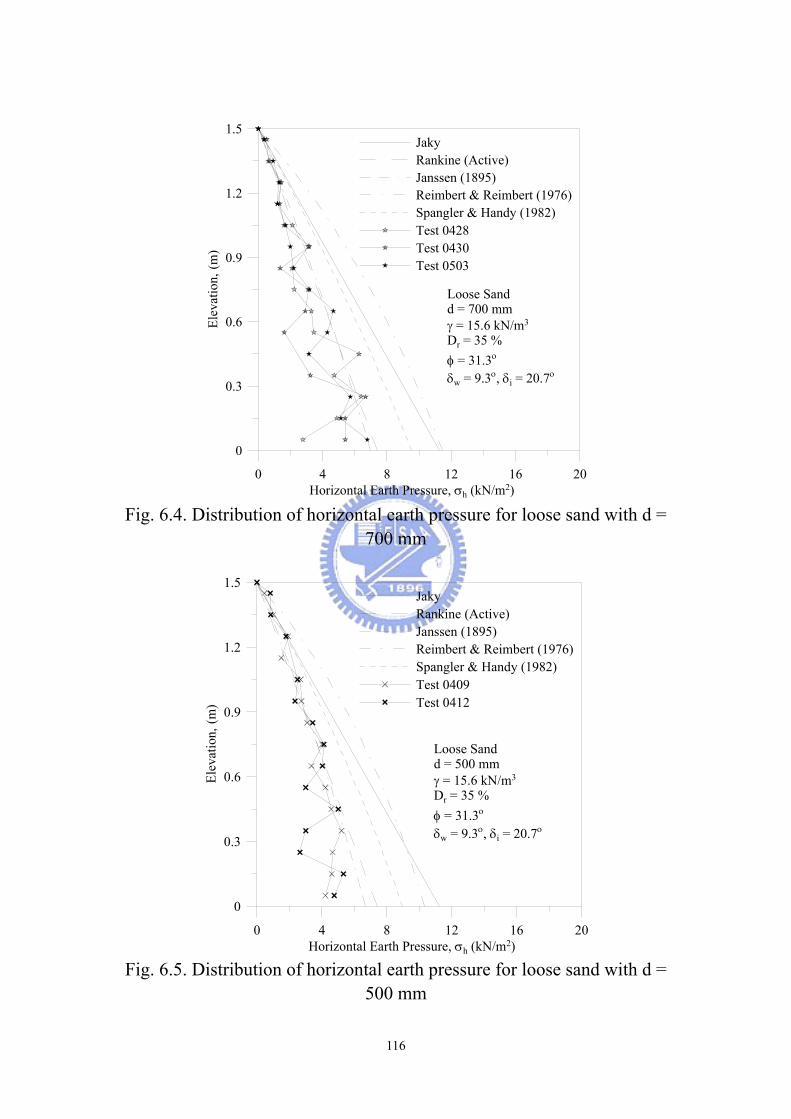
JakyRankine (Active)Janssen (1895)Reimbert & Reimbert (1976)Spangler & Handy (1982)Test 0428Test 0430Test 0503
Loose Sandd = 700 mmγ = 15.6 kN/m3
Dr = 35 %φ = 31.3ο
δw = 9.3ο, δi = 20.7ο
Fig. 6.4. Distribution of horizontal earth pressure for loose sand with d =
700 mm
0 4 8 12 16 2Horizontal Earth Pressure, σh (kN/m2)
0
0
0.3
0.6
0.9
1.2
1.5
Elev
atio
n, (m
)
JakyRankine (Active)Janssen (1895)Reimbert & Reimbert (1976)Spangler & Handy (1982)Test 0409Test 0412
Loose Sandd = 500 mmγ = 15.6 kN/m3
Dr = 35 %φ = 31.3ο
δw = 9.3ο, δi = 20.7ο
Fig. 6.5. Distribution of horizontal earth pressure for loose sand with d =
500 mm
116
0 4 8 12 16 20Horizontal Earth Pressure, σh (kN/m2)
0
0.3
0.6
0.9
1.2
1.5
Elev
atio
n, (m
)
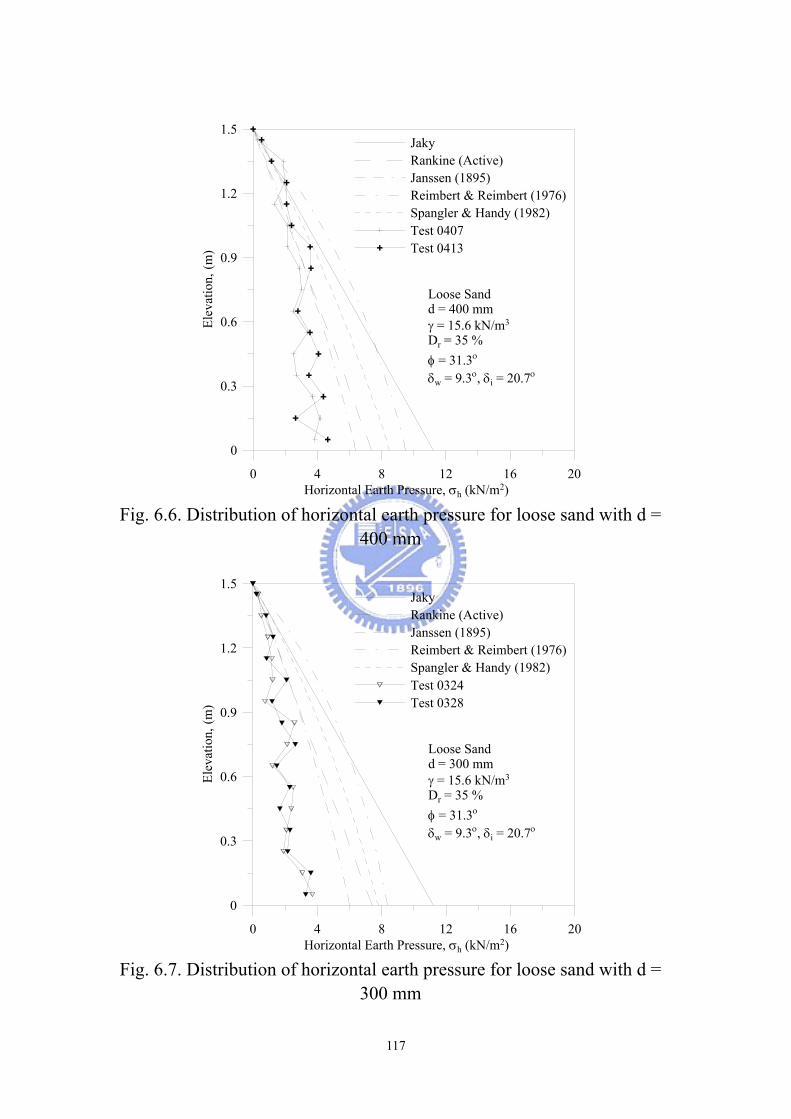
JakyRankine (Active)Janssen (1895)Reimbert & Reimbert (1976)Spangler & Handy (1982)Test 0407Test 0413
Loose Sandd = 400 mmγ = 15.6 kN/m3
Dr = 35 %φ = 31.3ο
δw = 9.3ο, δi = 20.7ο
Fig. 6.6. Distribution of horizontal earth pressure for loose sand with d =
400 mm
0 4 8 12 16Horizontal Earth Pressure, σh (kN/m2)
20
0
0.3
0.6
0.9
1.2
1.5
Elev
atio
n, (m
)
JakyRankine (Active)Janssen (1895)Reimbert & Reimbert (1976)Spangler & Handy (1982)Test 0324Test 0328
Loose Sandd = 300 mmγ = 15.6 kN/m3
Dr = 35 %φ = 31.3ο
δw = 9.3ο, δi = 20.7ο
Fig. 6.7. Distribution of horizontal earth pressure for loose sand with d =
300 mm
117
0 4 8 12 16Horizontal Earth Pressure, σh (kN/m2)
20
0
0.3
0.6
0.9
1.2
1.5
Elev
atio
n, (m
)
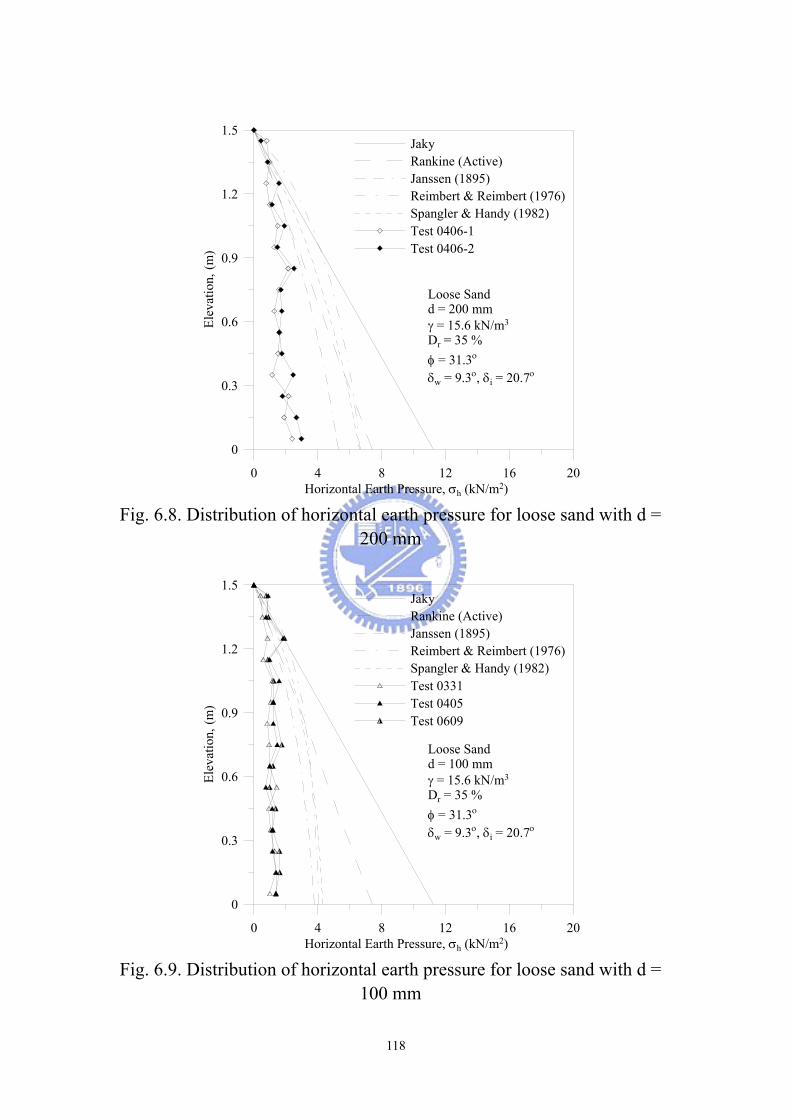
JakyRankine (Active)Janssen (1895)Reimbert & Reimbert (1976)Spangler & Handy (1982)Test 0406-1Test 0406-2
Loose Sandd = 200 mmγ = 15.6 kN/m3
Dr = 35 %φ = 31.3ο δw = 9.3ο, δi = 20.7ο
Fig. 6.8. Distribution of horizontal earth pressure for loose sand with d =
200 mm
0 4 8 12 16Horizontal Earth Pressure, σh (kN/m2)
20
0
0.3
0.6
0.9
1.2
1.5
Elev
atio
n, (m
)
JakyRankine (Active)Janssen (1895)Reimbert & Reimbert (1976)Spangler & Handy (1982)Test 0331Test 0405Test 0609
Loose Sandd = 100 mmγ = 15.6 kN/m3
Dr = 35 %φ = 31.3ο δw = 9.3ο, δi = 20.7ο
Fig. 6.9. Distribution of horizontal earth pressure for loose sand with d =
100 mm
118
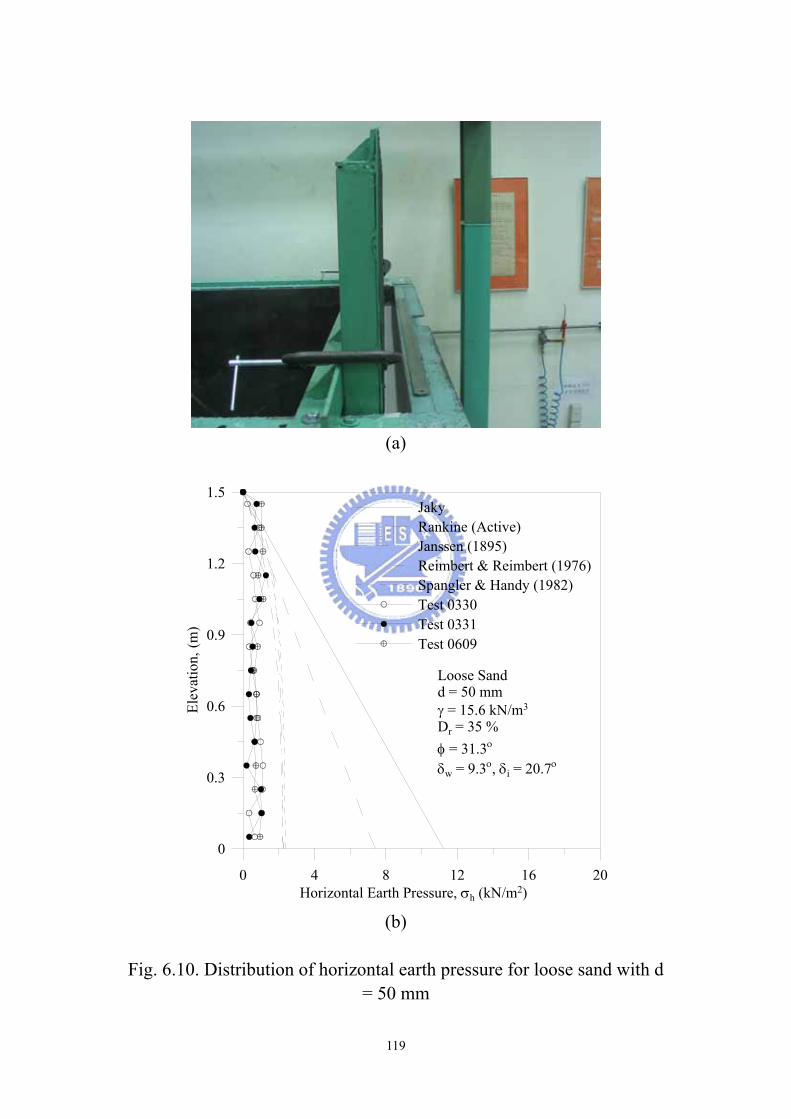
(a)
0 4 8 12 16 2Horizontal Earth Pressure, σh (kN/m2)
0
0
0.3
0.6
0.9
1.2
1.5
Elev
atio
n, (m
)
JakyRankine (Active)Janssen (1895)Reimbert & Reimbert (1976)Spangler & Handy (1982)Test 0330Test 0331Test 0609
Loose Sandd = 50 mmγ = 15.6 kN/m3
Dr = 35 %φ = 31.3ο
δw = 9.3ο, δi = 20.7ο
(b)
Fig. 6.10. Distribution of horizontal earth pressure for loose sand with d
= 50 mm
119
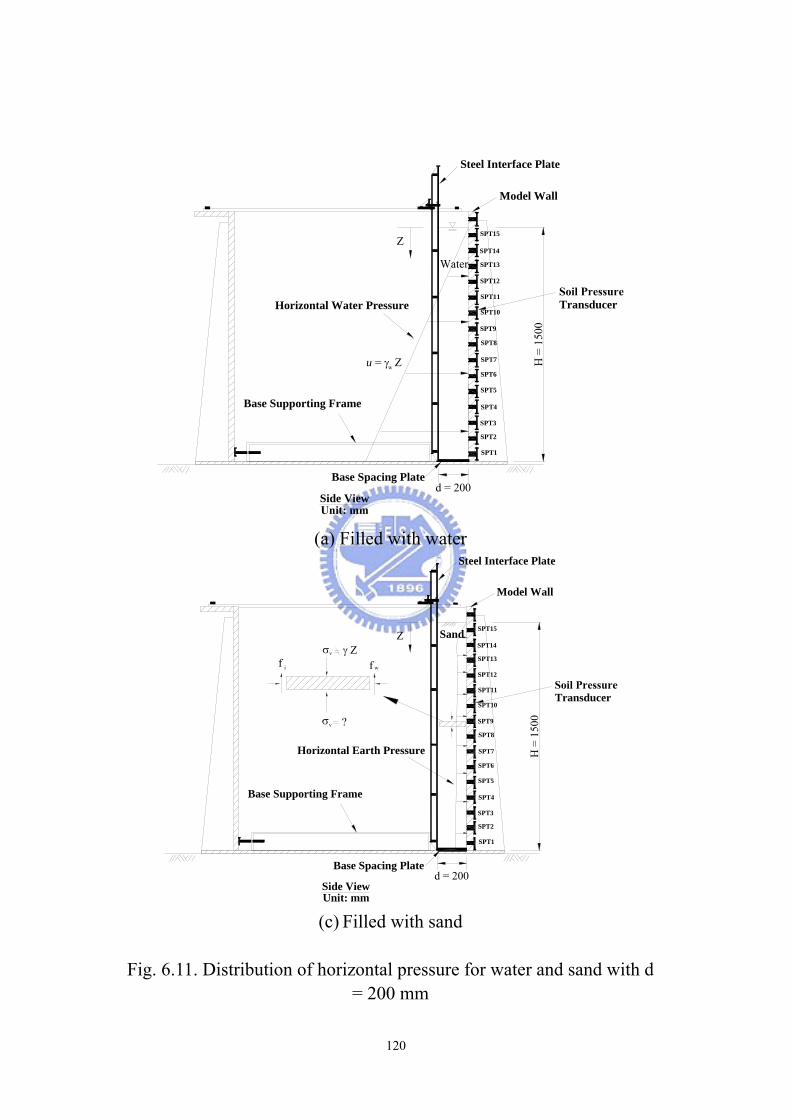
H =
150
0
SPT1
SPT2
SPT3
SPT4
SPT5
SPT6
SPT7
SPT8
SPT9
SPT10
SPT11
SPT12
SPT13
SPT14
SPT15
Model Wall
Side View
Steel Interface Plate
Base Supporting Frame
Transducer
Base Spacing Plated = 200
Z
Water
u = γ Ζw
Horizontal Water Pressure
(a) Filled with water
H =
150
0
Unit: mm
SPT1
SPT2
SPT3
SPT4
SPT5
SPT6
SPT7
SPT8
SPT9
SPT10
SPT11
SPT12
SPT13
SPT14
SPT15
Model Wall
Side View
Steel Interface Plate
Base Supporting Frame
Transducer
Base Spacing Plated = 200
Z Sand
ff i w
σ
v γ Z
σ
v ?
Horizontal Earth Pressure
(c) Filled with sand
Fig. 6.11. Distribution of horizontal pressure for water and sand with d
= 200 mm
120
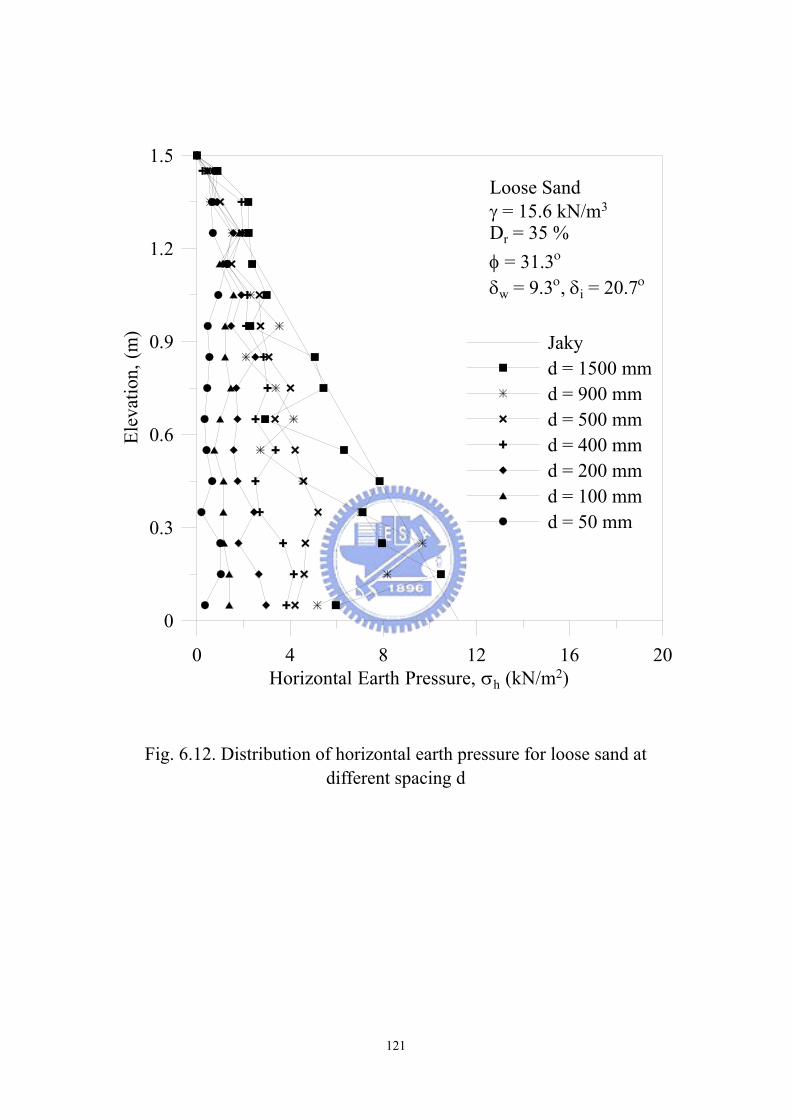
0 4 8 12 16 2Horizontal Earth Pressure, σh (kN/m2)
0
0
0.3
0.6
0.9
1.2
1.5El
evat
ion,
(m) Jaky
d = 1500 mmd = 900 mmd = 500 mmd = 400 mmd = 200 mmd = 100 mmd = 50 mm
Loose Sandγ = 15.6 kN/m3
Dr = 35 %φ = 31.3ο
δw = 9.3ο, δi = 20.7ο
f horizontal earth prFig. 6.12. Distribution o essure for loose sand at different spacing d
121
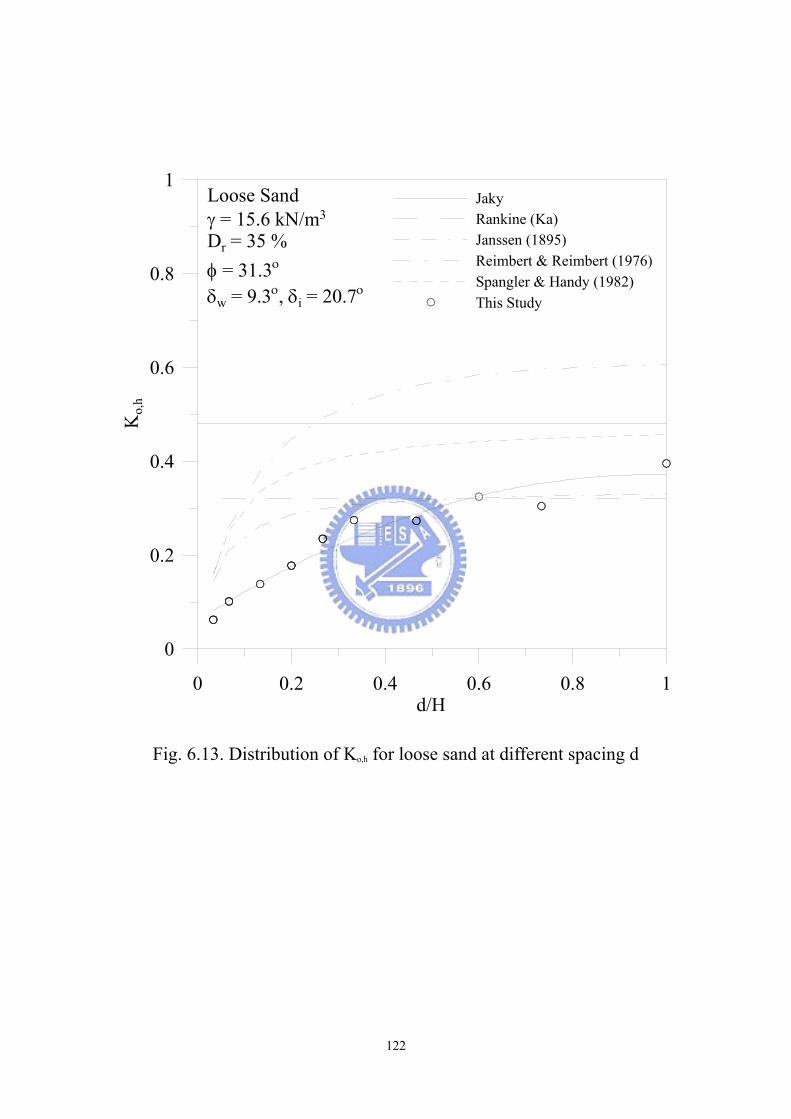
0 0.2 0.4 0.6 0.8 1d/H
0
0.2
0.4
0.6
0.8
1
Ko,
h
JakyRankine (Ka)Janssen (1895)Reimbert & Reimbert (1976)Spangler & Handy (1982)This Study
Loose Sandγ = 15.6 kN/m3
Dr = 35 %φ = 31.3ο
δw = 9.3ο, δi = 20.7ο
Fig. 6.13. Distribution of Ko,h for loose sand at different spacing d
122
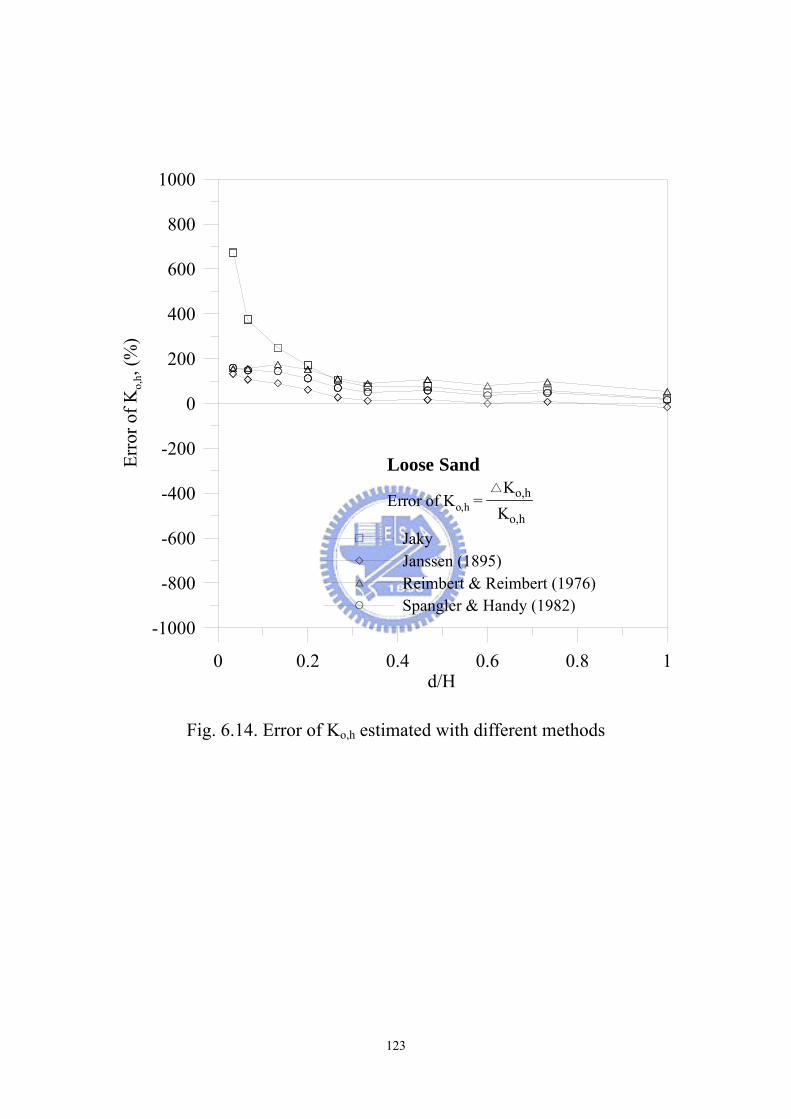
0 0.2 0.4 0.6 0.8 1
-1000
-800
-600
-400
-200
0
200
400
600
800
1000
Erro
r of K
o,h,
(%)
Loose Sand
Error of Ko,h =
JakyJanssen (1895)Reimbert & Reimbert (1976)Spangler & Handy (1982)
-Ko,h
Ko,h
d/H
Fig. 6.14. Error of Ko,h estimated with different methods
123
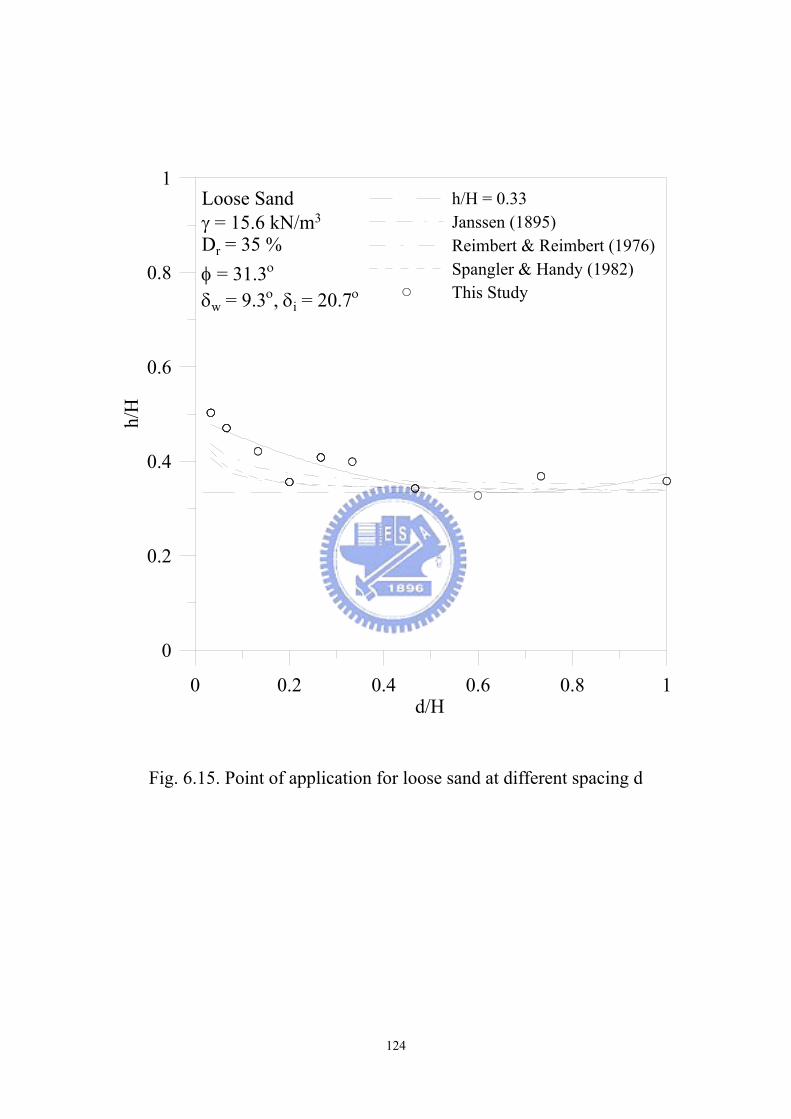
0 0.2 0.4 0.6 0.8 1
0
0.2
0.4
0.6
0.8
1
h/H
h/H = 0.33Janssen (1895)Reimbert & Reimbert (1976)Spangler & Handy (1982)This Study
Loose Sandγ = 15.6 kN/m3
Dr = 35 %φ = 31.3ο
δw = 9.3ο, δi = 20.7ο
d/H
Fig. 6.15. Point of application fo ferent spacing d
r loose sand at dif
124
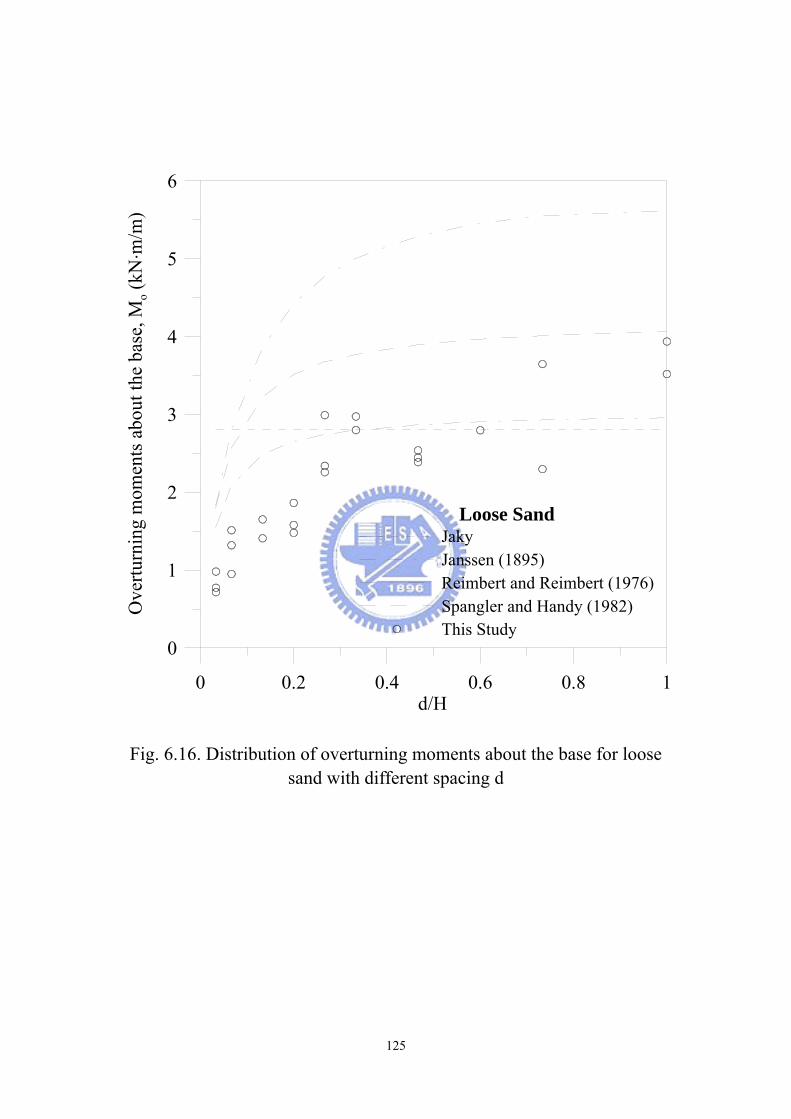
0 0.2 0.4 0.6 0.8 1
0
1
2
3
4
5
6
Ove
rturn
ing
mom
ents
abo
ut th
e ba
se, M
o (kN
. m/m
)
Loose SandJakyJanssen (1895)Reimbert and Reimbert (1976)Spangler and Handy (1982)This Study
d/H
Fig. 6.16. Distributio ut the base for loose sand with diff
n of overturning moments aboerent spacing d
125
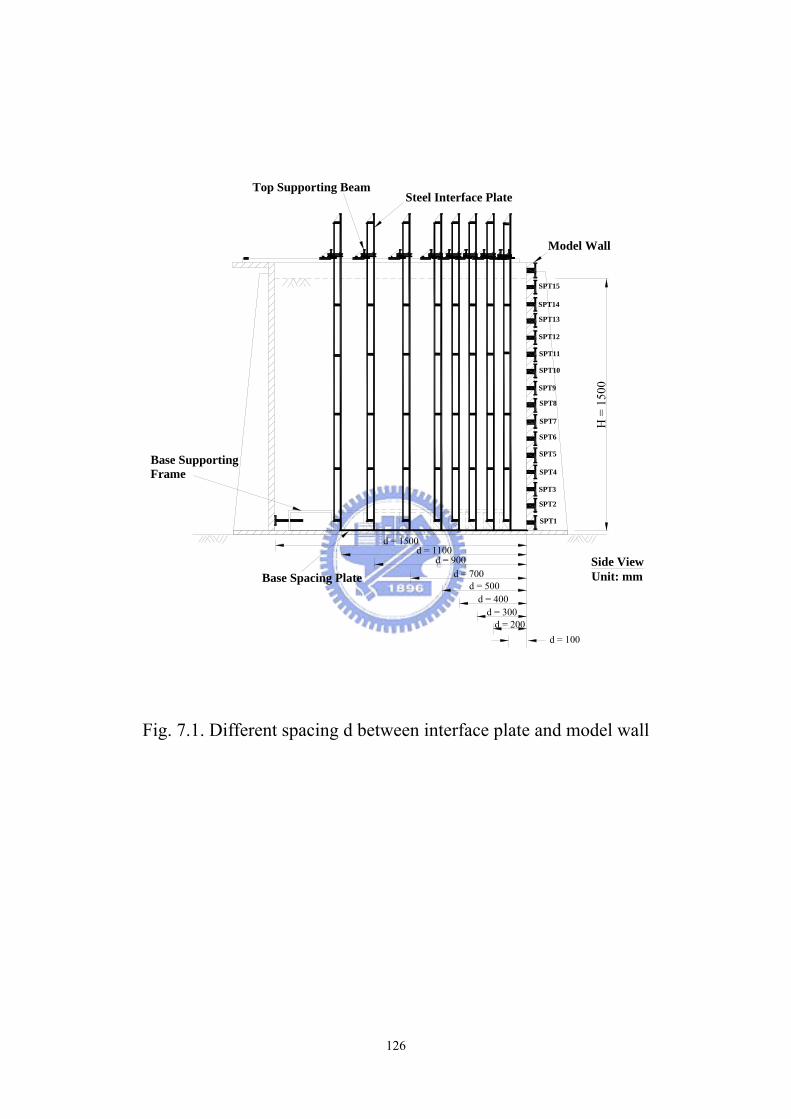
H =
150
0
Unit: mm
SPT1
SPT2
SPT3
SPT4
SPT5
SPT6
SPT7
SPT8
SPT9
SPT10
SPT11
SPT12
SPT13
SPT14
SPT15
Model Wall
Side View
Steel Interface PlateTop Supporting Beam
Base Supporting Frame
Base Spacing Plate
d = 1500d = 1100
d = 900d = 700
d = 500d = 400
d = 300d = 200
d = 100
Fig. 7.1. Different spacing d between interface plate and model wall
126
0 4 8 12 16 2Horizontal Earth Pressure, σh (kN/m2)
0
0
0.3
0.6
0.9
1.2
1.5El
evat
ion,
(m)
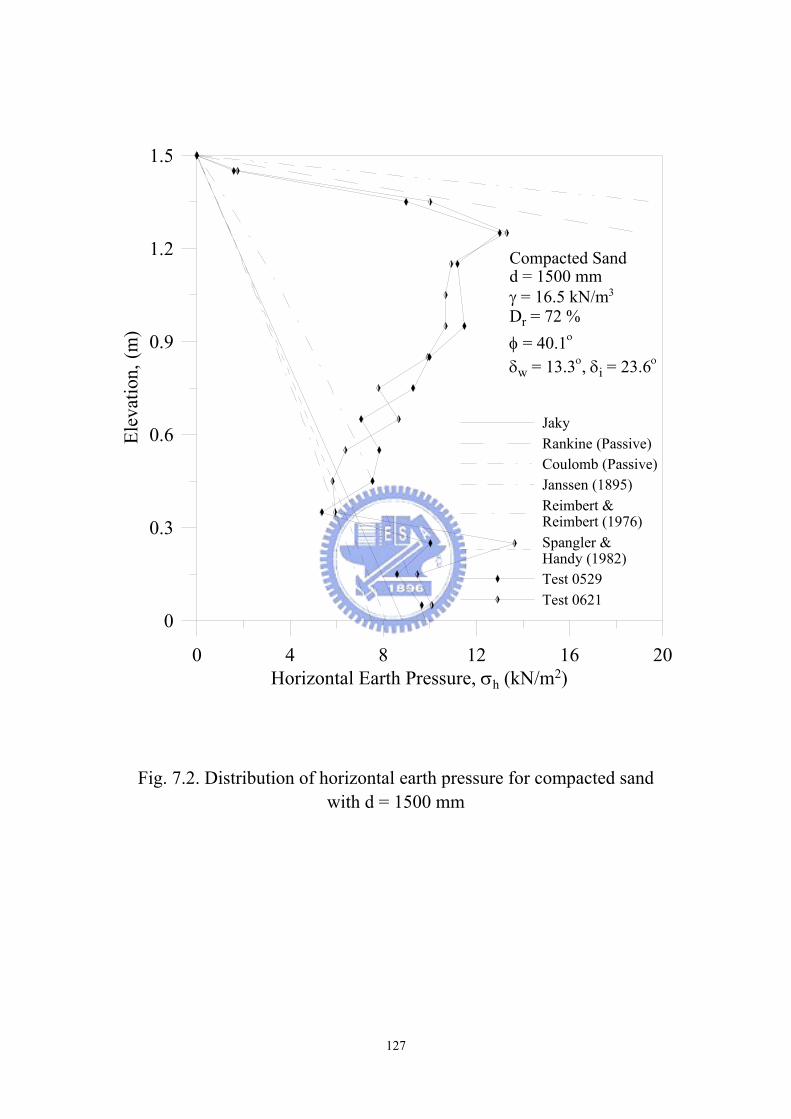
JakyRankine (Passive)Coulomb (Passive)Janssen (1895)Reimbert & Reimbert (1976)Spangler & Handy (1982)Test 0529Test 0621
Compacted Sandd = 1500 mmγ = 16.5 kN/m3
Dr = 72 %φ = 40.1ο
δw = 13.3ο, δi = 23.6ο
Fig. 7.2. Distribution of horizontal earth pressure for compacted sand with d = 1500 mm
127

0 4 8 12 16 2Horizontal Earth Pressure, σh (kN/m2)
0
0
0.3
0.6
0.9
1.2
1.5El
evat
ion,
(m)
JakyRankine (Passive)Coulomb (Passive)Janssen (1895)Reimbert & Reimbert (1976)Spangler & Handy (1982)Test 0706
Compacted Sandd = 1100 mmγ = 16.5 kN/m3
Dr = 72 %φ = 40.1ο
δw = 13.3ο, δi = 23.6ο
Fig. 7.3. Distribution of horizontal earth pressure for compacted sand with d = 1100 mm
128

0 4 8 12 16 2Horizontal Earth Pressure, σh (kN/m2)
0
0
0.3
0.6
0.9
1.2
1.5El
evat
ion,
(m)
JakyRankine (Passive)Coulomb (Passive)Janssen (1895)Reimbert & Reimbert (1976)Spangler & Handy (1982)Test 0601
Compacted Sandd = 900 mmγ = 16.5 kN/m3
Dr = 72 %φ = 40.1ο
δw = 13.3ο, δi = 23.6ο
Fig. 7.4. Distribution of horizontal earth pressure for compacted sand with d = 900 mm
129
0 4 8 12 16 2Horizontal Earth Pressure, σh (kN/m2)
0
0
0.3
0.6
0.9
1.2
1.5El
evat
ion,
(m)
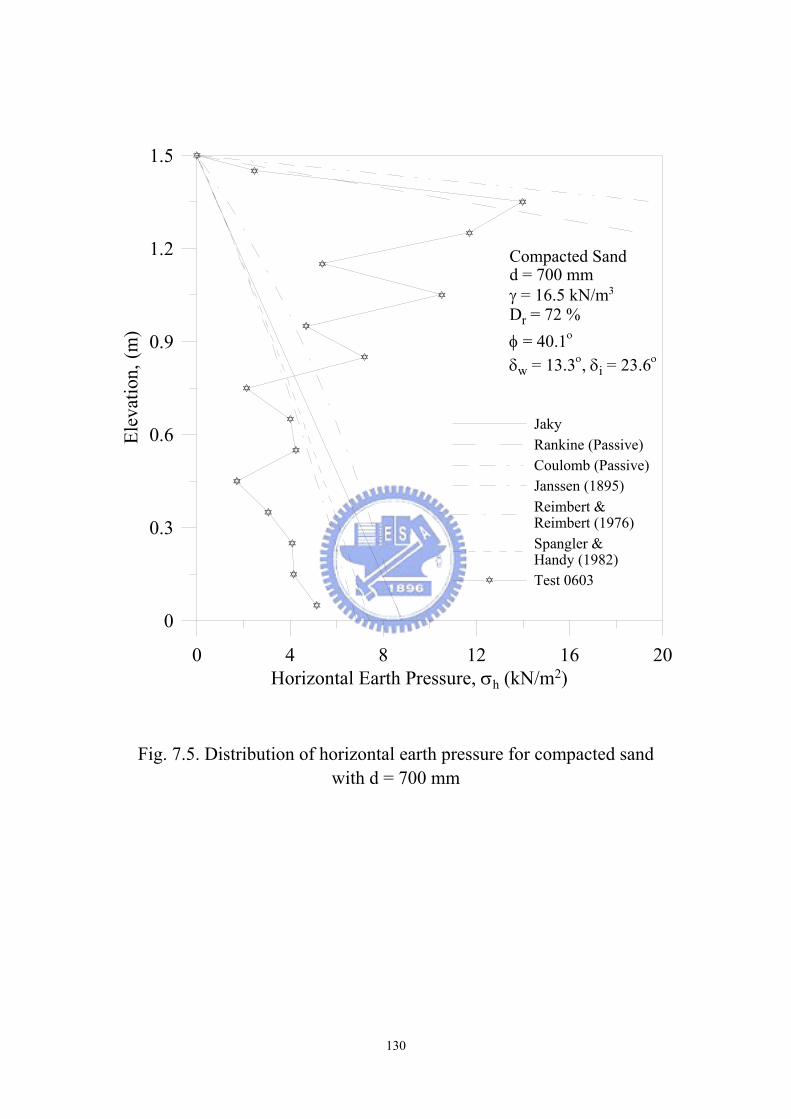
JakyRankine (Passive)Coulomb (Passive)Janssen (1895)Reimbert & Reimbert (1976)Spangler & Handy (1982)Test 0603
Compacted Sandd = 700 mmγ = 16.5 kN/m3
Dr = 72 %φ = 40.1ο
δw = 13.3ο, δi = 23.6ο
Fig. 7.5. Distribution of horizontal earth pressure for compacted sand with d = 700 mm
130
0 4 8 12 16 2Horizontal Earth Pressure, σh (kN/m2)
0
0
0.3
0.6
0.9
1.2
1.5El
evat
ion,
(m)
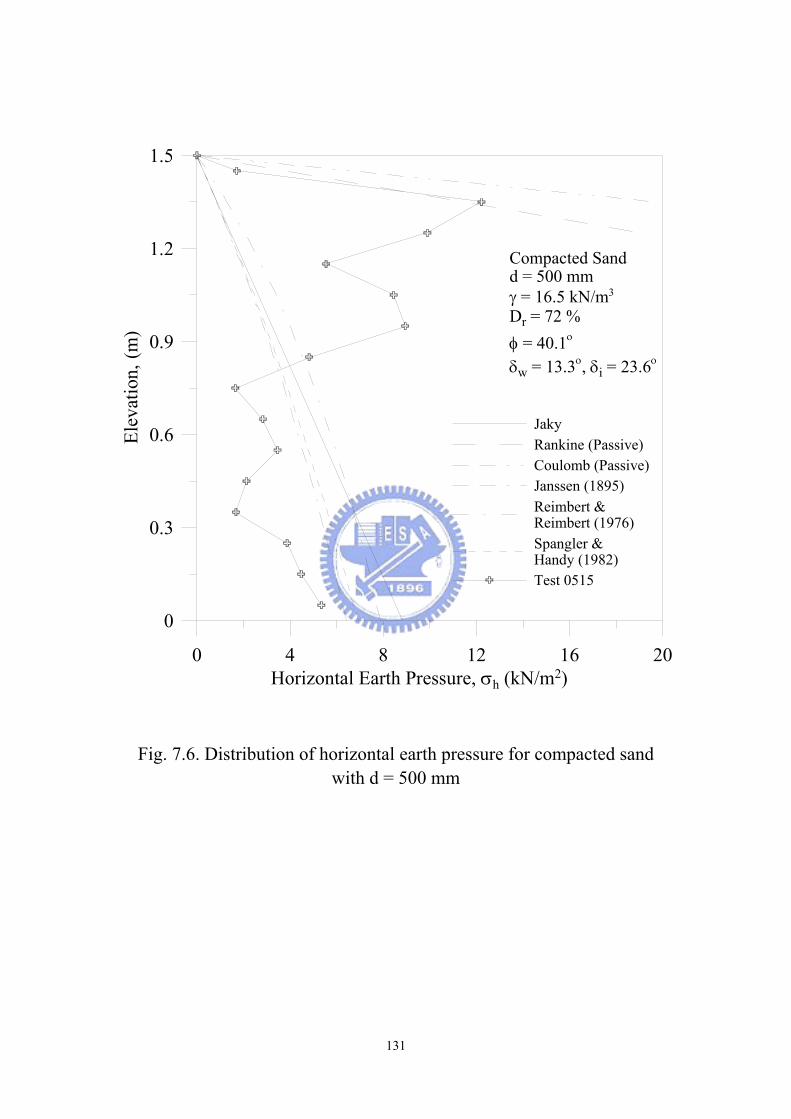
JakyRankine (Passive)Coulomb (Passive)Janssen (1895)Reimbert & Reimbert (1976)Spangler & Handy (1982)Test 0515
Compacted Sandd = 500 mmγ = 16.5 kN/m3
Dr = 72 %φ = 40.1ο
δw = 13.3ο, δi = 23.6ο
Fig. 7.6. Distribution of horizontal earth pressure for compacted sand with d = 500 mm
131

0 4 8 12 16 2Horizontal Earth Pressure, σh (kN/m2)
0
0
0.3
0.6
0.9
1.2
1.5El
evat
ion,
(m)
JakyRankine (Passive)Coulomb (Passive)Janssen (1895)Reimbert & Reimbert (1976)Spangler & Handy (1982)Test 0524
Compacted Sandd = 400 mmγ = 16.5 kN/m3
Dr = 72 %φ = 40.1ο
δw = 13.3ο, δi = 23.6ο
Fig. 7.7. Distribution of horizontal earth pressure for compacted sand with d = 400 mm
132

0 4 8 12 16 2Horizontal Earth Pressure, σh (kN/m2)
0
0
0.3
0.6
0.9
1.2
1.5El
evat
ion,
(m)
JakyRankine (Passive)Coulomb (Passive)Janssen (1895)Reimbert & Reimbert (1976)Spangler & Handy (1982)Test 0520
Compacted Sandd = 300 mmγ = 16.5 kN/m3
Dr = 72 %φ = 40.1ο
δw = 13.3ο, δi = 23.6ο
Fig. 7.8. Distribution of horizontal earth pressure for compacted sand with d = 300 mm
133

0 4 8 12 16 2Horizontal Earth Pressure, σh (kN/m2)
0
0
0.3
0.6
0.9
1.2
1.5El
evat
ion,
(m)
JakyRankine (Passive)Coulomb (Passive)Janssen (1895)Reimbert & Reimbert (1976)Spangler & Handy (1982)Test 0524Test 0612
Compacted Sandd = 200 mmγ = 16.5 kN/m3
Dr = 72 %φ = 40.1ο
δw = 13.3ο, δi = 23.6ο
Fig. 7.9. Distribution of horizontal earth pressure for compacted sand with d = 200 mm
134

0 4 8 12 16 2Horizontal Earth Pressure, σh (kN/m2)
0
0
0.3
0.6
0.9
1.2
1.5El
evat
ion,
(m)
JakyRankine (Passive)Coulomb (Passive)Janssen (1895)Reimbert & Reimbert (1976)Spangler & Handy (1982)Test 0614
Compacted Sandd = 100 mmγ = 16.5 kN/m3
Dr = 72 %φ = 40.1ο
δw = 13.3ο, δi = 23.6ο
Fig. 7.10. Distribution of horizontal earth pressure for compacted sand with d = 100 mm
135

0 4 8 12 16 2Horizontal Earth Pressure, σh (kN/m2)
0
0
0.3
0.6
0.9
1.2
1.5El
evat
ion,
(m)
JakyRankine (Passive)Coulomb (Passive)d = 1500 mmd = 1100 mmd = 900 mmd = 700 mmd = 400 mmd = 300 mmd = 200 mmd = 100 mm
Compacted Sandγ = 16.5 kN/m3
Dr = 72 %φ = 40.1ο,δw = 13.3ο, δi = 23.6ο
Fig. 7.11. Distribution of horizontal earth pressure for compacted sand at
different spacing d
136
0 0.2 0.4 0.6 0.8 1d/H
0
0.2
0.4
0.6
0.8
1K
o,h
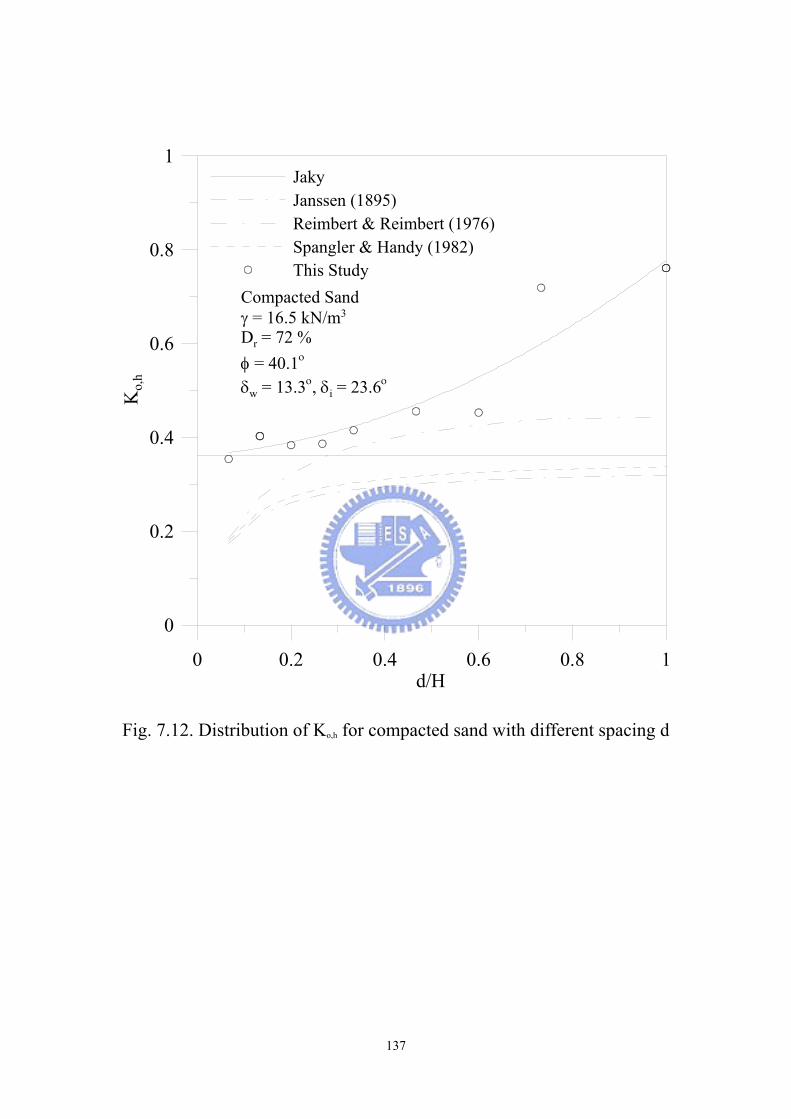
JakyJanssen (1895)Reimbert & Reimbert (1976)Spangler & Handy (1982)This Study
Compacted Sandγ = 16.5 kN/m3
Dr = 72 %φ = 40.1ο
δw = 13.3ο, δi = 23.6ο
Fig. 7.12. Distribution of Ko,h for compacted sand with different spacing d
137
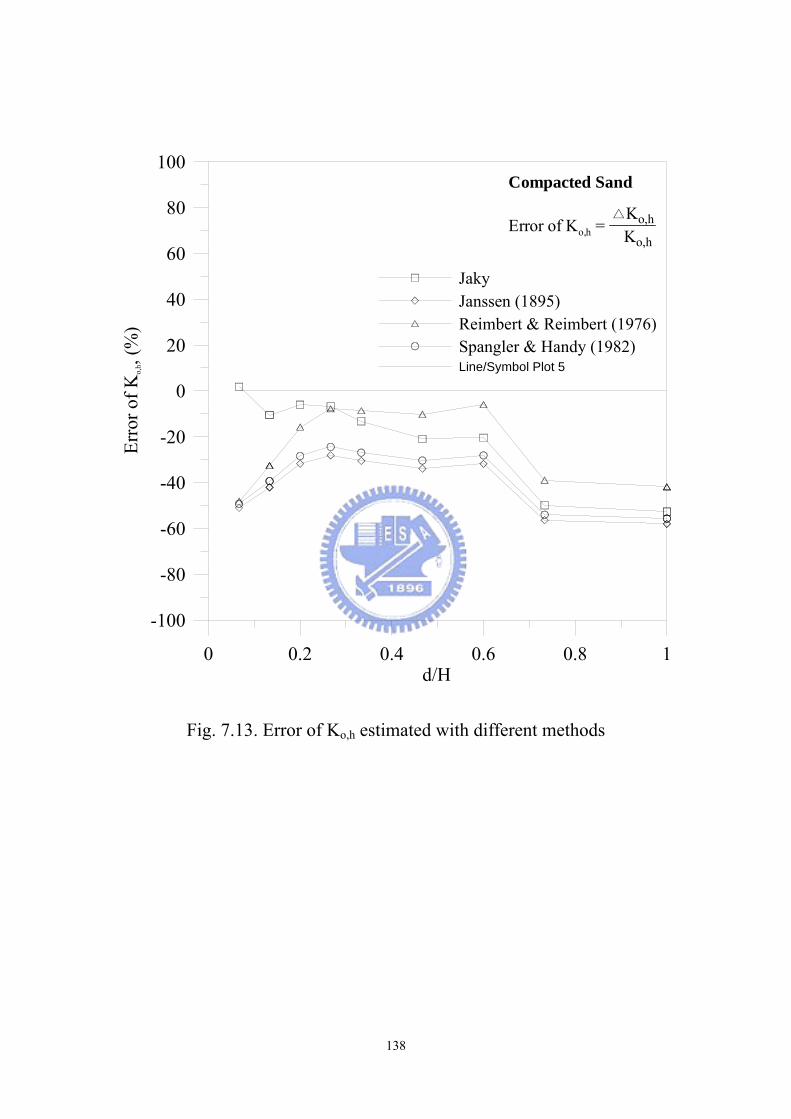
0 0.2 0.4 0.6 0.8 1d/H
-100
-80
-60
-40
-20
0
20
40
60
80
100
Erro
r of K
o,h,
(%)
JakyJanssen (1895)Reimbert & Reimbert (1976)Spangler & Handy (1982)Line/Symbol Plot 5
Compacted Sand
Error of Ko,h = -Ko,h
Ko,h
Fig. 7.13. Error of Ko,h estimated with different methods
138
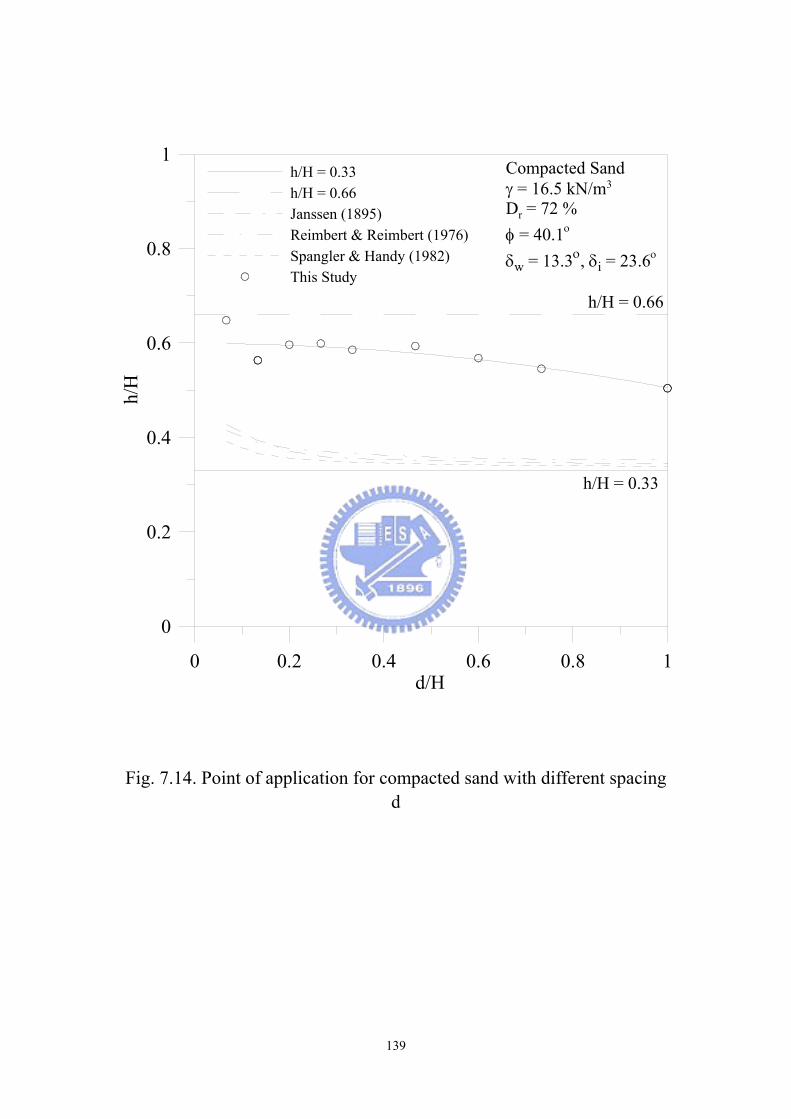
0 0.2 0.4 0.6 0.8 1d/H
0
0.2
0.4
0.6
0.8
1h/
H
h/H = 0.33h/H = 0.66Janssen (1895)Reimbert & Reimbert (1976)Spangler & Handy (1982)This Study
Compacted Sandγ = 16.5 kN/m3
Dr = 72 %φ = 40.1ο
δw = 13.3ο, δi = 23.6ο
h/H = 0.33
h/H = 0.66
Fig. 7.14. Point of application for compacted sand with different spacing d
139
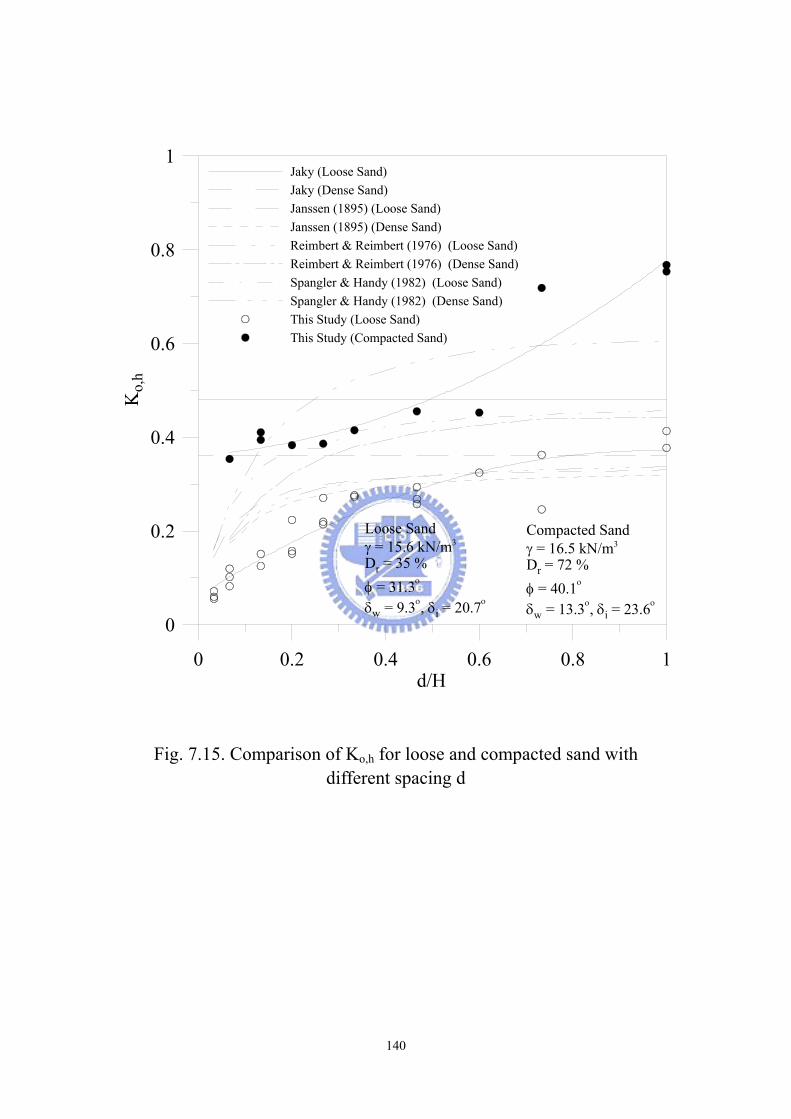
0 0.2 0.4 0.6 0.8 1d/H
0
0.2
0.4
0.6
0.8
1K
o,h
Jaky (Loose Sand)Jaky (Dense Sand)Janssen (1895) (Loose Sand)Janssen (1895) (Dense Sand)Reimbert & Reimbert (1976) (Loose Sand)Reimbert & Reimbert (1976) (Dense Sand)Spangler & Handy (1982) (Loose Sand)Spangler & Handy (1982) (Dense Sand)This Study (Loose Sand)This Study (Compacted Sand)
Compacted Sandγ = 16.5 kN/m3
Dr = 72 %φ = 40.1ο
δw = 13.3ο, δi = 23.6ο
Loose Sandγ = 15.6 kN/m3
Dr = 35 %φ = 31.3ο
δw = 9.3ο, δi = 20.7ο
Fig. 7.15. Comparison of Ko,h for loose and compacted sand with different spacing d
140

0 0.2 0.4 0.6 0.8 1d/H
0
0.2
0.4
0.6
0.8
1h/
H
Janssen (1895) (Loose Sand)Janssen (1895) (Dense Sand)Reimbert & Reimbert (1976) (Loose Sand)Reimbert & Reimbert (1976) (Dense Sand)Spangler & Handy (1982) (Loose Sand)Spangler & Handy (1982) (Dense Sand)This Study (Loose Sand)This Study (Compacted Sand)
Compacted Sandγ = 16.5 kN/m3
Dr = 72 %φ = 40.1ο
δw = 13.3ο, δi = 23.6ο
Loose Sandγ = 15.6 kN/m3
Dr = 35 %φ = 31.3ο
δw = 9.3ο, δi = 20.7ο
h/H = 0.33
h/H = 0.66
Fig. 7.16. Comparison of h/H for loose and compacted sand with different spacing d
141