Organic Matter in the Universe (KWOK:ORG MATTER UNIVERSE O-BK) || Synthesis of Organic Compounds in...
12
97 6 Synthesis of Organic Compounds in the Late Stages of Stellar Evolution 6.1 Molecular Synthesis in the Stellar Wind The element carbon (C), which is the basic atom in the structure of organic com- pounds, is synthesized in asymptotic giant branch (AGB) stars through helium- burning (triple- α) reaction. The newly formed C atoms are then dredged up from the core to the surface of the star. Due to the low temperature of the photosphere of AGB stars, the C atoms can react with other atoms to form molecules such as carbon monoxide (CO). When the abundance of C overtakes that of oxygen (O), the surplus of C atoms after the formation of CO can be used to form other carbon- based molecules such as C 2 ,C 3 , and CN. The spectral characteristics of these molecules in the photospheric spectra defines the class of AGB stars which we call carbon stars. Although we do not yet have a complete understanding of which AGB stars (e.g., which mass range of progenitors) will evolve into carbon stars, we generally assume that they represent an evolved phase of AGB evolution. In addition to photospheric spectroscopic signatures, circumstellar spectral properties can also be used to identify carbon stars. AGB stars undergo extensive mass loss through a stellar wind driven by radiation pressure on grains [278] and the mass loss rates of evolved O-rich or C-rich AGB stars can reach as high as 10 4 M ˇ yr 1 . Chemical reactions in the stellar wind allow for the synthesis of other more complex gas-phase molecules whose rotational transitions can be de- tected by millimeter-wave or submillimeter-wave spectroscopic observations. To date, more than 60 molecular species have been detected, and they include inor- ganics (e.g., CO, SiO, SiS, NH 3 , AlCl, etc.), organics (C 2 H 2 , CH 4 ,H 2 CO, CH 3 CN, etc.), radicals (CN, C 2 H, C 3 , HCO C , etc.), chains (e.g., HCN, HC 3 N, HC 5 N, etc.), and rings (C 3 H 2 ). Since the dynamical lifetime of the envelope is 10 4 yr, the chemical reactions that lead to formation of these species must be shorter than this time scale. Interferometric observations also allow mapping of the molecular emission regions and put further constraints on the reaction zone. Solid-state particles, both amorphous and crystalline, are also found condensing in the stellar winds of carbon stars. The most common solid-state condensates are amorphous silicates and silicon carbide (SiC), whose lattice vibrational modes at 10/18 μm and 11.3 μm are widely detected in O-rich and C-rich AGB stars Organic Matter in the Universe, First Edition. Sun Kwok. © 2012 WILEY-VCH Verlag GmbH & Co. KGaA. Published 2012 by WILEY-VCH Verlag GmbH & Co. KGaA.
Transcript of Organic Matter in the Universe (KWOK:ORG MATTER UNIVERSE O-BK) || Synthesis of Organic Compounds in...
97
6
Synthesis of Organic Compounds
in the Late Stages of Stellar Evolution
6.1
Molecular Synthesis in the Stellar Wind
The element carbon (C), which is the basic atom in the structure of organic com-pounds, is synthesized in asymptotic giant branch (AGB) stars through helium-burning (triple-α) reaction. The newly formed C atoms are then dredged up fromthe core to the surface of the star. Due to the low temperature of the photosphereof AGB stars, the C atoms can react with other atoms to form molecules such ascarbon monoxide (CO). When the abundance of C overtakes that of oxygen (O), thesurplus of C atoms after the formation of CO can be used to form other carbon-based molecules such as C2, C3, and CN. The spectral characteristics of thesemolecules in the photospheric spectra defines the class of AGB stars which wecall carbon stars. Although we do not yet have a complete understanding of whichAGB stars (e.g., which mass range of progenitors) will evolve into carbon stars, wegenerally assume that they represent an evolved phase of AGB evolution.
In addition to photospheric spectroscopic signatures, circumstellar spectralproperties can also be used to identify carbon stars. AGB stars undergo extensivemass loss through a stellar wind driven by radiation pressure on grains [278] andthe mass loss rates of evolved O-rich or C-rich AGB stars can reach as high as10�4 Mˇ yr�1. Chemical reactions in the stellar wind allow for the synthesis ofother more complex gas-phase molecules whose rotational transitions can be de-tected by millimeter-wave or submillimeter-wave spectroscopic observations. Todate, more than 60 molecular species have been detected, and they include inor-ganics (e.g., CO, SiO, SiS, NH3, AlCl, etc.), organics (C2H2, CH4, H2CO, CH3CN,etc.), radicals (CN, C2H, C3, HCOC, etc.), chains (e.g., HCN, HC3N, HC5N, etc.),and rings (C3H2). Since the dynamical lifetime of the envelope is � 104 yr, thechemical reactions that lead to formation of these species must be shorter thanthis time scale. Interferometric observations also allow mapping of the molecularemission regions and put further constraints on the reaction zone.
Solid-state particles, both amorphous and crystalline, are also found condensingin the stellar winds of carbon stars. The most common solid-state condensatesare amorphous silicates and silicon carbide (SiC), whose lattice vibrational modesat 10/18 μm and 11.3 μm are widely detected in O-rich and C-rich AGB stars
Organic Matter in the Universe, First Edition. Sun Kwok.© 2012 WILEY-VCH Verlag GmbH & Co. KGaA. Published 2012 by WILEY-VCH Verlag GmbH & Co. KGaA.

98 6 Synthesis of Organic Compounds in the Late Stages of Stellar Evolution
(10–1
0 er
g cm
–2 s
–1)
F λλ
Wavelength ( m)
100
10
1
00.1 1.0 10.0 100.0
μ
IRAS 21318+5631
2500 BB
ISO SWS01
LWS
Figure 6.1 IRAS 21318+5631 is an example
of an evolved carbon star so obscured by its
own ejected circumstellar dust envelope that
the central star is totally undetectable in the
optical region. Its infrared spectrum (solid
lines: ISO SWS01 and ISO LWS) is completely
due to dust emission and has a color tem-
perature of 300 K. The dotted line represents
the theoretical fit to the spectrum based on
a one-dimensional radiation transfer model
with a hidden 2500 K central star (dashed line)
as the energy source. The absorption feature
near the peak of the spectrum is the 13.7 μm
band of acetylene, a molecule synthesized in
the circumstellar envelope near the end of the
AGB evolution. Figure adapted from [291].
Figure 6.2 Color composite image of HST WFPC 2 observations of BD+30° 3639, another plan-
etary nebula with rich organic content. For a color version of this figure, please see the Color
Plates at the beginning of the book.
6.1 Molecular Synthesis in the Stellar Wind 99
respectively [232]. Since solid particles have a high opacity to visible light, theircondensation in the circumstellar envelopes can cause large obscuration to thelight from the central star. The intercepted starlight heats up the solid particles,which in turn cool by self radiating in the infrared. As the ejection rate increases inthe late stages of AGB evolution, the envelope can contain so much solid materialthat the star is completely obscured by dust extinction. Such stars will have no op-tical counterpart and can only be identified by infrared observations. An exampleof such infrared stars discovered in the IRAS all-sky survey is IRAS 21318+5631(Figure 6.1). This carbon star has such a dense dust envelope that the central starsuffers from 360 magnitudes of extinction in the visible (A v) and is completelyobscured [279]. Its infrared spectrum has a color temperature of 300 K and is theresult of emission from a dust envelope heated by a hidden central star of 2500 K.The identification of these infrared objects as extremely evolved AGB stars and thespectroscopic observations of these objects have led to the realization that thesestars are prolific molecular factories.
The high rate of mass loss on the AGB will eventually deplete the hydrogenenvelope of the star and gradually expose the hot core. As the envelope thins tobelow 10�3 Mˇ, we can see deeper into the stellar atmosphere. Due to the shrink-
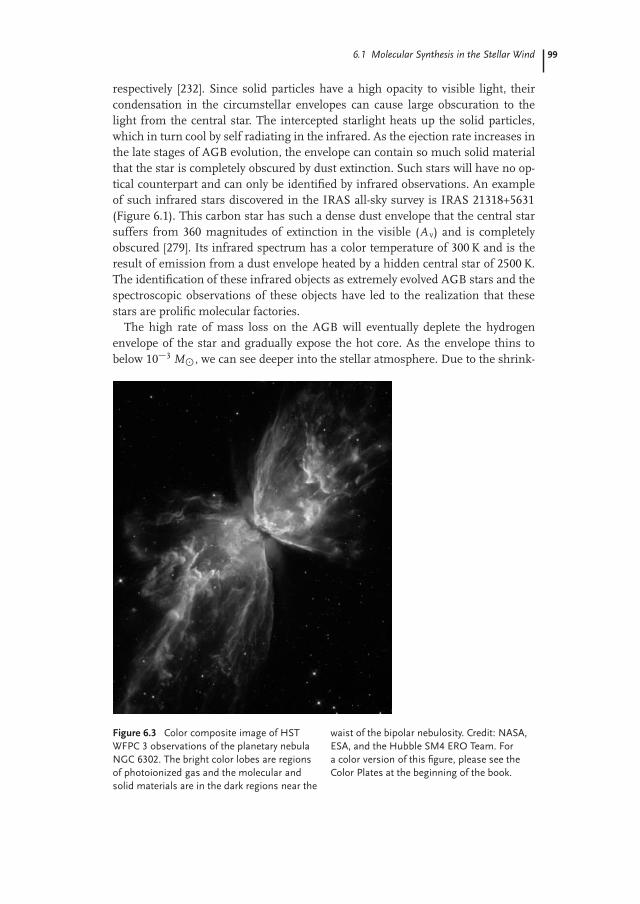
Figure 6.3 Color composite image of HST
WFPC 3 observations of the planetary nebula
NGC 6302. The bright color lobes are regions
of photoionized gas and the molecular and
solid materials are in the dark regions near the
waist of the bipolar nebulosity. Credit: NASA,
ESA, and the Hubble SM4 ERO Team. For
a color version of this figure, please see the
Color Plates at the beginning of the book.
100 6 Synthesis of Organic Compounds in the Late Stages of Stellar Evolution
ing of the photospheric radius, the effective temperature of the star will increase.1)
Through a combination of H-shell burning and mass loss by stellar wind, the en-velope will continue to thin, leading to further increases in stellar temperature.When the stellar temperature reaches 20 000 K, the ultraviolet photon output fromthe star will begin to photoionize the circumstellar envelope, creating a planetarynebula [280]. Several images of planetary nebulae are shown in the color plates (Fig-ures 1.4, 6.2, 6.3). The intervening phase between the end of AGB and the onset ofphotoionization is called the protoplanetary nebula phase [281, 282].
Unlike stars which have a continuous spectrum, planetary nebulae have spec-tra dominated by strong emission lines, primarily recombination lines of H andHe, and collisionally excited lines of ions of heavy elements (O, S, Ne, Si, etc). Al-though planetary nebulae are bright visible objects because of their emission-line
0.1 1.0 10.0 100.0
Wavelength ( μm)
1
10
100
1000
λFλ
(10
-10 e
rg s
-1 c
m-2
)
BD +30° 3639
dust emission
H f-b continuum
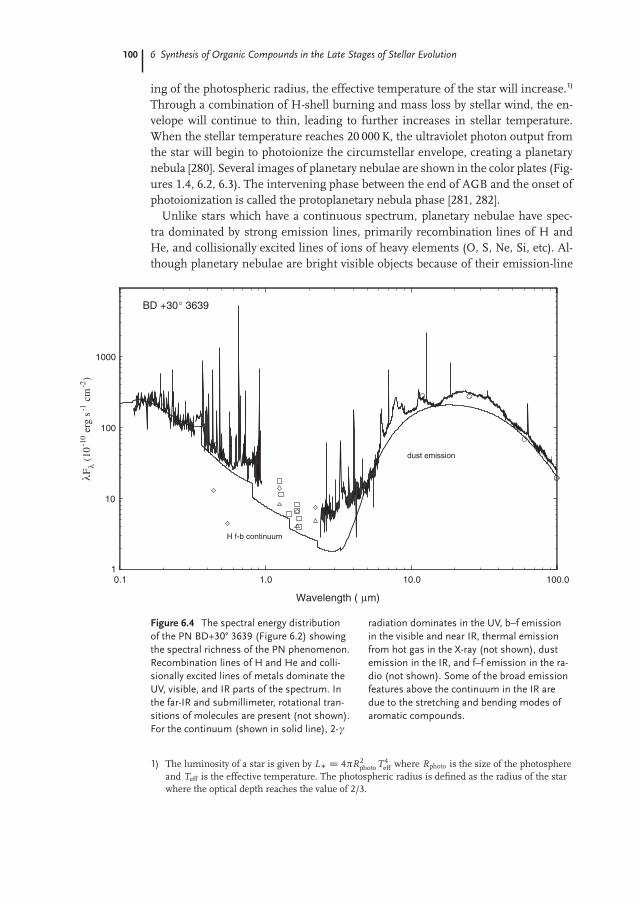
Figure 6.4 The spectral energy distribution
of the PN BD+30° 3639 (Figure 6.2) showing
the spectral richness of the PN phenomenon.
Recombination lines of H and He and colli-
sionally excited lines of metals dominate the
UV, visible, and IR parts of the spectrum. In
the far-IR and submillimeter, rotational tran-
sitions of molecules are present (not shown).
For the continuum (shown in solid line), 2-γ
radiation dominates in the UV, b–f emission
in the visible and near IR, thermal emission
from hot gas in the X-ray (not shown), dust
emission in the IR, and f–f emission in the ra-
dio (not shown). Some of the broad emission
features above the continuum in the IR are
due to the stretching and bending modes of
aromatic compounds.
1) The luminosity of a star is given by L� D 4πR2photo T 4
eff where Rphoto is the size of the photosphereand Teff is the effective temperature. The photospheric radius is defined as the radius of the starwhere the optical depth reaches the value of 2/3.
6.1 Molecular Synthesis in the Stellar Wind 101
spectra, recent observations of planetary nebulae in the infrared and millimeterwavelengths have shown that they also possess thick molecular envelopes mixedwith solid-state particles. Mid- and far-infrared observations from the IRAS and In-frared Space Observatory (ISO) missions have found that dust emission representsa major fraction of energy output from planetary nebulae (Figure 6.4). The detec-tion of molecular/dust envelopes in planetary nebulae clearly establishes the linkto their progenitor AGB stars [283].
The existence of remnant AGB dust envelopes enables the search for protoplan-etary nebulae, as they are expected to have infrared colors between those of evolvedAGB stars and young planetary nebulae [284]. The first protoplanetary nebulae(AFGL 618 and AFGL 2688) were discovered as the result of ground-based follow-up of the Air Force Geophysical Laboratory infrared sky survey. However, a compre-hensive understanding of the protoplanetary nebulae phenomenon was possibleonly after a systematic search for these objects among cool IRAS sources [281].Although protoplanetary nebulae are faint in the visible due to the absence ofemission lines, their structure can be observed through scattered light from cir-cumstellar dust. The optical images of four protoplanetary nebulae obtained fromobservations with the Hubble Space Telescope (HST) are shown in Figures 6.5–6.7.
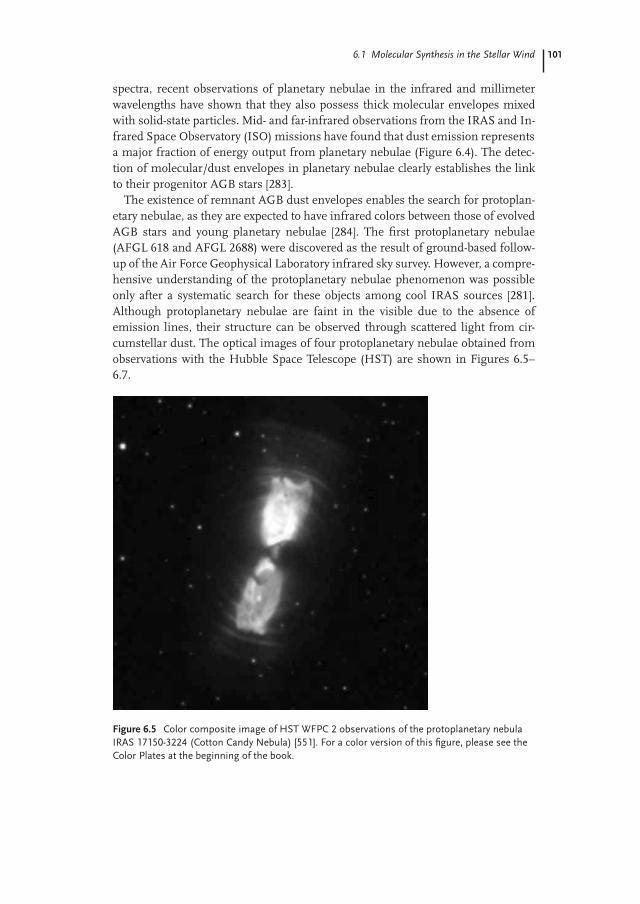
Figure 6.5 Color composite image of HST WFPC 2 observations of the protoplanetary nebula
IRAS 17150-3224 (Cotton Candy Nebula) [551]. For a color version of this figure, please see the
Color Plates at the beginning of the book.
102 6 Synthesis of Organic Compounds in the Late Stages of Stellar Evolution
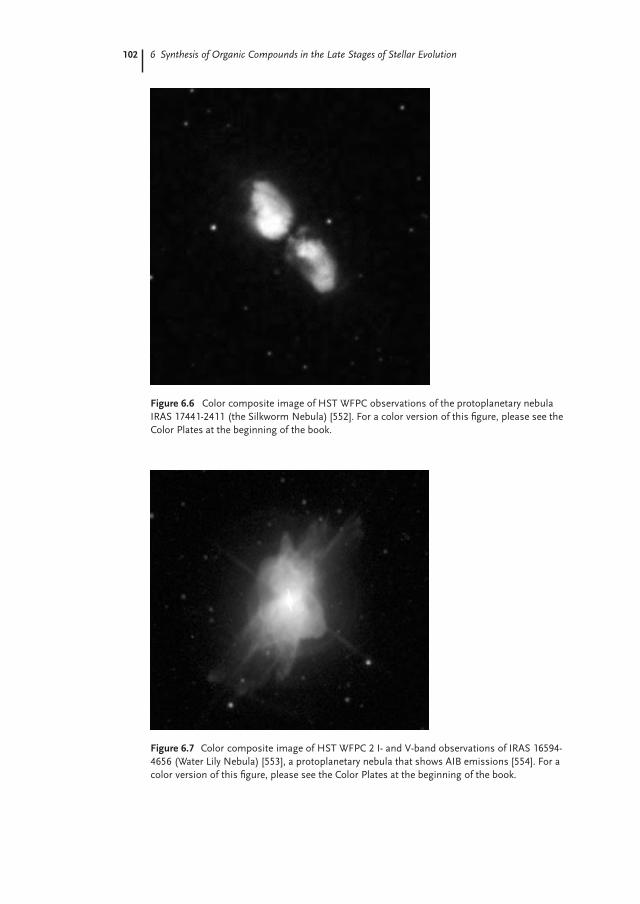
Figure 6.6 Color composite image of HST WFPC observations of the protoplanetary nebula
IRAS 17441-2411 (the Silkworm Nebula) [552]. For a color version of this figure, please see the
Color Plates at the beginning of the book.
Figure 6.7 Color composite image of HST WFPC 2 I- and V-band observations of IRAS 16594-
4656 (Water Lily Nebula) [553], a protoplanetary nebula that shows AIB emissions [554]. For a
color version of this figure, please see the Color Plates at the beginning of the book.
6.2 Beyond the Asymptotic Giant Branch 103
6.2
Beyond the Asymptotic Giant Branch
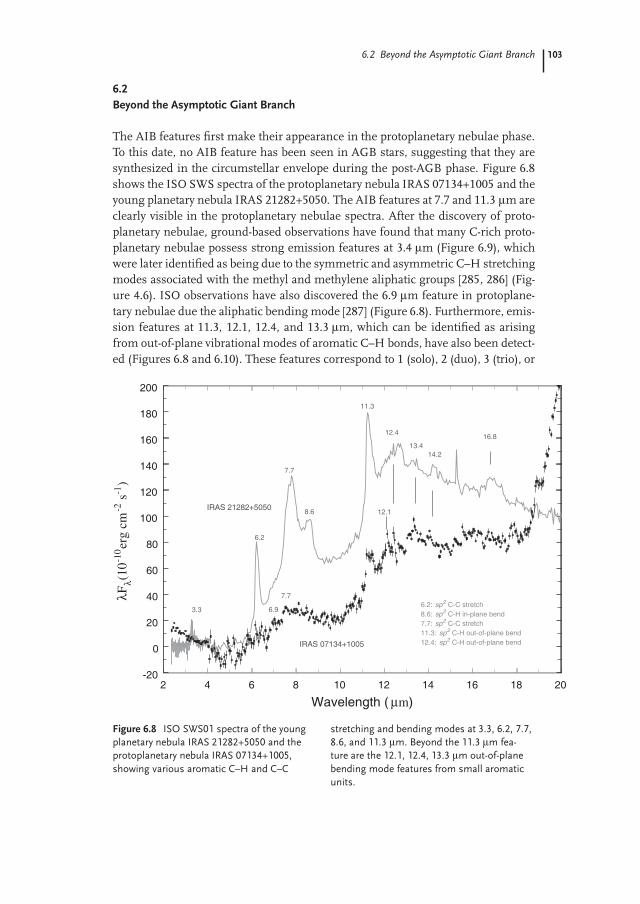
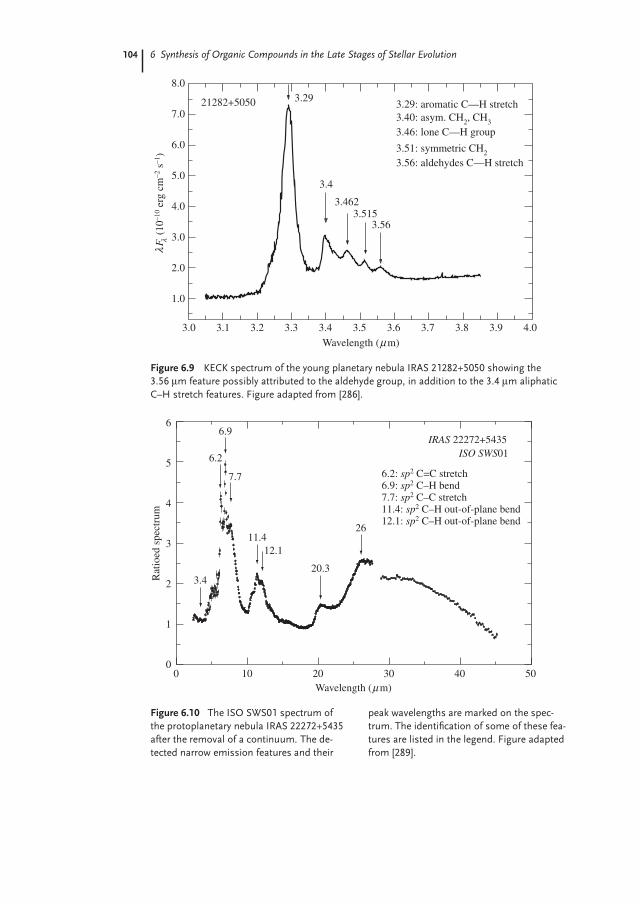
The AIB features first make their appearance in the protoplanetary nebulae phase.To this date, no AIB feature has been seen in AGB stars, suggesting that they aresynthesized in the circumstellar envelope during the post-AGB phase. Figure 6.8shows the ISO SWS spectra of the protoplanetary nebula IRAS 07134+1005 and theyoung planetary nebula IRAS 21282+5050. The AIB features at 7.7 and 11.3 μm areclearly visible in the protoplanetary nebulae spectra. After the discovery of proto-planetary nebulae, ground-based observations have found that many C-rich proto-planetary nebulae possess strong emission features at 3.4 μm (Figure 6.9), whichwere later identified as being due to the symmetric and asymmetric C–H stretchingmodes associated with the methyl and methylene aliphatic groups [285, 286] (Fig-ure 4.6). ISO observations have also discovered the 6.9 μm feature in protoplane-tary nebulae due the aliphatic bending mode [287] (Figure 6.8). Furthermore, emis-sion features at 11.3, 12.1, 12.4, and 13.3 μm, which can be identified as arisingfrom out-of-plane vibrational modes of aromatic C–H bonds, have also been detect-ed (Figures 6.8 and 6.10). These features correspond to 1 (solo), 2 (duo), 3 (trio), or
2 4 6 8 10 12 14 16 18 20
Wavelength ( μm)
-20
0
20
40
60
80
100
120
140
160
180
200
λFλ(
10-1
0er
g cm
-2 s
-1)
IRAS 21282+5050
3.3
6.2
7.7
8.6
11.3
6.2: sp2 C-C stretch
7.7: sp2 C-C stretch11.3: sp2 C-H out-of-plane bend
8.6: sp2 C-H in-plane bend
12.4: sp2 C-H out-of-plane bend
12.416.8
13.414.2
IRAS 07134+1005
12.1
6.9
7.7
Figure 6.8 ISO SWS01 spectra of the young
planetary nebula IRAS 21282+5050 and the
protoplanetary nebula IRAS 07134+1005,
showing various aromatic C–H and C–C
stretching and bending modes at 3.3, 6.2, 7.7,
8.6, and 11.3 μm. Beyond the 11.3 μm fea-
ture are the 12.1, 12.4, 13.3 μm out-of-plane
bending mode features from small aromatic
units.
104 6 Synthesis of Organic Compounds in the Late Stages of Stellar Evolution
21282+5050
8.0
7.0
6.0
5.0
4.0
3.0
2.0
1.0
3.0 3.1 3.2 3.3 3.4 3.5 3.6 3.7 3.8 3.9 4.0
3.4
3.4623.515
3.56
3.40: asym. CH2, CH3
3.46: lone C—H group
3.51: symmetric CH2
3.29: aromatic C—H stretch3.29
3.56: aldehydes C—H stretch(1
0–10
erg
cm–2
s–1
)F λ
λ
Wavelength ( m)μ
Figure 6.9 KECK spectrum of the young planetary nebula IRAS 21282+5050 showing the
3.56 μm feature possibly attributed to the aldehyde group, in addition to the 3.4 μm aliphatic
C–H stretch features. Figure adapted from [286].
Wavelength ( m)
Rat
ioed
spe
ctru
m
μ
6
5
4
3
2
1
05040302010
3.4
6.2
6.9
7.7
11.412.1
20.3
26
0
IRAS 22272+5435
6.2: sp2 C=C stretch6.9: sp2 C–H bend7.7: sp2 C–C stretch11.4: sp2 C–H out-of-plane bend12.1: sp2 C–H out-of-plane bend
ISO SWS01
Figure 6.10 The ISO SWS01 spectrum of
the protoplanetary nebula IRAS 22272+5435
after the removal of a continuum. The de-
tected narrow emission features and their
peak wavelengths are marked on the spec-
trum. The identification of some of these fea-
tures are listed in the legend. Figure adapted
from [289].
6.2 Beyond the Asymptotic Giant Branch 105
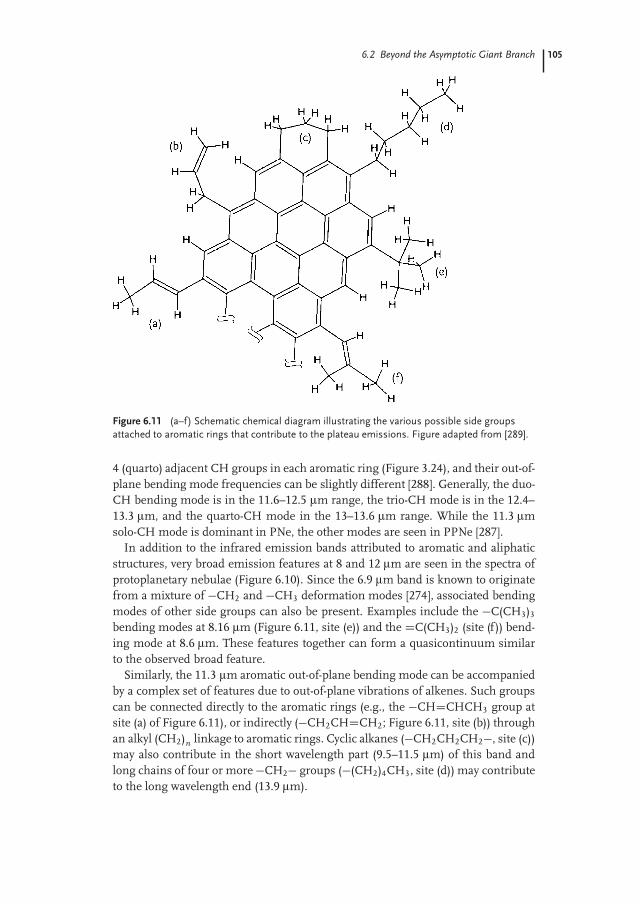
Figure 6.11 (a–f) Schematic chemical diagram illustrating the various possible side groups
attached to aromatic rings that contribute to the plateau emissions. Figure adapted from [289].
4 (quarto) adjacent CH groups in each aromatic ring (Figure 3.24), and their out-of-plane bending mode frequencies can be slightly different [288]. Generally, the duo-CH bending mode is in the 11.6–12.5 μm range, the trio-CH mode is in the 12.4–13.3 μm, and the quarto-CH mode in the 13–13.6 μm range. While the 11.3 μmsolo-CH mode is dominant in PNe, the other modes are seen in PPNe [287].
In addition to the infrared emission bands attributed to aromatic and aliphaticstructures, very broad emission features at 8 and 12 μm are seen in the spectra ofprotoplanetary nebulae (Figure 6.10). Since the 6.9 μm band is known to originatefrom a mixture of �CH2 and �CH3 deformation modes [274], associated bendingmodes of other side groups can also be present. Examples include the �C(CH3)3
bending modes at 8.16 μm (Figure 6.11, site (e)) and the DC(CH3)2 (site (f)) bend-ing mode at 8.6 μm. These features together can form a quasicontinuum similarto the observed broad feature.
Similarly, the 11.3 μm aromatic out-of-plane bending mode can be accompaniedby a complex set of features due to out-of-plane vibrations of alkenes. Such groupscan be connected directly to the aromatic rings (e.g., the �CHDCHCH3 group atsite (a) of Figure 6.11), or indirectly (�CH2CHDCH2; Figure 6.11, site (b)) throughan alkyl (CH2)n linkage to aromatic rings. Cyclic alkanes (�CH2CH2CH2�, site (c))may also contribute in the short wavelength part (9.5–11.5 μm) of this band andlong chains of four or more �CH2� groups (�(CH2)4CH3, site (d)) may contributeto the long wavelength end (13.9 μm).
106 6 Synthesis of Organic Compounds in the Late Stages of Stellar Evolution
The existence of the plateau emission features therefore suggests that the struc-ture of these carbonaceous grains is complex and probably includes a variety ofalkane and alkene side groups attached to aromatic rings. Comparison betweenthe astronomical plateau features seen in Figure 6.10 and the infrared spectrumof semianthracite coal shows a lot of similarity, suggesting that the carbonaceousgrains in protoplanetary nebulae may have a chemical structure similar to coal(Section 9.8).
6.3
Chemical Evolution
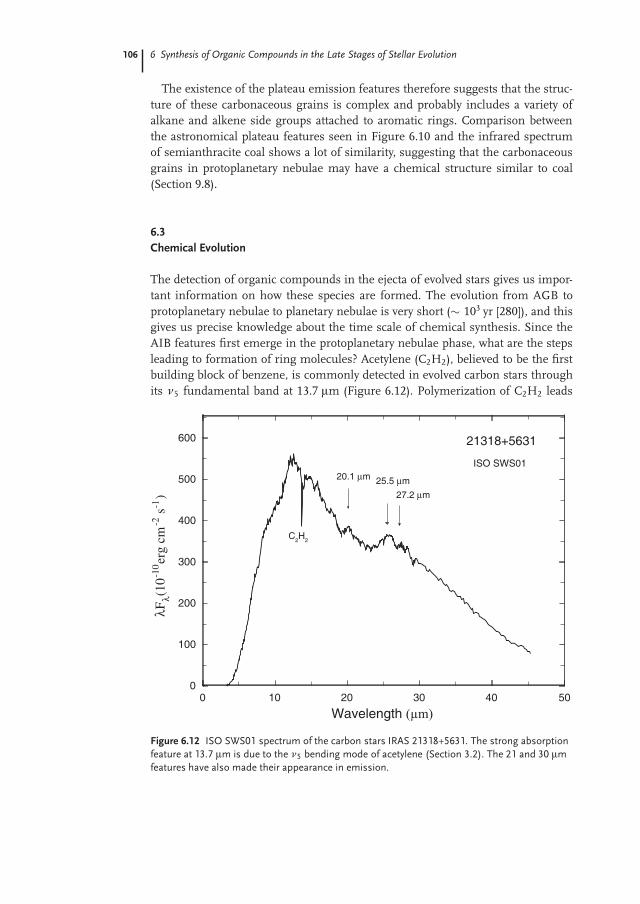
The detection of organic compounds in the ejecta of evolved stars gives us impor-tant information on how these species are formed. The evolution from AGB toprotoplanetary nebulae to planetary nebulae is very short (� 103 yr [280]), and thisgives us precise knowledge about the time scale of chemical synthesis. Since theAIB features first emerge in the protoplanetary nebulae phase, what are the stepsleading to formation of ring molecules? Acetylene (C2H2), believed to be the firstbuilding block of benzene, is commonly detected in evolved carbon stars throughits ν5 fundamental band at 13.7 μm (Figure 6.12). Polymerization of C2H2 leads
0 10 20 30 40 50
Wavelength (μm)
0
100
200
300
400
500
600
λFλ(
10-1
0er
g cm
-2 s
-1 )
21318+5631
ISO SWS01
25.5 μm20.1 μm
C2H2
27.2 μm
Figure 6.12 ISO SWS01 spectrum of the carbon stars IRAS 21318+5631. The strong absorption
feature at 13.7 μm is due to the ν5 bending mode of acetylene (Section 3.2). The 21 and 30 μm
features have also made their appearance in emission.
6.3 Chemical Evolution 107
13 14 15 16 17
Wavelength ( μm)
500
1000
1500
2000
λFλ(
10-1
0er
g cm
-2 s
-1)
AFGL 618
C2H2
HCN
HC3N
C4H2
HC5N
C6H2
ISO SWS06
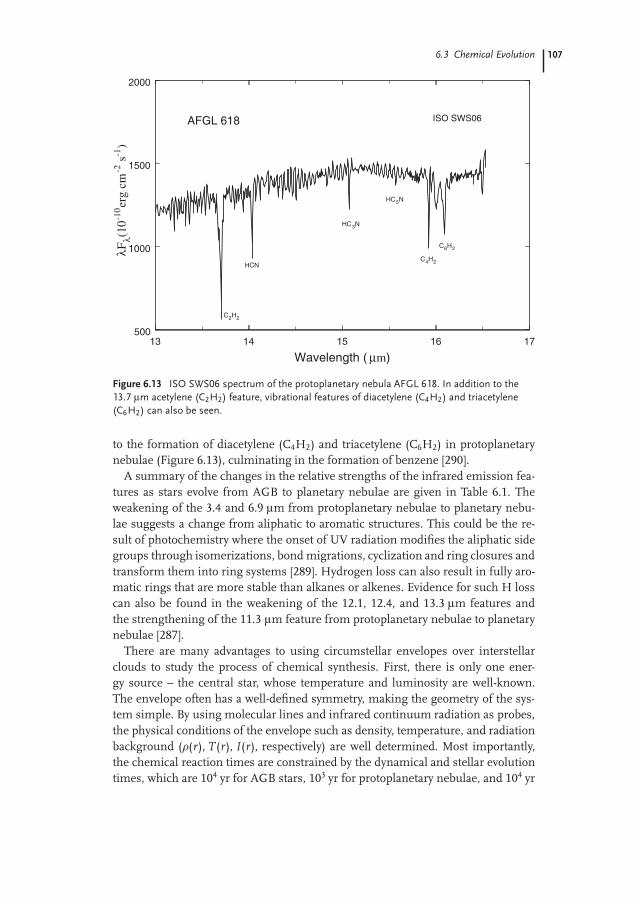
Figure 6.13 ISO SWS06 spectrum of the protoplanetary nebula AFGL 618. In addition to the
13.7 μm acetylene (C2H2) feature, vibrational features of diacetylene (C4H2) and triacetylene
(C6H2) can also be seen.
to the formation of diacetylene (C4H2) and triacetylene (C6H2) in protoplanetarynebulae (Figure 6.13), culminating in the formation of benzene [290].
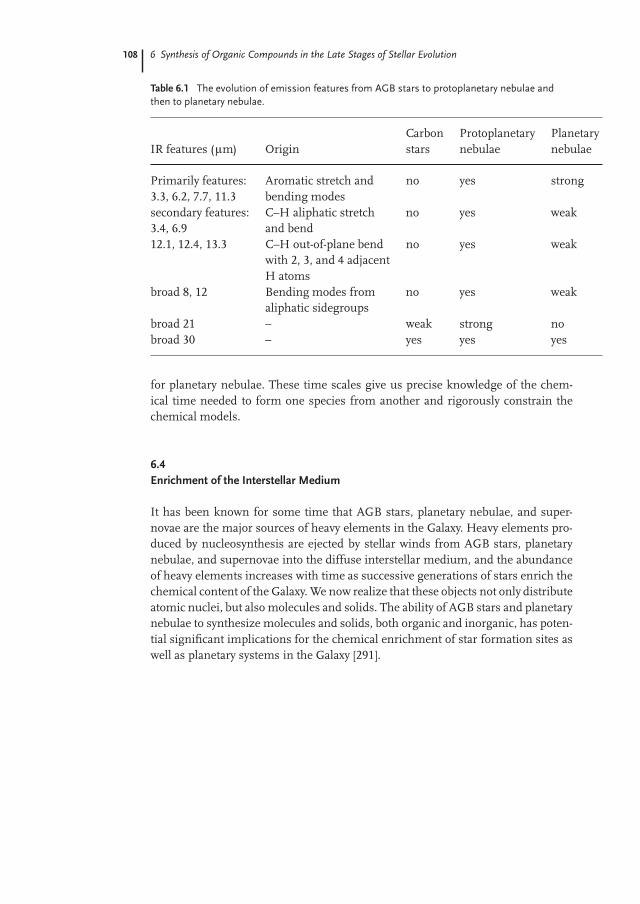
A summary of the changes in the relative strengths of the infrared emission fea-tures as stars evolve from AGB to planetary nebulae are given in Table 6.1. Theweakening of the 3.4 and 6.9 μm from protoplanetary nebulae to planetary nebu-lae suggests a change from aliphatic to aromatic structures. This could be the re-sult of photochemistry where the onset of UV radiation modifies the aliphatic sidegroups through isomerizations, bond migrations, cyclization and ring closures andtransform them into ring systems [289]. Hydrogen loss can also result in fully aro-matic rings that are more stable than alkanes or alkenes. Evidence for such H losscan also be found in the weakening of the 12.1, 12.4, and 13.3 μm features andthe strengthening of the 11.3 μm feature from protoplanetary nebulae to planetarynebulae [287].
There are many advantages to using circumstellar envelopes over interstellarclouds to study the process of chemical synthesis. First, there is only one ener-gy source – the central star, whose temperature and luminosity are well-known.The envelope often has a well-defined symmetry, making the geometry of the sys-tem simple. By using molecular lines and infrared continuum radiation as probes,the physical conditions of the envelope such as density, temperature, and radiationbackground (�(r), T(r), I(r), respectively) are well determined. Most importantly,the chemical reaction times are constrained by the dynamical and stellar evolutiontimes, which are 104 yr for AGB stars, 103 yr for protoplanetary nebulae, and 104 yr
108 6 Synthesis of Organic Compounds in the Late Stages of Stellar Evolution
Table 6.1 The evolution of emission features from AGB stars to protoplanetary nebulae and
then to planetary nebulae.
Carbon Protoplanetary PlanetaryIR features (μm) Origin stars nebulae nebulae
Primarily features: Aromatic stretch and no yes strong3.3, 6.2, 7.7, 11.3 bending modessecondary features: C–H aliphatic stretch no yes weak3.4, 6.9 and bend12.1, 12.4, 13.3 C–H out-of-plane bend no yes weak
with 2, 3, and 4 adjacentH atoms
broad 8, 12 Bending modes from no yes weakaliphatic sidegroups
broad 21 – weak strong nobroad 30 – yes yes yes
for planetary nebulae. These time scales give us precise knowledge of the chem-ical time needed to form one species from another and rigorously constrain thechemical models.
6.4
Enrichment of the Interstellar Medium
It has been known for some time that AGB stars, planetary nebulae, and super-novae are the major sources of heavy elements in the Galaxy. Heavy elements pro-duced by nucleosynthesis are ejected by stellar winds from AGB stars, planetarynebulae, and supernovae into the diffuse interstellar medium, and the abundanceof heavy elements increases with time as successive generations of stars enrich thechemical content of the Galaxy. We now realize that these objects not only distributeatomic nuclei, but also molecules and solids. The ability of AGB stars and planetarynebulae to synthesize molecules and solids, both organic and inorganic, has poten-tial significant implications for the chemical enrichment of star formation sites aswell as planetary systems in the Galaxy [291].