1 Nature and sources of suspended particulate organic matter in a
37
1 Author version: Mar. Chem., vol.145-147; 2012; 16-28 Nature and sources of suspended particulate organic matter in a tropical estuary during the monsoon and pre-monsoon: Insights from stable isotopes (δ 13 C POC, δ 15 N TPN ) and carbohydrate signature compounds Vishwas B. Khodse, Narayan B. Bhosle* CSIR-National Institute of Oceanography (CSIR), Dona Paula, Goa, 403004, India *Corresponding author: Tel: +91-832-2450234; FAX: +91-832-2450602; E-mail: [email protected] ABSTRACT Mandovi estuary, on the west coast of India, behaves like a fresh water system during the monsoon (June to September), and as a marine system during the pre-monsoon (October to May). The effect of these contrasting conditions on the concentration and composition of suspended particulate carbohydrates was evaluated. Suspended particulate matter (SPM) was collected from 9 stations in the Mandovi estuary during the monsoon (August) and pre-monsoon (March), and was analyzed for δ 13 C POC , δ 15 N TPN, particulate carbohydrates (PCHO), particulate uronic acid (PUA), and particulate neutral carbohydrate (PNCHO) concentration and composition. The concentrations of PCHO, PNCHO and PUA varied from 2 to 9 μMC, 2 to 7 μMC, and from 0.14 to 0.39 μMC, respectively during the monsoon; and from 4 to 10 μMC, 3 to 9 μMC, and from 0.34 to 0.90 μMC, respectively during the pre-monsoon. Both δ 13 C POC and δ 15 N TPN were depleted during the monsoon and relatively enriched during the pre-monsoon. When expressed as % of SPM, particulate organic carbon (POC) and PCHO concentration decreased with increasing SPM content. The average PCHO yield (PCHO-C/POC%) was 13.9% ± 4.4% and ~10.7% ± 2.6% for the monsoon and pre- monsoon, respectively. POC and PCHO concentrations were influenced by cell numbers of bacteria and phytoplankton during the monsoon and pre-monsoon, respectively. Glucose was the most abundant constituent of PNCHO in both the monsoon and pre-monsoon. Rhamnose, fucose, ribose, galactose, arabinose, and xylose were relatively more abundant during the monsoon than the pre-monsoon. Preferential utilization of glucose results in accumulation of deoxy sugars (i.e. rhamnose plus fucose). The ratios of hexoses/pentoses and mannose/xylose and mol% glucose were relatively lower, and mol% deoxy sugars higher during the monsoon than the pre-monsoon. Conversely, during the pre-monsoon, monosaccharide composition did not vary much and was mostly dominated by glucose. Monosaccharide abundance and ratios suggest that organic matter was subjected to extensive diagenetic alterations during the monsoon than the pre-monsoon. Carbohydrate carbon normalized to organic carbon was not useful to assess the degradation state of organic matter. POC containing 13.9% of PCHO is transported to coastal waters during the high discharge monsoon period. Dilution, differences in sources, biodegradation and physiological state of phytoplankton appear to affect the transport of particulate carbohydrates in the Mandovi estuary. Keywords: Particulate organic carbon, Stable isotopes, Particulate carbohydrates, Monosaccharides, Uronic acid, Degradation, Mandovi estuary, west coast of India
Transcript of 1 Nature and sources of suspended particulate organic matter in a
1
Author version: Mar. Chem., vol.145-147; 2012; 16-28
Nature and sources of suspended particulate organic matter in a tropical estuary during the monsoon and pre-monsoon: Insights from stable isotopes (δ13CPOC,
δ15NTPN) and carbohydrate signature compounds Vishwas B. Khodse, Narayan B. Bhosle*
CSIR-National Institute of Oceanography (CSIR), Dona Paula, Goa, 403004, India
*Corresponding author: Tel: +91-832-2450234; FAX: +91-832-2450602; E-mail: [email protected]
ABSTRACT Mandovi estuary, on the west coast of India, behaves like a fresh water system during the monsoon (June to September), and as a marine system during the pre-monsoon (October to May). The effect of these contrasting conditions on the concentration and composition of suspended particulate carbohydrates was evaluated. Suspended particulate matter (SPM) was collected from 9 stations in the Mandovi estuary during the monsoon (August) and pre-monsoon (March), and was analyzed for δ13CPOC, δ15NTPN, particulate carbohydrates (PCHO), particulate uronic acid (PUA), and particulate neutral carbohydrate (PNCHO) concentration and composition. The concentrations of PCHO, PNCHO and PUA varied from 2 to 9 µMC, 2 to 7 µMC, and from 0.14 to 0.39 µMC, respectively during the monsoon; and from 4 to 10 µMC, 3 to 9 µMC, and from 0.34 to 0.90 µMC, respectively during the pre-monsoon. Both δ13CPOC and δ15NTPN were depleted during the monsoon and relatively enriched during the pre-monsoon. When expressed as % of SPM, particulate organic carbon (POC) and PCHO concentration decreased with increasing SPM content. The average PCHO yield (PCHO-C/POC%) was 13.9% ± 4.4% and ~10.7% ± 2.6% for the monsoon and pre-monsoon, respectively. POC and PCHO concentrations were influenced by cell numbers of bacteria and phytoplankton during the monsoon and pre-monsoon, respectively. Glucose was the most abundant constituent of PNCHO in both the monsoon and pre-monsoon. Rhamnose, fucose, ribose, galactose, arabinose, and xylose were relatively more abundant during the monsoon than the pre-monsoon. Preferential utilization of glucose results in accumulation of deoxy sugars (i.e. rhamnose plus fucose). The ratios of hexoses/pentoses and mannose/xylose and mol% glucose were relatively lower, and mol% deoxy sugars higher during the monsoon than the pre-monsoon. Conversely, during the pre-monsoon, monosaccharide composition did not vary much and was mostly dominated by glucose. Monosaccharide abundance and ratios suggest that organic matter was subjected to extensive diagenetic alterations during the monsoon than the pre-monsoon. Carbohydrate carbon normalized to organic carbon was not useful to assess the degradation state of organic matter. POC containing 13.9% of PCHO is transported to coastal waters during the high discharge monsoon period. Dilution, differences in sources, biodegradation and physiological state of phytoplankton appear to affect the transport of particulate carbohydrates in the Mandovi estuary. Keywords: Particulate organic carbon, Stable isotopes, Particulate carbohydrates, Monosaccharides, Uronic acid, Degradation, Mandovi estuary, west coast of India
2
1. Introduction
Estuaries are important sites for production, transformation and removal of dissolved and
particulate organic material (DOM and POM) (Bianchi and Bauer, 2012; Bauer and Bianchi, 2012).
Organic matter (OM) in estuaries is derived from allochthonous (terrestrial plants, soils), and
autochthonous (in situ aquatic production) sources (Degens et al., 1991). Estuarine POM is rich in
carbohydrates and contains small quantities of terpenoids, humics, alkanes, phenols, tannins and
lignin (Degens et al., 1991; Kujawinski et al., 2002). Transportation of OM from rivers via estuaries
to marine systems represents a significant process in the global carbon cycle (Meybeck, 1982;
Ludwig et al., 1996). Both POM and DOM serve as a source of carbon to heterotrophic organisms,
especially bacteria. In order to sustain biogeochemical activities, bio-reactive OM is required.
Therefore, it is essential to understand the origin, abundance and bio-reactivity of OM that sustain
high levels of heterotrophic activities in estuaries. A number of parameters including stable carbon
and nitrogen isotopes, C/N and POC/Chl a ratios and molecular level characterization of
carbohydrates have often been used to distinguish sources and bioreactivity of OM (Cowie and
Hedges, 1984; Goni et al., 2003; Wu et al., 2007; Malet et al., 2008; He et al., 2010;
Panagiotopoulos et al., 2011).
Carbohydrates are the major organic compounds produced by autotrophic
organisms during the process of photosynthesis, and serve as common structural and storage
components in both marine and terrestrial plants. Carbohydrates may account for 2 to 39% of
particulate organic carbon (POC) of the suspended (D’Souza and Bhosle, 2001; Khodse et al.,
2007; Panagiotopoulos et al., 2011) and sedimenting particles (Hernes et al., 1996; D’Souza et al.,
2003; Panagiotopoulos and Sempere, 2005). Carbohydrates serve as an important energy source
for heterotrophic organisms in the water column and sediments (Decho, 1990). During transport of
organic matter from the euphotic zone to greater depths storage carbohydrates are preferentially
utilized by in situ organisms (Tanoue and Handa, 1987; Bhosle and Wagh, 1989; Ittekkot et al.,
1992; Hernes et al., 1996; Khodse et al., 2007). Preferential utilization of storage carbohydrate
results in the accumulation of relatively less degradable structural carbohydrates in particulate
matter of deep oceanic waters and marine sediments (Tanoue and Handa, 1987; Cowie and
Hedges, 1994; Burdige et al., 2000; Jensen et al., 2005; He et al., 2010). Due to their ubiquitous
nature and abundance, carbohydrates represent a powerful tool for elucidation of sources,
processes and diagenetic pathways of biologically important organic materials in marine
environments (Cowie and Hedges, 1984; Moers et al., 1990; Hicks et al., 1994). The relative
abundance of individual sugars and sugar ratios in a sample has been used to distinguish
terrestrial, marine, siliceous and carbonaceous inputs to the particulate matter and sediments
(Cowie and Hedges, 1984; Ittekkot et al., 1984; D’Souza et al., 2003; Khodse et al., 2007, 2008; He
et al., 2010; Panagiotopoulos et al., 2011). The contribution of neutral carbohydrate carbon to
3
organic carbon defined as yield provides information on the degradation state of organic matter,
where high yield typically indicates fresh organic matter (Cowie and Hedges, 1984; Skoog and
Benner, 1997).
Many organisms produce acidic carbohydrate such as uronic acid (UA). Production of UA is
influenced by season, growth phase, and levels of nutrients, suspended particles, and metal ions
(Decho, 1990; Bergamaschi et al., 1999). Although present as a minor component of POC (0.2 to
2.6%) (Hung et al., 2003a,b, 2009; Khodse et al., 2007), these acidic carbohydrates are involved in
humic acid formation (Yamaoka, 1983), detoxification of toxic chemicals and removal of metal ions
(Decho, 1990; Santschi et al., 1998; Quigley et al., 2002), production of macroaggregates (Mopper
et al., 1995), microbial adhesion and biofilm development (Jain and Bhosle, 2009). Dissolved UAs
are utilized by natural populations of marine bacteria (Khodse and Bhosle, 2011). In the northern
Indian Ocean, the concentrations of particulate uronic acid (PUA) generally decreased over water
column depth suggesting their utilization by heterotrophic organisms (Khodse et al., 2007).
However, little is known about the dynamics of these compounds in rivers, estuaries and marine
environments (Hung et al., 2003a, 2009; Khodse et al., 2007, 2008, 2010; Khodse and Bhosle,
2011; Panagiotopoulos et al., 2011).
Tropical estuaries on the west coast of India are strongly influenced by south west (SW)
summer monsoon (June to September). Due to heavy river run off (1634 to 1809 M cum/month), the
Mandovi estuary on the west coast of India behaves like a fresh water system during the SW
summer monsoon (Suprit and Shankar, 2008). In contrast, during the dry pre-monsoon season
(October to May) river run-off is very low (0.136 to 0.186 M cum/month) and the estuary acts as a
marine system extending from the mouth of the estuary to several kilometers upstream (Qasim and
Sengupta, 1981; Shetye et al., 2007; Pratihary et al., 2009; Khodse et al., 2010; Fernandes, 2011;
Maya et al., 2011). The effect of the SW monsoon and the dry pre-monsoon on physical, chemical
and biological characteristics of the estuary has been well characterized (Qasim and Sengupta,
1981; De Sousa, 1983; Devassy and Goes, 1988; Ansari and Parulekar, 1993; Shetye et al., 1995,
2007; Ram et al., 2003; Pratihary et al., 2009). Recently, Kessarkar et al. (2010) reported on
seasonal variation, mineral composition and qualitative observation on diatoms of the SPM in the
Mandovi estuary. Conversely, little is known about dynamics, nature, sources and cycling of
dissolved and particulate organic matter in tropical monsoon driven estuaries. For example, Khodse
et al. (2010) reported the distribution of bulk dissolved carbohydrates and uronic acids in the
Mandovi estuary. Fernandes (2011) studied the biochemical cycling of particulate nitrogen and used
bulk parameters such as δ13CPOC and C/N ratio to characterize the sources of organic matter in the
Mandovi estuary. Based on these bulk parameters and amino acid yields, Fernandes (2011)
concluded that particulate organic matter was derived from terrestrial sources and was degraded
during the monsoon while it was relatively fresh and was of planktonic origin during the pre-
4
monsoon. However, no studies have thus far been published on the concentration, composition and
biochemical cycling of particulate carbohydrates at the molecular level in this tropical monsoon
driven estuaries. Moreover, molecular level information is more specific and sensitive than the bulk
elemental and isotopic techniques in characterizing sources of organic matter, and further allows for
identification of multiple sources (Bianchi and Bauer, 2012). Therefore, we asked a question, how
does summer monsoon influences concentration and composition of particulate carbohydrates? In
order to answer the question, we collected SPM samples from various stations during the monsoon
and pre-monsoon season and analyzed for concentration and composition of particulate
carbohydrates. In the present study our aims were to: 1) examine the distribution of particulate
carbohydrates, 2) determine the composition of carbohydrates, and 3) evaluate carbohydrates as
indicators of sources and diagenetic changes, and 4) determine the effect of monsoon on the
concentration and composition of carbohydrates.
2. Materials and methods
2.1. Study area
The Mandovi estuarine system is located in Goa, the west coast of India between 15° 15’ N and 15°
42’ N and 73° 45’ E and 74° 24’ E. The total length of the estuary is about 75 km and the width at
the mouth is about 3.2 km. The estuary is fringed with extensive mangroves. The climate is humid,
tropical with moderate temperature. During the SW summer monsoon (June – September), the
average rainfall in Goa is 300 to 350 cm/year of which nearly 80% occurs in 3 months (June -
August) (Unnikrishnan et al., 1997). Nearly all of the freshwater discharge occurs only during the
SW monsoon. Mandovi River transports 6 x 1015 cm3/year of water and ~ 5.5 x 10⁴ ton/year of
suspended particulate matter (SPM) to the Arabian Sea (Suprit and Shankar, 2008). The intense
river flow during the south west monsoon season is countered by the strong westerly winds, wind -
induced waves and currents, and tides. A wind speed of 4 to 7 m s-1 and tidal range of 2 to 2.5 cm
have been observed (Shetye et al., 1995; Sundar and Shetye, 2005; Shetye et al 2007). On the
other hand, rainfall between October to May is negligible; therefore terrigenous sediment discharge
is likely at its lowest. Winds are moderate this time and are dominated by sea breeze cycle. Weak
easterly winds prevail during northeast (NE) monsoon (November to February). The currents in the
estuary, however, are tidally dominated, and saline waters occur several kilometers upstream from
the river mouth during the dry season (Shetye et al., 1995). Thus, the channels of the estuary turn
from mainly riverine during the SW monsoon to highly saline for several kilometers from the mouth
during the remaining 8 months. The residence time of the water in the Mandovi estuary is 5 to 6 d
during the SW monsoon season and about 50 d during the non-monsoon season (October – May)
(Qasim and Sengupta, 1981; Shetye et al., 2007).
5
2.2. Sample collection
Surface (~1 m) water samples were collected using 5 liter Niskin water samplers from 9 locations in
the Mandovi estuary during the monsoon (August) and the pre-monsoon (March) seasons (Fig. 1).
Sampling was carried out during the low tide, and was completed within five and half hours.
Immediately after collection, water was passed through 200 µm mesh nylon screen to remove large
zooplankton, and then known aliquots (0.25 to 1.5 L) were filtered through pre-combusted (450 °C,
4h) 47 mm GF/F filter papers (0.7 µm, Whatman) for the measurements of suspended particulate
matter (SPM), particulate organic carbon (POC), δ13CPOC, δ15NTPN, particulate carbohydrates
(PCHO), particulate neutral carbohydrates (PNCHO), and particulate uronic acid (PUA). The filters
were immediately transferred into clean screw capped glass vials and transported to the laboratory
in an ice box. The samples were stored at – 20 °C until analyzed. Water samples were filtered
through mixed cellulose ester filter paper (0.22 µm, Millipore) and stored at -20 °C for 15 days and
then analyzed for dissolved organic carbon (DOC) (Khodse et al., 2010). For phytoplankton cell
counts, one liter samples were preserved with a few drops of Lugol’s iodine. In order to estimate
total bacterial count (TBC), seawater sample (20 ml) was fixed with glutaraldehyde (final
concentration 2%) and stored for 7 days at 4°C until analysis.
2.3. Determination of bulk parameters and stable isotopes
GF/F (0.7 µm, 47 mm) filter containing particulate matter was washed with UV-Milli-Q- water to
remove salt and the filter was dried at 40 °C for 24 h. Filter was cooled and weighed on a
microbalance (Mettler Model - AT/20, precision of 0.002 mg) to obtain SPM. POC was analyzed
spectrophotometrically by the wet oxidation method (Parsons et al., 1984). Glucose was used as a
standard. Analytical variation of the POC measurement was 4.9%. Prior to filtration, GF/F filters
were rinsed with UV-Milli-Q- water to minimize contamination. GF/F filter rinsed with UV-Milli-Q-
water but without SPM was used as a blank. POC values were corrected for the blank. DOC was
analyzed by the high temperature (680 °C) oxidation method using Shimadzu TOC-5000 carbon
analyzer (Khodse et al., 2010). Analytical variation of the DOC method was 3.1%. Phytoplankton
cell numbers were determined by settling and siphoning procedure to obtain 20 to 25 ml
concentrated sample (Khodse et al., 2010). In order to estimate TBC, a known volume of seawater
(2 to 5 ml) was stained with acridine orange (final concentration 0.01%) for 5 min, filtered onto 0.22
µm black Nucleopore polycarbonate filter. Bacterial cells were counted in at least 25 randomly
selected fields using 100x objective, and an epifluorescence microscope (Nikon). Average cell
numbers per field was calculated, and used to estimate bacterial cells following the procedure
described by Parsons et al. (1984).
In order to analyze δ13CPOC, and δ15NTPN, GF/F filters containing particulate material were treated
with vapours of concentrated HCl to remove carbonates, and oven dried at 40 °C for 24 h (Hedges
6
and Stern, 1984). The bulk abundances of δ13CPOC, and δ15NTPN in the SPM on the GF/F filters were
determined using the Thermo Finnigan Flash 1112 elemental analyzer coupled online via a conflo
interface with an Thermo Finnigan Delta V plus isotope ratio mass spectrometer (EA-IRMS-Delta
Plus, Thermo). Isotope ratios are reported in standard (δ) notation and expressed as per mil (‰)
differences from a standard reference material as given below:
δ X (‰) = [(R sample / R standard) - 1] × 1000
Where X is the 13CPOC or, 15NTPN, R is the corresponding ratio of 13C/12C, or 15N/14N, in a sample or
standard (PDB for carbon and atmospheric N2 for nitrogen). Precision of δ13CPOC and δ15NTPN
measurement was ± 0.04‰ and ± 0.1‰, respectively based on replicate analysis of IAEA
(International Atomic Energy Agency) standard.
2.4. Determination of carbohydrate species
PCHO was measured by the method of Dubois et al. (1956) following the details described earlier
(Khodse et al., 2007; Khodse and Bhosle, 2010). In brief, the GF/F filter containing the particulate
matter was treated with 12 M H2SO4 at room temperature (28 ± 2 °C). After 2 h, 2 ml 5% phenol
followed by 5 ml concentrated H2SO4 were added. The samples were cooled and absorption was
measured at 490 nm. Glucose was used as a standard. The unit used is µM C, and is obtained by
multiplying µM values by 6 assuming 6 moles of carbon per mole of glucose. Analytical variation of
the method was 8.6%.
The concentrations and composition of the PNCHO in samples were determined using the capillary
gas chromatographic method (D’Souza et al., 2005; Khodse et al., 2007; 2008). Briefly, the GF/F
filter containing particulate matter was treated with 1 ml of 12 M H2SO4 at room temperature (28 ± 2
°C). After 2 h, the sample was diluted to 1.2 M H2SO4 using cold UV-Milli-Q water, flushed with
nitrogen, sealed and then hydrolyzed for 3 h at 100 °C. After cooling, an internal standard (inositol)
was added. The sample was neutralized, treated with NaBH4, acetylated and analyzed using a
capillary gas chromatograph (Shimadzu GC Model- 2010) (D’Souza et al., 2005; Khodse et al.,
2007, 2008). The GC was equipped with a flame ionization detector (FID), a programmable on-
column injector, and a fused silica capillary column coated with CPSil-88 (25 m, id = 0.32 mm). Both
the detector and on-column injector were maintained at 300 °C. A sample was injected when the
oven temperature was 70 °C, and rapidly raised to 150 °C at 30 °C/min, and thereafter at 3 °C/min
to 230 °C and maintained at this temperature for 10 min. Quantification of the components was by
peak area integration using the data handling system installed in the instrument. In this study, the
PNCHO has been defined as the sum of all the identified monosaccharides. The contribution of
individual monosaccharide to the PNCHO was expressed as mol%. Analytical variation of the GC
plus sample preparation method was <7.8%.
7
PUAs were analyzed by the method of Filisetti-Cozzi and Carpita (1991) following the details
described in Khodse et al. (2007) and Khodse and Bhosle (2010). In short, GF/F filter containing
particulate matter was placed into a clean test tube and 0.4 ml UV-Milli-Q water followed by 40 µl 2
M sulfamic acid were added. Subsequently, 2.4 ml 75 mM sodium tetraborate in concentrated
H2SO4 was added to the test tube and heated at 100 °C for 10 min in a boiling water bath. After
cooling 80 µl 0.15% m-hydroxydiphenyl was added, and the absorbance was measured at 525 nm.
Glucuronic acid was used as a standard. The unit used is µM C, and is obtained by multiplying µM
values by 6 assuming 6 moles of carbon per mol of glucuronic acid. Analytical variation of the
method was <8.6%.
2.5. Statistical analysis
Before statistical analysis, normality and homogeneity was determined using Shapiro’s and
Levene’s test, respectively. The POC and PNCHO data was log transformed to obtain normal
distribution. The PCHO and PUA data were normally distributed. In order to understand spatial and
seasonal variations in POC, PCHO, PNCHO and PUA paired t-test was carried out using
STATISTICA software. Correlation between parameters was assessed using Excel software
program (Sokal and Rohlf, 1981).
Principal component analysis (PCA) was performed on a personal computer using the
statistical software package version 5.0 (Statsoft, Inc.). The data matrix used for PCA consisted of
individual monosaccharides (as mol%). The raw data matrix was normalized in order to nullify the
influence of the components, which were present in higher concentrations. Normalization was
carried out by taking the logarithm of mol% concentration plus 1, i.e. log (x+1) where x was the
mol% concentration of each sugar. Factors were extracted after varimax rotation and when the
eigen values were more than 1.
3. Results
3.1. Bulk parameters and stable isotopes
Phytoplankton cell numbers varied from 0.26 to 3.84 x 10⁴/l during the monsoon, and from 0.27 to
3.21 x 10⁴/l during the pre-monsoon (Table 1). The TBC ranged from 5.4 to 29.1 x 10⁸/l and from
17.1 to 42.1 x 10⁸/l during the monsoon and pre-monsoon, respectively (Table 1). During the
monsoon, the values of SPM, POC, were high at downstream stations (1 to 3), and generally
decreased towards the upstream stations (7 and 8) of the estuary (Table 1). Conversely, during the
pre-monsoon season, the concentrations of POC were lower at downstream stations (1, 2, and 3)
than those recorded at the upstream stations 4 to 9. Average concentration of POC was higher
during the pre-monsoon than the monsoon (Table 1). When expressed as a percentage of SPM,
8
POC generally decreased from upstream station 9 to the downstream station 1 (data not shown).
Percentage of POC decreased with increasing SPM content (Fig. 2a). δ13CPOC values varied from -
32.1 to - 25.1‰, and from - 29.6 to - 21.1‰ during the monsoon and the pre-monsoon, respectively
(Table 1). δ15NTPN values ranged from - 2.9 to 2.4‰ during the monsoon, and from 5.9 to 9.6‰
during the pre-monsoon (Table 1). DOC values varied from 80 to 195 µM C, and from 148 to 194
µMC during the monsoon and pre-monsoon, respectively. DOC/POC ratios were >1 suggesting
higher DOC transport compared with POC (Table 1).
3.2. Particulate carbohydrates species
The concentrations of PCHO, PNCHO and PUA in the Mandovi estuary during the monsoon
and pre-monsoon are presented in Table 1. During the monsoon season, the concentrations of
PCHO, PNCHO, and PUA generally decreased from downstream station (station 1) to upstream
station 6, and then increased again at upstream stations 7 and 8 (Table 1). In contrast, during the
pre-monsoon, the concentrations of PCHO, PNCHO and PUA did not produce consistent pattern in
their distribution. PCHO showed significant relationship (r = 0.695, p<0.001) with POC. Percentage
of PCHO decreased with increasing SPM content (Fig. 2b). The contribution of PNCHO to PCHO
varied from 41 to 89% (mean = 70 ± 16%) during the monsoon, and from 55 to 93% (mean = 73 ±
15%) during the pre-monsoon (Data not shown). There was a good correspondence (r = 0.844,
p<0.001) between the PCHO concentrations measured by the phenol-sulfuric acid method (Dubois
et al., 1956) and the PNCHO determined by the GC method. This suggests that a large proportion
of PCHO (70 to 73%) consisted of PNCHO concentrations and showed a significant relationship
with phytoplankton cell numbers during the pre-monsoon (r = 0.810, p<0.01) and with bacterial cell
numbers during the monsoon (r = 0.756, p<0.02). PAA/PNCHO ratios were higher for the pre-
monsoon than the monsoon (Fig. 3). The ratio decreased from station 2 to station 8 during the
monsoon and did not exhibit any particular trend during the pre-monsoon (Fig. 3).
The contribution of PCHO-C, PNCHO-C and PUA-C to POC is defined as yield. The yields of
PCHO, PNCHO and PUA generally decreased from upstream station 8 to downstream station 1
(Fig. 4a, b, c). Carbohydrate yields showed significant spatial differences (p<0.001). The
PCHO/PUA ratios were significantly higher (p<0.002) during the pre-monsoon than the monsoon
(Table 1).
3.2. Monosaccharide composition
The capillary gas chromatographic analysis revealed the presence of arabinose, fucose, galactose,
glucose, mannose, rhamnose, ribose, and xylose in the SPM of the Mandovi estuary during both the
monsoon and pre-monsoon (Fig. 5). During the monsoon, glucose (30 to 59 mol% of PNCHO) was
the most abundant monosaccharide followed by rhamnose (7 to 30 mol%), galactose (10 to 25
9
mol%), mannose (4 to 11 mol%), fucose (1.8 to 13 mol%), xylose (2 to 9 mol%), arabinose (1 to 14
mol%) and ribose (<1 to 7 mol%) (Fig. 6, Table 2). Glucose was again the most abundant (60 to 77
mol%) monosaccharide followed by galactose (10 to 16 mol%), mannose (4 to 9 mol%), rhamnose
(4 to 7 mol%), xylose (1 to 4 mol%), arabinose (1 to 3 mol%), fucose (1 to 3 mol%), and ribose (<1
to 2 mol%) during the pre-monsoon (Fig. 6, Table 2). Monosaccharide data suggest that glucose
was the most abundant sugar during both the monsoon and pre-monsoon while rhamnose,
galactose, fucose, ribose, arabinose and xylose were relatively more abundant during the monsoon.
Ribose concentrations reported here are minimal because this monosaccharide gets destroyed
during the acid hydrolysis. Three factors were obtained when mol% monosaccharides of different
stations were subjected to principal component analysis (PCA) (Table 3). Together these three
factors accounted for 90% of variance. The factor 1 showed very high positive factor loading for
rhamnose and fucose and high negative factor loading for glucose. Arabinose and ribose controlled
the factor 2, while mannose influenced the factor 3.
Monosaccharides were classified as hexoses (glucose, mannose, and galactose), pentoses (ribose,
arabinose, and xylose) and deoxy sugars (rhamnose plus fucose). Hexoses accounted for 52% to
91% of the PNCHO and were higher during the pre-monsoon (78 to 91%, mean = 86 ± 3%) than the
monsoon (52 to 85%, mean = 66 ± 12%) (Fig. 7a, b). The contribution of pentoses to the PNCHO
was higher during the monsoon (4 to 27%, mean = 12 ± 7%) than the pre-monsoon (2 to 7%, mean
= 5 ± 2%) (Fig. 7a, b). Deoxy sugars accounted for 6 to 38% of the PNCHO, and their contribution
to the PNCHO was higher during the monsoon (9 to 38%, mean 21 ± 12%) than the pre-monsoon (6
to 9%, mean 8 ± 1.2%) (Fig. 7a, b). Rhamnose plus fucose to arabinose plus xylose ratios varied
from 0.8 to 6.1 (mean = 2.7 ± 1.9) during the monsoon, and from 1.4 to 4.8 during the pre-monsoon
(mean = 2.2 ± 1.1) (Fig. 8a). The ratios for the monsoon and pre-monsoon were not significantly
(p>0.609) different. The hexoses to pentoses ratios varied spatially and seasonally, and were
significantly (p<0.01) higher for the pre-monsoon than monsoon (Fig. 8b). Mannose to xylose ratios
varied from 0.6 to 2.7 (mean = 1.7 ± 0.6) and 2.4 to 5.4 (mean = 3.9 ± 1.3) during the monsoon and
pre-monsoon, respectively (Fig. 8c). The mannose to xylose ratios were significantly (p<0.0002)
higher for the pre-monsoon than the monsoon.
4. Discussion
4.1. Particulate carbohydrate concentrations
The concentrations of PCHO and PNCHO observed for the Mandovi estuary are in the range
values observed for the rivers, estuaries and coastal waters (Ochiai et al., 1988; Ittekkot et al.,
1982; Preston and Prodduturu, 1992; Sigleo, 1996; D’Souza and Bhosle, 2001; Hung et al., 2009;
Panagiotopoulos et al., 2011). PCHO and PNCHO showed significant (p<0.0001) spatial variations
during both the monsoon and pre-monsoon. During the monsoon, concentrations of SPM, POC,
10
PCHO and PNCHO are higher at downstream stations 1, 2, and 3 probably due to hydrodynamic
sorting of SPM (Duan and Bianchi, 2007). During low discharge period, there is rapid settling of
large particles, which are temporarily stored in estuarine bed. Moreover, during the monsoon, a
sand bar develops at the mouth of the Mandovi estuary, wherein suspended particles are trapped
and stored (Qasim and Sengupta, 1981). Higher values of SPM, POC and PCHO at the
downstream stations 1 to 3 were ascribed to higher river run-off and re-suspension of sediments
due to strong westerly winds (5.1 to 5.6 m s-1), wind induced waves and currents and stirring by
tides (2 to 2.5 m). Conversely, during the pre-monsoon, no particular distribution trend was evident
for these parameters presumably because of the negligible river run-off, and the absence of re-
suspension due to weak easterly winds (1.8 to 2.6 m s-1). During the pre-monsoon, PCHO
concentrations at stations 1, 2 and 3 were low probably due to low phytoplankton biomass at these
stations (Table 1). During the pre-monsoon concentrations of PCHO and PNCHO were higher at
station 4 than those observed at many other stations probably due to high phytoplankton biomass at
this station (Table 1). Moreover, this station was also influenced by terrestrial inputs (δ13CPOC -
29.6‰). Greater carbohydrate concentration at station 4 was due to both high phytoplankton
biomass and terrestrial input. Percentages of POC and PCHO decreased with increasing SPM
values (Fig. 2). This was probably due to dilution of allochthonous (plants and woody materials) and
autochthonous (river plankton) organic matter by re-suspended sediments or inorganic material
coming from erosion of terrigenous soils (Ittekkot and Arain, 1986). Moreover, phytoplankton growth
and primary production in the Mandovi estuary is considerably reduced due to light limited condition
and cloud cover during the monsoon (Thurman, 1985; Shetye et al., 2007).
Carbohydrate production by microorganisms is influenced by several factors including
phytoplankton biomass, phytoplankton species, phase of growth, nutrient status, and/or bacterial
activities (Morris, 1981; Sakugawa and Handa, 1985). Phytoplankton cell numbers and composition
varied spatially and seasonally. Diatoms were generally abundant in the Mandovi estuary, and their
composition and relative distribution as well as that of dinoflagellates varied spatially and seasonally
during both the monsoon and pre-monsoon (Prabhu Matondkar, 2007; Khodse et al., 2010).
Diatoms are known to produce large amounts of carbohydrates in culture (Handa, 1969; Myklestad,
1989; Bhosle et al., 1995), and in natural waters, especially during stationary growth phase and/or
under nutrient deficient condition (Myklestad, 1977; Ittekkot et al., 1981; Tanoue and Handa, 1987;
D’Souza and Bhosle, 2001). Hecky et al. (1973) observed large variation in the cell wall
carbohydrates for various fresh and brackish water diatom species. Concentrations of nutrients
nitrate, phosphate and silicates varied spatially, and were higher during the monsoon than the pre-
monsoon (Khodse et al., 2010). TBC cell numbers also varied spatially during both the monsoon
and pre-monsoon. During the monsoon, TBC showed significant positive relationship (r = 0.756,
p<0.02) with PCHO suggesting that bacteria influenced carbohydrate concentrations in the Mandovi
11
estuary. Carbohydrate concentrations were strongly influenced by phytoplankton biomass and
bacterial activity in the Gulf of Mexico and East China Sea (Hung et al., 2003b, 2009). Therefore,
changes in bacterial cell numbers, phytoplankton abundance, species composition, growth phase,
nutrient levels and terrestrial input may have influenced seasonal and spatial distribution of
carbohydrates in the Mandovi estuary (Hecky et al., 1973; Sakugawa and Handa, 1985; Hung et al.,
2003b, 2009).
4.2. Particulate uronic acid concentration
Several organisms including microalgae and bacteria produce acidic polysaccharides such as
uronic acids (Decho, 1990). Uronic acids are negatively charged acidic polysaccharides, which are
involved in many biogeochemical processes in marine environments (Decho, 1990; Tang et al.,
2001; Ndung’u et al., 2003). However, not much is known about the distribution and cycling of PUA
in marine and estuarine environments (Hung et al., 2001, 2003a, 2009; Bergamaschi et al., 1999;
Khodse et al., 2007). PUA concentrations, PUA/PCHO ratios, and PUA yields (PUA-C/POC ×100)
observed for the Mandovi estuary are in the range of values reported earlier from other
environments (Table 1, Fig. 4c) (Bergamaschi et al., 1999; Hamanaka et al., 2002; Hung et al.,
2003a, 2009; Khodse et al., 2007). PUA concentrations do not correlate with TBC but showed
significant positive relationship with phytoplankton cells count during the monsoon (r = 0.678, p<
0.05) and pre-monsoon (r = 0.815, p<0.01) suggesting that production of uronic acid in the Mandovi
estuary was mostly controlled by phytoplankton. In the Gulf of Mexico, concentrations of uronic
acids were controlled by cyanobacteria and prymnesiophyte in 2000 and 2001, respectively (Hung
et al., 2003b). Production of uronic acids by microorganisms is also influenced by nutrient status in
growth medium or in natural waters (Leppard, 1993). Concentrations of nitrate, phosphates and
silicates were higher during the monsoon than pre-monsoon (Khodse et al., 2010). Greater
concentration of PUA in the pre-monsoon may indicate the effect of low nutrient concentrations
(Table 1). Adsorption by SPM due to their surface active nature is another factor that is likely to
influence concentrations of PUA in water column (Bergamaschi et al., 1999; Hung et al., 2003a).
Such a process, however, was not very active in the Mandovi estuary based on the lack of
correspondence between these two parameters (Table 1).
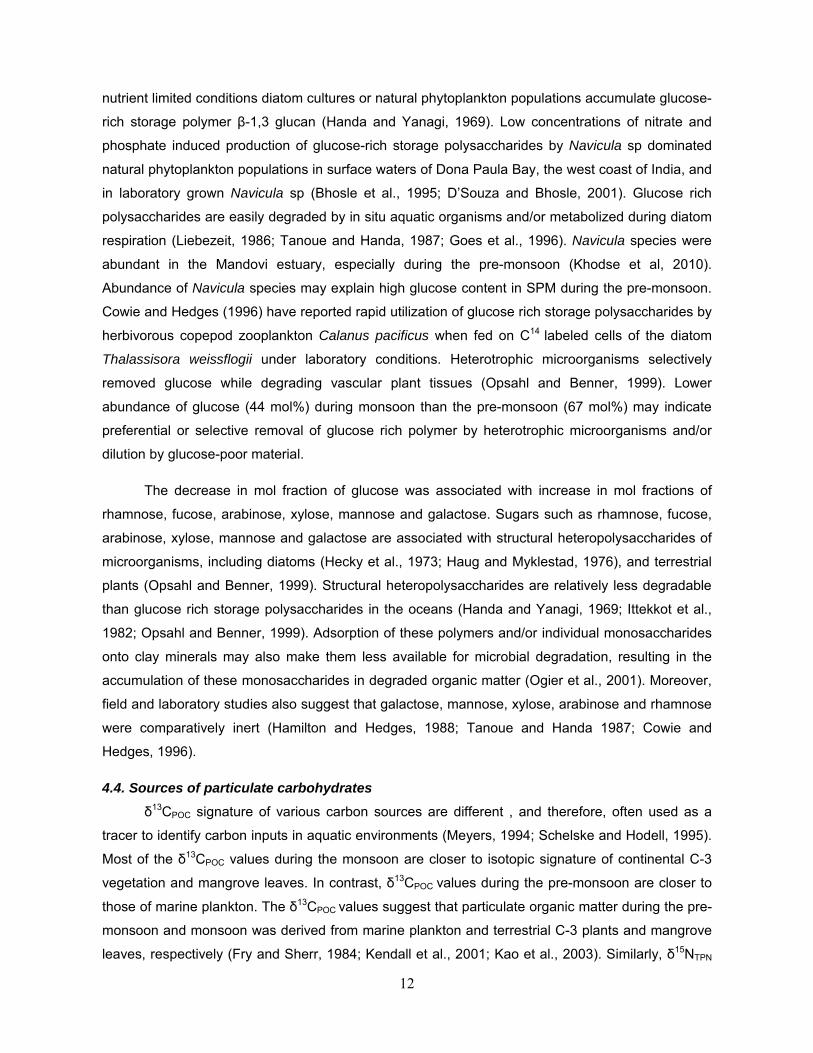
4.3. Monosaccharide composition of carbohydrates
Glucose was the most abundant monosaccharide during both the monsoon (30 to 59 mol%)
and pre-monsoon (60 to 77 mol%) (Table 2). This was to be expected since glucose is abundant in
both terrestrial and marine organic matter (Cowie and Hedges, 1984). During the phytoplankton
bloom, or in laboratory grown stationary phase diatom culture, glucose may account for 20 to 80%
of PNCHO (Handa and Yanagi, 1969; Ittekkot et al., 1982; D’Souza and Bhosle, 2001). Under
12
nutrient limited conditions diatom cultures or natural phytoplankton populations accumulate glucose-
rich storage polymer β-1,3 glucan (Handa and Yanagi, 1969). Low concentrations of nitrate and
phosphate induced production of glucose-rich storage polysaccharides by Navicula sp dominated
natural phytoplankton populations in surface waters of Dona Paula Bay, the west coast of India, and
in laboratory grown Navicula sp (Bhosle et al., 1995; D’Souza and Bhosle, 2001). Glucose rich
polysaccharides are easily degraded by in situ aquatic organisms and/or metabolized during diatom
respiration (Liebezeit, 1986; Tanoue and Handa, 1987; Goes et al., 1996). Navicula species were
abundant in the Mandovi estuary, especially during the pre-monsoon (Khodse et al, 2010).
Abundance of Navicula species may explain high glucose content in SPM during the pre-monsoon.
Cowie and Hedges (1996) have reported rapid utilization of glucose rich storage polysaccharides by
herbivorous copepod zooplankton Calanus pacificus when fed on C14 labeled cells of the diatom
Thalassisora weissflogii under laboratory conditions. Heterotrophic microorganisms selectively
removed glucose while degrading vascular plant tissues (Opsahl and Benner, 1999). Lower
abundance of glucose (44 mol%) during monsoon than the pre-monsoon (67 mol%) may indicate
preferential or selective removal of glucose rich polymer by heterotrophic microorganisms and/or
dilution by glucose-poor material.
The decrease in mol fraction of glucose was associated with increase in mol fractions of
rhamnose, fucose, arabinose, xylose, mannose and galactose. Sugars such as rhamnose, fucose,
arabinose, xylose, mannose and galactose are associated with structural heteropolysaccharides of
microorganisms, including diatoms (Hecky et al., 1973; Haug and Myklestad, 1976), and terrestrial
plants (Opsahl and Benner, 1999). Structural heteropolysaccharides are relatively less degradable
than glucose rich storage polysaccharides in the oceans (Handa and Yanagi, 1969; Ittekkot et al.,
1982; Opsahl and Benner, 1999). Adsorption of these polymers and/or individual monosaccharides
onto clay minerals may also make them less available for microbial degradation, resulting in the
accumulation of these monosaccharides in degraded organic matter (Ogier et al., 2001). Moreover,
field and laboratory studies also suggest that galactose, mannose, xylose, arabinose and rhamnose
were comparatively inert (Hamilton and Hedges, 1988; Tanoue and Handa 1987; Cowie and
Hedges, 1996).
4.4. Sources of particulate carbohydrates
δ13CPOC signature of various carbon sources are different , and therefore, often used as a
tracer to identify carbon inputs in aquatic environments (Meyers, 1994; Schelske and Hodell, 1995).
Most of the δ13CPOC values during the monsoon are closer to isotopic signature of continental C-3
vegetation and mangrove leaves. In contrast, δ13CPOC values during the pre-monsoon are closer to
those of marine plankton. The δ13CPOC values suggest that particulate organic matter during the pre-
monsoon and monsoon was derived from marine plankton and terrestrial C-3 plants and mangrove
leaves, respectively (Fry and Sherr, 1984; Kendall et al., 2001; Kao et al., 2003). Similarly, δ15NTPN
13
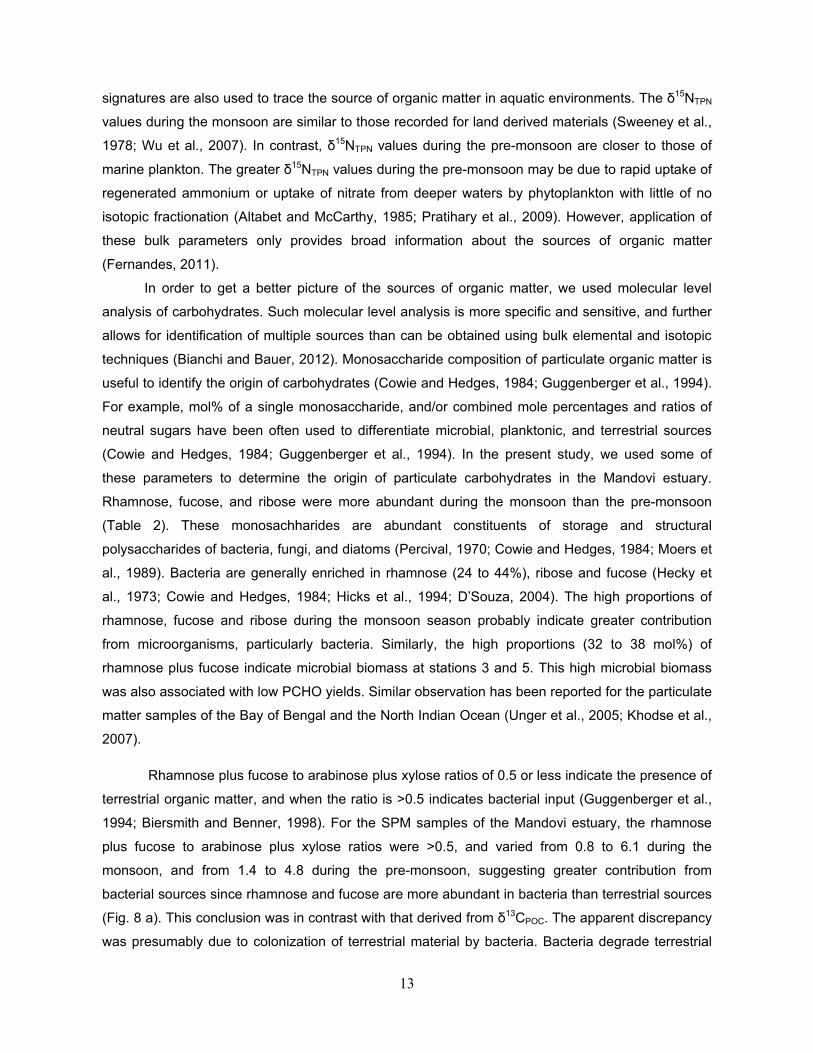
signatures are also used to trace the source of organic matter in aquatic environments. The δ15NTPN
values during the monsoon are similar to those recorded for land derived materials (Sweeney et al.,
1978; Wu et al., 2007). In contrast, δ15NTPN values during the pre-monsoon are closer to those of
marine plankton. The greater δ15NTPN values during the pre-monsoon may be due to rapid uptake of
regenerated ammonium or uptake of nitrate from deeper waters by phytoplankton with little of no
isotopic fractionation (Altabet and McCarthy, 1985; Pratihary et al., 2009). However, application of
these bulk parameters only provides broad information about the sources of organic matter
(Fernandes, 2011).
In order to get a better picture of the sources of organic matter, we used molecular level
analysis of carbohydrates. Such molecular level analysis is more specific and sensitive, and further
allows for identification of multiple sources than can be obtained using bulk elemental and isotopic
techniques (Bianchi and Bauer, 2012). Monosaccharide composition of particulate organic matter is
useful to identify the origin of carbohydrates (Cowie and Hedges, 1984; Guggenberger et al., 1994).
For example, mol% of a single monosaccharide, and/or combined mole percentages and ratios of
neutral sugars have been often used to differentiate microbial, planktonic, and terrestrial sources
(Cowie and Hedges, 1984; Guggenberger et al., 1994). In the present study, we used some of
these parameters to determine the origin of particulate carbohydrates in the Mandovi estuary.
Rhamnose, fucose, and ribose were more abundant during the monsoon than the pre-monsoon
(Table 2). These monosachharides are abundant constituents of storage and structural
polysaccharides of bacteria, fungi, and diatoms (Percival, 1970; Cowie and Hedges, 1984; Moers et
al., 1989). Bacteria are generally enriched in rhamnose (24 to 44%), ribose and fucose (Hecky et
al., 1973; Cowie and Hedges, 1984; Hicks et al., 1994; D’Souza, 2004). The high proportions of
rhamnose, fucose and ribose during the monsoon season probably indicate greater contribution
from microorganisms, particularly bacteria. Similarly, the high proportions (32 to 38 mol%) of
rhamnose plus fucose indicate microbial biomass at stations 3 and 5. This high microbial biomass
was also associated with low PCHO yields. Similar observation has been reported for the particulate
matter samples of the Bay of Bengal and the North Indian Ocean (Unger et al., 2005; Khodse et al.,
2007).
Rhamnose plus fucose to arabinose plus xylose ratios of 0.5 or less indicate the presence of
terrestrial organic matter, and when the ratio is >0.5 indicates bacterial input (Guggenberger et al.,
1994; Biersmith and Benner, 1998). For the SPM samples of the Mandovi estuary, the rhamnose
plus fucose to arabinose plus xylose ratios were >0.5, and varied from 0.8 to 6.1 during the
monsoon, and from 1.4 to 4.8 during the pre-monsoon, suggesting greater contribution from
bacterial sources since rhamnose and fucose are more abundant in bacteria than terrestrial sources
(Fig. 8 a). This conclusion was in contrast with that derived from δ13CPOC. The apparent discrepancy
was presumably due to colonization of terrestrial material by bacteria. Bacteria degrade terrestrial
14
organic matter, and while doing so, they leave their imprint on degraded terrestrial organic matter
(Tremblay and Benner, 2009). The high proportions of deoxy sugars (rhamnose and fucose) during
the monsoon suggest bacterial colonization of terrestrial material (Tremblay and Benner, 2009).
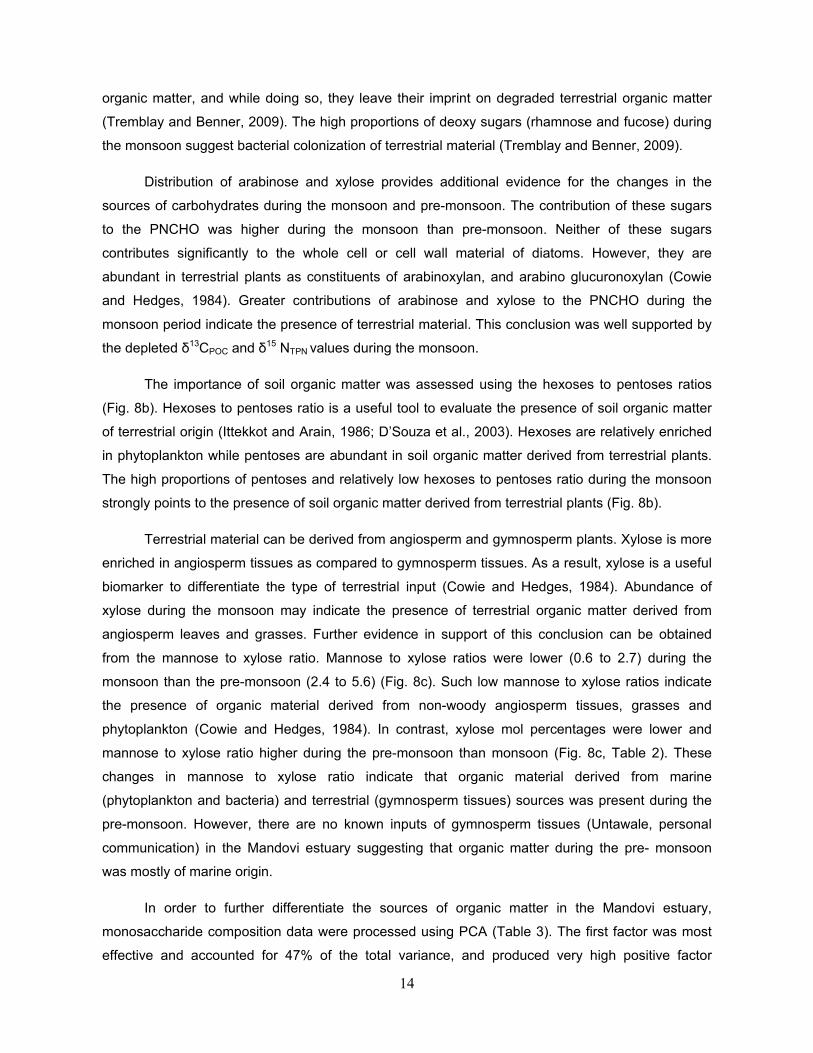
Distribution of arabinose and xylose provides additional evidence for the changes in the
sources of carbohydrates during the monsoon and pre-monsoon. The contribution of these sugars
to the PNCHO was higher during the monsoon than pre-monsoon. Neither of these sugars
contributes significantly to the whole cell or cell wall material of diatoms. However, they are
abundant in terrestrial plants as constituents of arabinoxylan, and arabino glucuronoxylan (Cowie
and Hedges, 1984). Greater contributions of arabinose and xylose to the PNCHO during the
monsoon period indicate the presence of terrestrial material. This conclusion was well supported by
the depleted δ13CPOC and δ15 NTPN values during the monsoon.
The importance of soil organic matter was assessed using the hexoses to pentoses ratios
(Fig. 8b). Hexoses to pentoses ratio is a useful tool to evaluate the presence of soil organic matter
of terrestrial origin (Ittekkot and Arain, 1986; D’Souza et al., 2003). Hexoses are relatively enriched
in phytoplankton while pentoses are abundant in soil organic matter derived from terrestrial plants.
The high proportions of pentoses and relatively low hexoses to pentoses ratio during the monsoon
strongly points to the presence of soil organic matter derived from terrestrial plants (Fig. 8b).
Terrestrial material can be derived from angiosperm and gymnosperm plants. Xylose is more
enriched in angiosperm tissues as compared to gymnosperm tissues. As a result, xylose is a useful
biomarker to differentiate the type of terrestrial input (Cowie and Hedges, 1984). Abundance of
xylose during the monsoon may indicate the presence of terrestrial organic matter derived from
angiosperm leaves and grasses. Further evidence in support of this conclusion can be obtained
from the mannose to xylose ratio. Mannose to xylose ratios were lower (0.6 to 2.7) during the
monsoon than the pre-monsoon (2.4 to 5.6) (Fig. 8c). Such low mannose to xylose ratios indicate
the presence of organic material derived from non-woody angiosperm tissues, grasses and
phytoplankton (Cowie and Hedges, 1984). In contrast, xylose mol percentages were lower and
mannose to xylose ratio higher during the pre-monsoon than monsoon (Fig. 8c, Table 2). These
changes in mannose to xylose ratio indicate that organic material derived from marine
(phytoplankton and bacteria) and terrestrial (gymnosperm tissues) sources was present during the
pre-monsoon. However, there are no known inputs of gymnosperm tissues (Untawale, personal
communication) in the Mandovi estuary suggesting that organic matter during the pre- monsoon
was mostly of marine origin.
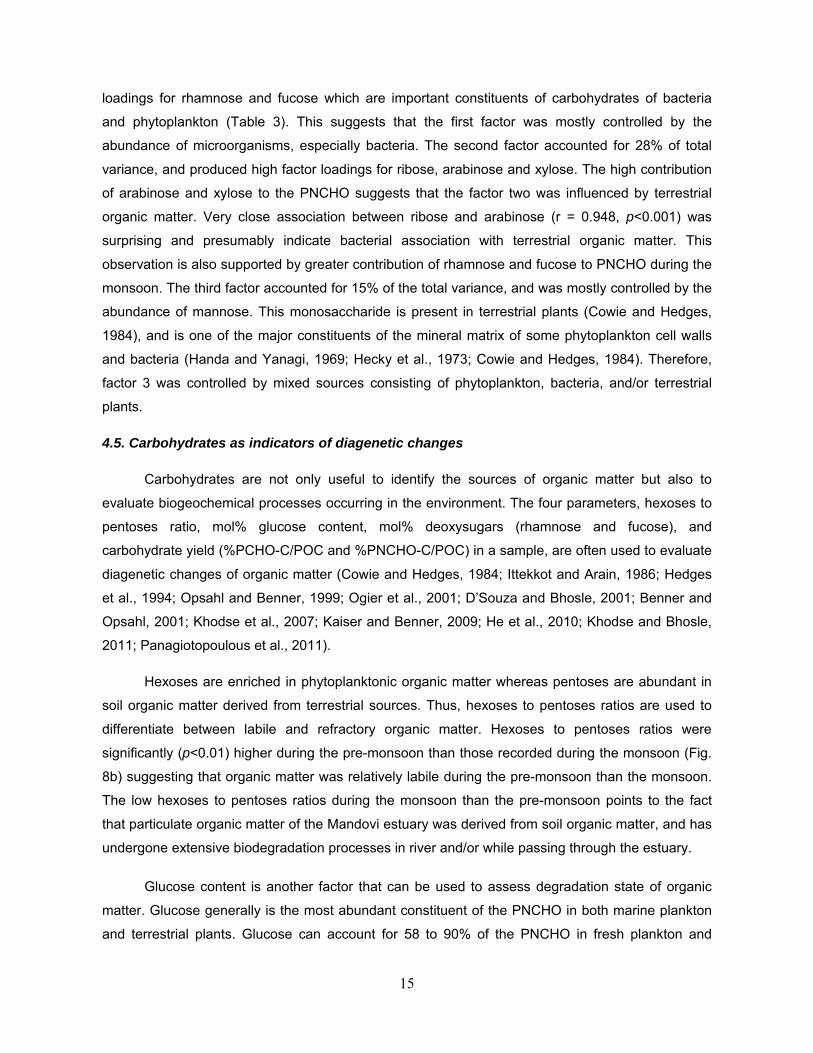
In order to further differentiate the sources of organic matter in the Mandovi estuary,
monosaccharide composition data were processed using PCA (Table 3). The first factor was most
effective and accounted for 47% of the total variance, and produced very high positive factor
15
loadings for rhamnose and fucose which are important constituents of carbohydrates of bacteria
and phytoplankton (Table 3). This suggests that the first factor was mostly controlled by the
abundance of microorganisms, especially bacteria. The second factor accounted for 28% of total
variance, and produced high factor loadings for ribose, arabinose and xylose. The high contribution
of arabinose and xylose to the PNCHO suggests that the factor two was influenced by terrestrial
organic matter. Very close association between ribose and arabinose (r = 0.948, p<0.001) was
surprising and presumably indicate bacterial association with terrestrial organic matter. This
observation is also supported by greater contribution of rhamnose and fucose to PNCHO during the
monsoon. The third factor accounted for 15% of the total variance, and was mostly controlled by the
abundance of mannose. This monosaccharide is present in terrestrial plants (Cowie and Hedges,
1984), and is one of the major constituents of the mineral matrix of some phytoplankton cell walls
and bacteria (Handa and Yanagi, 1969; Hecky et al., 1973; Cowie and Hedges, 1984). Therefore,
factor 3 was controlled by mixed sources consisting of phytoplankton, bacteria, and/or terrestrial
plants.
4.5. Carbohydrates as indicators of diagenetic changes
Carbohydrates are not only useful to identify the sources of organic matter but also to
evaluate biogeochemical processes occurring in the environment. The four parameters, hexoses to
pentoses ratio, mol% glucose content, mol% deoxysugars (rhamnose and fucose), and
carbohydrate yield (%PCHO-C/POC and %PNCHO-C/POC) in a sample, are often used to evaluate
diagenetic changes of organic matter (Cowie and Hedges, 1984; Ittekkot and Arain, 1986; Hedges
et al., 1994; Opsahl and Benner, 1999; Ogier et al., 2001; D’Souza and Bhosle, 2001; Benner and
Opsahl, 2001; Khodse et al., 2007; Kaiser and Benner, 2009; He et al., 2010; Khodse and Bhosle,
2011; Panagiotopoulous et al., 2011).
Hexoses are enriched in phytoplanktonic organic matter whereas pentoses are abundant in
soil organic matter derived from terrestrial sources. Thus, hexoses to pentoses ratios are used to
differentiate between labile and refractory organic matter. Hexoses to pentoses ratios were
significantly (p<0.01) higher during the pre-monsoon than those recorded during the monsoon (Fig.
8b) suggesting that organic matter was relatively labile during the pre-monsoon than the monsoon.
The low hexoses to pentoses ratios during the monsoon than the pre-monsoon points to the fact
that particulate organic matter of the Mandovi estuary was derived from soil organic matter, and has
undergone extensive biodegradation processes in river and/or while passing through the estuary.
Glucose content is another factor that can be used to assess degradation state of organic
matter. Glucose generally is the most abundant constituent of the PNCHO in both marine plankton
and terrestrial plants. Glucose can account for 58 to 90% of the PNCHO in fresh plankton and
16
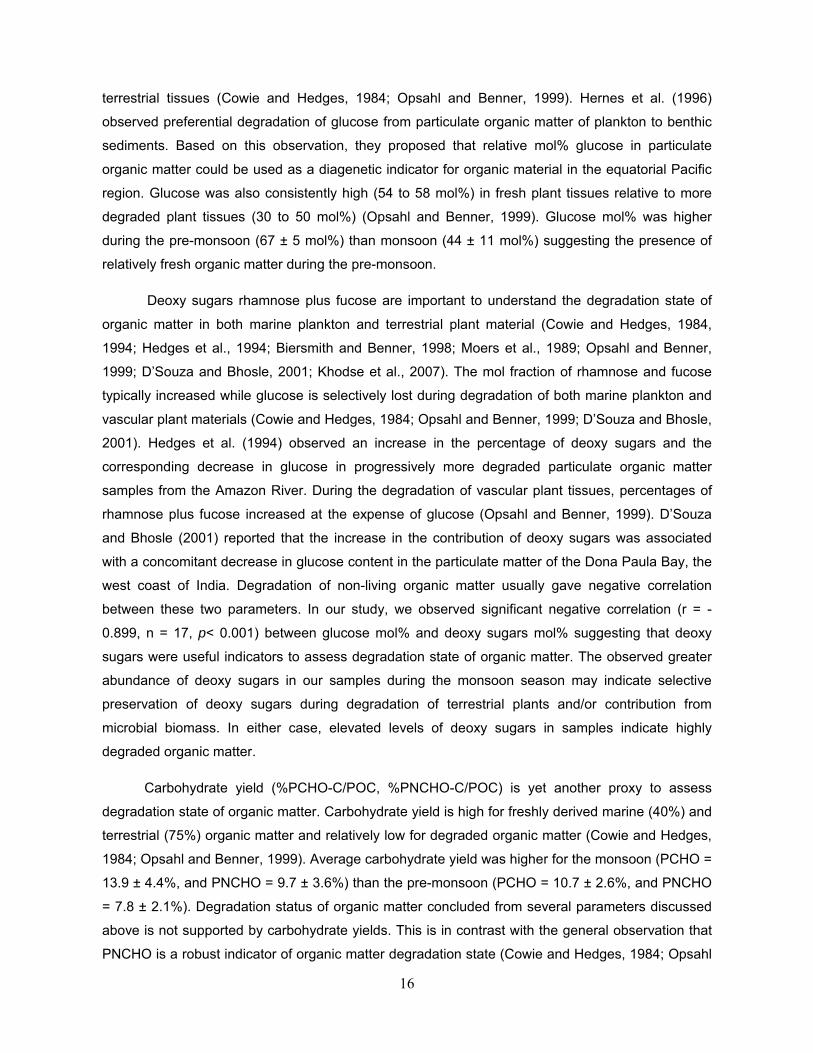
terrestrial tissues (Cowie and Hedges, 1984; Opsahl and Benner, 1999). Hernes et al. (1996)
observed preferential degradation of glucose from particulate organic matter of plankton to benthic
sediments. Based on this observation, they proposed that relative mol% glucose in particulate
organic matter could be used as a diagenetic indicator for organic material in the equatorial Pacific
region. Glucose was also consistently high (54 to 58 mol%) in fresh plant tissues relative to more
degraded plant tissues (30 to 50 mol%) (Opsahl and Benner, 1999). Glucose mol% was higher
during the pre-monsoon (67 ± 5 mol%) than monsoon (44 ± 11 mol%) suggesting the presence of
relatively fresh organic matter during the pre-monsoon.
Deoxy sugars rhamnose plus fucose are important to understand the degradation state of
organic matter in both marine plankton and terrestrial plant material (Cowie and Hedges, 1984,
1994; Hedges et al., 1994; Biersmith and Benner, 1998; Moers et al., 1989; Opsahl and Benner,
1999; D’Souza and Bhosle, 2001; Khodse et al., 2007). The mol fraction of rhamnose and fucose
typically increased while glucose is selectively lost during degradation of both marine plankton and
vascular plant materials (Cowie and Hedges, 1984; Opsahl and Benner, 1999; D’Souza and Bhosle,
2001). Hedges et al. (1994) observed an increase in the percentage of deoxy sugars and the
corresponding decrease in glucose in progressively more degraded particulate organic matter
samples from the Amazon River. During the degradation of vascular plant tissues, percentages of
rhamnose plus fucose increased at the expense of glucose (Opsahl and Benner, 1999). D’Souza
and Bhosle (2001) reported that the increase in the contribution of deoxy sugars was associated
with a concomitant decrease in glucose content in the particulate matter of the Dona Paula Bay, the
west coast of India. Degradation of non-living organic matter usually gave negative correlation
between these two parameters. In our study, we observed significant negative correlation (r = -
0.899, n = 17, p< 0.001) between glucose mol% and deoxy sugars mol% suggesting that deoxy
sugars were useful indicators to assess degradation state of organic matter. The observed greater
abundance of deoxy sugars in our samples during the monsoon season may indicate selective
preservation of deoxy sugars during degradation of terrestrial plants and/or contribution from
microbial biomass. In either case, elevated levels of deoxy sugars in samples indicate highly
degraded organic matter.
Carbohydrate yield (%PCHO-C/POC, %PNCHO-C/POC) is yet another proxy to assess
degradation state of organic matter. Carbohydrate yield is high for freshly derived marine (40%) and
terrestrial (75%) organic matter and relatively low for degraded organic matter (Cowie and Hedges,
1984; Opsahl and Benner, 1999). Average carbohydrate yield was higher for the monsoon (PCHO =
13.9 ± 4.4%, and PNCHO = 9.7 ± 3.6%) than the pre-monsoon (PCHO = 10.7 ± 2.6%, and PNCHO
= 7.8 ± 2.1%). Degradation status of organic matter concluded from several parameters discussed
above is not supported by carbohydrate yields. This is in contrast with the general observation that
PNCHO is a robust indicator of organic matter degradation state (Cowie and Hedges, 1984; Opsahl
17
and Benner, 1999). During the monsoon season, organic matter was derived from terrestrial
sources. Terrestrial vascular plants are rich in cellulose, and therefore have higher C/N ratio than
marine phytoplankton (Cowie and Hedges, 1984; Opsahl and Benner, 1999). Moreover, proteins
are labile organic molecules, and their preferential utilization by bacteria will result in accumulation
of carbohydrates in degraded terrestrial material. In contrast, during the pre-monsoon, organic
matter was derived from marine phytoplankton. Laboratory grown diatom cultures and natural
phytoplankton populations are known to produce lower amount of carbohydrates and higher amount
of proteins during the early logarithmic growth phase (Myklestad, 1977; Hitchcock, 1978). During
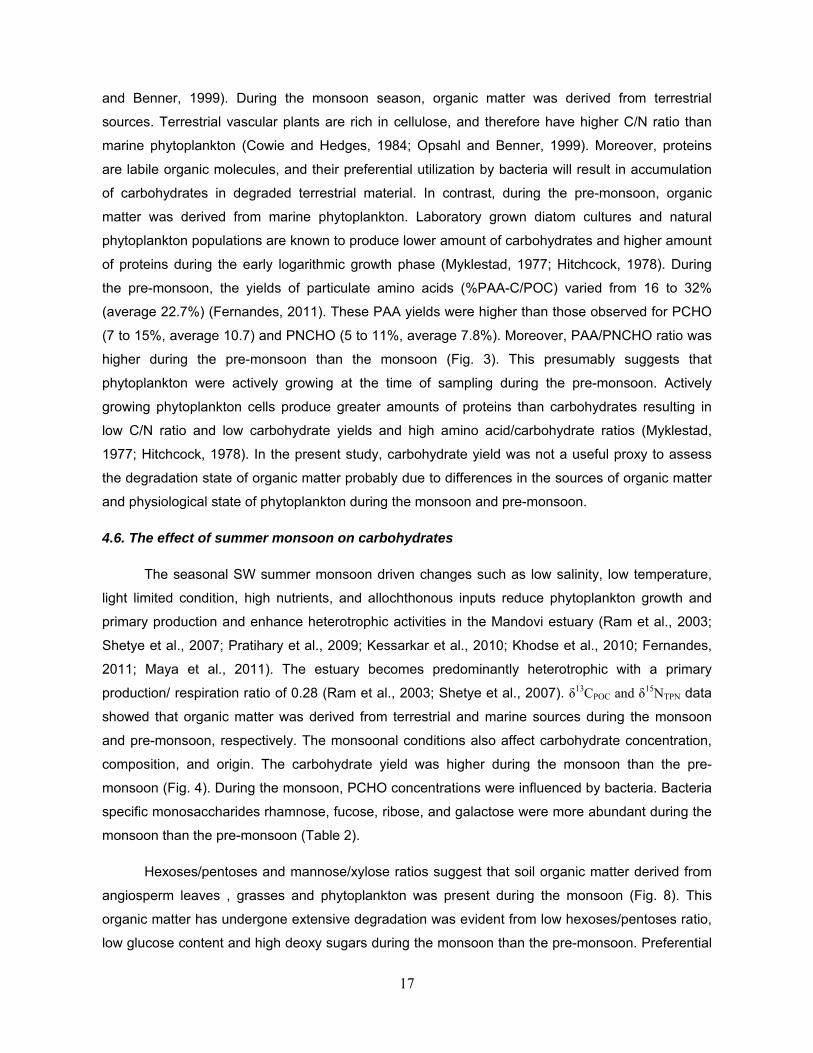
the pre-monsoon, the yields of particulate amino acids (%PAA-C/POC) varied from 16 to 32%
(average 22.7%) (Fernandes, 2011). These PAA yields were higher than those observed for PCHO
(7 to 15%, average 10.7) and PNCHO (5 to 11%, average 7.8%). Moreover, PAA/PNCHO ratio was
higher during the pre-monsoon than the monsoon (Fig. 3). This presumably suggests that
phytoplankton were actively growing at the time of sampling during the pre-monsoon. Actively
growing phytoplankton cells produce greater amounts of proteins than carbohydrates resulting in
low C/N ratio and low carbohydrate yields and high amino acid/carbohydrate ratios (Myklestad,
1977; Hitchcock, 1978). In the present study, carbohydrate yield was not a useful proxy to assess
the degradation state of organic matter probably due to differences in the sources of organic matter
and physiological state of phytoplankton during the monsoon and pre-monsoon.
4.6. The effect of summer monsoon on carbohydrates
The seasonal SW summer monsoon driven changes such as low salinity, low temperature,
light limited condition, high nutrients, and allochthonous inputs reduce phytoplankton growth and
primary production and enhance heterotrophic activities in the Mandovi estuary (Ram et al., 2003;
Shetye et al., 2007; Pratihary et al., 2009; Kessarkar et al., 2010; Khodse et al., 2010; Fernandes,
2011; Maya et al., 2011). The estuary becomes predominantly heterotrophic with a primary
production/ respiration ratio of 0.28 (Ram et al., 2003; Shetye et al., 2007). δ13CPOC and δ15NTPN data
showed that organic matter was derived from terrestrial and marine sources during the monsoon
and pre-monsoon, respectively. The monsoonal conditions also affect carbohydrate concentration,
composition, and origin. The carbohydrate yield was higher during the monsoon than the pre-
monsoon (Fig. 4). During the monsoon, PCHO concentrations were influenced by bacteria. Bacteria
specific monosaccharides rhamnose, fucose, ribose, and galactose were more abundant during the
monsoon than the pre-monsoon (Table 2).
Hexoses/pentoses and mannose/xylose ratios suggest that soil organic matter derived from
angiosperm leaves , grasses and phytoplankton was present during the monsoon (Fig. 8). This
organic matter has undergone extensive degradation was evident from low hexoses/pentoses ratio,
low glucose content and high deoxy sugars during the monsoon than the pre-monsoon. Preferential
18
utilization of glucose results in the accumulation of deoxy sugars. In contrast, improved light
condition, availability of nutrients and negligible river run-off favour phytoplankton growth during the
pre-monsoon. This was evident from higher phytoplankton cell number during the pre-monsoon
than the monsoon. Glucose content (67 ± 5%) and PAA/PNCHO ratios (Fig. 3) suggest that organic
matter was derived from freshly grown phytoplankton during the pre-monsoon. Our data suggest
that the reported contrasting differences in physical, chemical and biological parameters for the
monsoon and pre-monsoon were also reflected in concentration and composition of carbohydrates.
5. Conclusions
The data presented above show systematic changes in the concentration and composition of
carbohydrates during the low and high discharge periods. Some of the conclusions from this study
are summarized below: -
1. Carbohydrate concentrations varied spatially and seasonally, and were influenced by changes in
TBC during the monsoon and phytoplankton cell numbers during the pre-monsoon.
2. When expressed as % of SPM, carbohydrate concentration decreased with increasing SPM
content suggesting dilution by re-suspended sediments, inorganic materials and/or organic material
poor in carbohydrates.
3. PAA/PNCHO ratios suggest that carbohydrates were more abundant during the monsoon than
the pre-monsoon.
4. PUAs are surface active molecules and may play an important role in macro-aggregate
production and sedimentation of organic matter.
5. δ13CPOC, and δ15NTPN data showed the presence terrestrial and marine organic matter during the
monsoon and pre-monsoon, respectively. Better insight on the sources and diagenetic state of
organic matter was obtained using monosaccharide composition of carbohydrates.
6. Glucose was less abundant and rhamnose, fucose, ribose, galactose, arabinose and xylose were
more abundant during the monsoon than the pre-monsoon.
7. Mol% arabinose and xylose and hexoses/pentoses, and mannose/xylose ratios indicate the
presence of soil organic matter derived from angiosperm leaves, grasses and phytoplankton during
the monsoon.
8. Deoxy sugars (rhamnose plus fucose) were more abundant during the monsoon than the pre-
monsoon implying greater bacterial influence on organic matter during the former period.
19
9. Utilization of glucose results in the accumulation of deoxy sugars in degraded organic matter.
Greater abundance of deoxy sugars during the monsoon suggests that these sugars were resistant
to degradation. Alternatively, elevated levels of deoxy sugars may indicate microbial biomass and/or
enhanced microbial activity.
10. Carbohydrate yield was not useful to assess the degradation state of organic matter presumably
because of differences in sources and physiological state of phytoplankton.
11. POC containing 13.9% of carbohydrates will be exported to the coastal waters during the high
discharge monsoon period.
Acknowledgements
The authors are grateful to Dr. Satish Shetye, the Director NIO, for encouragement and facilities.
The first author is grateful to CSIR, New Delhi for providing senior research fellowship to take up
this research work. We appreciate very much the help of Mr. A.P. Selvam in running GC for neutral
sugar analysis. We are also grateful to Dr T. S. Bianchi, the handling editor, and the two anonymous
reviewers for their suggestions and comments on the earlier version of the manuscript.
References:
Altabet, M.A., MaCarthy, J.J., 1985. Temporal and spatial variations in the natural abundance of 15N in PON from a warm-core ring. Deep Sea Res. 32, 755-772.
Ansari, Z.A., Parulekar, A.H., 1993. Distribution, abundance and ecology of the meiofauna, in a tropical estuary along the west coast of India. Hydrobiologia 262, 47–56.
Bauer, J., Bianchi, T.S., 2012. Dissolve Organic Carbon Cycling and Transformation. In: Wolanski E and McLusky DS (eds.) Treatise on Estuarine and Coastal Science, Vol. 5, pp. 7–67. Waltham: Academic Press.
Bianchi, T.S., Bauer, J.E., 2012. Particulate Organic Carbon Cycling and Transformation. In: Wolanski E and McLusky DS (eds.) Treatise on Estuarine and Coastal Science, Vol. 5, pp. 69–117. Waltham: Academic Press.
Benner, R., Opsahl, S., 2001. Molecular indicators of the sources and transformations of dissolved organic matter in the Mississippi River plume. Org. Geochem. 32, 597–611.
Bergamaschi, B.A., Walters, J.S., Hedges, J., 1999. Distributions of uronic acids and O-methyl sugars in sinking and sedimentary particles in two coastal marine environments. Geochim. Cosmochim. Acta 63, 413-425.
Bhosle, N.B., Wagh, A.B., 1989. Particulate carbohydrates in the Arabian Sea. Oceanol. Acta 12, 57-63.
Bhosle, N.B., Sawant, S.S., Garg, A., Wagh, A.B., 1995. Isolation and partial chemical analysis of exopolysaccharides from the marine fouling diatom Navicula Subinflata. Bot. Mar. 38, 103-110.
Biersmith, A., Benner, R., 1998. Carbohydrates in phytoplankton and freshly produced dissolved organic matter. Mar. Chem. 63, 131-144.
20
Burdige, D.J., Skoog, A., Gardner, K., 2000. Dissolved and particulate carbohydrates in contrasting marine sediments. Geochim. Cosmochim. Acta 64, 1029-1041.
Cowie, G.L., Hedges, J.I., 1984. Carbohydrate sources in a coastal marine environment. Geochim. Cosmochim. Acta 48, 2075-2087.
Cowie, G.L., Hedges, J., 1994. Biochemical indicators of diagenetic alteration in natural organic mixtures. Nature 369, 304-307.
Cowie, G.L., Hedges, J.I., 1996. Digestion and alteration of the biochemical constituents of a diatom (Thalassiosira weissflogii) ingested by a herbivorous zooplankton (Calanus pacificus). Limnol. Oceanogr. 41, 581-594.
D’Souza, F., 2004. Study on bacterial exopolysaccharides and their role in adhesion and corrosion. Ph.D. Thesis. Goa University, India.
D’Souza, F., Bhosle, N.B., 2001. Variation in the composition of carbohydrates in the Dona Paula Bay (west of India) during May/June 1998. Oceanol. Acta 24, 221-237.
D’Souza, F., Garg, A., Bhosle N.B., 2003. Biogeochemical characteristics of sedimenting particles in Dona Paula Bay, India. Estuar. Coast. Shelf Sci. 58, 311-320.
D’Souza, F., Garg, A., Bhosle, N.B., 2005. Seasonal variation in the chemical composition and carbohydrates signature compounds of biofilm. Aquat. Microb. Ecol. 41, 199-207.
De Sousa, S.N., 1983. Studies on the behaviour of nutrients in the Mandovi Estuary during pre-monsoon. Estuar. Coast. Shelf Sci. 16, 299–308.
Decho, A.W., 1990. Microbial exopolymer secretions in the ocean environments their role(s) in food webs and marine processes. Oceanogr. Mar. Biol. Ann. Rev. 28, 73-153.
Degens, E.T., Kempe, S., and Richey, J.E., 1991. Biogeochemistry of major world rivers, Scope 42, J. Wiley and Sons, Ltd, Chichester.
Devassy, V.P., Goes, J.I., 1988. Phytoplankton community structure and succession in a tropical estuarine complex (west coast of India). Estuar. Coast. Shelf Sci. 27, 671–685.
Duan, S., Bianchi, T.S., 2007. Particulate and dissolved amino acids in the lower Mississippi and Pearl Rivers (USA). Mar. Chem. 107, 214-229.
Dubois, M., Gilles, K.A., Hamilton, J.K., Rebers, P.A., Smith, F., 1956. Colorometric method for determination of sugars and related substances. Anal. Chem. 28, 350-356.
Fernandes L., 2011. Origin and biochemical cycling of particulate nitrogen in the Mandovi estuary. Estuar. Coast. Shelf Sci. 94, 291-298.
Filisctti-Cozzi, T.M.C.C., Carpita, N.C., 1991. Measurement of uronic acids without interference from neutral sugars. Anal. Biochem. 197, 157-162.
Fry, B., Sherr, E.B., 1984. δ13C measurements as indicators of carbon flow in marine and freshwater ecosystems, Contrib. Mar. Sci. 27, 13-47.
Goes, J.I., Handa, N., Taguchi, S., Hama, T., Saito, H., 1996. Metabolism of neutral monosaccharide constituents of storage and structural carbohydrates in natural assemblages of marine phytoplankton exposed to ultraviolet radiation. Limnol. Oceanogr. 41, 1478-1489.
21
Goni, M.A., Teixeira, M.J., Perkey, D.W., 2003. Sources and distribution of organic matter in a river-dominated estuary (Winyah Bay, SC, USA). Estuar. Coast. Shelf Sci. 57, 1023-1048.
Guggenberger, G., Christensen, B.T., Zech, W., 1994. Land use effects on the composition of organic matter in particle size separates of soil: I. Lignin and carbohydrate signature. Eur. J. Soil Sci. 45, 449-458.
Hamanaka, J., Tanoue, E., Hama, T., and Handa, N., 2002. Production and export of particulate fatty acids, carbohydrates and combined amino acids in the euphotic zone. Mar. Chem. 77, 55-69.
Hamilton, S.E., Hedges, J.I., 1988. The comparitive geochemistries of lignin and carbohydrates in an anoxic fjord. Geochim. Cosmochim. Acta 52, 129-142.
Handa, N., 1969. Carbohydrate metabolisms in marine diatom Skeletonema costatum. Mar. Biol. 4, 208-214.
Handa, N., Yanagi, K., 1969. Studies on water extractable carbohydrates of the particulate matter from the northwest Pacific Ocean. Mar. Biol. 4, 197-207.
Haug, A., Myklestad, S., 1976. Polysaccharide of marine diatoms with special reference to Chaetoceros species. Mar. Biol. 34, 217-222.
He, B., Dai, M., Huang, W., Liu, Q., Chen, H., and Xu, L., 2010. Sources and accumulation of organic carbon in the Pearl River Estuary surface sediment as indicated by elemental, stable carbon isotopic, and carbohydrate compositions. Biogeosciences 7, 3343-3362.
Hecky, R.E., Mopper, K., Kilham, P., Degens, E.T., 1973. The amino acid and sugar composition of diatom cell walls. Mar. Biol. 19, 323–331.
Hedges, J.I., Stern, J.H., 1984. Carbon and nitrogen determinations of carbonate containing solids. Limnol. Oceanogr. 29, 657-663.
Hedges, J.I., Cowie, G.L., Richey, J.E., Quay, P.D., Benner, R., Strom, M., Forsberg, B.R., 1994. Origin and processing of organic matter in the Amazon River as indicated by carbohydrates and amino acids. Limnol. Oceanogr. 39, 734-761.
Hernes, P.J., Hedges, J.I., Peterson, M.L., Wakeham, S.G., Lee, C., 1996. Neutral carbohydrates of particulate material in the central equatorial Pacific. Deep Sea Res. I 43, 1181–1204.
Hicks, R.A., Owen, C.J., Aas, P., 1994. Deposition, resuspension, and decomposition of particulate organic matter in the sediments of Lake Itasca, Minnesota, USA. Hydrobologia 287, 79-91.
Hitchcock, G.L., 1978. Labeling pattern of carbon 14 in net plankton during a winter spring bloom. J. Exp. Mar. Biol. Ecol. 31, 141–153.
Hung, C.-C., Tang, D., Warnken, K.W., Santschi, P.H., 2001. Distribution of carbohydrates, including uronic acids, in estuarine waters of Galveston Bay. Mar. Chem. 73, 305-318.
Hung, C.-C., Guo, L., Santschi, P.H., Alvarado-Quiroz, N., Haye, J., 2003a. Distributions of carbohydrate species in the Gulf of Mexico. Mar. Chem. 81,119–135.
Hung, C., Guo, L., Schultz, G.E., Pinckney, J.L., Santschi, P.H., 2003b. Production and flux of carbohydrate species in the Gulf of Mexico. Global Biogeochem. Cycles 17, 1055. doi:10.1029/2002GB001988.
Hung, C.-C., Gong, G.C., Chiang, K.P., Chen H.Y., Yeager, K.M., 2009. Particulate carbohydrates and uronic acids in the northern East China Sea. Estuar. Coast. Shelf Sci. 84, 565-572.
22
Ittekkot, V., Brockman, U., Michaelis, W., Degens, E.T., 1981. Dissolved free and combined carbohydrates during a phytoplankton bloom in the northern North Sea. Mar. Ecol. Progr. Ser. 4, 299-305.
Ittekkot, V., Arian, R., 1986. Nature of particulate matter in the river Indus, Pakistan. Geochim. Cosmochim. Acta, 50, 1643-1653.
Ittekkot, V., Degens, E.T., Brockmann, U., 1982. Monosaccharide composition of acid-hydrolyzable carbohydrates in particulate matter during a plankton bloom. Limnol. Oceanogr. 27, 770-776.
Ittekkot, V., Deuser, W.G., Degens E.T., 1984. Seasonality in the fluxes of sugars, amino acids and amino sugars to the deep ocean: Sargasso Sea. Deep Sea Res. I 31, 1057-1069.
Ittekkot, V., Haake, B., Bartsch, M., Nair, R.R., Ramaswamy, V., 1992. Organic carbon removal in the sea: The continental connection. In: Upwelling Systems: Evolution since the Early Miocene. Summerhayes C.P., Prell, W.L., Emeis K.C. eds. Geological Society, London. Publication No. 64. pp. 167-176.
Jain, A., Bhosle, N.B., 2009. Biochemical composition of the marine conditioning film: implications for bacterial adhesion. Biofouling 25, 13-19.
Jensen, M.M., Holmer, M., Thamdrup, B., 2005. Composition and diagenesis of neutral carbohydrates in sediments of the Baltic-North Sea transition, Geochim. Cosmochim. Acta 69, 4085-4099.
Kaiser, K., Benner, R., 2009. Biochemical composition and size distribution of organic matter at the Pacific and Atlantic time-series stations. Mar. Chem. 113, 63-77.
Kao, S.J., Lin, F.J., Liu, K.K., 2003. Organic carbon and nitrogen contents and their isotopic compositions in surficial sediments from the East China Sea shelf and the southern Okinawa Trough. Deep Sea Res. II 50, 1203-1217.
Kendall, C., Steven, R.S., Kelly, V.J., 2001. Carbon and nitrogen isotopic compositions of particulate organic matter in four large river systems across the United States. Hydrol. Process. 15, 1301-1346.
Kessarkar, P.M., Rao, V.P., Shynu, R., Mehra, P., Viegas, B.E., 2010. The nature and distribution of particulate matter in the Mandovi estuary, central west coast of India. Estuar. Coast. 33, 30-44.
Khodse, V.B., Bhosle, N.B. 2010. Differences in carbohydrate profiles in batch culture grown planktonic and Biofilm cells of Amphora rostrata Wm. Sm. Biofouling 26, 527-537.
Khodse, V.B., Bhosle, N.B., 2011. Bacterial utilization of size fractionated dissolved organic matter. Aquat. Microb. Ecol. 64, 299–309.
Khodse, V.B., Fernandes, L., Gopalkrishna, V.V., Bhosle, N.B., Fernandes, V., Matondkar, S.G.P., Bhushan, R., 2007. Distribution and seasonal variation of concentrations of particulate carbohydrates and uronic acids in the northern Indian Ocean. Mar. Chem. 103, 327-346.
Khodse, V.B., Fernandes, L., Bhosle, N.B., Sardessai, S., 2008. Carbohydrates, uronic acids and alkali extractable carbohydrates in contrasting marine and estuarine sediments: Distribution, size fractionation and partial chemical characterization. Org. Geochem. 39, 265-283.
Khodse, V.B., Bhosle, N.B., Matondkar, S.G.P., 2010. Distribution of dissolved carbohydrates and uronic acids in a tropical estuary, India. J. Earth Syst. Sci. 119, 519-530.
Kujawinski, E.B., Freitas, M.A., Zang, X., Hatcher, P.G., Green-Church, K.B., Jones B.R., 2002. The application of electrospray ionization mass spectrometry (ESI MS) to the structural characterization of natural organic matter. Org. Geochem. 33, 171-180.
23
Leppard, G.G., 1993. In: Rao, S.S. (Ed.), Particulate Matter and Aquatic Contaminants. Lewis, Chelsea, MI, pp. 169-195.
Liebezeit, G., 1986. Pelagic and benthic sources of sedimentary carbohydrates in a shallow-water environment, Kiel Bight, Baltic. Mar. Geol. 71, 201-213.
Ludwig, W., Probst, J.L., Kemp, S., 1996. Predicting the oceanic input of organic carbon by continental erosion. Global Biogeochem Cycles 10, 23–41.
Malet, N., Sauriau, P.G., Ryckaert, M., Malestroit, P., Guillou, G., 2008. Dynamics and sources of suspended particulate organic matter in the Marennes-Oleron oyster farming bay: Insights from stable isotopes and microalgae ecology. Estuar. Coast. Shelf Sci. 78, 576-586.
Maya, M.V., Soares, M.A., Agnihotri, R., Pratihary, A.K., Karapurkar, S.G., Naik, H., Naqvi, S.W.A., 2011. Variations in some environmental characteristics including C and N stable isotopic composition of suspended organic matter in the Mandovi estuary. 175, 501-517.
Meybeck, M., 1982. Carbon, nitrogen, and phosphorus transport by world Rivers, Am. J. Sci. 282, 401–450.
Meyers, P.A., 1994. Preservation of elemental and isotopic source identification of sedimentary organic matter. Chem. Geol. 114, 289-302.
Moers, M.E.C., Boon, J.J., de Leeuw, J.W., Baas, M., Schenck, P.A., 1989. Carbohydrate speciation and Py-MS mapping of peat samples from a subtropical open marsh environment. Geochim. Cosmochim. Acta 53, 2011-2021.
Moers, M.E.C., Baas, M., de Leeuw, J.W., Boon, J.J., Schenck, P.A., 1990. Occurrence and origin of carbohydrates in the peat samples from mangrove environment reflected by abundances of neutral monosacchrides. Geochim. Cosmochim. Acta 54, 2463-2472.
Mopper, K., Zhou, J., Ramana, K.S., Passow, U., Dam, H.G., Drapeau, D.T., 1995. The role of surface-active carbohydrates in the flocculation of a diatom bloom in a mesocosm. Deep Sea Res. 42, 47-73.
Morris, I., 1981. Photosynthetic products, physiological state and phytoplankton growth. Can. Bull. Fish. Aquat. Sci. 201, 83-102.
Myklestad, S., 1977. Production of carbohydrate by marine diatoms, Influence of N/P ratio in the growth medium on the assimilation ratio, growth rate and production of cellular and extracellular carbohydrates by Chaetoceros affinis var. Willie (Gran) Hustedt and Skeletonema costatum (Grev.) Cleve. J. Exp. Mar. Biol. Ecol. 29, 161-179.
Myklestad, S., 1989. Production, chemical structure, metabolism and biological function of the (1-3)-linked β- -glucans in diatoms. Biol. Oceanogr. 6, 313-326.
Ndung’u, K., Franks, R.P., Bruland, K.W., Flegal, A.R., 2003. Organic complexation and total dissolved trace metal analysis in estuarine waters: comparison of solvent-extraction graphite furnace atomic absorption spectrometric and chelating resin flow injection inductively coupled plasma-mass spectrometric analysis. Analytica. Chimica. Acta 481, 127-138.
Ochiai, M., Ogino, M., Sasaki, K., Okazawa, T., 1988. Behaviour of particulate carbohydrates and amino acids in the estuary of the Tama River. Mar. Chem. 25, 265-278.
Ogier, S., Dissnar, J.R., Alberic, P., Bourdier, G., 2001. Neutral carbohydrate geochemistry of particulate material (trap and core sediments) in an eutrophic lake (Aydat, France). Org. Geochem. 32, 151-162.
24
Opsahl, S., Benner, R., 1999. Characterization of carbohydrates during early diagenesis of five vascular plant tissues. Org. Geochem. 30, 83-94.
Panagiotopoulos, C., Sempere, R., 2005. The molecular distribution of combined aldoses in sinking particles in various oceanic conditions. Mar. Chem. 95, 31-49.
Panagiotopoulos, C., Sempere, R., Para, J., Raimbault, P., Rabouille, C., Charriere, B. 2011. The composition and flux of particulate and dissolved carbohydrates from the Rhone River into the Mediterranean Sea. Biogeosciences 8, 11165-11213.
Parsons, T.R, Maita, Y., Lalli C.M., 1984. A Manual of Chemical and Biological Methods for Seawater Analysis. Pergamon, Oxford.
Percival, A., 1970. Algal carbohydrates. In: Pigman W, Horton D (eds) The Carbohydrates: Chemistry and Biochemistry, IIB. Academic Press, London, pp 537- 568.
Prabhu Matondkar, S,G., Gomes, H. do R., Parab, S.G., Pednekar, S., Goes, J.I., 2007. Phytoplankton diversity, biomass, and production; In: The Mandovi and Zuari Estuaries, Shetye S R, Kumar M D and Shankar D (eds) National Institute of Oceanography, Dona Paula, Goa, India. pp. 67–81. http://drs.nio.org/drs/handle/ 2264/1032.
Pratihary, A.K., Naqvi, S.W.A., Naik, H., Thorat, B.R., Narvenkar, G., Manjunatha, B.R., Rao, V.P., 2009. Benthic fluxes in a tropical Estuary and their role in the ecosystem. Estuar. Coast. Shelf Sci. 85, 387-398.
Preston, M.R., Prodduturu, P., 1992. Tidal variation of particulate carbohydrates in the Mersey Estuary. Estuar. Coast. Shelf Sci. 34, 37-48.
Qasim, S.Z., Sen Gupta, R., 1981. Environmental characteristics of the Mandovi-Zuari estuarine system in Goa. Estuar. Coast. Shelf Sci.13, 557-578.
Quigley, M.S., Santschi, P.H., Hung, C.C., Guo, L., Honeyman, B.D., 2002. Importance of polysaccharides for 234Th complexation to marine organic matter. Limnol. Oceanogr. 47, 367-377.
Ram, A.S.P., Nair, S., Chandramohan, D., 2003. Bacterial growth efficiency in the tropical estuarine and coastal waters of Goa, southwest coast of India. Microb. Ecol. 45, 88-96.
Sakugawa, H., Handa, N., 1985. Chemical studies on dissolved carbohydrates in water samples collected from the North Pacific and Bering Sea. Oceanol. Acta 8, 185-196.
Santschi, P.H., Balnois, E., Wilkinson, K.J., Buf-Fle, J., Guo, L., 1998. Fibrillar polysaccharides in marine macromolecular organic matter as imaged by atomic force microscopy and transmission electron microscopy. Limnol. Oceanogr. 43, 896-908.
Schelske, C.L., Hodell D.A. 1995. Using the isotopes of bulk sedimentary organic matter to reconstruct the history of nutrient loading and eutrophication in Lake Erie. Limnol. Oceanogr. 40, 918-929.
Shetye, S.R., Gouveia, A.D., Singbal, S.Y., Naik, C.G., Sundar, D., Michael, G.S., Nampoothiri, G., 1995. Propagation of tides in the Mandovi-Zuari estuarine network. Proceedings of the Indian Academy of Sciences (Earth & Planet Sciences) 104, 667-682.
Shetye, S.R., Kumar, M.D., Shankar, D., 2007. The Mandovi and Zuari Estuaries. National Institute of Oceanography, Goa, India. pp. 145. http://drs.nio.org/drs/handle/2264/1032
Sigleo, A.C., 1996. Biochemical components in suspended particles and colloids: carbohydrates in the Potomac and Patuxent Estuaries. Org. Geochem. 24, 83–93.
25
Skoog, A., Benner, R., 1997. Aldoses in various size fractions of marine organic matter: implications for carbon cycling. Limnol. Oceanogr. 42, 1803-1810.
Sokal, R.R., Rohlf, J.F., 1981. Biometry, 2nd edn. Freeman, San Francisco.
Sundar, D., Shetye, S.R., 2005. Tides in the Mandovi and Zuari estuaries, Goa, west coast of India. J. Earth Syst. Sci. 114, 493–503.
Suprit, K ., Shankar, D., 2008. Resolving orographic rainfall on the Indian west coast. Int. J. Climatol. 28, 643–657.
Sweeney, R.E., Liu, K.K., Kaplan, I.R., 1978. Oceanic nitrogen isotopes and their uses in determining the source of sedimentary nitrogen. In Stable Isotopes in the Earth Sciences eds. (Robinson, B.W., Sweeney R.E., and Liu, K.K.), DSIR Bulletin 220, pp, 9-26.
Tang, D., Warnken, K.W., Santschi, P.H., 2001. Organic complexation of copper in surface waters of Galveston Bay. Limnol. Oceanogr. 46, 321-330.
Tanoue, E., Handa, N., 1987. Monosaccharide composition of marine particles and sediments from the Bering Sea and northern North Pacific. Oceanol. Acta 10, 91–99.
Thurman, E.M., 1985. Organic geochemistry of natural waters. Martinus-Nijhoff / Dr. W. Junk Publ. Dordrecht. 181-213.
Tremblay, L., Benner, R., 2009. Organic matter diagenesis and bacterial contributions to detrital organic carbon and nitrogen in the Amazon River system. Limnol. Oceanogr. 54, 681-691.
Unger, D., Ittekkot, V., Schafer, P., Tiemann, J., 2005. Biogeochemistry of particulate organic matter from the Bay of Bengal as discernible from hydrolysable neutral carbohydrates and amino acids. Mar. Chem. 96, 155-184.
Unnikrishnan, A.S., Shetye, S.R., Gouveia, A.D., 1997. Tidal propagation in the Mandovi-Zuari estuarine network, west coast of India: Impact of freshwater influx. Mar. Ecol. Progr. Ser. 45, 737-744.
Wu, Y., Zhang, J., Lu, S.M., Zhang, Z.F., Yao, Q.Z., Hong, G.H., Cooper, L., 2007. Sources and distribution of carbon within the Yangtze River system. Estuar. Coast. Shelf Sci. 71, 13-25.
Yamaoka, Y., 1983. Carbohydrates in humic and fulvic acids from Hiroshima Bay sediments. Mar. Chem. 13, 227-237.
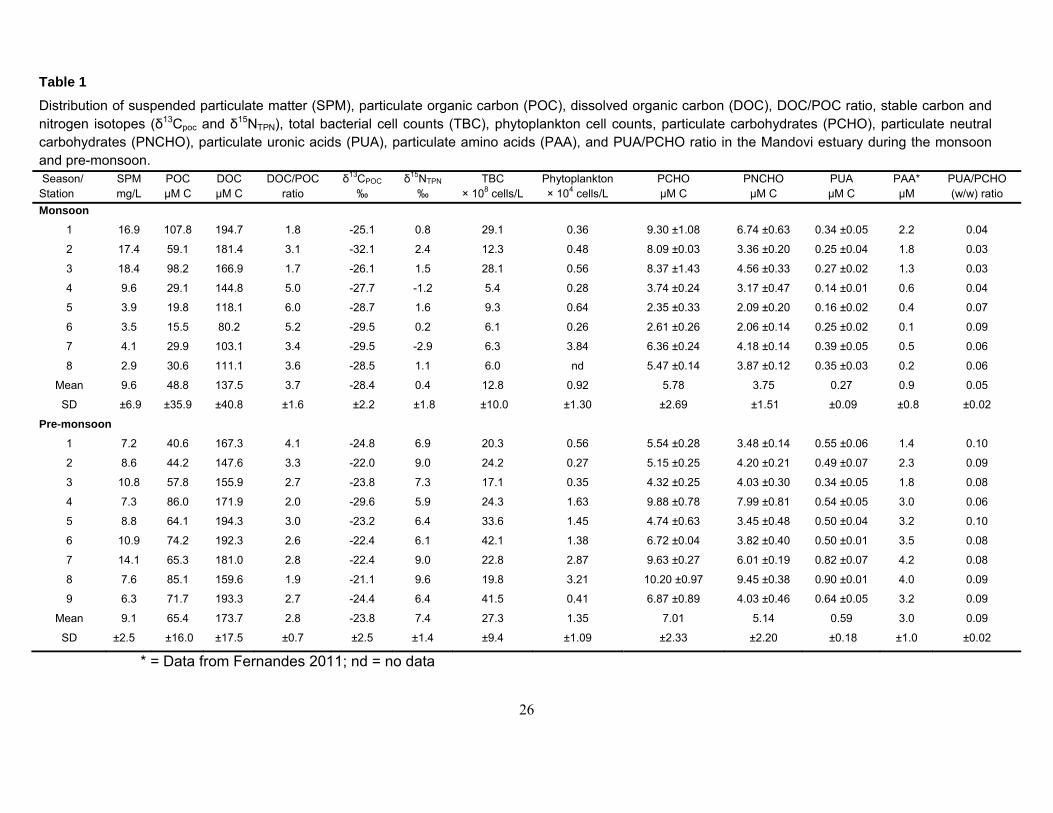
26
Table 1
Distribution of suspended particulate matter (SPM), particulate organic carbon (POC), dissolved organic carbon (DOC), DOC/POC ratio, stable carbon and nitrogen isotopes (δ13Cpoc and δ15NTPN), total bacterial cell counts (TBC), phytoplankton cell counts, particulate carbohydrates (PCHO), particulate neutral carbohydrates (PNCHO), particulate uronic acids (PUA), particulate amino acids (PAA), and PUA/PCHO ratio in the Mandovi estuary during the monsoon and pre-monsoon. Season/ Station
SPM mg/L
POC µM C
DOC µM C
DOC/POC ratio
δ13CPOC ‰
δ15NTPN ‰
TBC × 108 cells/L
Phytoplankton × 104 cells/L
PCHO µM C
PNCHO µM C
PUA µM C
PAA* µM
PUA/PCHO (w/w) ratio
Monsoon
1 16.9 107.8 194.7 1.8 -25.1 0.8 29.1 0.36 9.30 ±1.08 6.74 ±0.63 0.34 ±0.05 2.2 0.04
2 17.4 59.1 181.4 3.1 -32.1 2.4 12.3 0.48 8.09 ±0.03 3.36 ±0.20 0.25 ±0.04 1.8 0.03
3 18.4 98.2 166.9 1.7 -26.1 1.5 28.1 0.56 8.37 ±1.43 4.56 ±0.33 0.27 ±0.02 1.3 0.03
4 9.6 29.1 144.8 5.0 -27.7 -1.2 5.4 0.28 3.74 ±0.24 3.17 ±0.47 0.14 ±0.01 0.6 0.04
5 3.9 19.8 118.1 6.0 -28.7 1.6 9.3 0.64 2.35 ±0.33 2.09 ±0.20 0.16 ±0.02 0.4 0.07
6 3.5 15.5 80.2 5.2 -29.5 0.2 6.1 0.26 2.61 ±0.26 2.06 ±0.14 0.25 ±0.02 0.1 0.09
7 4.1 29.9 103.1 3.4 -29.5 -2.9 6.3 3.84 6.36 ±0.24 4.18 ±0.14 0.39 ±0.05 0.5 0.06
8 2.9 30.6 111.1 3.6 -28.5 1.1 6.0 nd 5.47 ±0.14 3.87 ±0.12 0.35 ±0.03 0.2 0.06
Mean
SD
9.6
±6.9
48.8
±35.9
137.5
±40.8
3.7
±1.6
-28.4
±2.2
0.4
±1.8
12.8
±10.0
0.92
±1.30
5.78
±2.69
3.75
±1.51
0.27
±0.09
0.9
±0.8
0.05
±0.02
Pre-monsoon
1 7.2 40.6 167.3 4.1 -24.8 6.9 20.3 0.56 5.54 ±0.28 3.48 ±0.14 0.55 ±0.06 1.4 0.10
2 8.6 44.2 147.6 3.3 -22.0 9.0 24.2 0.27 5.15 ±0.25 4.20 ±0.21 0.49 ±0.07 2.3 0.09
3 10.8 57.8 155.9 2.7 -23.8 7.3 17.1 0.35 4.32 ±0.25 4.03 ±0.30 0.34 ±0.05 1.8 0.08
4 7.3 86.0 171.9 2.0 -29.6 5.9 24.3 1.63 9.88 ±0.78 7.99 ±0.81 0.54 ±0.05 3.0 0.06
5 8.8 64.1 194.3 3.0 -23.2 6.4 33.6 1.45 4.74 ±0.63 3.45 ±0.48 0.50 ±0.04 3.2 0.10
6 10.9 74.2 192.3 2.6 -22.4 6.1 42.1 1.38 6.72 ±0.04 3.82 ±0.40 0.50 ±0.01 3.5 0.08
7 14.1 65.3 181.0 2.8 -22.4 9.0 22.8 2.87 9.63 ±0.27 6.01 ±0.19 0.82 ±0.07 4.2 0.08
8 7.6 85.1 159.6 1.9 -21.1 9.6 19.8 3.21 10.20 ±0.97 9.45 ±0.38 0.90 ±0.01 4.0 0.09
9 6.3 71.7 193.3 2.7 -24.4 6.4 41.5 0.41 6.87 ±0.89 4.03 ±0.46 0.64 ±0.05 3.2 0.09
Mean
SD
9.1
±2.5
65.4
±16.0
173.7
±17.5
2.8
±0.7
-23.8
±2.5
7.4
±1.4
27.3
±9.4
1.35
±1.09
7.01
±2.33
5.14
±2.20
0.59
±0.18
3.0
±1.0
0.09
±0.02
* = Data from Fernandes 2011; nd = no data
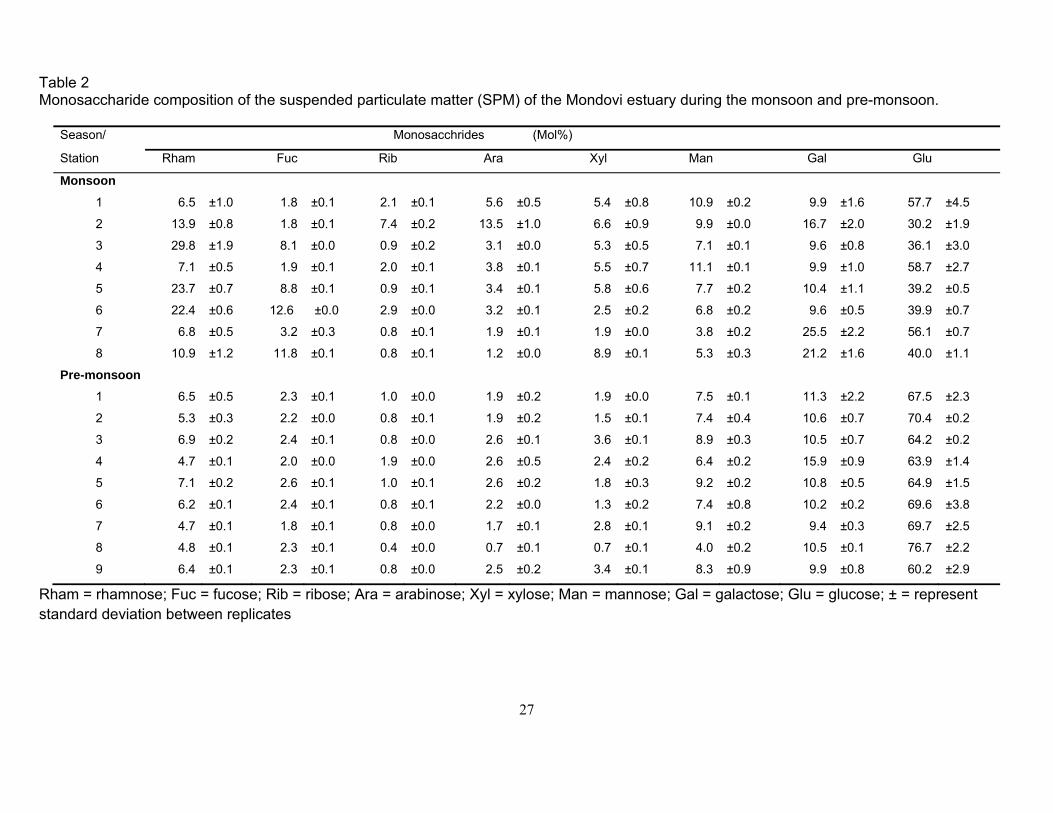
27
Table 2 Monosaccharide composition of the suspended particulate matter (SPM) of the Mondovi estuary during the monsoon and pre-monsoon.
Season/ Monosacchrides (Mol%)
Station Rham Fuc Rib Ara Xyl Man Gal Glu
Monsoon
1 6.5 ±1.0 1.8 ±0.1 2.1 ±0.1 5.6 ±0.5 5.4 ±0.8 10.9 ±0.2 9.9 ±1.6 57.7 ±4.5
2 13.9 ±0.8 1.8 ±0.1 7.4 ±0.2 13.5 ±1.0 6.6 ±0.9 9.9 ±0.0 16.7 ±2.0 30.2 ±1.9
3 29.8 ±1.9 8.1 ±0.0 0.9 ±0.2 3.1 ±0.0 5.3 ±0.5 7.1 ±0.1 9.6 ±0.8 36.1 ±3.0
4 7.1 ±0.5 1.9 ±0.1 2.0 ±0.1 3.8 ±0.1 5.5 ±0.7 11.1 ±0.1 9.9 ±1.0 58.7 ±2.7
5 23.7 ±0.7 8.8 ±0.1 0.9 ±0.1 3.4 ±0.1 5.8 ±0.6 7.7 ±0.2 10.4 ±1.1 39.2 ±0.5
6 22.4 ±0.6 12.6 ±0.0 2.9 ±0.0 3.2 ±0.1 2.5 ±0.2 6.8 ±0.2 9.6 ±0.5 39.9 ±0.7
7 6.8 ±0.5 3.2 ±0.3 0.8 ±0.1 1.9 ±0.1 1.9 ±0.0 3.8 ±0.2 25.5 ±2.2 56.1 ±0.7
8 10.9 ±1.2 11.8 ±0.1 0.8 ±0.1 1.2 ±0.0 8.9 ±0.1 5.3 ±0.3 21.2 ±1.6 40.0 ±1.1
Pre-monsoon
1 6.5 ±0.5 2.3 ±0.1 1.0 ±0.0 1.9 ±0.2 1.9 ±0.0 7.5 ±0.1 11.3 ±2.2 67.5 ±2.3
2 5.3 ±0.3 2.2 ±0.0 0.8 ±0.1 1.9 ±0.2 1.5 ±0.1 7.4 ±0.4 10.6 ±0.7 70.4 ±0.2
3 6.9 ±0.2 2.4 ±0.1 0.8 ±0.0 2.6 ±0.1 3.6 ±0.1 8.9 ±0.3 10.5 ±0.7 64.2 ±0.2
4 4.7 ±0.1 2.0 ±0.0 1.9 ±0.0 2.6 ±0.5 2.4 ±0.2 6.4 ±0.2 15.9 ±0.9 63.9 ±1.4
5 7.1 ±0.2 2.6 ±0.1 1.0 ±0.1 2.6 ±0.2 1.8 ±0.3 9.2 ±0.2 10.8 ±0.5 64.9 ±1.5
6 6.2 ±0.1 2.4 ±0.1 0.8 ±0.1 2.2 ±0.0 1.3 ±0.2 7.4 ±0.8 10.2 ±0.2 69.6 ±3.8
7 4.7 ±0.1 1.8 ±0.1 0.8 ±0.0 1.7 ±0.1 2.8 ±0.1 9.1 ±0.2 9.4 ±0.3 69.7 ±2.5
8 4.8 ±0.1 2.3 ±0.1 0.4 ±0.0 0.7 ±0.1 0.7 ±0.1 4.0 ±0.2 10.5 ±0.1 76.7 ±2.2
9 6.4 ±0.1 2.3 ±0.1 0.8 ±0.0 2.5 ±0.2 3.4 ±0.1 8.3 ±0.9 9.9 ±0.8 60.2 ±2.9
Rham = rhamnose; Fuc = fucose; Rib = ribose; Ara = arabinose; Xyl = xylose; Man = mannose; Gal = galactose; Glu = glucose; ± = represent standard deviation between replicates
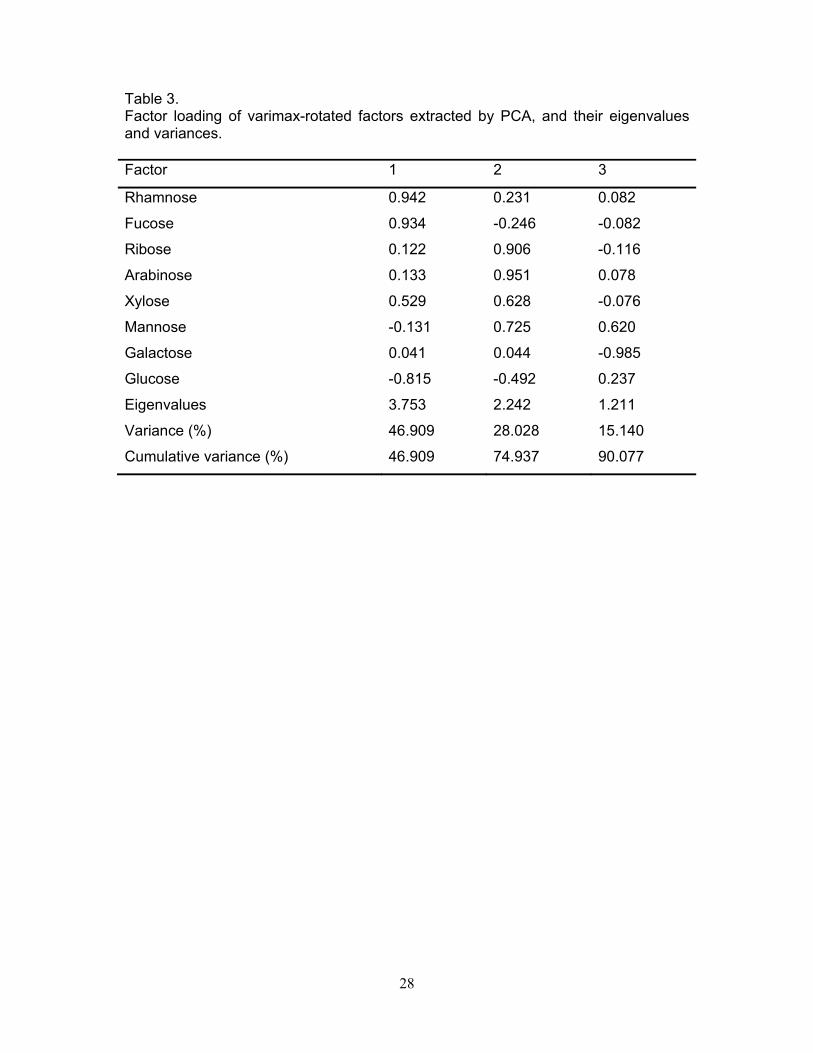
28
Table 3. Factor loading of varimax-rotated factors extracted by PCA, and their eigenvalues and variances. Factor 1 2 3
Rhamnose 0.942 0.231 0.082
Fucose 0.934 -0.246 -0.082
Ribose 0.122 0.906 -0.116
Arabinose 0.133 0.951 0.078
Xylose 0.529 0.628 -0.076
Mannose -0.131 0.725 0.620
Galactose 0.041 0.044 -0.985
Glucose -0.815 -0.492 0.237
Eigenvalues 3.753 2.242 1.211
Variance (%) 46.909 28.028 15.140
Cumulative variance (%) 46.909 74.937 90.077
29
Caption to figures Fig. 1. Sampling locations in the Mandovi estuary, the west coast of India.
Fig. 2. Relationships of suspended organic matter (SPM) with particulate organic carbon
(%POC/SPM) (a), and particulate carbohydrate (%PCHO/SPM) (b) in the Mandovi estuary,
the west coast of India.
Fig. 3. Spatial and seasonal variation of the particulate amino acids (PAA)/ particulate
neutral carbohydrate (PNCHO) ratio during the monsoon and pre-monsoon in the Mandovi
estuary, the west coast of India.
Fig. 4. Spatial variation in the contribution of particulate carbohydrate-carbon (PCHO-C) (a),
particulate neutral carbohydrate-carbon (PNCHO-C) (b) and particulate uronic acid-carbon
(PUA-C) (c) to particulate organic carbon (POC) during the monsoon and pre-monsoon in
the Mandovi estuary, the west coast of India.
Fig. 5. Gas chromatographic trace of alditol acetate derivatives of monosaccharides of a
standard mixture (a), a SPM sample from the Mandovi estuary (b), and blank (c). Rham =
rhamnose, Fuc = fucose, Rib = ribose, Ara = arabinose, Xyl = xylose, Man = mannose, Gal =
galactose, Glu = glucose, Inositol was used as an internal standard.
Fig. 6. Variation in the average monosaccharide composition (as Mol%) of the suspended
organic matter of surface waters collected from various locations during the monsoon and
pre-monsoon season in the Mandovi estuary, the west coast of India. Bar represent the ±SD.
Fig. 7. Spatial variation in hexoses (glucose + mannose + galactose) (a), pentoses
(arabinose + ribose + xylose), and deoxy sugars (rhamnose + fucose) during the monsoon
and pre-monsoon in the Mandovi estuary, the west coast of India.
Fig. 8. Spatial variation in ratios of rhamnose plus fucose (Rham + Fuc) to arabinose plus
xylose (Ara + Xyl) (a), hexoses (glucose + mannose + galactose) to pentoses (b), and
mannose to xylose (Man / Xyl) (c) of the particulate organic matter during the monsoon and
pre-monsoon in the Mandovi estuary, the west coast of India.
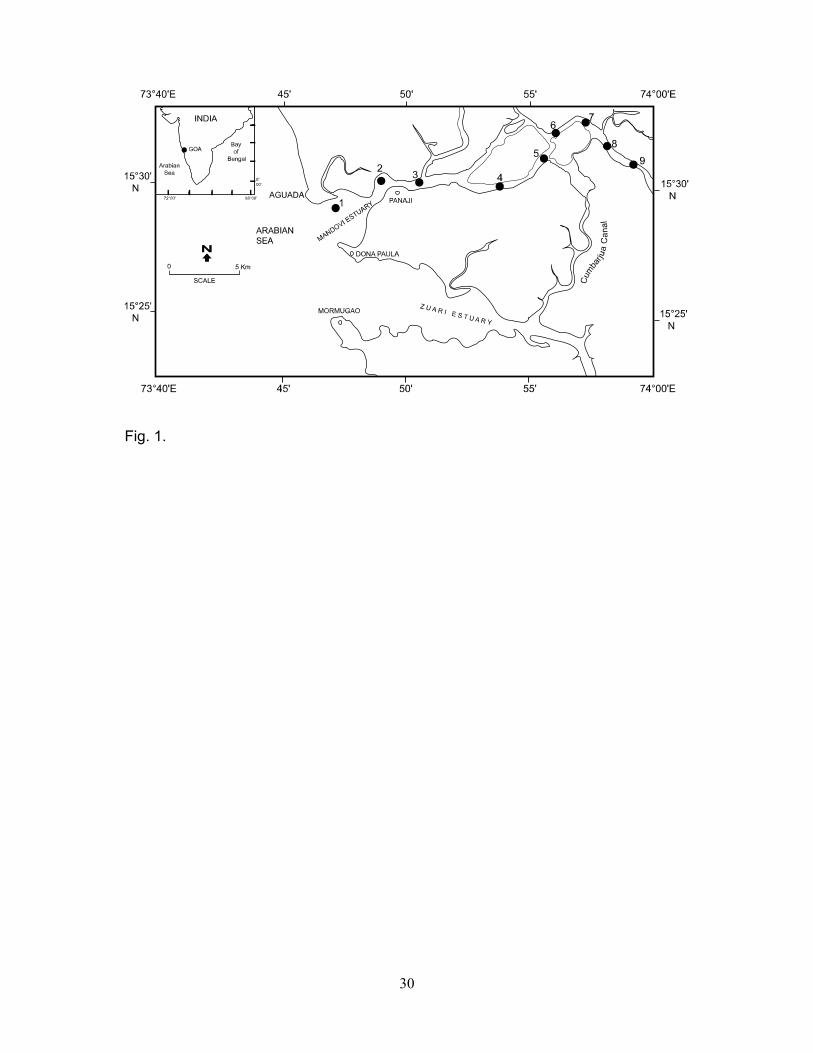
30
Fig. 1.
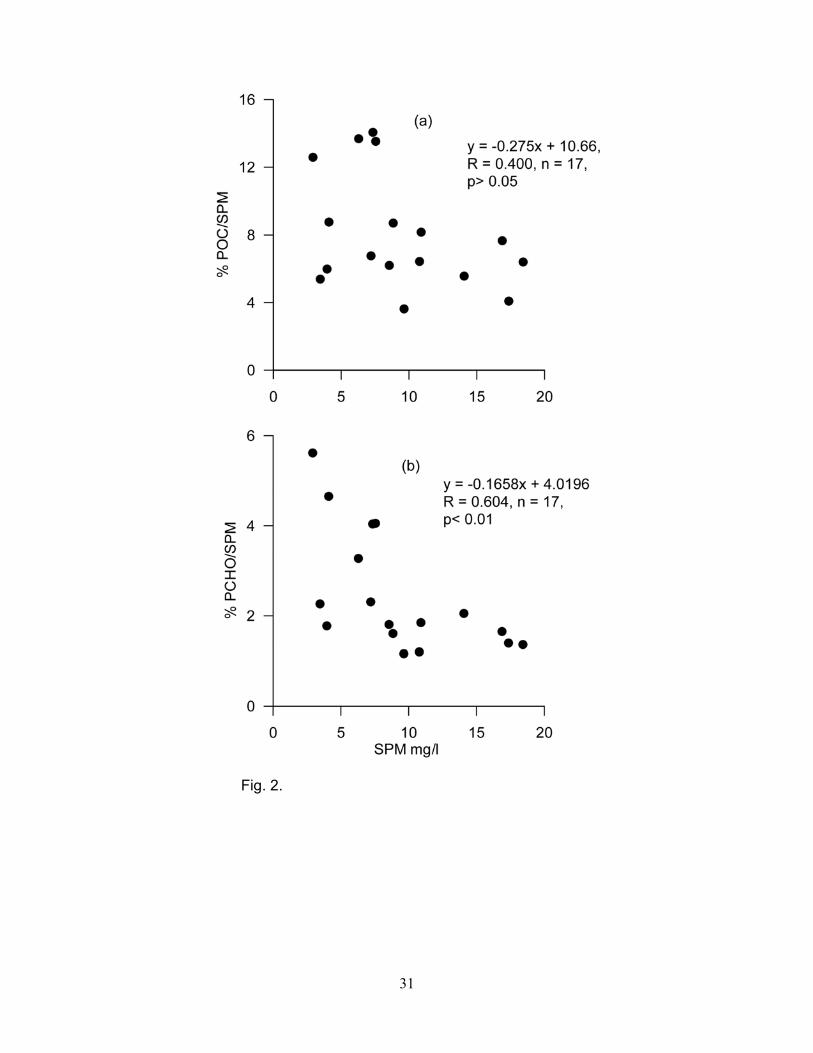
31
Fig. 2.
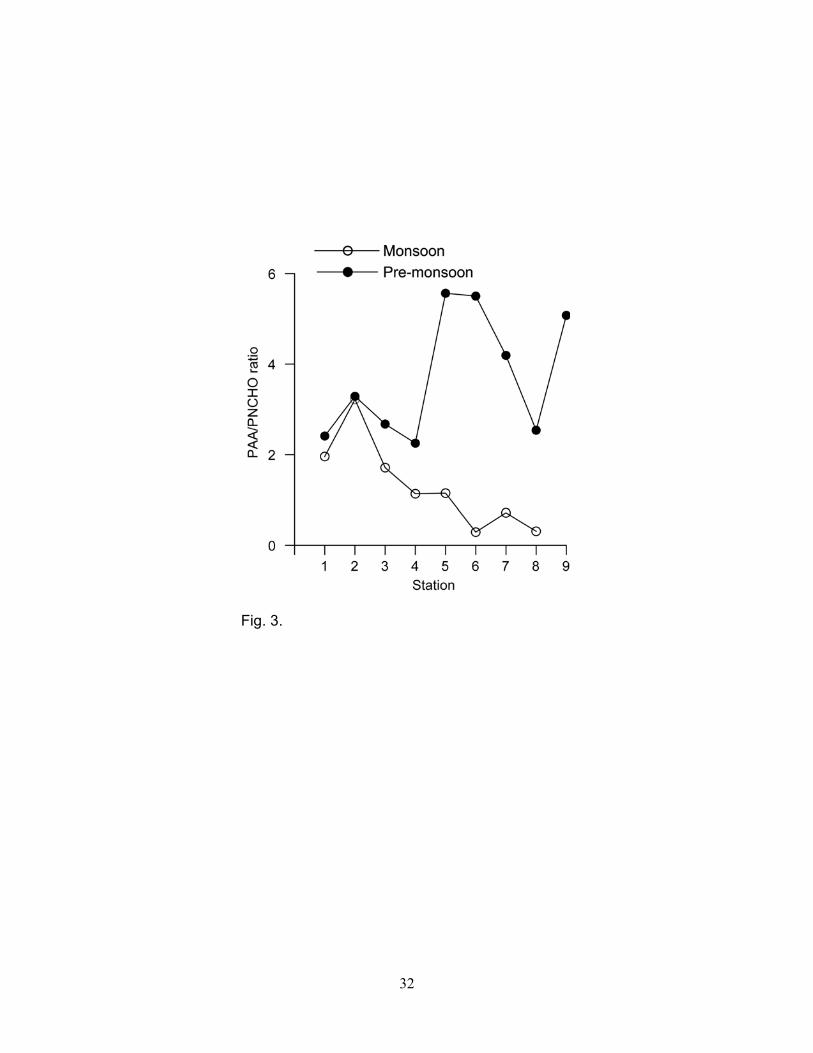
32
Fig. 3.
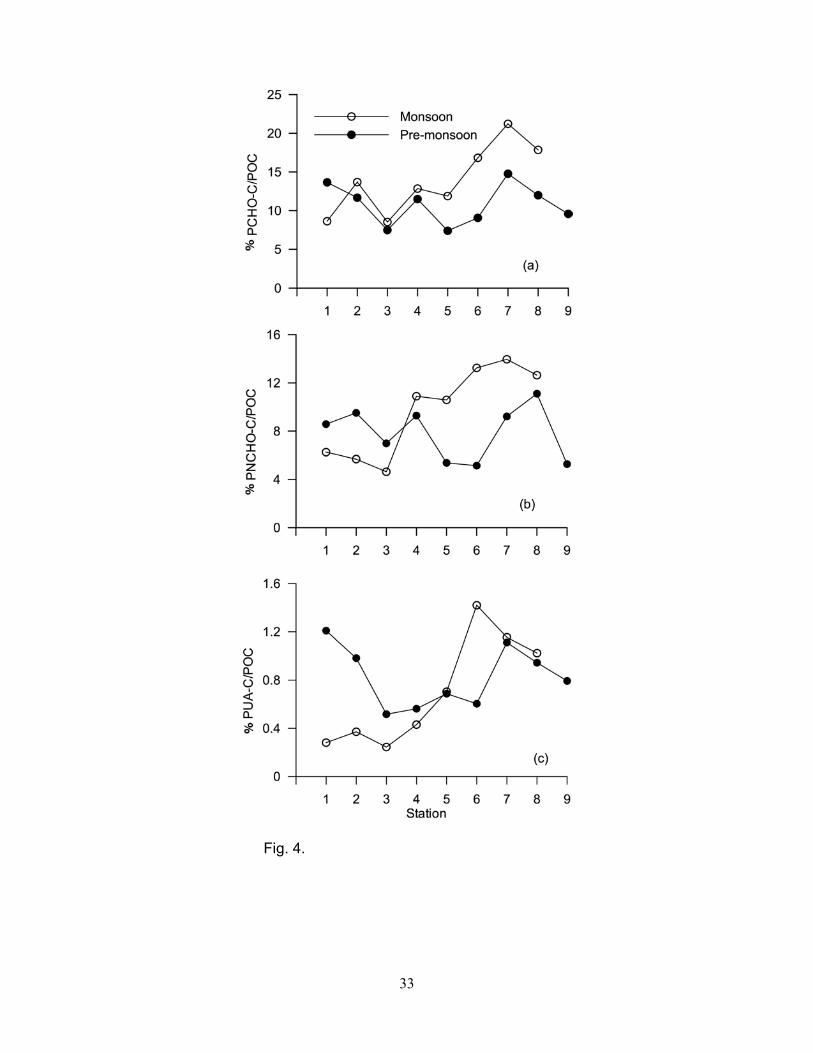
33
Fig. 4.
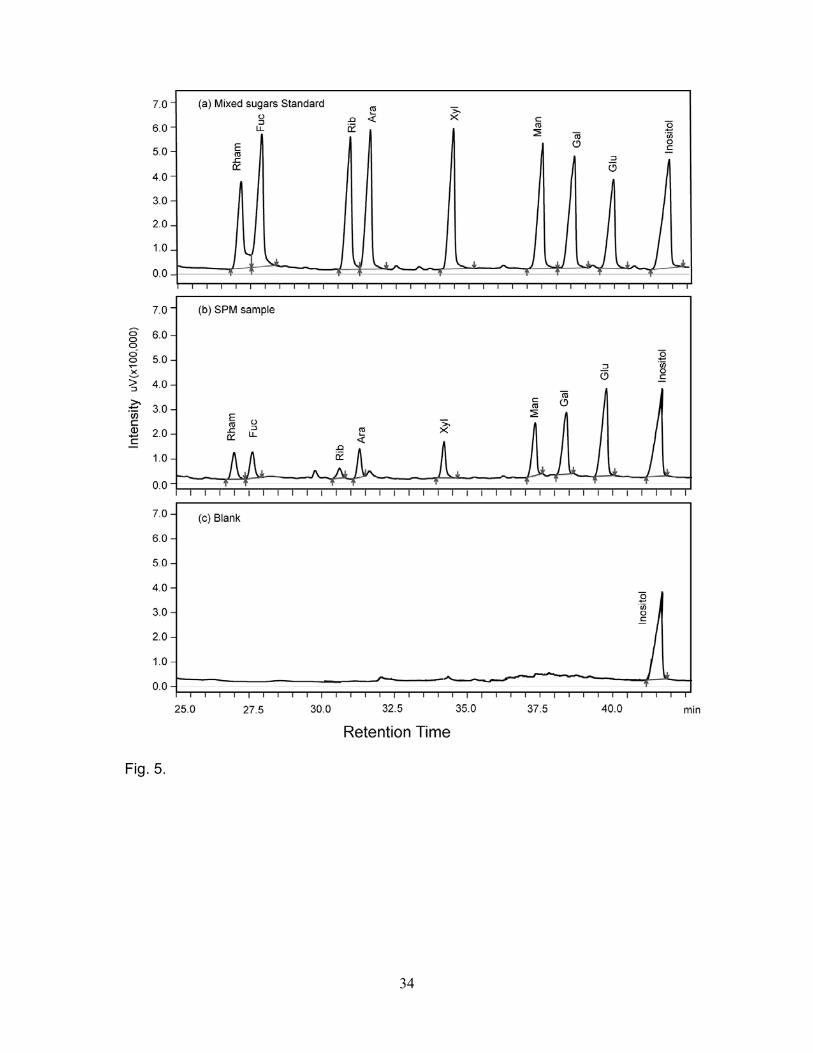
34
Fig. 5.
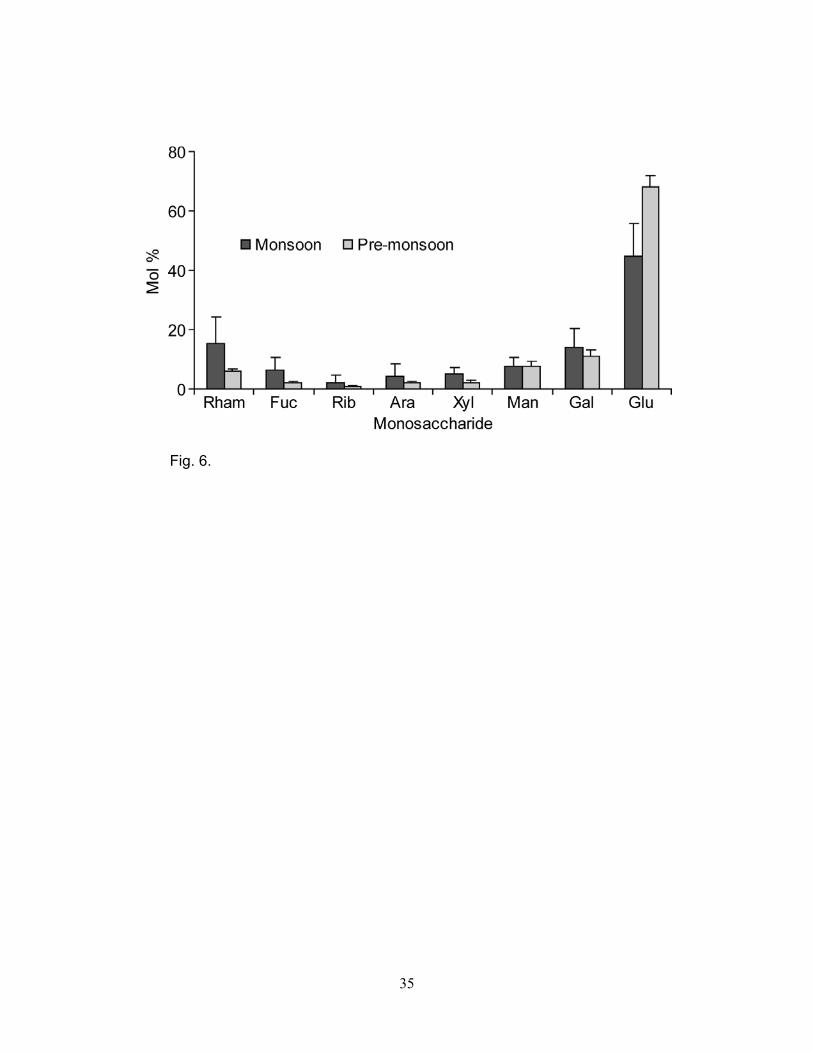
35
Fig. 6.
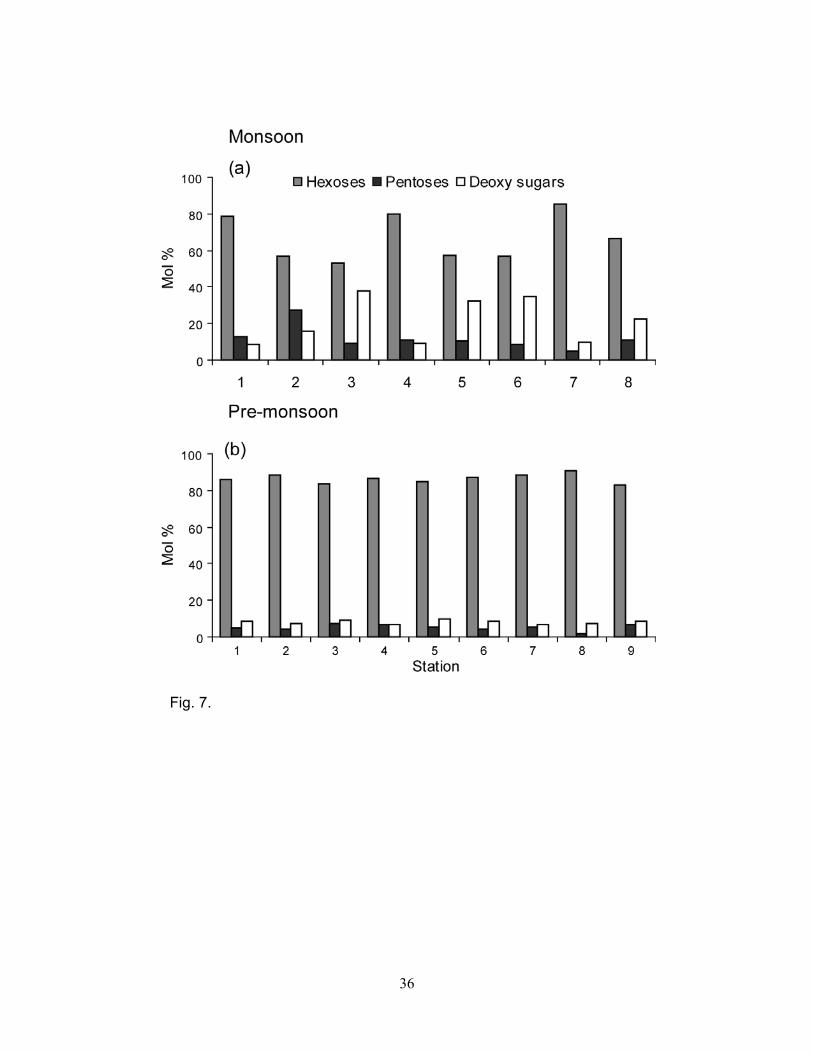
36
Fig. 7.
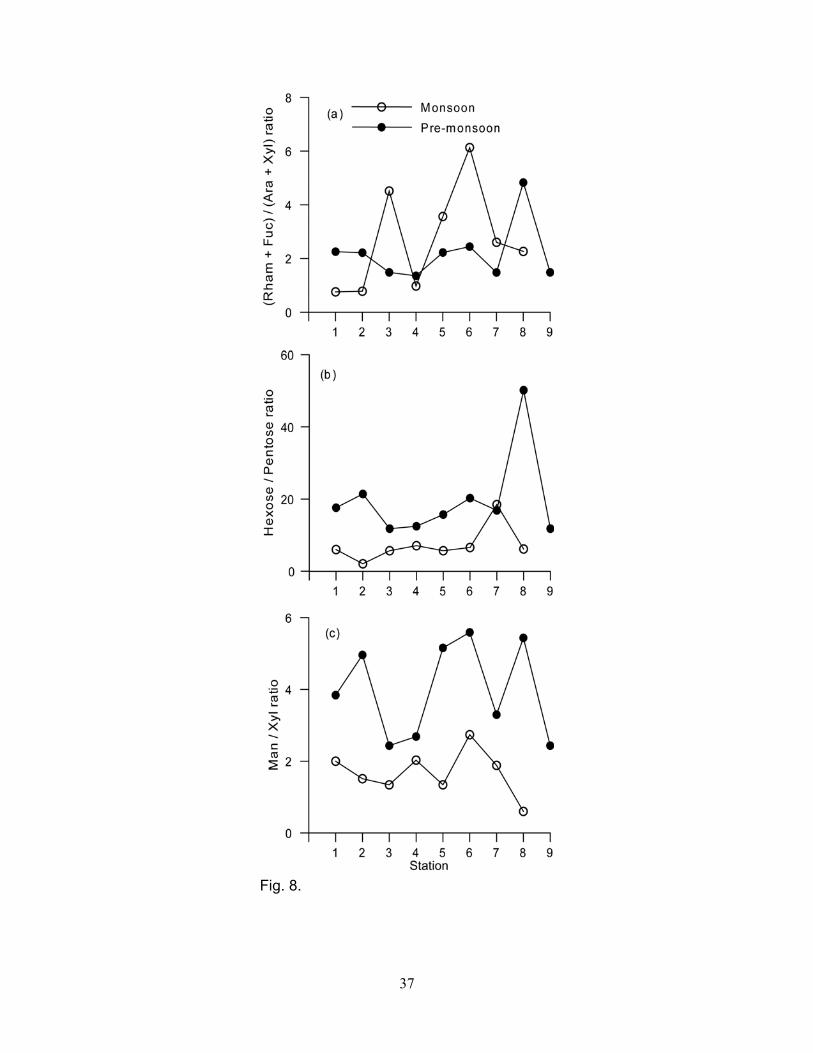
37
Fig. 8.