Supplementary Information for Novel two-dimensional -GeSe ...
Novel 9,9-Dimethylfluorene-bridged D‒π‒A-type Fluorophores with
Hybridized Local and Charge-transfer Excited State for Deep-blue
Electroluminescence with CIEy ~ 0.05
Xu Qiu,a Shian Ying,a Cong Wang,a Muddasir Hanif,a Yuwei Xu,a Ya Li,a Ruiyang Zhao,b Dehua
Hu,*a Dongge Ma*a and Yuguang Ma*a
a Institute of Polymer Optoelectronic Materials and Devices, State Key Laboratory of Luminescent
Materials and Devices, South China University of Technology, Guangzhou 510640, P. R. China.
*E-mail: [email protected]; [email protected]; [email protected]
b College of Chemical Engineering, Qingdao University of Science and Technology, Qingdao
266042, P. R. China.
Cotents
SI-1. Theoretical calculations
SI-2. Photophysical properties
SI-3. Eletroluminescence properties
SI-4. Structure characterizations
References
Electronic Supplementary Material (ESI) for Journal of Materials Chemistry C.This journal is © The Royal Society of Chemistry 2018
1
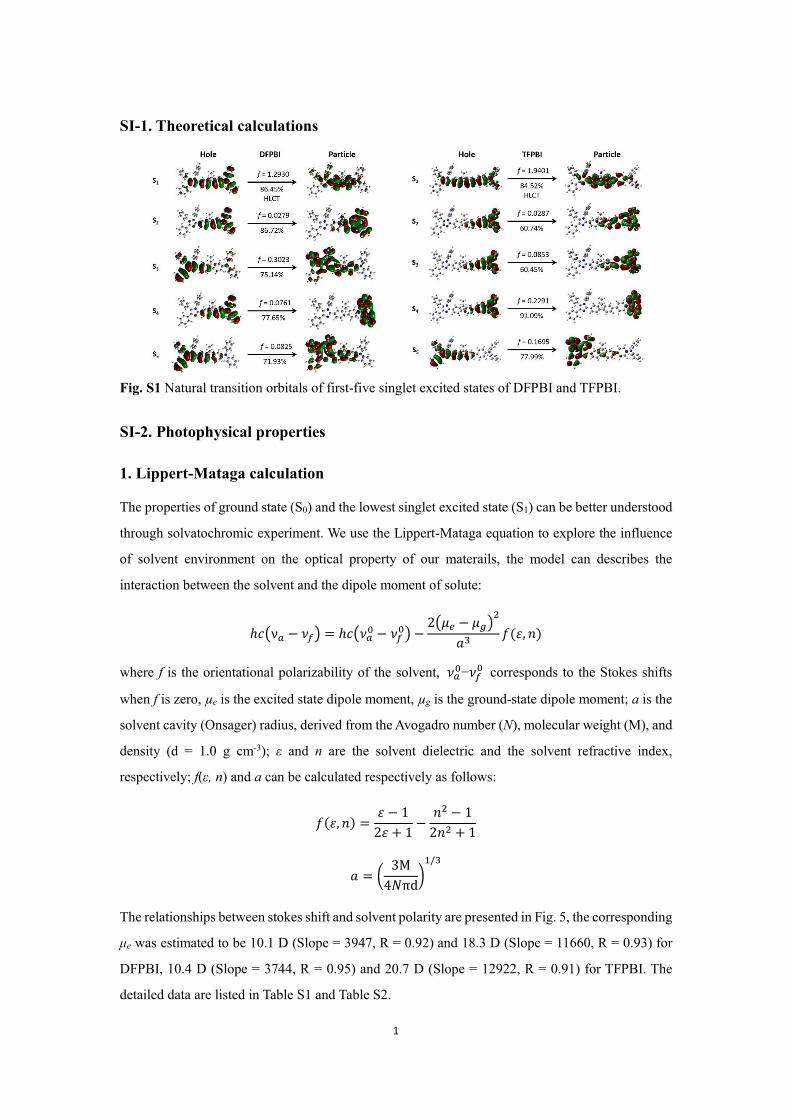
SI-1. Theoretical calculations
Fig. S1 Natural transition orbitals of first-five singlet excited states of DFPBI and TFPBI.
SI-2. Photophysical properties
1. Lippert-Mataga calculation
The properties of ground state (S0) and the lowest singlet excited state (S1) can be better understood
through solvatochromic experiment. We use the Lippert-Mataga equation to explore the influence
of solvent environment on the optical property of our materails, the model can describes the
interaction between the solvent and the dipole moment of solute:
ℎ𝑐(ν𝑎 − 𝜈𝑓) = ℎ𝑐(𝜈𝑎0 − 𝜈𝑓
0) −2(𝜇𝑒 − 𝜇𝑔)
2
𝑎3𝑓(𝜀, 𝑛)
where f is the orientational polarizability of the solvent, 𝜈𝑎0−𝜈𝑓
0 corresponds to the Stokes shifts
when f is zero, µe is the excited state dipole moment, µg is the ground-state dipole moment; a is the
solvent cavity (Onsager) radius, derived from the Avogadro number (N), molecular weight (M), and
density (d = 1.0 g cm-3); ε and n are the solvent dielectric and the solvent refractive index,
respectively; f(ε, n) and a can be calculated respectively as follows:
𝑓(𝜀, 𝑛) =𝜀 − 1
2𝜀 + 1−
𝑛2 − 1
2𝑛2 + 1
𝑎 = (3M
4𝑁πd)1/3
The relationships between stokes shift and solvent polarity are presented in Fig. 5, the corresponding
μe was estimated to be 10.1 D (Slope = 3947, R = 0.92) and 18.3 D (Slope = 11660, R = 0.93) for
DFPBI, 10.4 D (Slope = 3744, R = 0.95) and 20.7 D (Slope = 12922, R = 0.91) for TFPBI. The
detailed data are listed in Table S1 and Table S2.
2
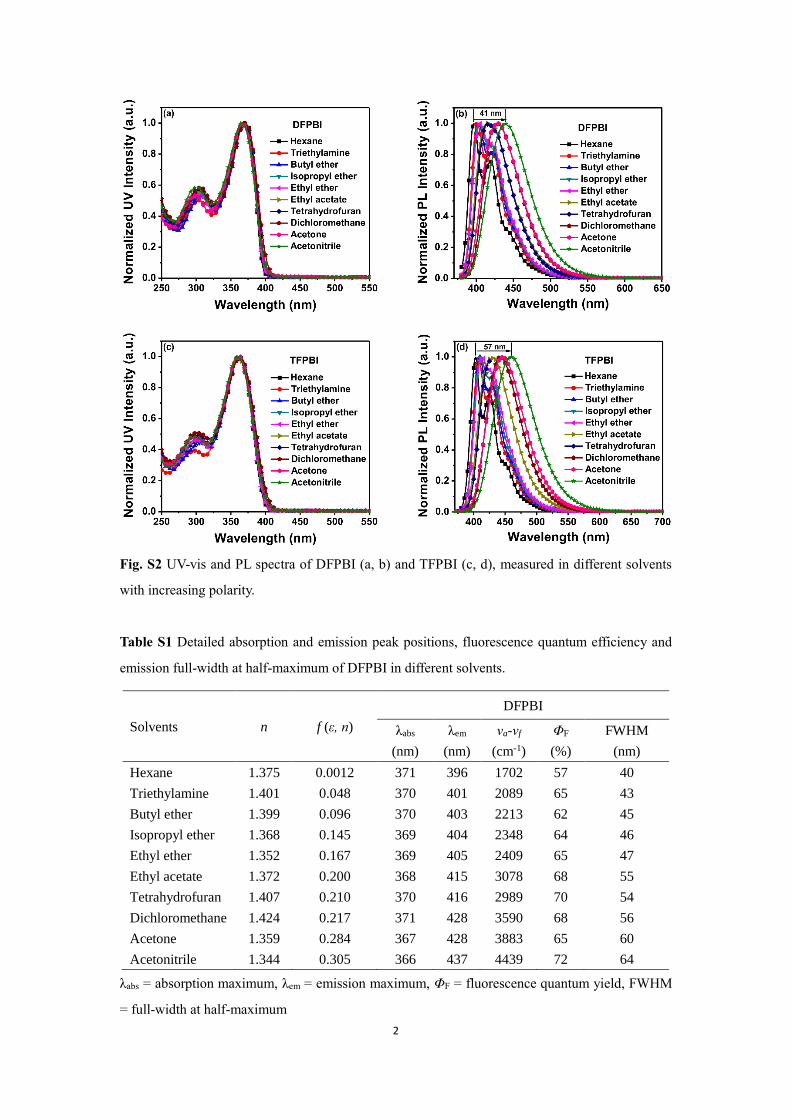
Fig. S2 UV-vis and PL spectra of DFPBI (a, b) and TFPBI (c, d), measured in different solvents
with increasing polarity.
Table S1 Detailed absorption and emission peak positions, fluorescence quantum efficiency and
emission full-width at half-maximum of DFPBI in different solvents.
Solvents n f (ε, n)
DFPBI
λabs
(nm)
λem
(nm)
νa-νf
(cm-1)
ΦF
(%)
FWHM
(nm)
Hexane 1.375 0.0012 371 396 1702 57 40
Triethylamine 1.401 0.048 370 401 2089 65 43
Butyl ether 1.399 0.096 370 403 2213 62 45
Isopropyl ether 1.368 0.145 369 404 2348 64 46
Ethyl ether 1.352 0.167 369 405 2409 65 47
Ethyl acetate 1.372 0.200 368 415 3078 68 55
Tetrahydrofuran 1.407 0.210 370 416 2989 70 54
Dichloromethane 1.424 0.217 371 428 3590 68 56
Acetone 1.359 0.284 367 428 3883 65 60
Acetonitrile 1.344 0.305 366 437 4439 72 64
λabs = absorption maximum, λem = emission maximum, ΦF = fluorescence quantum yield, FWHM
= full-width at half-maximum
3
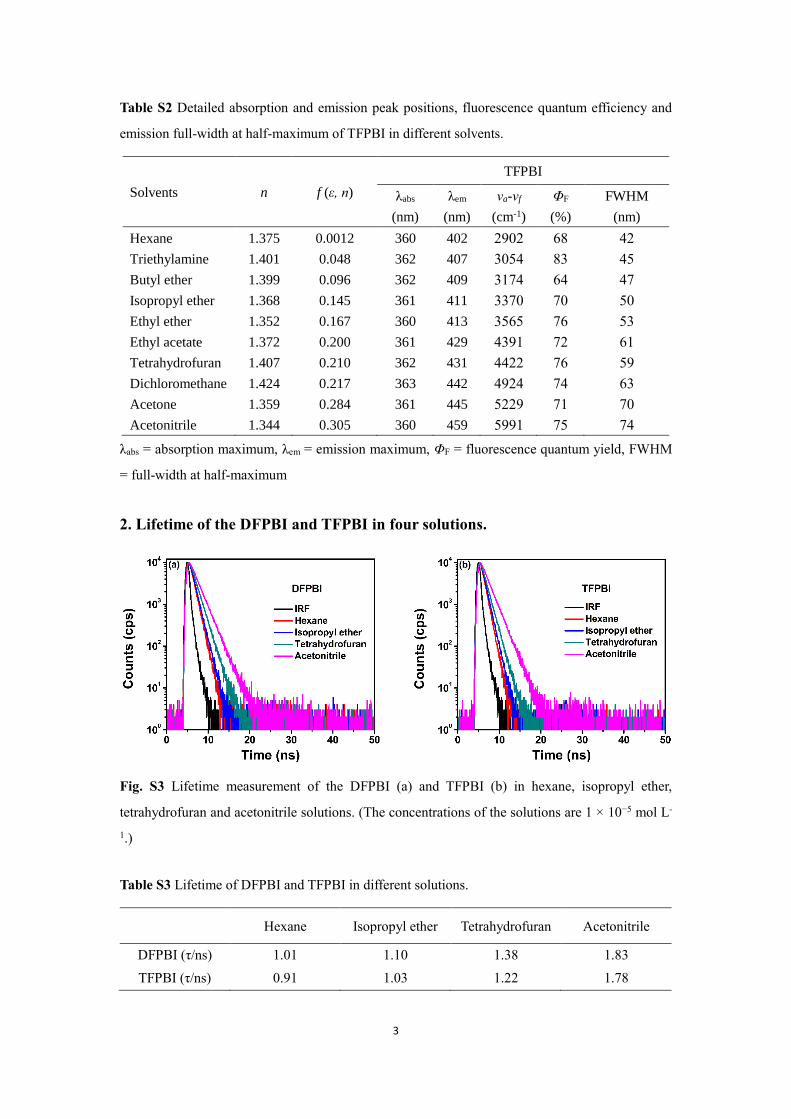
Table S2 Detailed absorption and emission peak positions, fluorescence quantum efficiency and
emission full-width at half-maximum of TFPBI in different solvents.
Solvents n f (ε, n)
TFPBI
λabs
(nm)
λem
(nm)
νa-νf
(cm-1)
ΦF
(%)
FWHM
(nm)
Hexane 1.375 0.0012 360 402 2902 68 42
Triethylamine 1.401 0.048 362 407 3054 83 45
Butyl ether 1.399 0.096 362 409 3174 64 47
Isopropyl ether 1.368 0.145 361 411 3370 70 50
Ethyl ether 1.352 0.167 360 413 3565 76 53
Ethyl acetate 1.372 0.200 361 429 4391 72 61
Tetrahydrofuran 1.407 0.210 362 431 4422 76 59
Dichloromethane 1.424 0.217 363 442 4924 74 63
Acetone 1.359 0.284 361 445 5229 71 70
Acetonitrile 1.344 0.305 360 459 5991 75 74
λabs = absorption maximum, λem = emission maximum, ΦF = fluorescence quantum yield, FWHM
= full-width at half-maximum
2. Lifetime of the DFPBI and TFPBI in four solutions.
Fig. S3 Lifetime measurement of the DFPBI (a) and TFPBI (b) in hexane, isopropyl ether,
tetrahydrofuran and acetonitrile solutions. (The concentrations of the solutions are 1 × 10⁻⁵ mol L-
1.)
Table S3 Lifetime of DFPBI and TFPBI in different solutions.
Hexane Isopropyl ether Tetrahydrofuran Acetonitrile
DFPBI (τ/ns) 1.01 1.10 1.38 1.83
TFPBI (τ/ns) 0.91 1.03 1.22 1.78
4
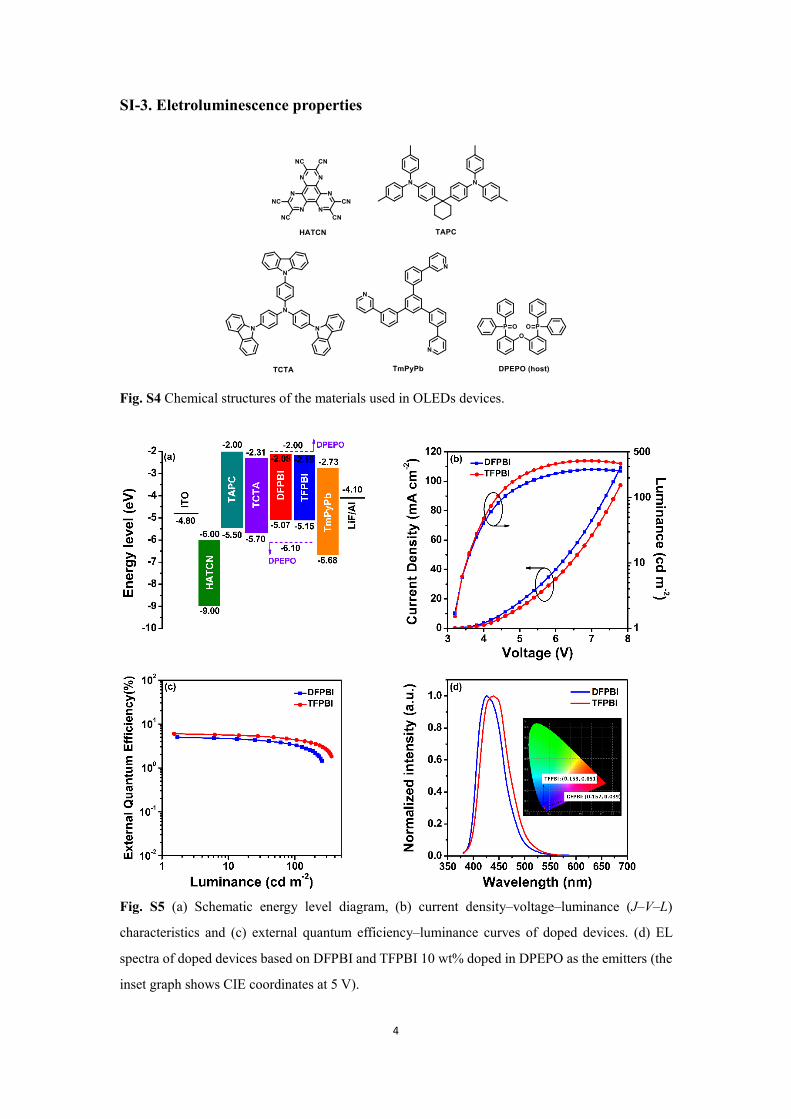
SI-3. Eletroluminescence properties
Fig. S4 Chemical structures of the materials used in OLEDs devices.
Fig. S5 (a) Schematic energy level diagram, (b) current density–voltage–luminance (J–V–L)
characteristics and (c) external quantum efficiency–luminance curves of doped devices. (d) EL
spectra of doped devices based on DFPBI and TFPBI 10 wt% doped in DPEPO as the emitters (the
inset graph shows CIE coordinates at 5 V).
5
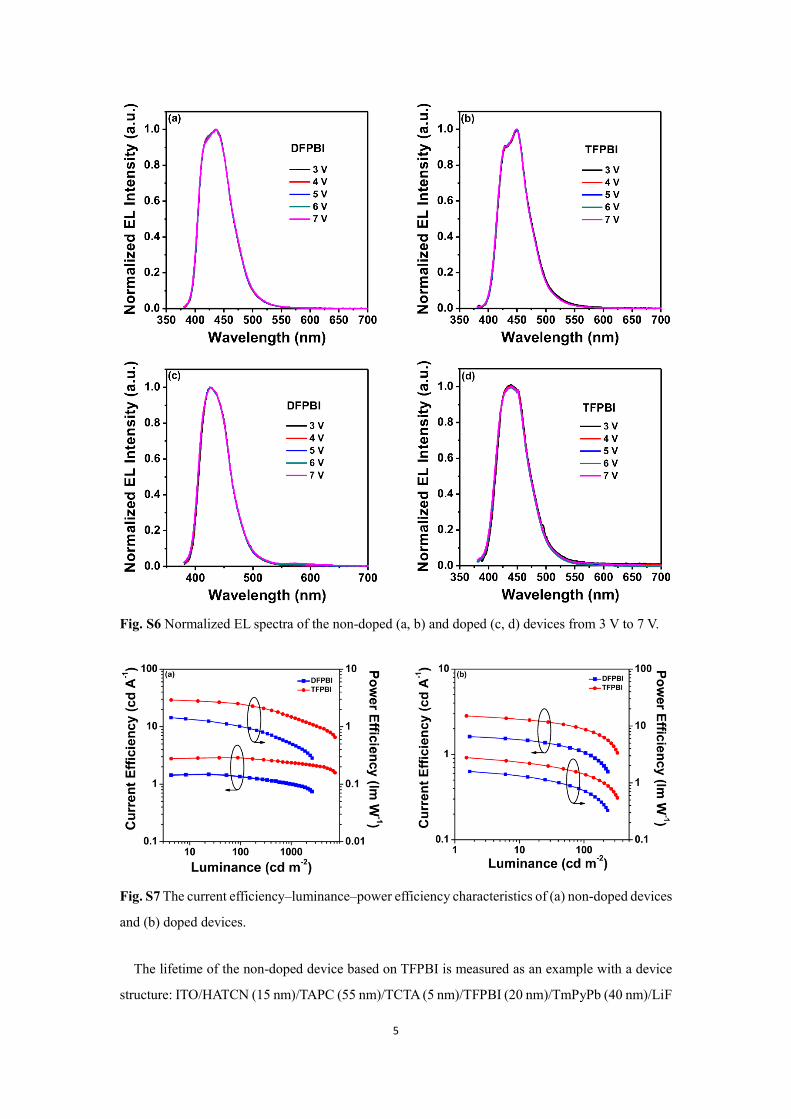
Fig. S6 Normalized EL spectra of the non-doped (a, b) and doped (c, d) devices from 3 V to 7 V.
Fig. S7 The current efficiency–luminance–power efficiency characteristics of (a) non-doped devices
and (b) doped devices.
The lifetime of the non-doped device based on TFPBI is measured as an example with a device
structure: ITO/HATCN (15 nm)/TAPC (55 nm)/TCTA (5 nm)/TFPBI (20 nm)/TmPyPb (40 nm)/LiF
6
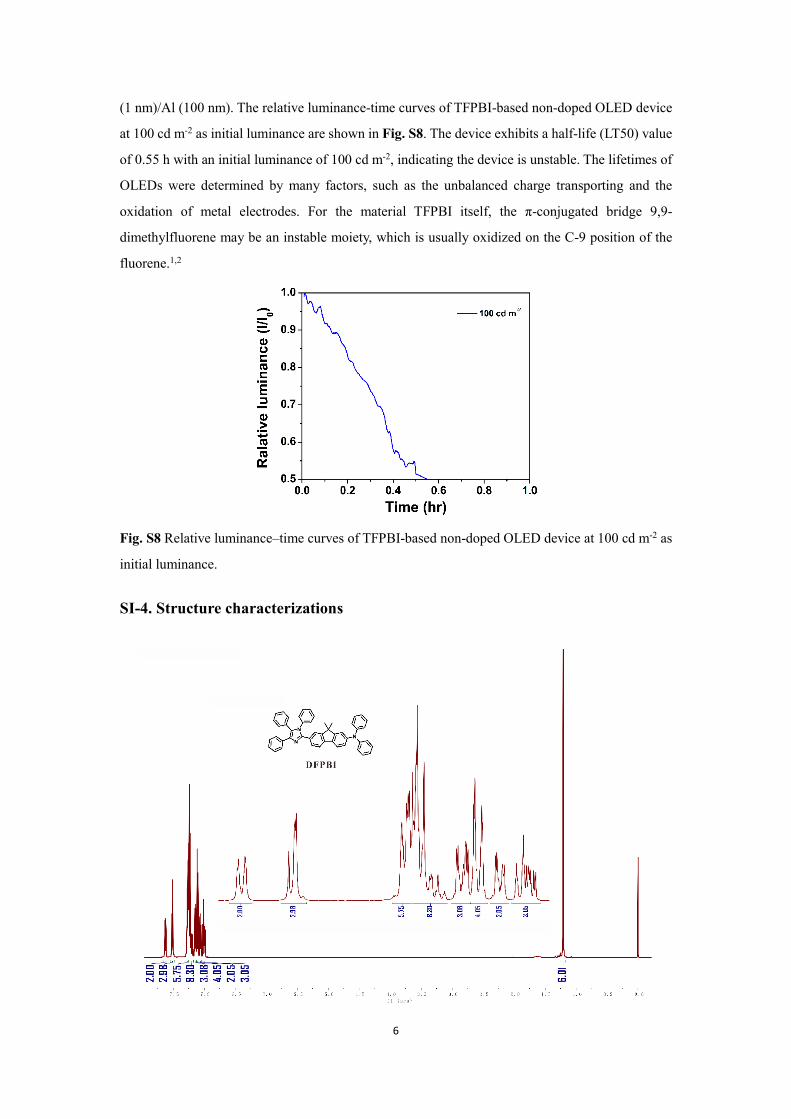
(1 nm)/Al (100 nm). The relative luminance-time curves of TFPBI-based non-doped OLED device
at 100 cd m-2 as initial luminance are shown in Fig. S8. The device exhibits a half-life (LT50) value
of 0.55 h with an initial luminance of 100 cd m-2, indicating the device is unstable. The lifetimes of
OLEDs were determined by many factors, such as the unbalanced charge transporting and the
oxidation of metal electrodes. For the material TFPBI itself, the π-conjugated bridge 9,9-
dimethylfluorene may be an instable moiety, which is usually oxidized on the C-9 position of the
fluorene.1,2
Fig. S8 Relative luminance–time curves of TFPBI-based non-doped OLED device at 100 cd m-2 as
initial luminance.
SI-4. Structure characterizations
7
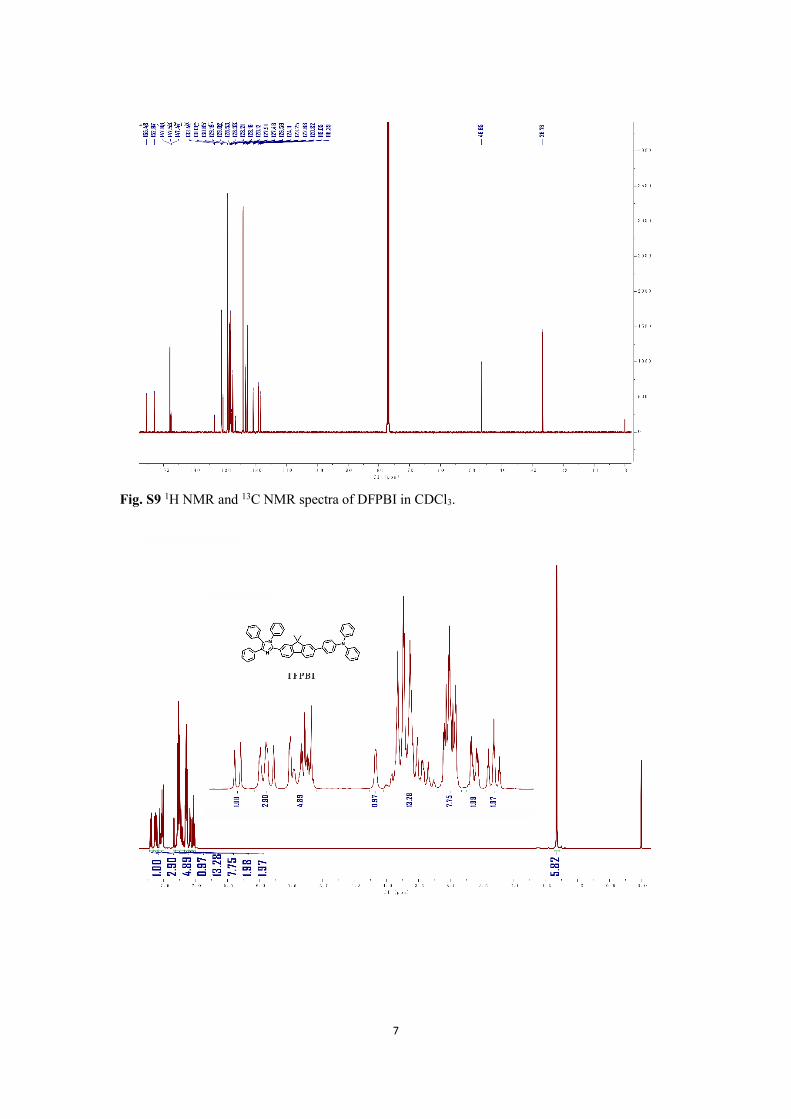
Fig. S9 1H NMR and 13C NMR spectra of DFPBI in CDCl3.
8
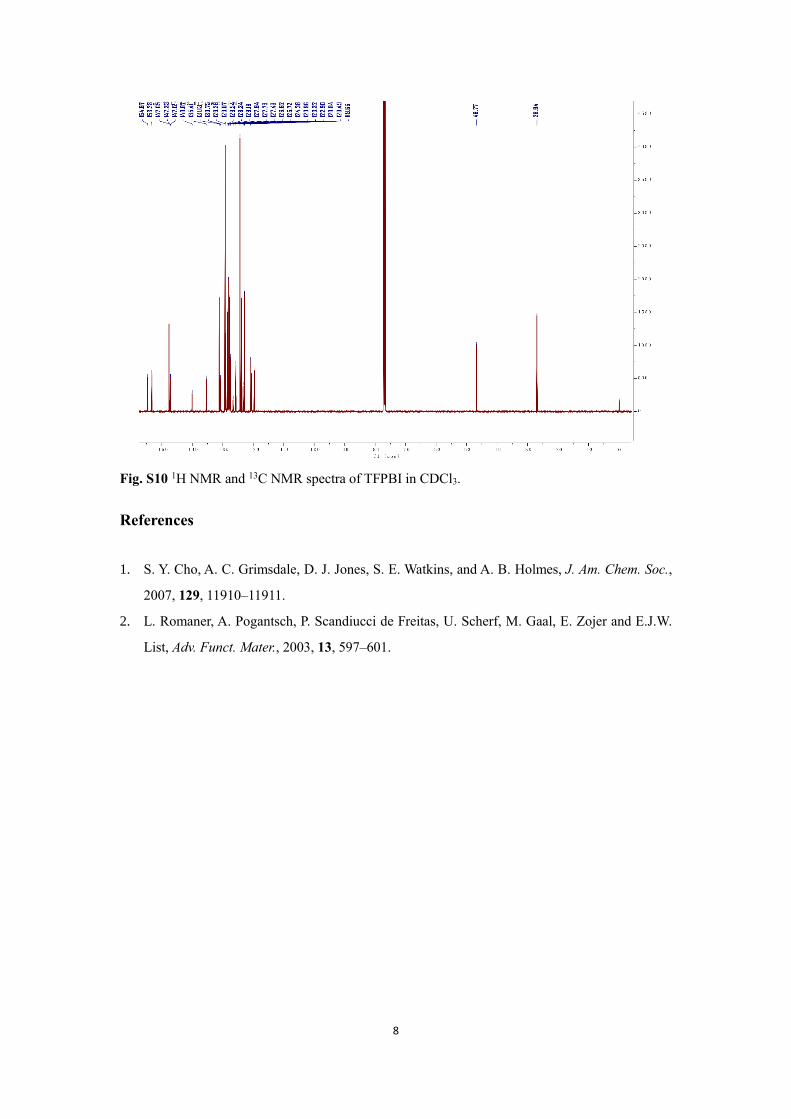
Fig. S10 1H NMR and 13C NMR spectra of TFPBI in CDCl3.
References
1. S. Y. Cho, A. C. Grimsdale, D. J. Jones, S. E. Watkins, and A. B. Holmes, J. Am. Chem. Soc.,
2007, 129, 11910–11911.
2. L. Romaner, A. Pogantsch, P. Scandiucci de Freitas, U. Scherf, M. Gaal, E. Zojer and E.J.W.
List, Adv. Funct. Mater., 2003, 13, 597–601.