Nitrogen Stable Isotope Composition (δ N) of Vehicle … · 2017-07-24 · emission sources is...
8
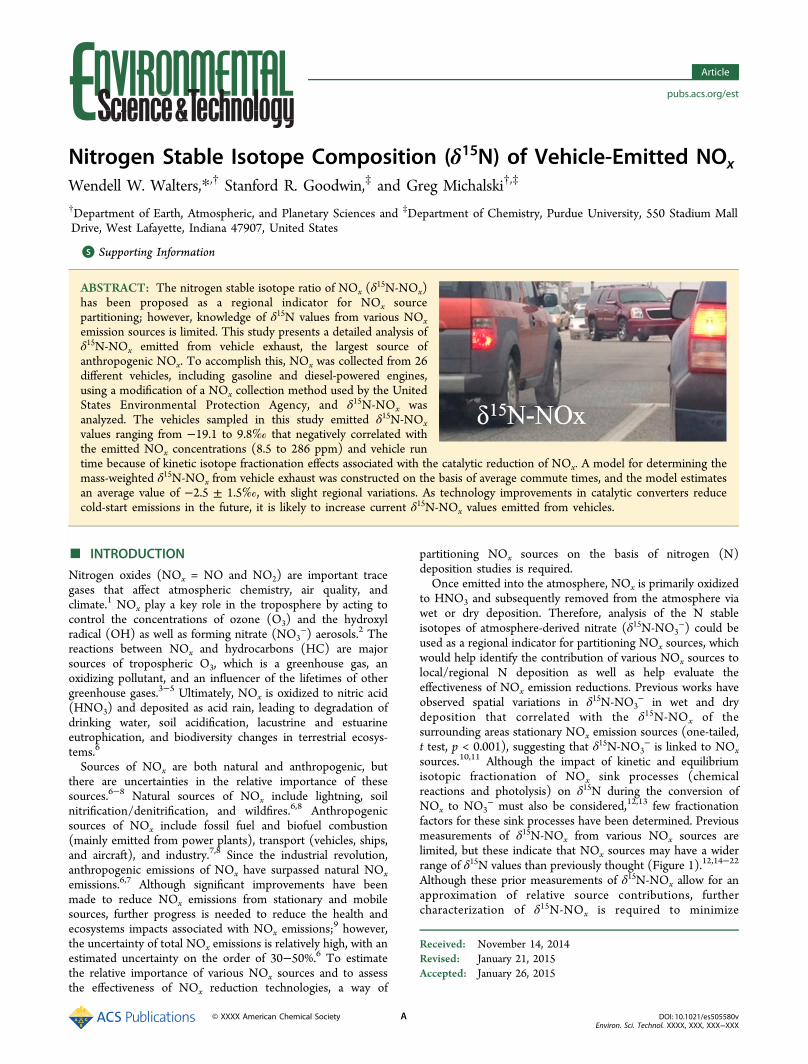
Nitrogen Stable Isotope Composition (δ 15 N) of Vehicle-Emitted NO x Wendell W. Walters,* ,† Stanford R. Goodwin, ‡ and Greg Michalski †,‡ † Department of Earth, Atmospheric, and Planetary Sciences and ‡ Department of Chemistry, Purdue University, 550 Stadium Mall Drive, West Lafayette, Indiana 47907, United States * S Supporting Information ABSTRACT: The nitrogen stable isotope ratio of NO x (δ 15 N-NO x ) has been proposed as a regional indicator for NO x source partitioning; however, knowledge of δ 15 N values from various NO x emission sources is limited. This study presents a detailed analysis of δ 15 N-NO x emitted from vehicle exhaust, the largest source of anthropogenic NO x . To accomplish this, NO x was collected from 26 different vehicles, including gasoline and diesel-powered engines, using a modification of a NO x collection method used by the United States Environmental Protection Agency, and δ 15 N-NO x was analyzed. The vehicles sampled in this study emitted δ 15 N-NO x values ranging from −19.1 to 9.8‰ that negatively correlated with the emitted NO x concentrations (8.5 to 286 ppm) and vehicle run time because of kinetic isotope fractionation effects associated with the catalytic reduction of NO x . A model for determining the mass-weighted δ 15 N-NO x from vehicle exhaust was constructed on the basis of average commute times, and the model estimates an average value of −2.5 ± 1.5‰, with slight regional variations. As technology improvements in catalytic converters reduce cold-start emissions in the future, it is likely to increase current δ 15 N-NO x values emitted from vehicles. ■ INTRODUCTION Nitrogen oxides (NO x = NO and NO 2 ) are important trace gases that affect atmospheric chemistry, air quality, and climate. 1 NO x play a key role in the troposphere by acting to control the concentrations of ozone (O 3 ) and the hydroxyl radical (OH) as well as forming nitrate (NO 3 − ) aerosols. 2 The reactions between NO x and hydrocarbons (HC) are major sources of tropospheric O 3 , which is a greenhouse gas, an oxidizing pollutant, and an influencer of the lifetimes of other greenhouse gases. 3−5 Ultimately, NO x is oxidized to nitric acid (HNO 3 ) and deposited as acid rain, leading to degradation of drinking water, soil acidification, lacustrine and estuarine eutrophication, and biodiversity changes in terrestrial ecosys- tems. 6 Sources of NO x are both natural and anthropogenic, but there are uncertainties in the relative importance of these sources. 6−8 Natural sources of NO x include lightning, soil nitrification/denitrification, and wildfires. 6,8 Anthropogenic sources of NO x include fossil fuel and biofuel combustion (mainly emitted from power plants), transport (vehicles, ships, and aircraft), and industry. 7,8 Since the industrial revolution, anthropogenic emissions of NO x have surpassed natural NO x emissions. 6,7 Although significant improvements have been made to reduce NO x emissions from stationary and mobile sources, further progress is needed to reduce the health and ecosystems impacts associated with NO x emissions; 9 however, the uncertainty of total NO x emissions is relatively high, with an estimated uncertainty on the order of 30−50%. 6 To estimate the relative importance of various NO x sources and to assess the effectiveness of NO x reduction technologies, a way of partitioning NO x sources on the basis of nitrogen (N) deposition studies is required. Once emitted into the atmosphere, NO x is primarily oxidized to HNO 3 and subsequently removed from the atmosphere via wet or dry deposition. Therefore, analysis of the N stable isotopes of atmosphere-derived nitrate (δ 15 N-NO 3 − ) could be used as a regional indicator for partitioning NO x sources, which would help identify the contribution of various NO x sources to local/regional N deposition as well as help evaluate the effectiveness of NO x emission reductions. Previous works have observed spatial variations in δ 15 N-NO 3 − in wet and dry deposition that correlated with the δ 15 N-NO x of the surrounding areas stationary NO x emission sources (one-tailed, t test, p < 0.001), suggesting that δ 15 N-NO 3 − is linked to NO x sources. 10,11 Although the impact of kinetic and equilibrium isotopic fractionation of NO x sink processes (chemical reactions and photolysis) on δ 15 N during the conversion of NO x to NO 3 − must also be considered, 12,13 few fractionation factors for these sink processes have been determined. Previous measurements of δ 15 N-NO x from various NO x sources are limited, but these indicate that NO x sources may have a wider range of δ 15 N values than previously thought (Figure 1). 12,14−22 Although these prior measurements of δ 15 N-NO x allow for an approximation of relative source contributions, further characterization of δ 15 N-NO x is required to minimize Received: November 14, 2014 Revised: January 21, 2015 Accepted: January 26, 2015 Article pubs.acs.org/est © XXXX American Chemical Society A DOI: 10.1021/es505580v Environ. Sci. Technol. XXXX, XXX, XXX−XXX
Transcript of Nitrogen Stable Isotope Composition (δ N) of Vehicle … · 2017-07-24 · emission sources is...
Nitrogen Stable Isotope Composition (δ15N) of Vehicle-Emitted NOx
Wendell W. Walters,*,† Stanford R. Goodwin,‡ and Greg Michalski†,‡
†Department of Earth, Atmospheric, and Planetary Sciences and ‡Department of Chemistry, Purdue University, 550 Stadium MallDrive, West Lafayette, Indiana 47907, United States
*S Supporting Information
ABSTRACT: The nitrogen stable isotope ratio of NOx (δ15N-NOx)
has been proposed as a regional indicator for NOx sourcepartitioning; however, knowledge of δ15N values from various NOxemission sources is limited. This study presents a detailed analysis ofδ15N-NOx emitted from vehicle exhaust, the largest source ofanthropogenic NOx. To accomplish this, NOx was collected from 26different vehicles, including gasoline and diesel-powered engines,using a modification of a NOx collection method used by the UnitedStates Environmental Protection Agency, and δ15N-NOx wasanalyzed. The vehicles sampled in this study emitted δ15N-NOxvalues ranging from −19.1 to 9.8‰ that negatively correlated withthe emitted NOx concentrations (8.5 to 286 ppm) and vehicle runtime because of kinetic isotope fractionation effects associated with the catalytic reduction of NOx. A model for determining themass-weighted δ15N-NOx from vehicle exhaust was constructed on the basis of average commute times, and the model estimatesan average value of −2.5 ± 1.5‰, with slight regional variations. As technology improvements in catalytic converters reducecold-start emissions in the future, it is likely to increase current δ15N-NOx values emitted from vehicles.
■ INTRODUCTION
Nitrogen oxides (NOx = NO and NO2) are important tracegases that affect atmospheric chemistry, air quality, andclimate.1 NOx play a key role in the troposphere by acting tocontrol the concentrations of ozone (O3) and the hydroxylradical (OH) as well as forming nitrate (NO3
−) aerosols.2 Thereactions between NOx and hydrocarbons (HC) are majorsources of tropospheric O3, which is a greenhouse gas, anoxidizing pollutant, and an influencer of the lifetimes of othergreenhouse gases.3−5 Ultimately, NOx is oxidized to nitric acid(HNO3) and deposited as acid rain, leading to degradation ofdrinking water, soil acidification, lacustrine and estuarineeutrophication, and biodiversity changes in terrestrial ecosys-tems.6
Sources of NOx are both natural and anthropogenic, butthere are uncertainties in the relative importance of thesesources.6−8 Natural sources of NOx include lightning, soilnitrification/denitrification, and wildfires.6,8 Anthropogenicsources of NOx include fossil fuel and biofuel combustion(mainly emitted from power plants), transport (vehicles, ships,and aircraft), and industry.7,8 Since the industrial revolution,anthropogenic emissions of NOx have surpassed natural NOxemissions.6,7 Although significant improvements have beenmade to reduce NOx emissions from stationary and mobilesources, further progress is needed to reduce the health andecosystems impacts associated with NOx emissions;9 however,the uncertainty of total NOx emissions is relatively high, with anestimated uncertainty on the order of 30−50%.6 To estimatethe relative importance of various NOx sources and to assessthe effectiveness of NOx reduction technologies, a way of
partitioning NOx sources on the basis of nitrogen (N)deposition studies is required.Once emitted into the atmosphere, NOx is primarily oxidized
to HNO3 and subsequently removed from the atmosphere viawet or dry deposition. Therefore, analysis of the N stableisotopes of atmosphere-derived nitrate (δ15N-NO3
−) could beused as a regional indicator for partitioning NOx sources, whichwould help identify the contribution of various NOx sources tolocal/regional N deposition as well as help evaluate theeffectiveness of NOx emission reductions. Previous works haveobserved spatial variations in δ15N-NO3
− in wet and drydeposition that correlated with the δ15N-NOx of thesurrounding areas stationary NOx emission sources (one-tailed,t test, p < 0.001), suggesting that δ15N-NO3
− is linked to NOxsources.10,11 Although the impact of kinetic and equilibriumisotopic fractionation of NOx sink processes (chemicalreactions and photolysis) on δ15N during the conversion ofNOx to NO3
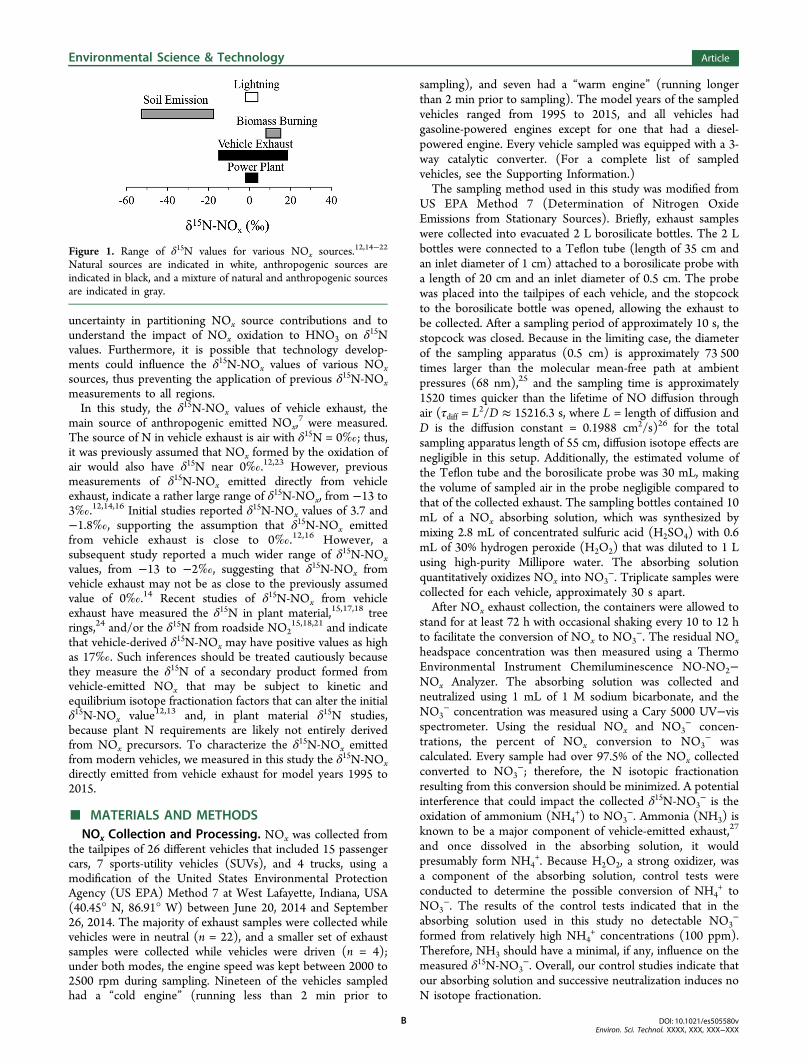
− must also be considered,12,13 few fractionationfactors for these sink processes have been determined. Previousmeasurements of δ15N-NOx from various NOx sources arelimited, but these indicate that NOx sources may have a widerrange of δ15N values than previously thought (Figure 1).12,14−22
Although these prior measurements of δ15N-NOx allow for anapproximation of relative source contributions, furthercharacterization of δ15N-NOx is required to minimize
Received: November 14, 2014Revised: January 21, 2015Accepted: January 26, 2015
Article
pubs.acs.org/est
© XXXX American Chemical Society A DOI: 10.1021/es505580vEnviron. Sci. Technol. XXXX, XXX, XXX−XXX
uncertainty in partitioning NOx source contributions and tounderstand the impact of NOx oxidation to HNO3 on δ15Nvalues. Furthermore, it is possible that technology develop-ments could influence the δ15N-NOx values of various NOxsources, thus preventing the application of previous δ15N-NOxmeasurements to all regions.In this study, the δ15N-NOx values of vehicle exhaust, the
main source of anthropogenic emitted NOx,7 were measured.
The source of N in vehicle exhaust is air with δ15N = 0‰; thus,it was previously assumed that NOx formed by the oxidation ofair would also have δ15N near 0‰.12,23 However, previousmeasurements of δ15N-NOx emitted directly from vehicleexhaust, indicate a rather large range of δ15N-NOx, from −13 to3‰.12,14,16 Initial studies reported δ15N-NOx values of 3.7 and−1.8‰, supporting the assumption that δ15N-NOx emittedfrom vehicle exhaust is close to 0‰.12,16 However, asubsequent study reported a much wider range of δ15N-NOxvalues, from −13 to −2‰, suggesting that δ15N-NOx fromvehicle exhaust may not be as close to the previously assumedvalue of 0‰.14 Recent studies of δ15N-NOx from vehicleexhaust have measured the δ15N in plant material,15,17,18 treerings,24 and/or the δ15N from roadside NO2
15,18,21 and indicatethat vehicle-derived δ15N-NOx may have positive values as highas 17‰. Such inferences should be treated cautiously becausethey measure the δ15N of a secondary product formed fromvehicle-emitted NOx that may be subject to kinetic andequilibrium isotope fractionation factors that can alter the initialδ15N-NOx value12,13 and, in plant material δ15N studies,because plant N requirements are likely not entirely derivedfrom NOx precursors. To characterize the δ15N-NOx emittedfrom modern vehicles, we measured in this study the δ15N-NOxdirectly emitted from vehicle exhaust for model years 1995 to2015.
■ MATERIALS AND METHODSNOx Collection and Processing. NOx was collected from
the tailpipes of 26 different vehicles that included 15 passengercars, 7 sports-utility vehicles (SUVs), and 4 trucks, using amodification of the United States Environmental ProtectionAgency (US EPA) Method 7 at West Lafayette, Indiana, USA(40.45° N, 86.91° W) between June 20, 2014 and September26, 2014. The majority of exhaust samples were collected whilevehicles were in neutral (n = 22), and a smaller set of exhaustsamples were collected while vehicles were driven (n = 4);under both modes, the engine speed was kept between 2000 to2500 rpm during sampling. Nineteen of the vehicles sampledhad a “cold engine” (running less than 2 min prior to
sampling), and seven had a “warm engine” (running longerthan 2 min prior to sampling). The model years of the sampledvehicles ranged from 1995 to 2015, and all vehicles hadgasoline-powered engines except for one that had a diesel-powered engine. Every vehicle sampled was equipped with a 3-way catalytic converter. (For a complete list of sampledvehicles, see the Supporting Information.)The sampling method used in this study was modified from
US EPA Method 7 (Determination of Nitrogen OxideEmissions from Stationary Sources). Briefly, exhaust sampleswere collected into evacuated 2 L borosilicate bottles. The 2 Lbottles were connected to a Teflon tube (length of 35 cm andan inlet diameter of 1 cm) attached to a borosilicate probe witha length of 20 cm and an inlet diameter of 0.5 cm. The probewas placed into the tailpipes of each vehicle, and the stopcockto the borosilicate bottle was opened, allowing the exhaust tobe collected. After a sampling period of approximately 10 s, thestopcock was closed. Because in the limiting case, the diameterof the sampling apparatus (0.5 cm) is approximately 73 500times larger than the molecular mean-free path at ambientpressures (68 nm),25 and the sampling time is approximately1520 times quicker than the lifetime of NO diffusion throughair (τdiff = L2/D ≈ 15216.3 s, where L = length of diffusion andD is the diffusion constant = 0.1988 cm2/s)26 for the totalsampling apparatus length of 55 cm, diffusion isotope effects arenegligible in this setup. Additionally, the estimated volume ofthe Teflon tube and the borosilicate probe was 30 mL, makingthe volume of sampled air in the probe negligible compared tothat of the collected exhaust. The sampling bottles contained 10mL of a NOx absorbing solution, which was synthesized bymixing 2.8 mL of concentrated sulfuric acid (H2SO4) with 0.6mL of 30% hydrogen peroxide (H2O2) that was diluted to 1 Lusing high-purity Millipore water. The absorbing solutionquantitatively oxidizes NOx into NO3
−. Triplicate samples werecollected for each vehicle, approximately 30 s apart.After NOx exhaust collection, the containers were allowed to
stand for at least 72 h with occasional shaking every 10 to 12 hto facilitate the conversion of NOx to NO3
−. The residual NOxheadspace concentration was then measured using a ThermoEnvironmental Instrument Chemiluminescence NO-NO2−NOx Analyzer. The absorbing solution was collected andneutralized using 1 mL of 1 M sodium bicarbonate, and theNO3
− concentration was measured using a Cary 5000 UV−visspectrometer. Using the residual NOx and NO3
− concen-trations, the percent of NOx conversion to NO3
− wascalculated. Every sample had over 97.5% of the NOx collectedconverted to NO3
−; therefore, the N isotopic fractionationresulting from this conversion should be minimized. A potentialinterference that could impact the collected δ15N-NO3
− is theoxidation of ammonium (NH4
+) to NO3−. Ammonia (NH3) is
known to be a major component of vehicle-emitted exhaust,27
and once dissolved in the absorbing solution, it wouldpresumably form NH4
+. Because H2O2, a strong oxidizer, wasa component of the absorbing solution, control tests wereconducted to determine the possible conversion of NH4
+ toNO3
−. The results of the control tests indicated that in theabsorbing solution used in this study no detectable NO3
−
formed from relatively high NH4+ concentrations (100 ppm).
Therefore, NH3 should have a minimal, if any, influence on themeasured δ15N-NO3
−. Overall, our control studies indicate thatour absorbing solution and successive neutralization induces noN isotope fractionation.
Figure 1. Range of δ15N values for various NOx sources.12,14−22
Natural sources are indicated in white, anthropogenic sources areindicated in black, and a mixture of natural and anthropogenic sourcesare indicated in gray.
Environmental Science & Technology Article
DOI: 10.1021/es505580vEnviron. Sci. Technol. XXXX, XXX, XXX−XXX
B
Isotopic Analysis. For N isotopic analysis, approximately250 nmol of NO3
− was injected into a 12 mL vial containing 1mL of a denitrifying strain of bacteria (P. aureofaciens) thatconverts NO3
− to nitrous oxide (N2O).28 The N2O was
extracted and purified using an automated head-space gaschromatography system and analyzed for δ15N values by aThermo Delta V continuous-flow isotope ratio massspectrometer (CF-IRMS) at the Purdue Stable Isotopes lab.29
Values of δ15N are reported in parts per thousand relative toatmospheric N2, represented as
δ =−
×N (‰)( N/ N) ( N/ N)
( N/ N)100015
sample
15 14sample
15 14air
15 14air
(1)
Working lab standards calibrated to NIST isotope referencenitrates USGS34 and USGS35 were used to correct for isotopicfractionation resulting from the denitrification of NO3
− and thesubsequent N2O purification process. The working standardshad an average standard deviation of 0.3‰ for δ15N.
■ RESULTS AND DISCUSSIONTable 1 details the vehicle information and the data measuredfrom the vehicles sampled in this study. The text belowsummarizes the NOx concentrations and δ15N-NOx values ofthe collected samples and discusses our interpretation of theseresults.NOx Exhaust Concentration. The average concentration
of NOx for individual vehicles ranged from 8.5 to 286 ppm,with standard deviations ranging from 0.2 to 250 ppm fortriplicate samples. The large range and variance of emitted NOx
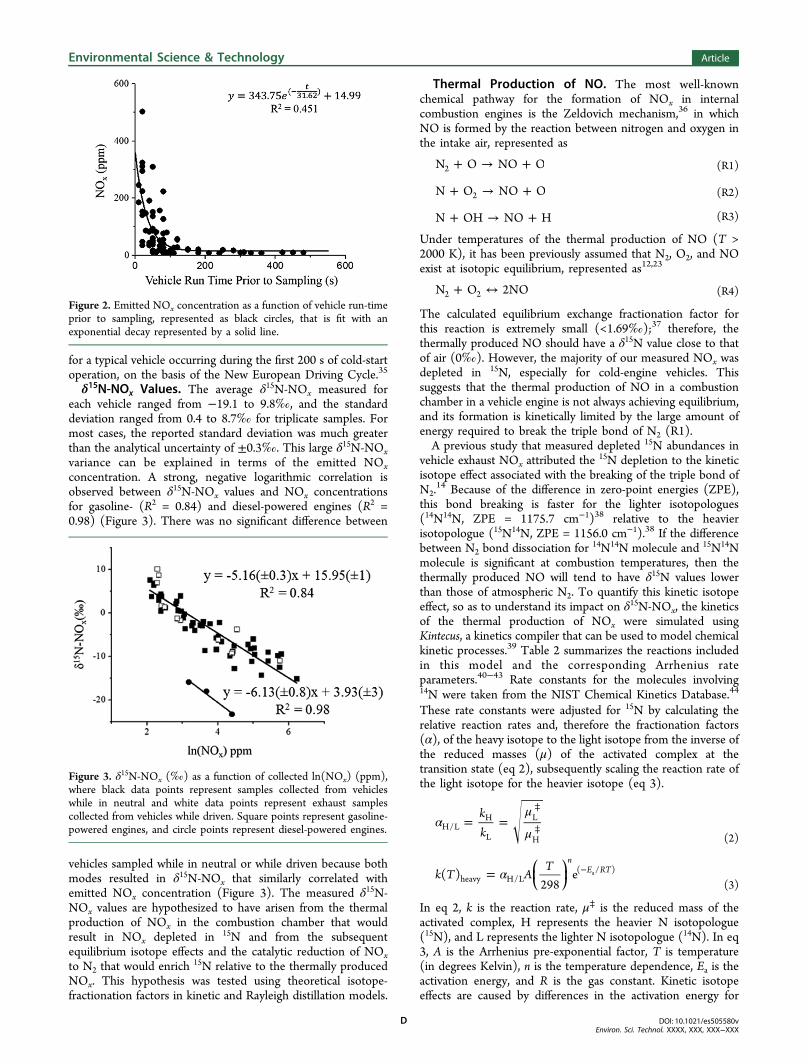
can be explained by the run times of the engine prior tosampling that were divided into either cold engines (runningless than 2 min prior to sampling) or warm engines (runninglonger than 2 min prior to sampling). Vehicles with coldengines emitted significantly more NOx (95 ± 70 ppm, n = 19)compared to warm engines (17 ± 8.6 ppm, n = 7), a findingthat was statistically significant at a confidence level of 0.01 (p <0.01). In the case of vehicles with cold engines, the highest NOx
concentrations were always collected from the first sample, andNOx concentrations drastically decreased for subsequentsamples. Alternatively, warm-engine vehicles generally emittedNOx at a consistent concentration for all samples collected.Overall, emitted NOx concentrations exhibited an exponentialdecay that moderately correlated with the vehicle run time priorto sampling for all samples (Figure 2).These results are consistent with other studies that have
shown that cold engines have higher emissions of NOx.30−33
This occurs because of a rich air−fuel ratio in cold engines andis due to the inefficiency of the 3-way catalytic converters atreducing NOx emissions under cold-engine conditions.30−33
Generally, when an engine is first started, the fuel does notcompletely vaporize, and this causes higher emissions ofhydrocarbons (HC), NOx, and carbon monoxide (CO). As theengine reaches its operating temperature, the air−fuel ratioreaches the stoichiometric point for combustion, and catalyticconverters become efficient, and the emissions of HC, CO, andNOx diminish.
30,33 Despite the progress made at reducing HC,CO, and NOx emissions with the 3-way catalytic converter,vehicles account for roughly 50% of the emissions of thesegases,32,34 with approximately 60−80% of the total emissions
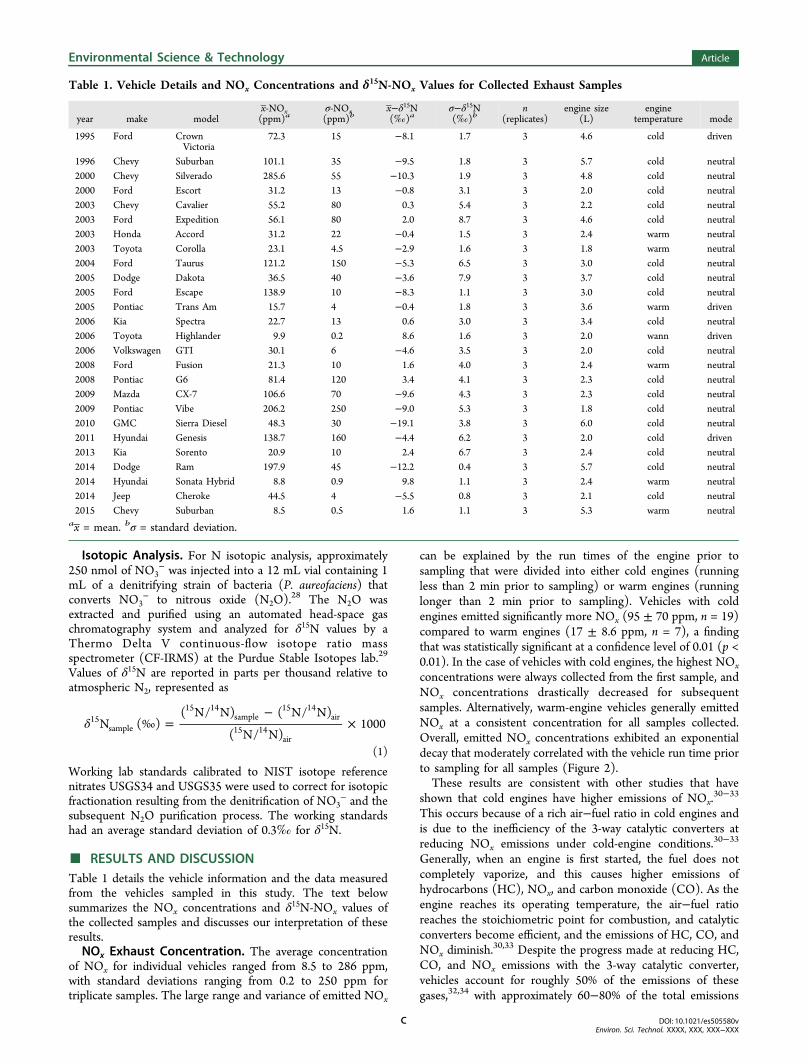
Table 1. Vehicle Details and NOx Concentrations and δ15N-NOx Values for Collected Exhaust Samples
year make modelx-NOx(ppm)a
σ-NOx(ppm)b
x−δ15N(‰)a
σ−δ15N(‰)b
n(replicates)
engine size(L)
enginetemperature mode
1995 Ford CrownVictoria
72.3 15 −8.1 1.7 3 4.6 cold driven
1996 Chevy Suburban 101.1 35 −9.5 1.8 3 5.7 cold neutral2000 Chevy Silverado 285.6 55 −10.3 1.9 3 4.8 cold neutral2000 Ford Escort 31.2 13 −0.8 3.1 3 2.0 cold neutral2003 Chevy Cavalier 55.2 80 0.3 5.4 3 2.2 cold neutral2003 Ford Expedition 56.1 80 2.0 8.7 3 4.6 cold neutral2003 Honda Accord 31.2 22 −0.4 1.5 3 2.4 warm neutral2003 Toyota Corolla 23.1 4.5 −2.9 1.6 3 1.8 warm neutral2004 Ford Taurus 121.2 150 −5.3 6.5 3 3.0 cold neutral2005 Dodge Dakota 36.5 40 −3.6 7.9 3 3.7 cold neutral2005 Ford Escape 138.9 10 −8.3 1.1 3 3.0 cold neutral2005 Pontiac Trans Am 15.7 4 −0.4 1.8 3 3.6 warm driven2006 Kia Spectra 22.7 13 0.6 3.0 3 3.4 cold neutral2006 Toyota Highlander 9.9 0.2 8.6 1.6 3 2.0 wann driven2006 Volkswagen GTI 30.1 6 −4.6 3.5 3 2.0 cold neutral2008 Ford Fusion 21.3 10 1.6 4.0 3 2.4 warm neutral2008 Pontiac G6 81.4 120 3.4 4.1 3 2.3 cold neutral2009 Mazda CX-7 106.6 70 −9.6 4.3 3 2.3 cold neutral2009 Pontiac Vibe 206.2 250 −9.0 5.3 3 1.8 cold neutral2010 GMC Sierra Diesel 48.3 30 −19.1 3.8 3 6.0 cold neutral2011 Hyundai Genesis 138.7 160 −4.4 6.2 3 2.0 cold driven2013 Kia Sorento 20.9 10 2.4 6.7 3 2.4 cold neutral2014 Dodge Ram 197.9 45 −12.2 0.4 3 5.7 cold neutral2014 Hyundai Sonata Hybrid 8.8 0.9 9.8 1.1 3 2.4 warm neutral2014 Jeep Cheroke 44.5 4 −5.5 0.8 3 2.1 cold neutral2015 Chevy Suburban 8.5 0.5 1.6 1.1 3 5.3 warm neutral
ax = mean. bσ = standard deviation.
Environmental Science & Technology Article
DOI: 10.1021/es505580vEnviron. Sci. Technol. XXXX, XXX, XXX−XXX
C
for a typical vehicle occurring during the first 200 s of cold-startoperation, on the basis of the New European Driving Cycle.35
δ15N-NOx Values. The average δ15N-NOx measured foreach vehicle ranged from −19.1 to 9.8‰, and the standarddeviation ranged from 0.4 to 8.7‰ for triplicate samples. Formost cases, the reported standard deviation was much greaterthan the analytical uncertainty of ±0.3‰. This large δ15N-NOxvariance can be explained in terms of the emitted NOxconcentration. A strong, negative logarithmic correlation isobserved between δ15N-NOx values and NOx concentrationsfor gasoline- (R2 = 0.84) and diesel-powered engines (R2 =0.98) (Figure 3). There was no significant difference between
vehicles sampled while in neutral or while driven because bothmodes resulted in δ15N-NOx that similarly correlated withemitted NOx concentration (Figure 3). The measured δ15N-NOx values are hypothesized to have arisen from the thermalproduction of NOx in the combustion chamber that wouldresult in NOx depleted in 15N and from the subsequentequilibrium isotope effects and the catalytic reduction of NOxto N2 that would enrich 15N relative to the thermally producedNOx. This hypothesis was tested using theoretical isotope-fractionation factors in kinetic and Rayleigh distillation models.
Thermal Production of NO. The most well-knownchemical pathway for the formation of NOx in internalcombustion engines is the Zeldovich mechanism,36 in whichNO is formed by the reaction between nitrogen and oxygen inthe intake air, represented as
+ → +N O NO O2 (R1)
+ → +N O NO O2 (R2)
+ → +N OH NO H (R3)
Under temperatures of the thermal production of NO (T >2000 K), it has been previously assumed that N2, O2, and NOexist at isotopic equilibrium, represented as12,23
+ ↔N O 2NO2 2 (R4)
The calculated equilibrium exchange fractionation factor forthis reaction is extremely small (<1.69‰);37 therefore, thethermally produced NO should have a δ15N value close to thatof air (0‰). However, the majority of our measured NOx wasdepleted in 15N, especially for cold-engine vehicles. Thissuggests that the thermal production of NO in a combustionchamber in a vehicle engine is not always achieving equilibrium,and its formation is kinetically limited by the large amount ofenergy required to break the triple bond of N2 (R1).A previous study that measured depleted 15N abundances in
vehicle exhaust NOx attributed the 15N depletion to the kineticisotope effect associated with the breaking of the triple bond ofN2.
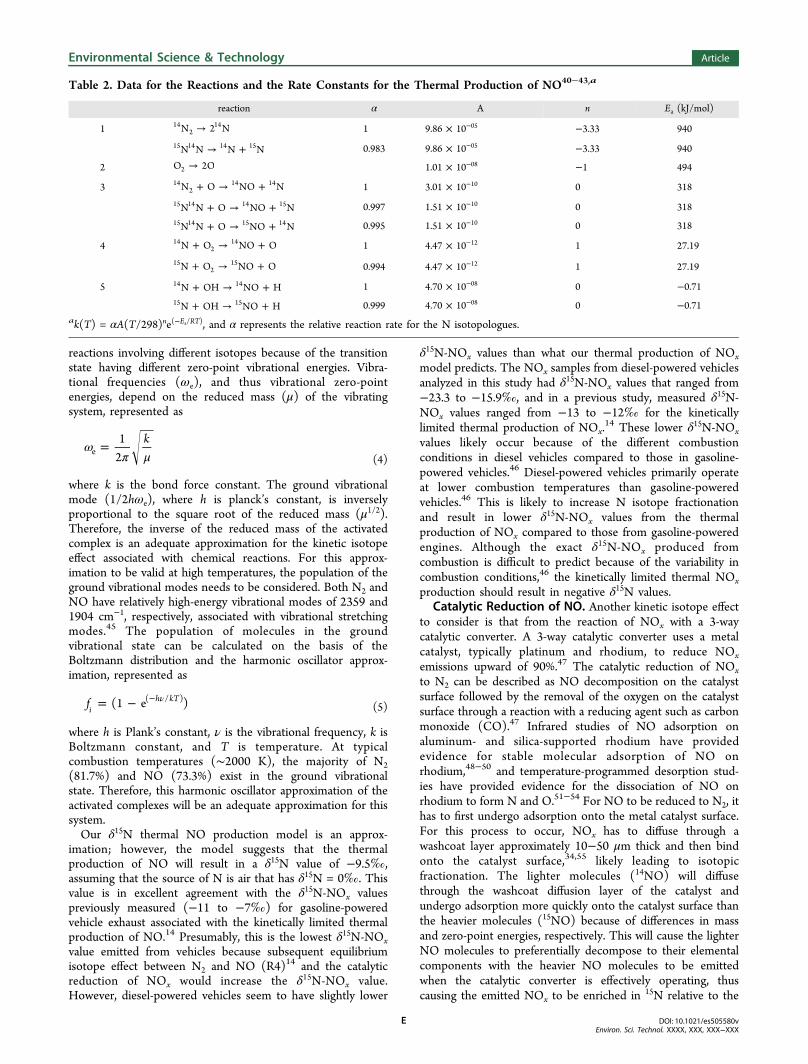
14 Because of the difference in zero-point energies (ZPE),this bond breaking is faster for the lighter isotopologues(14N14N, ZPE = 1175.7 cm−1)38 relative to the heavierisotopologue (15N14N, ZPE = 1156.0 cm−1).38 If the differencebetween N2 bond dissociation for 14N14N molecule and 15N14Nmolecule is significant at combustion temperatures, then thethermally produced NO will tend to have δ15N values lowerthan those of atmospheric N2. To quantify this kinetic isotopeeffect, so as to understand its impact on δ15N-NOx, the kineticsof the thermal production of NOx were simulated usingKintecus, a kinetics compiler that can be used to model chemicalkinetic processes.39 Table 2 summarizes the reactions includedin this model and the corresponding Arrhenius rateparameters.40−43 Rate constants for the molecules involving14N were taken from the NIST Chemical Kinetics Database.44
These rate constants were adjusted for 15N by calculating therelative reaction rates and, therefore the fractionation factors(α), of the heavy isotope to the light isotope from the inverse ofthe reduced masses (μ) of the activated complex at thetransition state (eq 2), subsequently scaling the reaction rate ofthe light isotope for the heavier isotope (eq 3).
αμ
μ= =
⧧
⧧kkH/L
H
L
L
H (2)
α= −⎜ ⎟⎛⎝
⎞⎠k T A
T( )
298e
nE RT
heavy H/L( / )a
(3)
In eq 2, k is the reaction rate, μ⧧ is the reduced mass of theactivated complex, H represents the heavier N isotopologue(15N), and L represents the lighter N isotopologue (14N). In eq3, A is the Arrhenius pre-exponential factor, T is temperature(in degrees Kelvin), n is the temperature dependence, Ea is theactivation energy, and R is the gas constant. Kinetic isotopeeffects are caused by differences in the activation energy for
Figure 2. Emitted NOx concentration as a function of vehicle run-timeprior to sampling, represented as black circles, that is fit with anexponential decay represented by a solid line.
Figure 3. δ15N-NOx (‰) as a function of collected ln(NOx) (ppm),where black data points represent samples collected from vehicleswhile in neutral and white data points represent exhaust samplescollected from vehicles while driven. Square points represent gasoline-powered engines, and circle points represent diesel-powered engines.
Environmental Science & Technology Article
DOI: 10.1021/es505580vEnviron. Sci. Technol. XXXX, XXX, XXX−XXX
D
reactions involving different isotopes because of the transitionstate having different zero-point vibrational energies. Vibra-tional frequencies (ωe), and thus vibrational zero-pointenergies, depend on the reduced mass (μ) of the vibratingsystem, represented as
ωπ μ
= k12e
(4)
where k is the bond force constant. The ground vibrationalmode (1/2hωe), where h is planck’s constant, is inverselyproportional to the square root of the reduced mass (μ1/2).Therefore, the inverse of the reduced mass of the activatedcomplex is an adequate approximation for the kinetic isotopeeffect associated with chemical reactions. For this approx-imation to be valid at high temperatures, the population of theground vibrational modes needs to be considered. Both N2 andNO have relatively high-energy vibrational modes of 2359 and1904 cm−1, respectively, associated with vibrational stretchingmodes.45 The population of molecules in the groundvibrational state can be calculated on the basis of theBoltzmann distribution and the harmonic oscillator approx-imation, represented as
= − ν−f (1 e )ih kT( / )
(5)
where h is Plank’s constant, ν is the vibrational frequency, k isBoltzmann constant, and T is temperature. At typicalcombustion temperatures (∼2000 K), the majority of N2(81.7%) and NO (73.3%) exist in the ground vibrationalstate. Therefore, this harmonic oscillator approximation of theactivated complexes will be an adequate approximation for thissystem.Our δ15N thermal NO production model is an approx-
imation; however, the model suggests that the thermalproduction of NO will result in a δ15N value of −9.5‰,assuming that the source of N is air that has δ15N = 0‰. Thisvalue is in excellent agreement with the δ15N-NOx valuespreviously measured (−11 to −7‰) for gasoline-poweredvehicle exhaust associated with the kinetically limited thermalproduction of NO.14 Presumably, this is the lowest δ15N-NOxvalue emitted from vehicles because subsequent equilibriumisotope effect between N2 and NO (R4)14 and the catalyticreduction of NOx would increase the δ15N-NOx value.However, diesel-powered vehicles seem to have slightly lower
δ15N-NOx values than what our thermal production of NOxmodel predicts. The NOx samples from diesel-powered vehiclesanalyzed in this study had δ15N-NOx values that ranged from−23.3 to −15.9‰, and in a previous study, measured δ15N-NOx values ranged from −13 to −12‰ for the kineticallylimited thermal production of NOx.
14 These lower δ15N-NOxvalues likely occur because of the different combustionconditions in diesel vehicles compared to those in gasoline-powered vehicles.46 Diesel-powered vehicles primarily operateat lower combustion temperatures than gasoline-poweredvehicles.46 This is likely to increase N isotope fractionationand result in lower δ15N-NOx values from the thermalproduction of NOx compared to those from gasoline-poweredengines. Although the exact δ15N-NOx produced fromcombustion is difficult to predict because of the variability incombustion conditions,46 the kinetically limited thermal NOxproduction should result in negative δ15N values.
Catalytic Reduction of NO. Another kinetic isotope effectto consider is that from the reaction of NOx with a 3-waycatalytic converter. A 3-way catalytic converter uses a metalcatalyst, typically platinum and rhodium, to reduce NOxemissions upward of 90%.47 The catalytic reduction of NOxto N2 can be described as NO decomposition on the catalystsurface followed by the removal of the oxygen on the catalystsurface through a reaction with a reducing agent such as carbonmonoxide (CO).47 Infrared studies of NO adsorption onaluminum- and silica-supported rhodium have providedevidence for stable molecular adsorption of NO onrhodium,48−50 and temperature-programmed desorption stud-ies have provided evidence for the dissociation of NO onrhodium to form N and O.51−54 For NO to be reduced to N2, ithas to first undergo adsorption onto the metal catalyst surface.For this process to occur, NOx has to diffuse through awashcoat layer approximately 10−50 μm thick and then bindonto the catalyst surface,34,55 likely leading to isotopicfractionation. The lighter molecules (14NO) will diffusethrough the washcoat diffusion layer of the catalyst andundergo adsorption more quickly onto the catalyst surface thanthe heavier molecules (15NO) because of differences in massand zero-point energies, respectively. This will cause the lighterNO molecules to preferentially decompose to their elementalcomponents with the heavier NO molecules to be emittedwhen the catalytic converter is effectively operating, thuscausing the emitted NOx to be enriched in 15N relative to the
Table 2. Data for the Reactions and the Rate Constants for the Thermal Production of NO40−43,a
reaction α A n Ea (kJ/mol)
1 →N 2 N142
14 1 9.86 × 10−05 −3.33 940
→ +N N N N15 14 14 15 0.983 9.86 × 10−05 −3.33 940
2 →O 2O2 1.01 × 10−08 −1 494
3 + → +N O NO N142
14 14 1 3.01 × 10⁻¹⁰ 0 318
+ → +N N O NO N15 14 14 15 0.997 1.51 × 10⁻¹⁰ 0 318
+ → +N N O NO N15 14 15 14 0.995 1.51 × 10⁻¹⁰ 0 318
4 + → +N O NO O142
14 1 4.47 × 10⁻¹² 1 27.19
+ → +N O NO O152
15 0.994 4.47 × 10⁻¹² 1 27.19
5 + → +N OH NO H14 14 1 4.70 × 10−08 0 −0.71
+ → +N OH NO H15 15 0.999 4.70 × 10−08 0 −0.71ak(T) = αA(T/298)ne(−Ea/RT), and α represents the relative reaction rate for the N isotopologues.
Environmental Science & Technology Article
DOI: 10.1021/es505580vEnviron. Sci. Technol. XXXX, XXX, XXX−XXX
E
thermally produced NO. The number of potentially fractionat-ing reactions and difficulties in assessing catalytic isotope effectsfor each step is beyond the scope of this work. Rather, theobserved δ15N-NOx and NOx concentration were used in aRayleigh distillation model to determine the catalyticconverter’s net isotope effect, which includes diffusion,equilibrium, and kinetic effects.δ15N-NOx Exhaust Fractionation Factor. The results of
this study indicate a strong relationship between the emittedNOx concentration and δ15N-NOx (Figure 3): in general, themore concentrated the NOx emission, the lower the δ15N-NOxvalue. Our kinetics model indicates that thermally producedNO is depleted in 15N. In the absence of a 3-way catalyticconverter or under conditions of inefficient NOx reduction(cold engine and catalytic converter), the kinetically limitedNOx production is likely to result in a negative δ
15N-NOx value.As the vehicle engine becomes more efficient and the catalyticconverter warms up, NOx emissions are reduced, and the NOxbecomes enriched in 15N relative to thermally produced NO,likely as a result of the equilibrium isotope effect between N2and NO (R4)14 as well as the kinetic isotope effect associatedwith the diffusion and adsorption of NOx onto the catalyticconverter surface as previously discussed.To quantitatively determine the δ15N isotope fractionation
associated with the reduction of NOx caused by the warming ofa vehicle engine and catalytic converter, this process wasmodeled according to a Rayleigh type fractionation, repre-sented as.
δ δ ε= −N N ln[NO ]f x15 15
o (6)
where δ15Nf is the measured δ15N-NOx, δ15No is δ15N-NOx
value that vehicle-emitted NOx reaches as NOx emissionsapproach zero, and ε is the enrichment factor for δ15N as theconcentration of NOx decreases. The enrichment factor (ε) isrelated to the fractionation factor (α) of the reduction of NOxby the relationship represented as
ε α= − ×(‰) ( 1) 1000 (7)
From Figure 3, the enrichment factor (ε) for the production ofvehicle-emitted NOx was calculated for gasoline- and diesel-powered engines to be 5.2(±0.3)‰ and 6.13(±0.8)‰,respectively. This indicates that as the engine and catalyticconverter warm up, the lighter molecules of NOx arepreferentially decomposed, leaving the emitted NOx enrichedin 15N compared to atmospheric air. This suggests that vehicle-emitted NOx has likely become enriched in the 15N isotoperelative to the vehicle-emitted NOx produced prior to 1975because of the advent of the 3-way catalytic converter.Implications for δ15N-NOx. The data obtained from this
study are limited and do not represent the δ15N-NOx emittedfrom all types of vehicles, but they are useful for δ15N-NOxsource characterization of vehicle exhaust. In this study, wemeasured a rather large range of δ15N-NOx for individualsamples, ranging from −15.1 to 10.5‰ for gasoline-poweredvehicles and −23.3 to −15.9‰ for diesel-powered vehicles. Ingeneral, the lowest δ15N-NOx values came from cold-startvehicles that were emitting high concentrations of NOx. Aspreviously mentioned, approximately 60−80% of the totalemissions for a typical vehicle occur during the first 200 s ofcold-start operation.35 Therefore, in order to estimate the mass-weighted δ15N-NOx emitted from vehicles, the mass balance ofthe emitted NOx concentration needs to be accounted for. To
this end, a model was constructed on the basis of numericalintegration methods to relate the concentration of emitted NOx(Figure 2) as a function of vehicle run time with theinstantaneous vehicle-emitted δ15N-NOx for gasoline-poweredvehicles. Specific details on the construction of this model canbe found in the Supporting Information. This model predictsthe mass-weighted δ15N-NOx emitted from vehicles to have thefollowing relationship with vehicle run time represented as
= − + +y t12.35 3.02 ln( 0.455) (8)
where y is the mass-weighted δ15N-NOx(‰) emitted fromvehicles and t is vehicle run time (min). This model shows theimportance of NOx mass-balance to the overall δ15N-NOx.Because NOx emissions are highest and are lowest in 15Nduring the cold-start period, this will lower the overall emittedδ15N-NOx from vehicles. A similar type of analysis was notcarried out for diesel-powered engines because of the smallsample size measured in this study (n = 3).The average commute time varies regionally in the USA,56
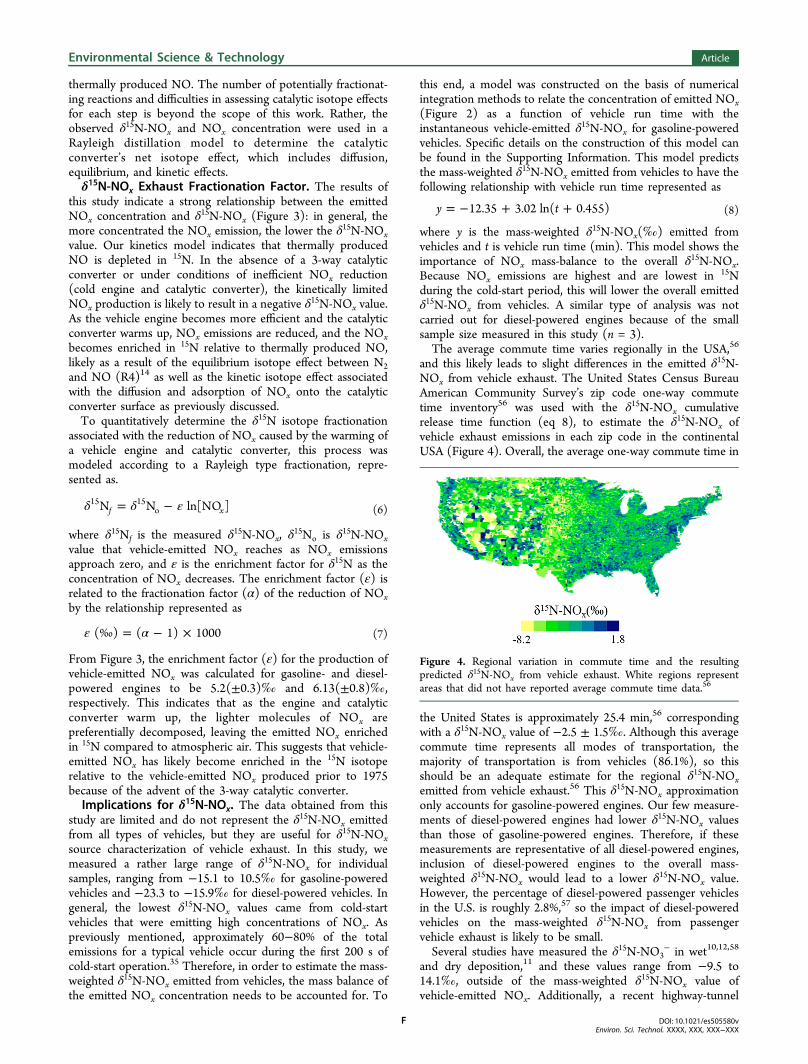
and this likely leads to slight differences in the emitted δ15N-NOx from vehicle exhaust. The United States Census BureauAmerican Community Survey’s zip code one-way commutetime inventory56 was used with the δ15N-NOx cumulativerelease time function (eq 8), to estimate the δ15N-NOx ofvehicle exhaust emissions in each zip code in the continentalUSA (Figure 4). Overall, the average one-way commute time in
the United States is approximately 25.4 min,56 correspondingwith a δ15N-NOx value of −2.5 ± 1.5‰. Although this averagecommute time represents all modes of transportation, themajority of transportation is from vehicles (86.1%), so thisshould be an adequate estimate for the regional δ15N-NOxemitted from vehicle exhaust.56 This δ15N-NOx approximationonly accounts for gasoline-powered engines. Our few measure-ments of diesel-powered engines had lower δ15N-NOx valuesthan those of gasoline-powered engines. Therefore, if thesemeasurements are representative of all diesel-powered engines,inclusion of diesel-powered engines to the overall mass-weighted δ15N-NOx would lead to a lower δ15N-NOx value.However, the percentage of diesel-powered passenger vehiclesin the U.S. is roughly 2.8%,57 so the impact of diesel-poweredvehicles on the mass-weighted δ15N-NOx from passengervehicle exhaust is likely to be small.Several studies have measured the δ15N-NO3
− in wet10,12,58
and dry deposition,11 and these values range from −9.5 to14.1‰, outside of the mass-weighted δ15N-NOx value ofvehicle-emitted NOx. Additionally, a recent highway-tunnel
Figure 4. Regional variation in commute time and the resultingpredicted δ15N-NOx from vehicle exhaust. White regions representareas that did not have reported average commute time data.56
Environmental Science & Technology Article
DOI: 10.1021/es505580vEnviron. Sci. Technol. XXXX, XXX, XXX−XXX
F
δ15N-NO2 study measured δ15N values that ranged from 10.2 to17‰,21 which is higher than the majority of the δ15N-NOxmeasurements made in this study. This discrepancy in δ15N-NOx of vehicle-emitted NOx and of δ15N-NO3
− deposition andδ15N-NO2 roadside studies are likely explained either byequilibrium13 and/or kinetic isotope effects12 that slightly alterthe δ15N of the original NOx source or by the contribution ofother NOx sources with different δ15N-NOx values (Figure 1).The exact causation of the alteration of δ15N is beyond thescope of this work; however, if the δ15N of atmospheric NO3
−
is controlled by the source δ15N-NOx, then Figure 4 suggeststhat (1) there will be spatial variations in the δ15N of NO3
− tiedto commute time and vehicle NOx mitigation efficiency, (2)there would be temporal variations in δ15N of NO3
− related tothe transition from nonvehicle to vehicle NOx productionduring the day and week, and (3) the δ15N of atmosphericNO3
− produced between 1950 and 1975 should be significantlylower relative to NO3
− produced after 1980, which should bedetectable in the northern hemisphere ice core record.19,59
The continual improvements of the 3-way catalytic converterwill likely have a future impact on δ15N-NOx values. Oncecatalytic converters are warmed up, they are up to 97% effectiveat reducing toxic gas emissions.47,60 However, these highconversion rates are only achieved when the converter is at atemperature of (typically) 300 °C or greater, which can takeseveral minutes to achieve.60 This results in more than 60−80%of total emissions occurring during cold-start emissions.61
Decreasing these cold-start emissions is the objective of futurecatalytic converter improvements.62 As these technologicaladvancements become commonplace for catalytic-converter-equipped vehicles, it will likely lead to an increase of the δ15N-NOx value relative to the current value because of thefractionation factor associated with the catalytic reduction ofNOx.
■ ASSOCIATED CONTENT
*S Supporting InformationAppendix table and mass-weighted δ15N-NOx emission model.This material is available free of charge via the Internet athttp://pubs.acs.org.
■ AUTHOR INFORMATION
Corresponding Author* E-mail: [email protected]. Phone: (765)-496-4906. Fax:(765)-496-1210.
FundingThis material is based upon work supported by the NationalScience Foundation Graduate Research Fellowship, under grantno. DGE-1333468. Any opinion, findings, and conclusions orrecommendations expressed in this material are those of theauthors and do not necessarily reflect the views of the NationalScience Foundation.
NotesThe authors declare no competing financial interest.
■ REFERENCES(1) Solomon, S., Qin, D., Manning, M., Chen, Z., Marquis, M.,Averyt, K. B., Tignor, M., Miller, H. L., Eds. Climate change 2007: Thephysical science basis: contribution of Working Group I to the FourthAssessment Report of the Intergovernmental Panel on Climate Change;Cambridge University Press: New York, 2007.
(2) Lawrence, M. G.; Crutzen, P. J. Influence of NOx emissions fromships on tropospheric photochemistry and climate. Nature 1999, 402,167−170.(3) Crutzen, P. J. The role of NO and NO2 in the chemistry of thetroposphere and stratosphere. Annu. Rev. Earth Planet. Sci. 1979, 7,443−472.(4) Atkinson, R. Atmospheric chemistry of VOCs and NOx. Atmos.Environ. 2000, 34, 2063−2101.(5) Atkinson, R.; Arey, J. Gas-phase tropospheric chemistry ofbiogenic volatile organic compounds: A review. Atmos. Environ. 2003,37, 197−219.(6) Galloway, J. N.; Dentener, F.; Capone, D.; Cleveland, C.; Green,P.; Holland, E.; Karl, D.; Michaels, A.; Porter, J.; Townsend, A.;Vorosmarty, C. Nitrogen cycles: past, present, and future.Biogeochemistry 2004, 70, 153−226.(7) Reis, S.; Pinder, R. W.; Zhang, M.; Lijie, G.; Sutton, M. A.Reactive nitrogen in atmospheric emission inventories. Atmos. Chem.Phys. 2009, 9, 7657−7677.(8) Jaegle, L.; Steinberger, L.; Martin, R. V.; Chance, K. Globalpartitioning of NOx sources using satellite observations: Relative rolesof fossil fuel combustion, biomass burning and soil emissions. FaradayDiscuss. 2005, 130, 407−423.(9) Melillo, J. M.; Cowling, E. B. Reactive Nitrogen and PublicPolicies for Environmental Protection. Ambio 2002, 31, 150−158.(10) Elliott, E. M.; Kendall, C.; Wankel, S. D.; Burns, D. A.; Boyer, E.W.; Harlin, K.; Bain, D. J.; Butler, T. J. Nitrogen isotopes as indicatorsof NOx source contributions to atmospheric nitrate deposition acrossthe Midwestern and Northeastern United States. Environ. Sci. Technol.2007, 41, 7661−7667.(11) Elliott, E. M.; Kendall, C.; Boyer, E. W.; Burns, D. A.; Lear, G.;Golden, H. E.; Harlin, K.; Bytnerowicz, A.; Butler, T. J.; Glatz, R. Dualnitrate isotopes in actively and passively collected dry deposition:Utility for portioning NOx sources, understanding reaction pathways,and comparison with isotopes in wet nitrate deposition. J. Geophys.Res.: Biogeosci. 2009, 114, G04020.(12) Freyer, H. D. Seasonal trends of NH4
+ and NO3− nitrogen
isotope composition in rain collected in Julich, West Germany. Tellus1978, 30, 83−92.(13) Freyer, H. D.; Kley, D.; Volz-Thomas, A.; Kobel, K. On theinteraction of isotopic exchange processes with photochemicalreactions in atmospheric oxides of nitrogen. J. Geophys. Res.: Atmos.1993, 98, 14791−14796.(14) Heaton, T. H. E. 15N/14N ratios of NOx from vehicle enginesand coal-fired power 770 stations. Tellus 1990, 42B, 304−307.(15) Ammann, M.; Siegwolf, R.; Pichlmayer, F.; Suter, M.; Brunold,C. Estimating the uptake of traffic-derived NO2 from
15N abundancein Norway spruce needles. Oecologia 1999, 188, 124−131.(16) Moore, H. The isotopic composition of ammonia, nitrogendioxide, and nitrate in the atmosphere. Atmos. Environ. 1977, 11,1230−1243.(17) Pearson, J.; Wells, D.; Seller, K.; Bennett, A.; Soares, A.;Woodall, J.; Ingrouille, M. Traffic exposure increases natural 15N andheavy metal concentrations in mosses. New Phtol. 2000, 147, 317−326.(18) Redling, K.; Elliott, E.; Bain, D.; Sherwell, J. Highwaycontributions to reactive nitrogen deposition: tracing the fate ofvehicular NOx using stable isotopes and plant biomonitors.Biogeochemistry 2013, 116, 261−274.(19) Hastings, M. G.; Jarvis, J. C.; Steig, E. J. Anthropogenic impactson nitrogen isotopes of ice-core nitrate. Science 2009, 324, 1288.(20) Felix, J. D.; Elliot, E. M.; Shaw, S. L. Nitrogen isotopiccomposition of coal-fired power plant NOx: influence of emissioncontrols and implications for global emission inventories. Environ. Sci.Technol. 2012, 46, 3528−3535.(21) Felix, J. D.; Elliott, E. M. Isotopic composition of passivelycollected nitrogen dioxide emissions: Vehicle, soil, and livestock sourcesignatures. Atmos. Environ. 2014, 92, 359−366.
Environmental Science & Technology Article
DOI: 10.1021/es505580vEnviron. Sci. Technol. XXXX, XXX, XXX−XXX
G
(22) Li, D.; Wang, X. Nitrogen isotopic signature of soil-releasednitric oxide (NO) after fertilizer application. Atmos. Environ. 2008, 42,4747−4754.(23) Heaton, T. H. E. 15N/14N ratios of nitrate and ammonium inrain at Pretoria, South Africa. Atmos. Environ. 1987, 21, 843−852.(24) Savard, M. M.; Begin, C.; Smirnoff, A. Tree-ring nitrogenisotopes reflect anthropogenic NOx emissions and climatic effects.Environ. Sci. Technol. 2009, 43, 604−609.(25) Jennings, S. G. The mean free path in air. J. Aerosol Sci. 1988, 19,159−166.(26) Massman, W. J. A review of the molecular diffusivities of H2O,CO2, CH4, CO, O3, SO2, NH3, N2O, NO and NO2 in air, O2, and N2
near STP. Atmos. Environ. 1998, 32, 1111−1127.(27) Heeb, N. V.; Saxer, C. J.; Forss, A.; Bruhlmann, S. Trends ofNO−, NO2
−, and NH3− emissions from gasoline-fueled Euro-3 to
Euro-4 passenger cars. Atmos. Environ. 2008, 42, 2543−2554.(28) Sigman, D. M.; Casciotti, K. L.; Andreani, M.; Barford, D.;Galanter, M.; Bohlke, J. K. A bacterial method for the nitrogen isotopicanalysis of nitrate in seawater and freshwater. Anal. Chem. 2001, 73,4145−4153.(29) Crawley, L. R. Nitrogen and oxygen isotope-ratio analysis ofnitrate by the denitrifier method using continuous flow isotope-ratiomass spectrometery. Masters Dissertation, Purdue University, WestLafayette, IN, 2010.(30) Dunne, S. R.; Raymond A. R. Use of a molecular sieve bed tominimize emissions during cold start of internal combustion engines.U.S. Patent 5,051,244, September 24, 1991.(31) Yang, B. L.; Harold, H. K. Reactor trap to remove hydrocarbonsfrom engine exhaust during cold start. Environ. Sci. Technol. 1994, 28,1561−1564.(32) Leclerc, J. P.; Schweich, D. Modeling Catalytic Monoliths forAutomobile Emission Control. In Chemical Reactor Technology forEnvironmentally Safe Reactors and Products. de Lasa, H. I., Dogu, G.,Ravella, A., Eds.; Kluwer Academic Publishers: Dordrecht, TheNetherlands, 1993; p 547.(33) Pulkrabek, W. W. Engineering fundamentals of the internalcombustion engine; Pearson Prentice Hall: Upper Saddle River, NJ,2014.(34) Hayes, R. E.; Mukadi, L. S.; Votsmeier, M.; Gieshoff, J. Three-way catalytic converter modelling with detailed kinetics and washcoatdiffusion. Top. Catal. 2004, 30, 411−415.(35) Koltsakis, G. C.; Stamatelos, A. M. Catalytic AutomotiveExhaust Aftertreatment. Prog. Energy Combust. Sci. 1997, 23, 1−39.(36) Zeldovich, J. The oxidation of nitrogen in combustion andexplosions. Acta Physiochim. URSS 1946, 11, 577−628.(37) Richet, P.; Bottinga, Y.; Janoy, M. A review of hydrogen, carbon,nitrogen, oxygen, sulphur, and chlorine stable isotope enrichmentamong gaseous molecules. Annu. Rev. Earth Planet. Sci. 1977, 5, 65−110.(38) Huber, K. P.; Herzberg, G. Molecular Spectra and MolecularStructure Vol. IV. Constants of Diatomic Molecules; Van NostrandReinhold: New York, 1979.(39) Ianni, J. C. Kintecus, Windows version 5.20, 2014. www.kintecus.com.(40) Thielen, K.; Roth, P. N atom measurements in high-temperatureN2 dissociation kinetics. AIAA J. 1986, 24, 1102−1105.(41) Tsang, W.; Hampson, R. F. Chemical kinetic data base forcombustion chemistry. Part I. Methane and related compounds. J.Phys. Chem. Ref. Data 1986, 15, 1087−1279.(42) Baulch, D. L.; Cobos, C. J.; Cox, R. A.; Frank, P.; Hayman, G.;Just, T.; Kerr, J. A.; Murrells, T.; Pilling, M. J.; Troe, J.; Walker, R. W.;Warnatz, J. Evaluated kinetic data for combustion modeling.Supplement I. J. Phys. Chem. Ref. Data 1994, 23, 847−848.(43) Atkinson, R.; Baulch, D. L.; Cox, R. A.; Hampson, R. F.; Kerr, J.A.; Troe, J. Evaluated kinetic and photochemical data for atmosphericchemistry: Supplement III. IUPAC subcommittee on gas kinetic dataevaluation for atmospheric chemistry. J. Phys. Chem. Ref. Data 1989,18, 881−1097.
(44) Manion, J. A. ; Huie, R. E.; Levin, R. D.; Burgess, D. R.; Orkin,V. L.; Tsang, W.; McGivern, W. S.; Hudgens, J. W.; Knyazev, V. D.;Atkinson, D. B.; Chai, E.; Tereza, A. M.; Lin, C. Y.; Allison, T. C.;Mallard, W. G. ; Westley, F.; Herron, J. T.; Hampson, R. F.; andFrizzell, D. H. NIST Chemical Kinetics Database, Standard ReferenceDatabase 17, version 7.0 (web version, release 1.6.8, data version2013.03); National Institute of Standards and Technology, Gaithers-burg, MD. http://kinetics.nist.gov.(45) Shimanouchi, T. Tables of Molecular Vibrational Frequencies,Consolidated Volume 1; National Standard Reference Data Series,National Bureau of Standards Publication 39; United States Depart-ment of Commerce: Washington, DC, 1972.(46) Iserman, R. Engine Modeling and Control: Modeling and electronicmanagement of internal combustion engines. Springer: New York, NY,2014.(47) Taylor, K. C. Nitric Oxide Catalysis in Automotive ExhaustSystems. Catal. Rev.: Sci. Eng. 1993, 35, 457−481.(48) Arai, H.; Tominaga, H. An infrared study of nitric oxide onrhodium-alumina catalyst. J. Catal. 1976, 43, 131−142.(49) Solymosi, F.; Sarkany, J. An infrared study of the surfaceinteraction between NO and CO on Rh/Al2O3 catalyst. Appl. Surf. Sci.1979, 3, 68−82.(50) Hecker, W. C.; Bell, A. T. Reduction of NO by CO over silica-supported rhodium: Infrared and kinetic studies. J. Catal. 1983, 84,200−215.(51) Campbell, C. T.; White, J. M. Chemisorption and reactions ofnitric oxide on rhodium. Appl. Surf. Sci. 1978, 1, 347−359.(52) Chin, A. A.; Bell, A. T. Kinetics of nitric oxide decomposition onsilica-supported rhodium. J. Phys. Chem. 1983, 87, 3700−3706.(53) Baird, R. J.; Ku, R. C.; Wynblatt, P. The chemisorption of COand NO on Rh(110). Surf. Sci. 1980, 97, 346−362.(54) Root, T. W.; Schmidt, L. D.; Fisher, G. B. Adsorption andreaction of nitric oxide and oxygen on Rh(111). Surf. Sci. 1983, 134,30−45.(55) Mukadi, L. S.; Hayes, R. E. Modelling the three-way catalyticconverter with mechanistic kinetics using the Newton−Krylov methodon a parallel computer. Comput. Chem. Eng. 2002, 26, 439−455.(56) U.S. Census Bureau; 2007−2011 American Community Survey,2011 American Community Survey 5-Year Estimate, travel time to workby zip code, table B08303. http://factfinder2.census.gov (accessed onOctober 30, 2014).(57) U.S. diesel and hybrid passenger vehicle registration data (2010−13); Diesel Technology Forum: Frederick, MD, 2014. http://www.d i e s e l f o rum .o r g/fi l e s /dmfi l e /D i e s e lTechno logyFo rum-2014LightDutyTopTenLists.pdf (accessed on January 15, 2014).(58) Garten, C. T. Nitrogen isotope composition of ammonium andnitrate in bulk precipitation and forest throughfall. Int. J. Environ. Anal.Chem. 1992, 47, 33−45.(59) Geng, L.; Alexander, B.; Cole-Dai, J.; Steig, E. J.; Savarino, J.;Sofen, E. D.; Schauer, A. J. Nitrogen isotopes in ice core nitrate linkedto anthropogenic acidity change. Proc. Natl. Acad. Sci. U.S.A. 2014,111, 5808−5812.(60) Burch, S. D.; Keyser, M. A.; Colucci, C. P.; Potter, T. F.;Benson, D. K.; Biel, J. P. Applications and benefits of catalytic converterthermal management. Technical paper no. 961134 for the Society ofAutomotive Engineers Fuels & Lubricants Spring Meeting: Dearborn,MI, 1996. DOI: 10.4271/961134.(61) Laing, P. M. Development of an alternator-powered electrically-heated catalyst system. Technical paper no. 941042 for the Society ofAutomotive Engineers International Congress & Exposition: Detroit,MI, 1994. DOI: 10.4271/941042.(62) Burk, P. L.; Hochmuth, J. K.; Anderson, D. R.; Sung, S.; Tauster,S. J.; Tolentino, C. O.; Rogalo, J.; Miles, G.; Niejako, M.; Punke, A.;Dahle, U. Cold start hydrocarbon emissions control. Technical paper no.950410 for the Society of Automotive Engineers InternationalCongress & Exposition: Detroit, MI, 1995. DOI: 10.4271/950410.
Environmental Science & Technology Article
DOI: 10.1021/es505580vEnviron. Sci. Technol. XXXX, XXX, XXX−XXX
H