New York State is divided into 17 major watersheds, or · PDF fileBloody Brook • •...
41
Transcript of New York State is divided into 17 major watersheds, or · PDF fileBloody Brook • •...


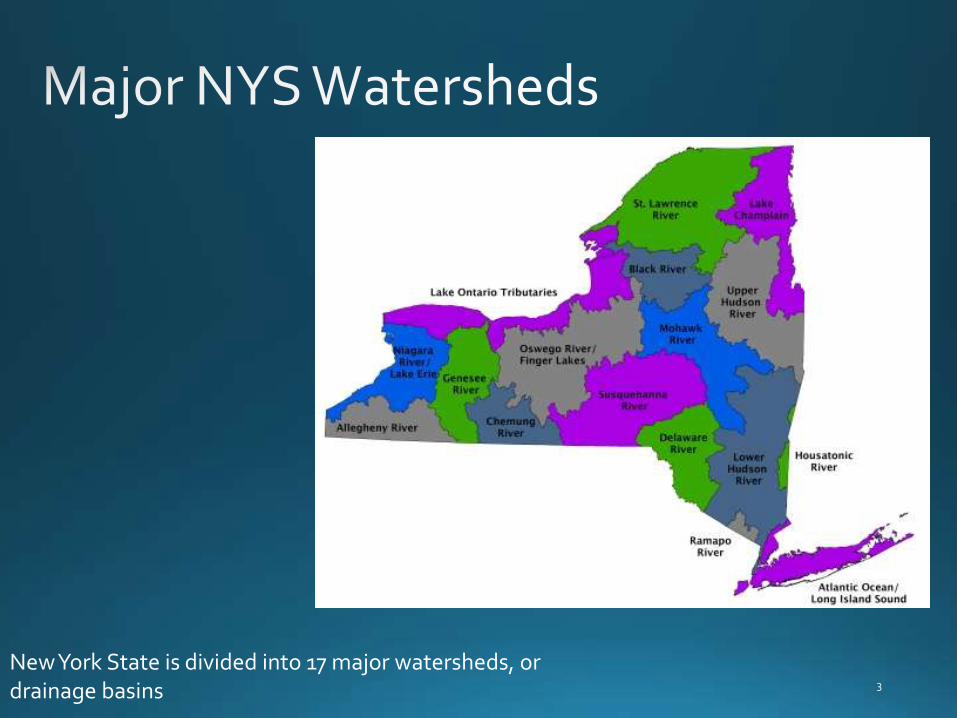
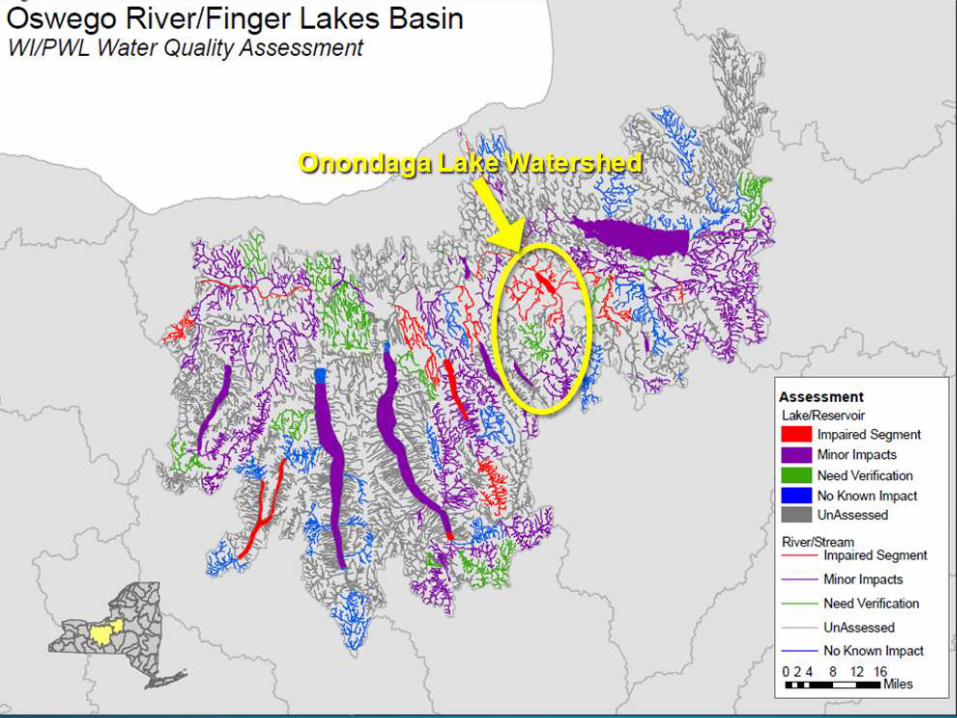
New York State is divided into 17 major watersheds, or drainage basins
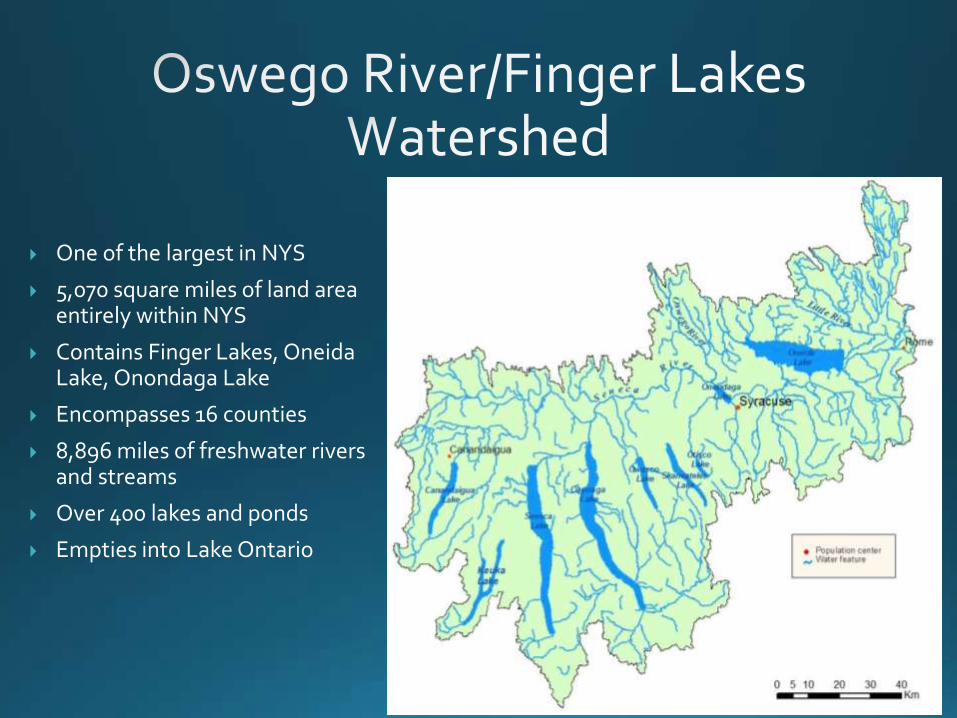
One of the largest in NYS
5,070 square miles of land area entirely within NYS
Contains Finger Lakes, Oneida Lake, Onondaga Lake
Encompasses 16 counties
8,896 miles of freshwater rivers and streams
Over 400 lakes and ponds
Empties into Lake Ontario
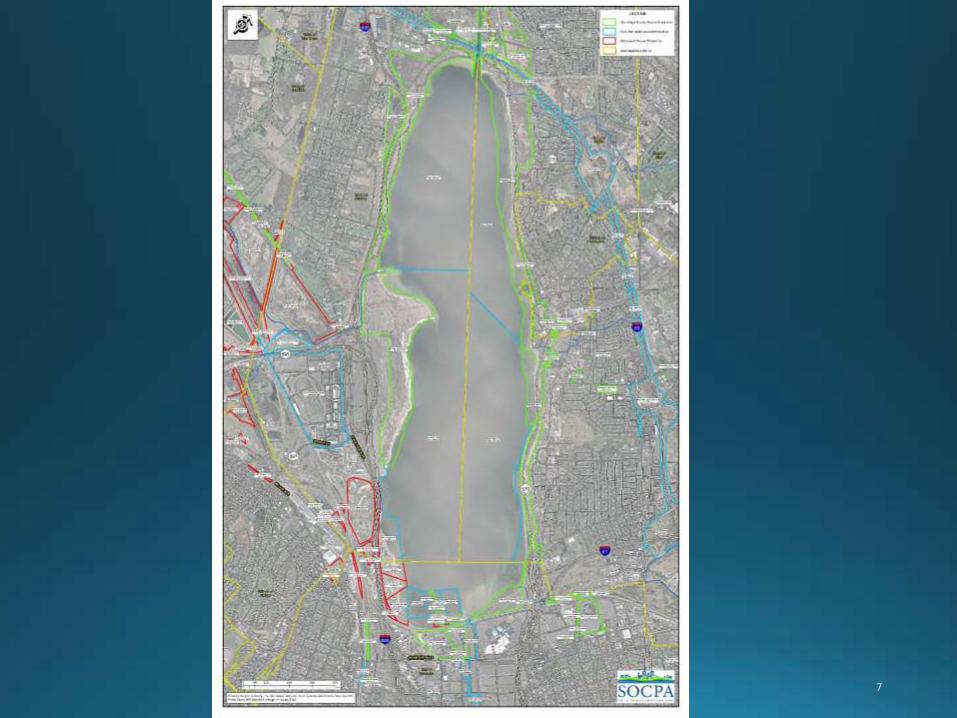

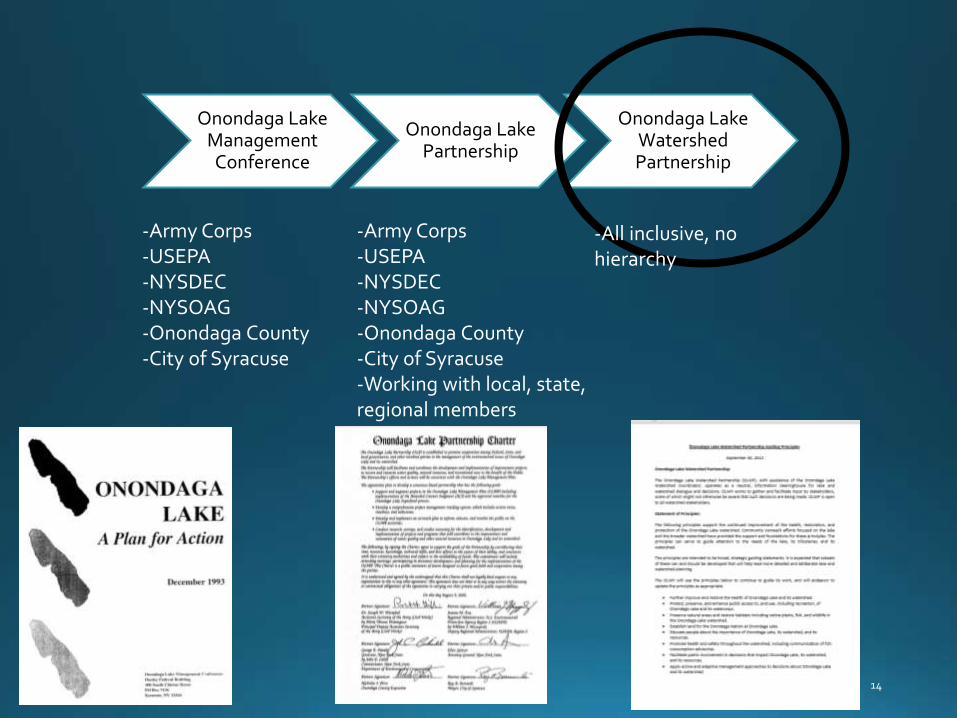
Onondaga Lake Management Conference
Onondaga Lake Partnership
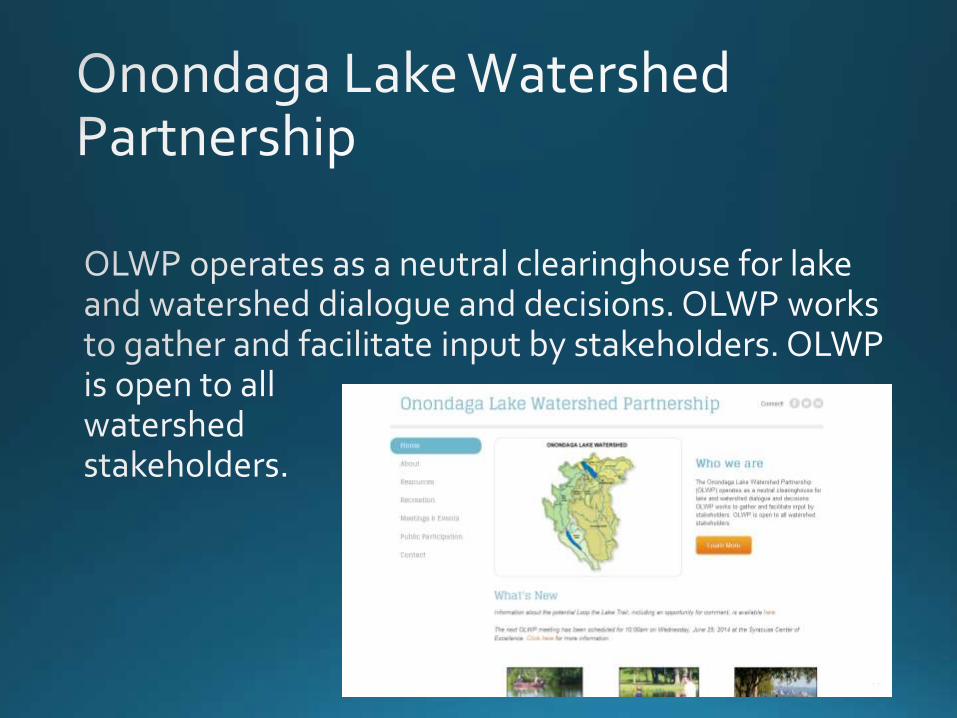
Onondaga Lake Watershed Partnership
-Army Corps -USEPA -NYSDEC -NYSOAG -Onondaga County -City of Syracuse
-Army Corps -USEPA -NYSDEC -NYSOAG -Onondaga County -City of Syracuse -Working with local, state, regional members
-All inclusive, no hierarchy

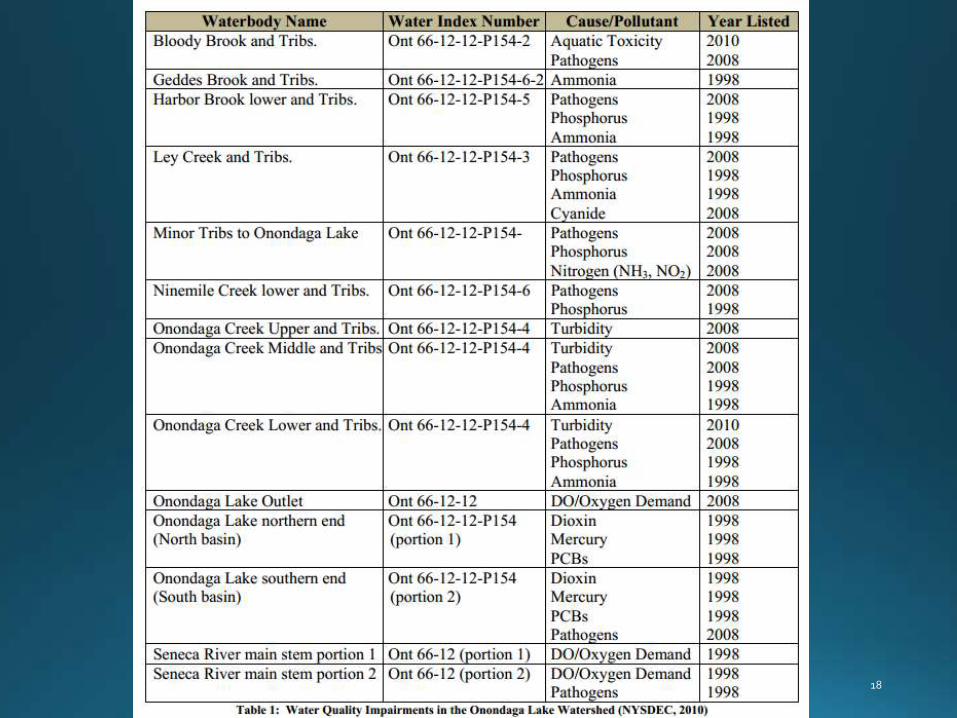
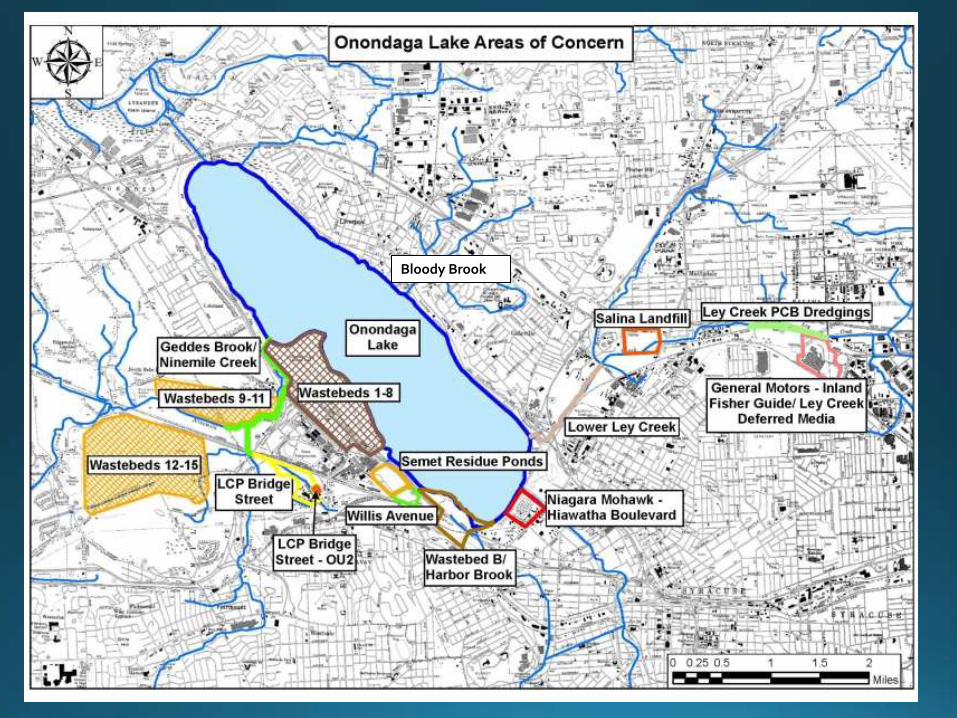
Bloody Brook
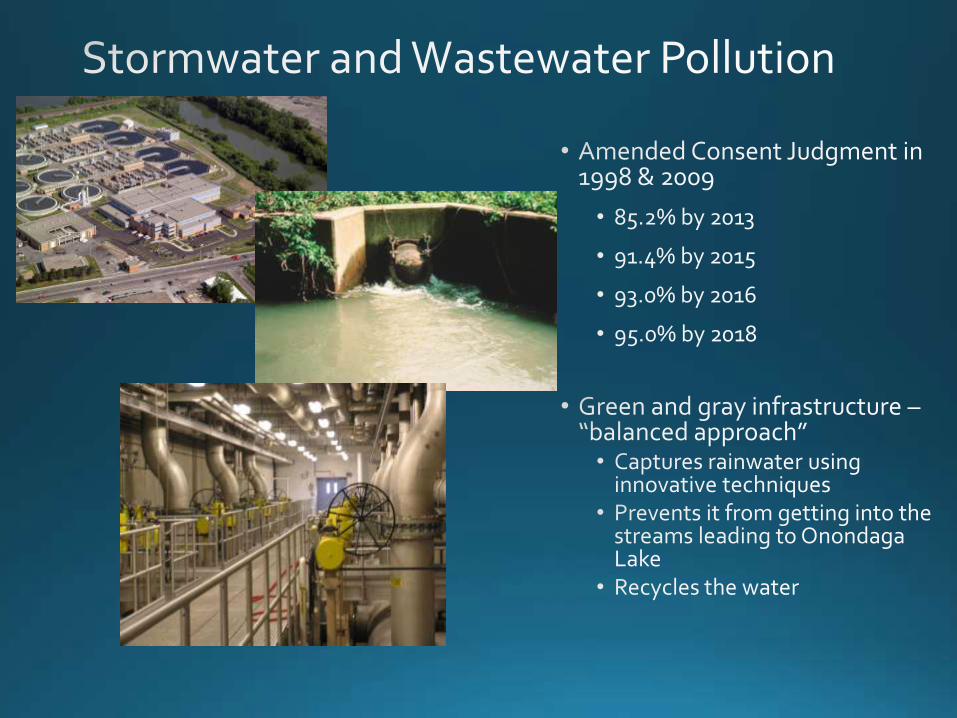
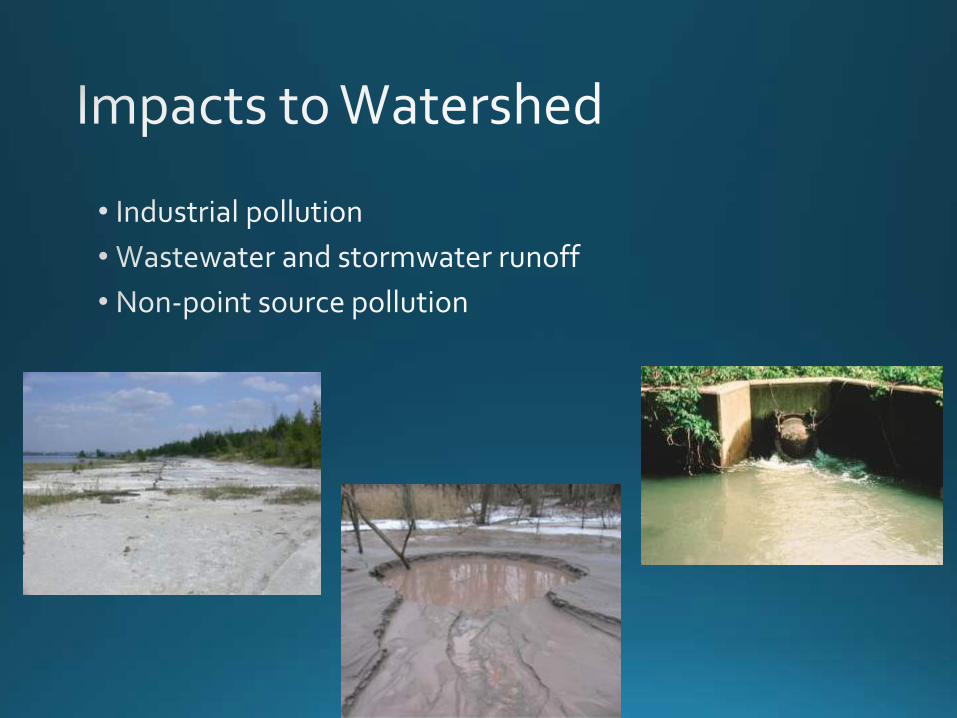
•
•
•
•

0
20
40
60
80
100
120
140
90 92 94 96 98 00 02 04 06 08 10 12
To
tal P
ho
sph
oru
s (µ
g/L
)
Year
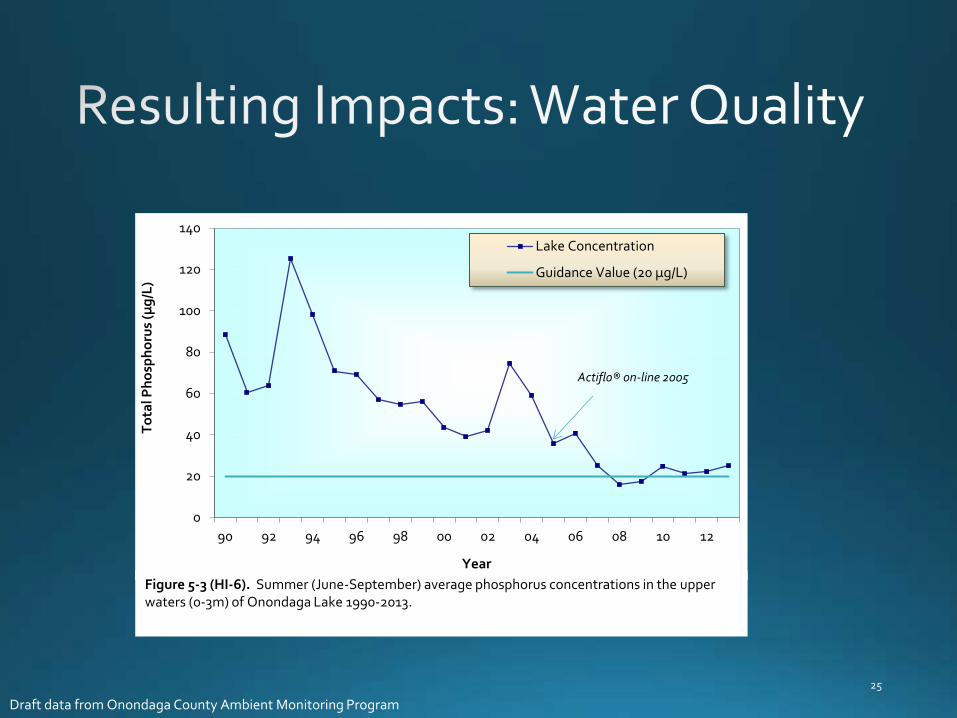
Lake Concentration
Guidance Value (20 µg/L)
Actiflo® on-line 2005
Figure 5-3 (HI-6). Summer (June-September) average phosphorus concentrations in the upper waters (0-3m) of Onondaga Lake 1990-2013.
Draft data from Onondaga County Ambient Monitoring Program
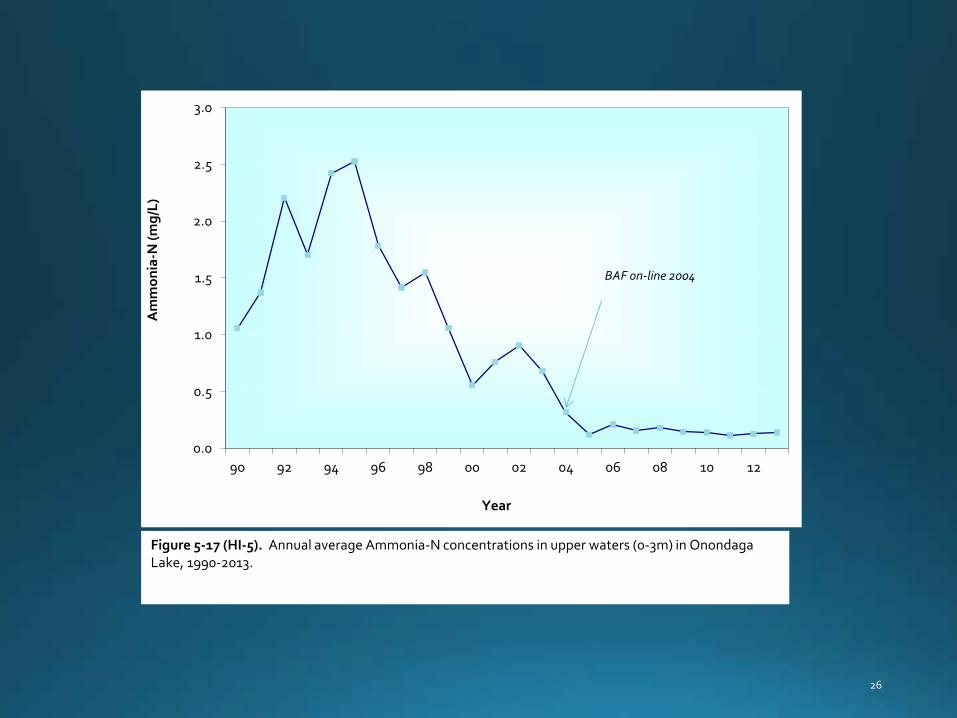
0.0
0.5
1.0
1.5
2.0
2.5
3.0
90 92 94 96 98 00 02 04 06 08 10 12
Am
mo
nia
-N (
mg
/L)
Year
BAF on-line 2004
Figure 5-17 (HI-5). Annual average Ammonia-N concentrations in upper waters (0-3m) in Onondaga Lake, 1990-2013.
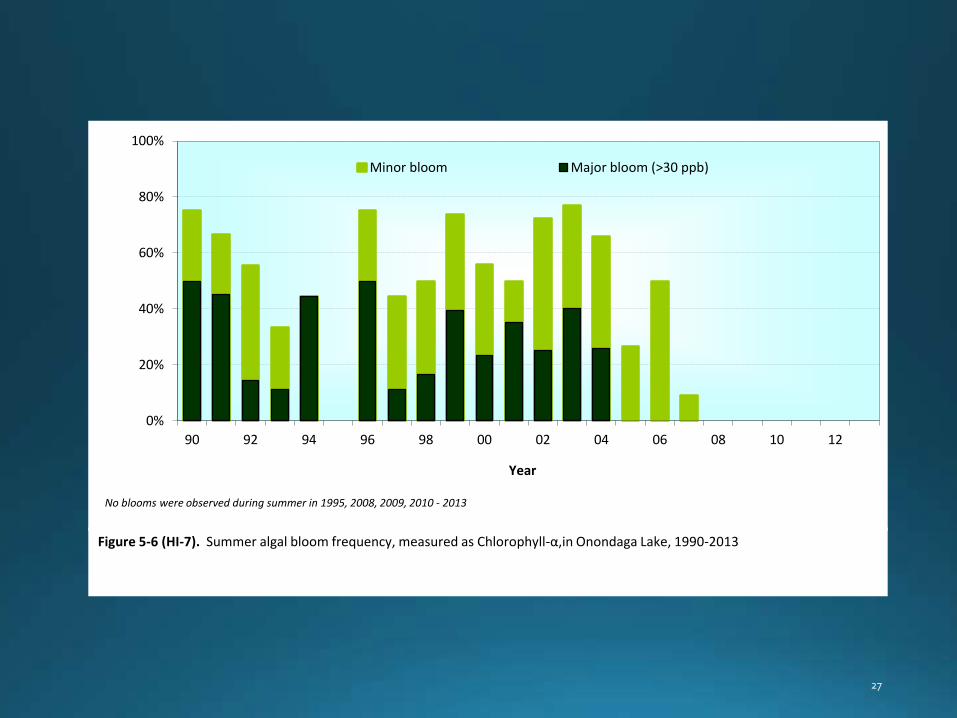
0%
20%
40%
60%
80%
100%
90 92 94 96 98 00 02 04 06 08 10 12
Year
Minor bloom Major bloom (>30 ppb)
No blooms were observed during summer in 1995, 2008, 2009, 2010 - 2013
Figure 5-6 (HI-7). Summer algal bloom frequency, measured as Chlorophyll-α,in Onondaga Lake, 1990-2013
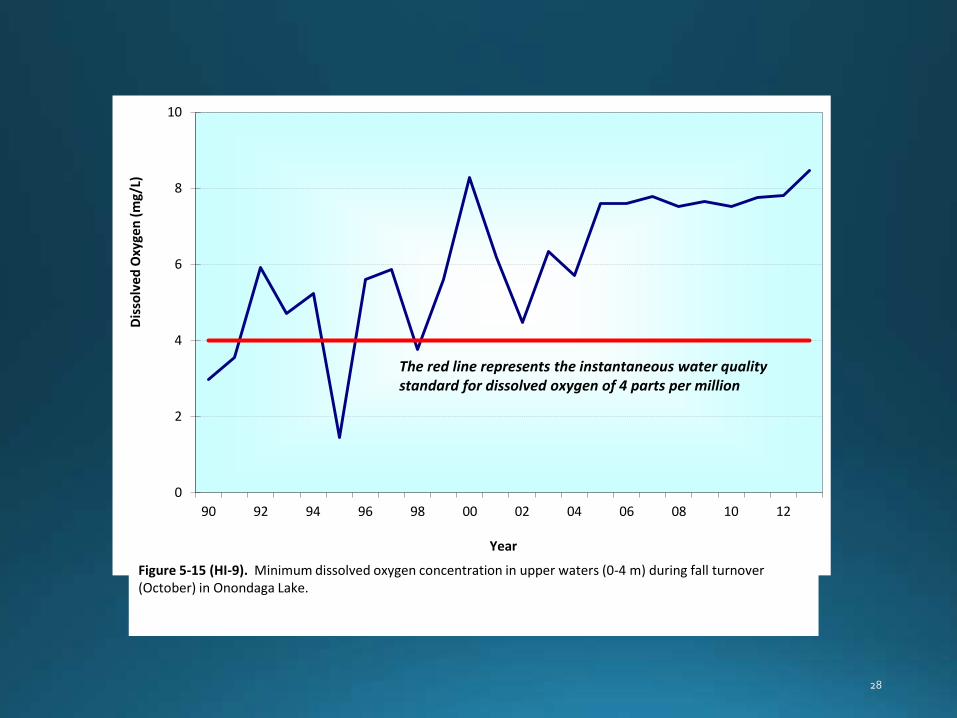
0
2
4
6
8
10
90 92 94 96 98 00 02 04 06 08 10 12
Dis
solv
ed
Oxy
gen
(m
g/L)
Year
The red line represents the instantaneous water quality standard for dissolved oxygen of 4 parts per million
Figure 5-15 (HI-9). Minimum dissolved oxygen concentration in upper waters (0-4 m) during fall turnover (October) in Onondaga Lake.
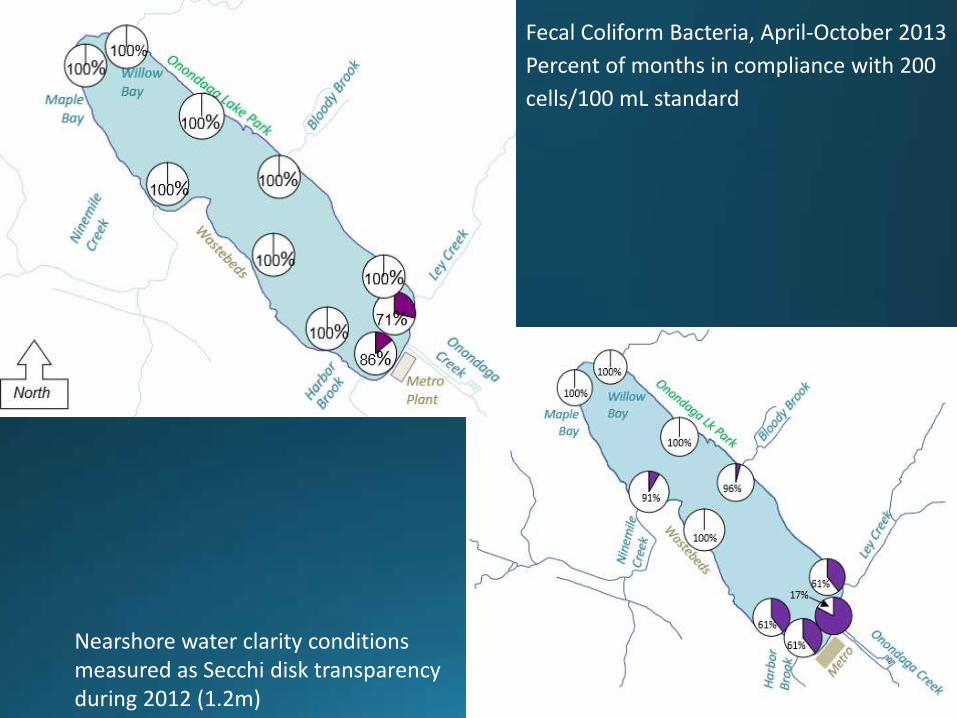
Nearshore water clarity conditions measured as Secchi disk transparency during 2012 (1.2m)
Fecal Coliform Bacteria, April-October 2013
Percent of months in compliance with 200
cells/100 mL standard
Year
1970 1980 1990 2000 2010
Me
rcury
(g/g
ww
)
0.0
0.5
1.0
1.5
2.0
2.5
3.0
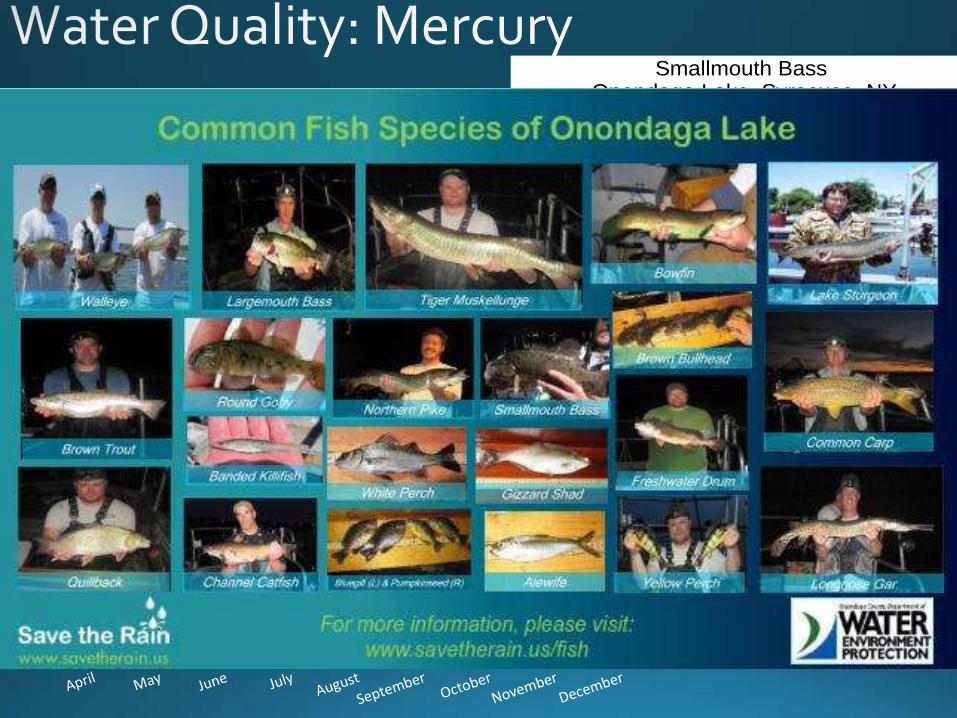
Smallmouth Bass Onondaga Lake, Syracuse, NY
0.00
0.50
1.00
1.50
2.00
2.50
Me
thy
lme
rcu
ry (
ng
/L)
Methylmercury Concentrations in Epilimnion, 1992 - 2009
1992
1999
2006
2007
2008
2009
Fish Men Over 15 & Women Over 50
Women Under 50 & Children Under 15
Walleye DON'T EAT DON'T EAT
Largemouth bass, Smallmouth bass
Greater than 15", DON'T EAT; Less than 15", up to 1 meal/month DON'T EAT
Carp, Channel catfish, White perch DON'T EAT DON'T EAT
Brown bullhead, pumpkin seed Up to 4 meals/month DON'T EAT
All other fish Up to 1 meal/month DON'T EAT


Questions?
Aimee Clinkhammer
NEIWPCC Environmental Analyst;
Onondaga Lake Watershed Coordinator
315-426-7507
www.olwp.org


![Notes on Maxwell & Delaney PSYCH 710 Multiple Comparisons · [1] "C 4: F=9.823, t=3.134, p=0.005, psi=11.944, CI=(5.620,18.269), adj.CI= (1.485,22.403)" Notice that I divided the](https://static.fdocument.org/doc/165x107/5f36dd51e181c47b74575aa9/notes-on-maxwell-delaney-psych-710-multiple-comparisons-1-c-4-f9823.jpg)