Nano-thin walled micro-compartments from transmembrane ...
13
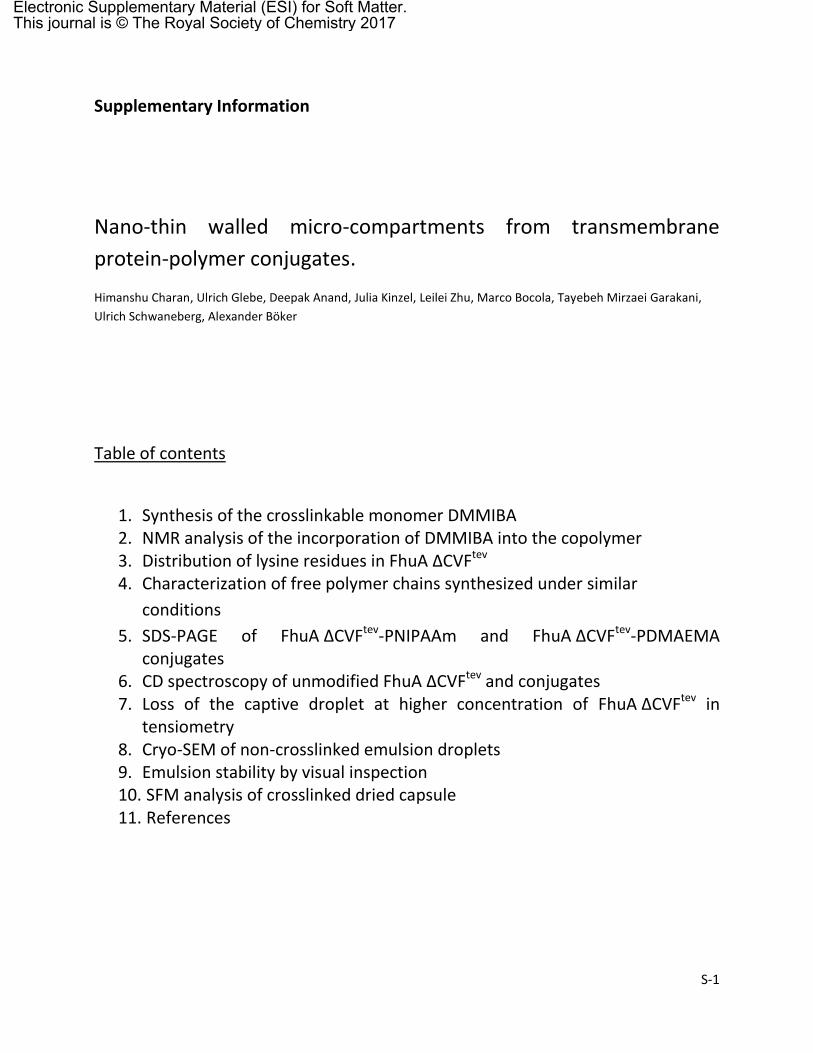
S-1 Supplementary Information Nano-thin walled micro-compartments from transmembrane protein-polymer conjugates. Himanshu Charan, Ulrich Glebe, Deepak Anand, Julia Kinzel, Leilei Zhu, Marco Bocola, Tayebeh Mirzaei Garakani, Ulrich Schwaneberg, Alexander Böker Table of contents 1. Synthesis of the crosslinkable monomer DMMIBA 2. NMR analysis of the incorporation of DMMIBA into the copolymer 3. Distribution of lysine residues in FhuA ΔCVF tev 4. Characterization of free polymer chains synthesized under similar conditions 5. SDS-PAGE of FhuA ΔCVF tev -PNIPAAm and FhuA ΔCVF tev -PDMAEMA conjugates 6. CD spectroscopy of unmodified FhuA ΔCVF tev and conjugates 7. Loss of the captive droplet at higher concentration of FhuA ΔCVF tev in tensiometry 8. Cryo-SEM of non-crosslinked emulsion droplets 9. Emulsion stability by visual inspection 10. SFM analysis of crosslinked dried capsule 11. References Electronic Supplementary Material (ESI) for Soft Matter. This journal is © The Royal Society of Chemistry 2017
Transcript of Nano-thin walled micro-compartments from transmembrane ...
S-1
Supplementary Information
Nano-thin walled micro-compartments from transmembrane
protein-polymer conjugates.
Himanshu Charan, Ulrich Glebe, Deepak Anand, Julia Kinzel, Leilei Zhu, Marco Bocola, Tayebeh Mirzaei Garakani,
Ulrich Schwaneberg, Alexander Böker
Table of contents
1. Synthesis of the crosslinkable monomer DMMIBA 2. NMR analysis of the incorporation of DMMIBA into the copolymer 3. Distribution of lysine residues in FhuA ΔCVFtev 4. Characterization of free polymer chains synthesized under similar
conditions
5. SDS-PAGE of FhuA ΔCVFtev-PNIPAAm and FhuA ΔCVFtev-PDMAEMA conjugates
6. CD spectroscopy of unmodified FhuA ΔCVFtev and conjugates 7. Loss of the captive droplet at higher concentration of FhuA ΔCVFtev in
tensiometry 8. Cryo-SEM of non-crosslinked emulsion droplets 9. Emulsion stability by visual inspection 10. SFM analysis of crosslinked dried capsule 11. References
Electronic Supplementary Material (ESI) for Soft Matter.This journal is © The Royal Society of Chemistry 2017
S-2
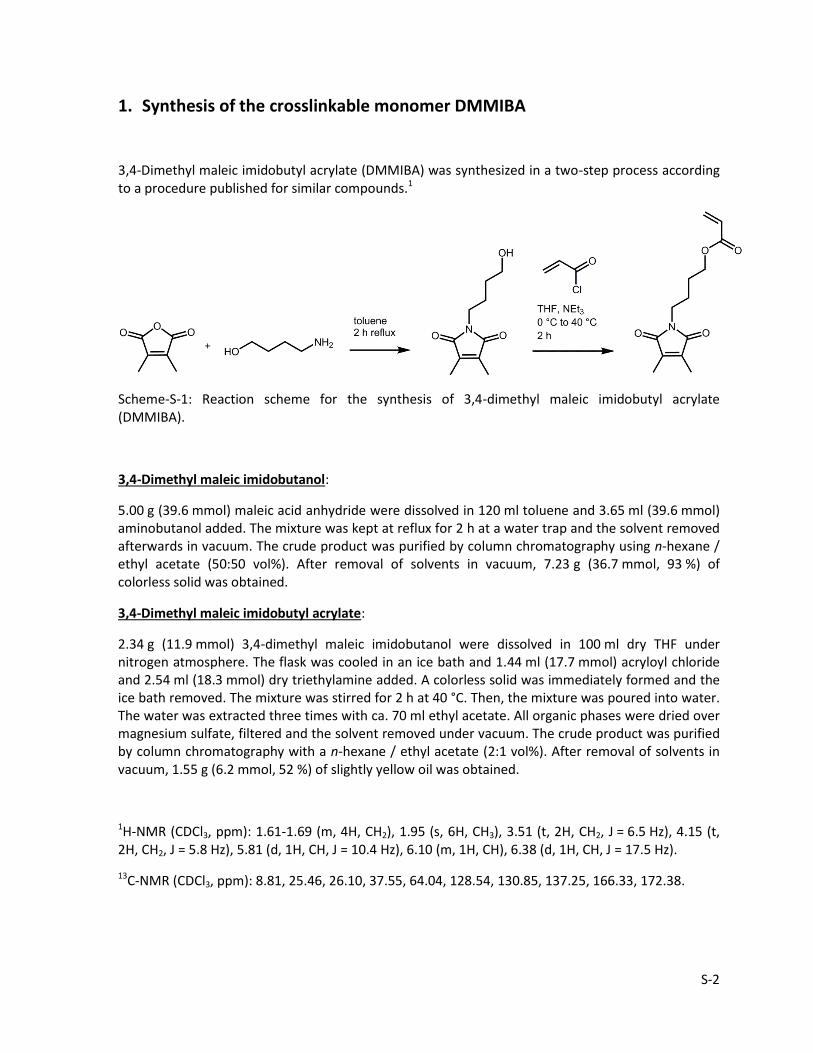
1. Synthesis of the crosslinkable monomer DMMIBA
3,4-Dimethyl maleic imidobutyl acrylate (DMMIBA) was synthesized in a two-step process according to a procedure published for similar compounds.1
Scheme-S-1: Reaction scheme for the synthesis of 3,4-dimethyl maleic imidobutyl acrylate (DMMIBA).
3,4-Dimethyl maleic imidobutanol:
5.00 g (39.6 mmol) maleic acid anhydride were dissolved in 120 ml toluene and 3.65 ml (39.6 mmol) aminobutanol added. The mixture was kept at reflux for 2 h at a water trap and the solvent removed afterwards in vacuum. The crude product was purified by column chromatography using n-hexane / ethyl acetate (50:50 vol%). After removal of solvents in vacuum, 7.23 g (36.7 mmol, 93 %) of colorless solid was obtained.
3,4-Dimethyl maleic imidobutyl acrylate:
2.34 g (11.9 mmol) 3,4-dimethyl maleic imidobutanol were dissolved in 100 ml dry THF under nitrogen atmosphere. The flask was cooled in an ice bath and 1.44 ml (17.7 mmol) acryloyl chloride and 2.54 ml (18.3 mmol) dry triethylamine added. A colorless solid was immediately formed and the ice bath removed. The mixture was stirred for 2 h at 40 °C. Then, the mixture was poured into water. The water was extracted three times with ca. 70 ml ethyl acetate. All organic phases were dried over magnesium sulfate, filtered and the solvent removed under vacuum. The crude product was purified by column chromatography with a n-hexane / ethyl acetate (2:1 vol%). After removal of solvents in vacuum, 1.55 g (6.2 mmol, 52 %) of slightly yellow oil was obtained.
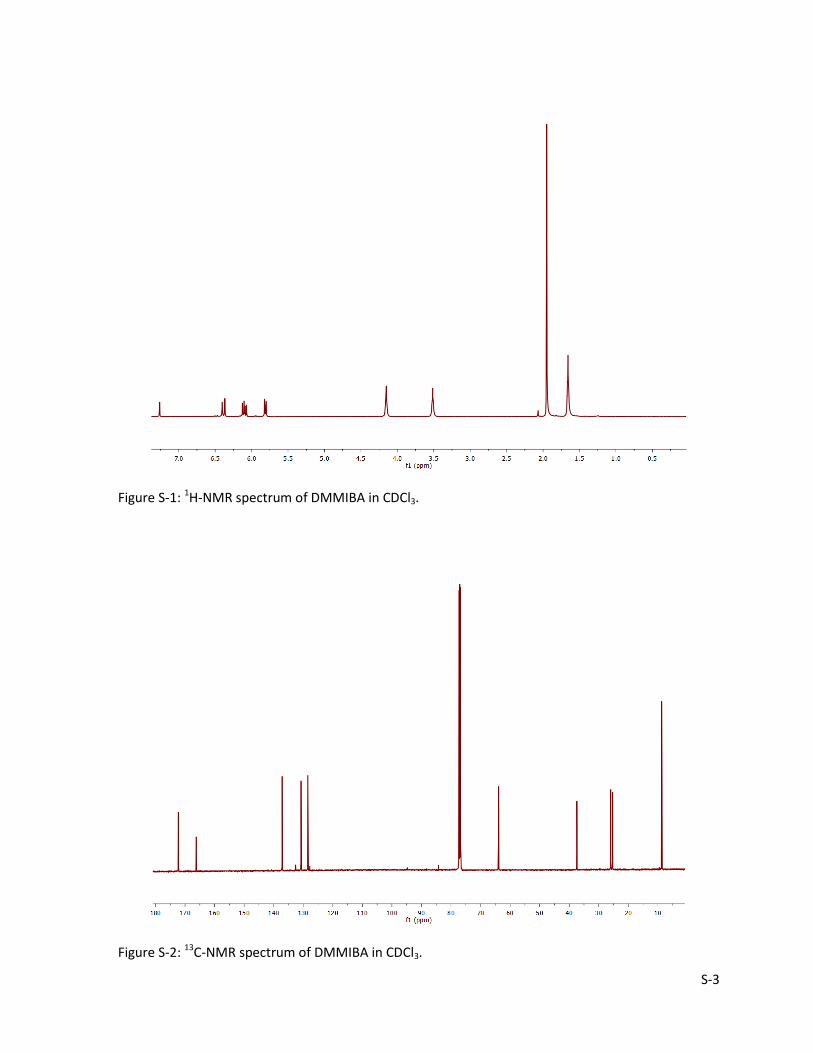
1H-NMR (CDCl3, ppm): 1.61-1.69 (m, 4H, CH2), 1.95 (s, 6H, CH3), 3.51 (t, 2H, CH2, J = 6.5 Hz), 4.15 (t, 2H, CH2, J = 5.8 Hz), 5.81 (d, 1H, CH, J = 10.4 Hz), 6.10 (m, 1H, CH), 6.38 (d, 1H, CH, J = 17.5 Hz).
13C-NMR (CDCl3, ppm): 8.81, 25.46, 26.10, 37.55, 64.04, 128.54, 130.85, 137.25, 166.33, 172.38.
S-3
Figure S-1: 1H-NMR spectrum of DMMIBA in CDCl3.
Figure S-2: 13C-NMR spectrum of DMMIBA in CDCl3.
S-4
2. NMR analysis of the incorporation of crosslinkable monomer DMMIBA into the copolymer
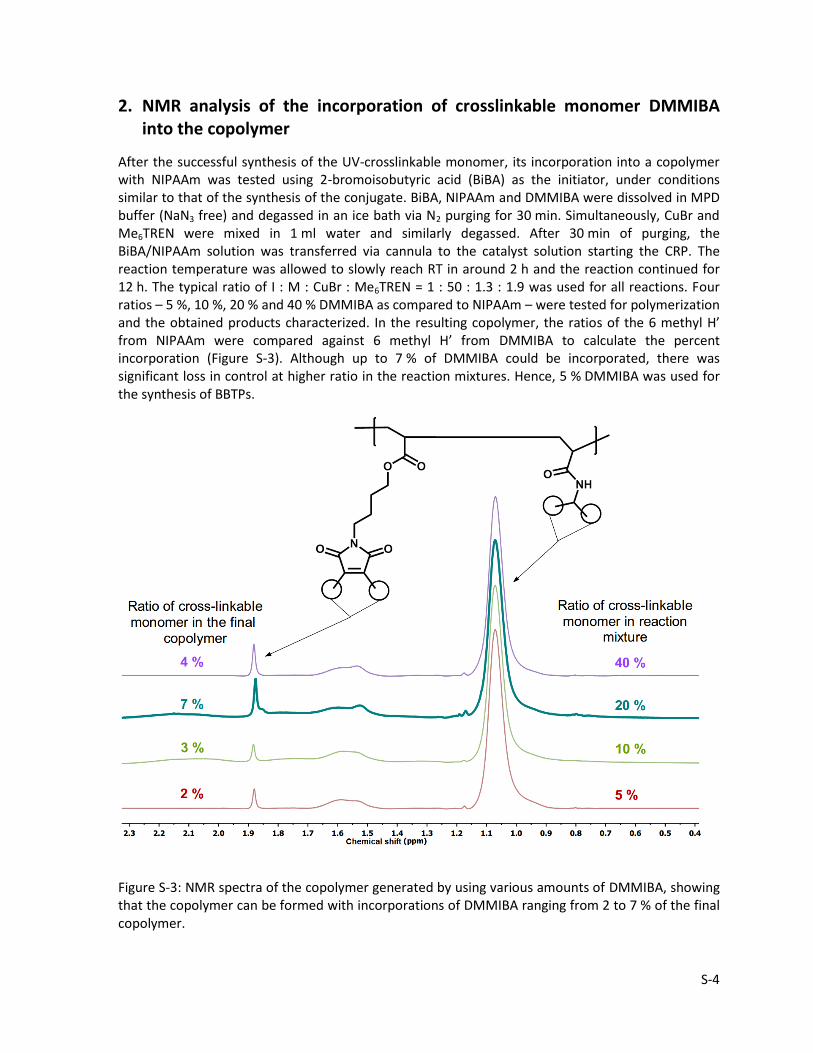
After the successful synthesis of the UV-crosslinkable monomer, its incorporation into a copolymer with NIPAAm was tested using 2-bromoisobutyric acid (BiBA) as the initiator, under conditions similar to that of the synthesis of the conjugate. BiBA, NIPAAm and DMMIBA were dissolved in MPD buffer (NaN3 free) and degassed in an ice bath via N2 purging for 30 min. Simultaneously, CuBr and Me6TREN were mixed in 1 ml water and similarly degassed. After 30 min of purging, the BiBA/NIPAAm solution was transferred via cannula to the catalyst solution starting the CRP. The reaction temperature was allowed to slowly reach RT in around 2 h and the reaction continued for 12 h. The typical ratio of I : M : CuBr : Me6TREN = 1 : 50 : 1.3 : 1.9 was used for all reactions. Four ratios – 5 %, 10 %, 20 % and 40 % DMMIBA as compared to NIPAAm – were tested for polymerization and the obtained products characterized. In the resulting copolymer, the ratios of the 6 methyl H’ from NIPAAm were compared against 6 methyl H’ from DMMIBA to calculate the percent incorporation (Figure S-3). Although up to 7 % of DMMIBA could be incorporated, there was significant loss in control at higher ratio in the reaction mixtures. Hence, 5 % DMMIBA was used for the synthesis of BBTPs.
Figure S-3: NMR spectra of the copolymer generated by using various amounts of DMMIBA, showing that the copolymer can be formed with incorporations of DMMIBA ranging from 2 to 7 % of the final copolymer.
S-5
3. Distribution of lysine residues in FhuA ΔCVFtev
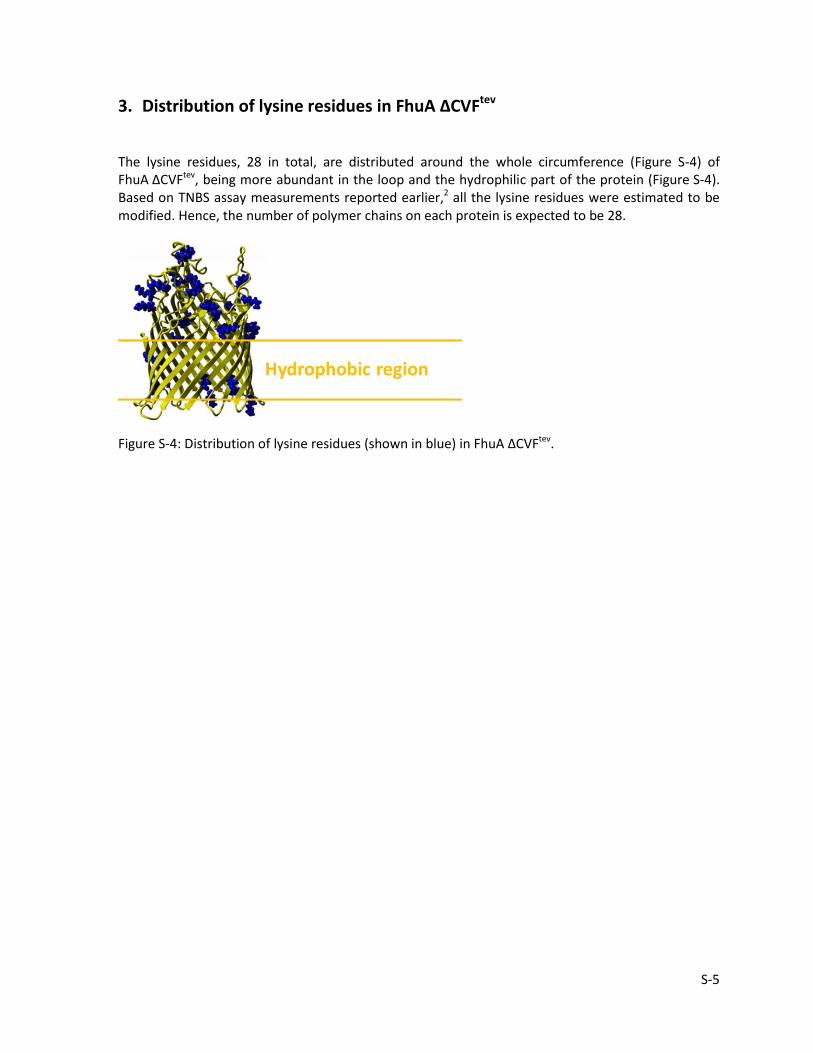
The lysine residues, 28 in total, are distributed around the whole circumference (Figure S-4) of FhuA ΔCVFtev, being more abundant in the loop and the hydrophilic part of the protein (Figure S-4). Based on TNBS assay measurements reported earlier,2 all the lysine residues were estimated to be modified. Hence, the number of polymer chains on each protein is expected to be 28.
Figure S-4: Distribution of lysine residues (shown in blue) in FhuA ΔCVFtev.
S-6
4. Characterization of free polymer chains synthesized under similar
conditions
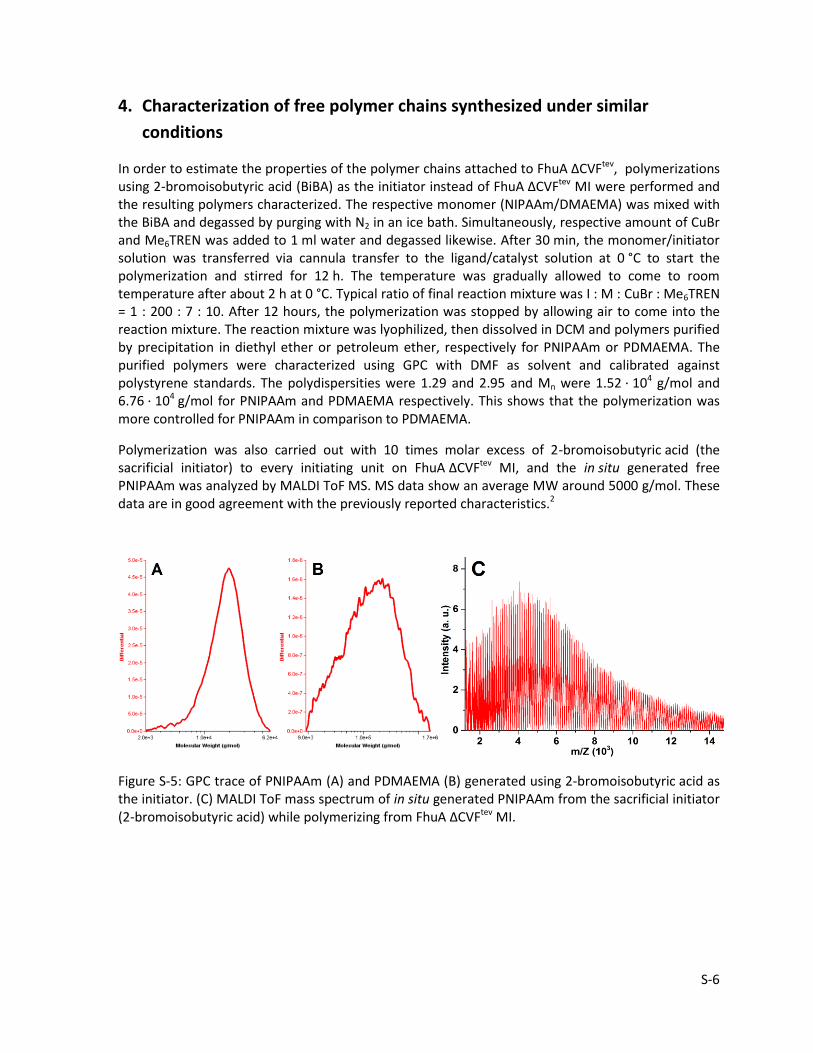
In order to estimate the properties of the polymer chains attached to FhuA ΔCVFtev, polymerizations using 2-bromoisobutyric acid (BiBA) as the initiator instead of FhuA ΔCVFtev MI were performed and the resulting polymers characterized. The respective monomer (NIPAAm/DMAEMA) was mixed with the BiBA and degassed by purging with N2 in an ice bath. Simultaneously, respective amount of CuBr and Me6TREN was added to 1 ml water and degassed likewise. After 30 min, the monomer/initiator solution was transferred via cannula transfer to the ligand/catalyst solution at 0 °C to start the polymerization and stirred for 12 h. The temperature was gradually allowed to come to room temperature after about 2 h at 0 °C. Typical ratio of final reaction mixture was I : M : CuBr : Me6TREN = 1 : 200 : 7 : 10. After 12 hours, the polymerization was stopped by allowing air to come into the reaction mixture. The reaction mixture was lyophilized, then dissolved in DCM and polymers purified by precipitation in diethyl ether or petroleum ether, respectively for PNIPAAm or PDMAEMA. The purified polymers were characterized using GPC with DMF as solvent and calibrated against polystyrene standards. The polydispersities were 1.29 and 2.95 and Mn were 1.52 ⋅ 104 g/mol and 6.76 ⋅ 104 g/mol for PNIPAAm and PDMAEMA respectively. This shows that the polymerization was more controlled for PNIPAAm in comparison to PDMAEMA.
Polymerization was also carried out with 10 times molar excess of 2-bromoisobutyric acid (the sacrificial initiator) to every initiating unit on FhuA ΔCVFtev MI, and the in situ generated free PNIPAAm was analyzed by MALDI ToF MS. MS data show an average MW around 5000 g/mol. These data are in good agreement with the previously reported characteristics.2
Figure S-5: GPC trace of PNIPAAm (A) and PDMAEMA (B) generated using 2-bromoisobutyric acid as the initiator. (C) MALDI ToF mass spectrum of in situ generated PNIPAAm from the sacrificial initiator (2-bromoisobutyric acid) while polymerizing from FhuA ΔCVFtev MI.
S-7
5. SDS-PAGE of FhuA ΔCVFtev-PNIPAAm and FhuA ΔCVFtev-PDMAEMA conjugates
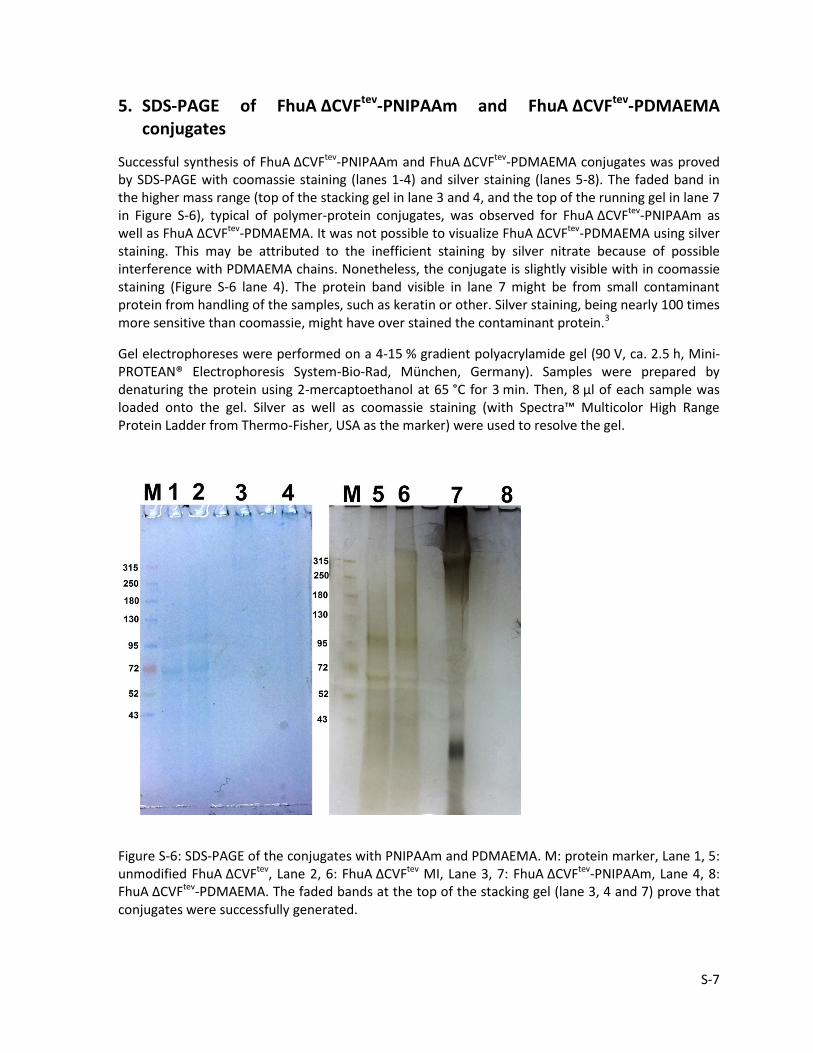
Successful synthesis of FhuA ΔCVFtev-PNIPAAm and FhuA ΔCVFtev-PDMAEMA conjugates was proved by SDS-PAGE with coomassie staining (lanes 1-4) and silver staining (lanes 5-8). The faded band in the higher mass range (top of the stacking gel in lane 3 and 4, and the top of the running gel in lane 7 in Figure S-6), typical of polymer-protein conjugates, was observed for FhuA ΔCVFtev-PNIPAAm as well as FhuA ΔCVFtev-PDMAEMA. It was not possible to visualize FhuA ΔCVFtev-PDMAEMA using silver staining. This may be attributed to the inefficient staining by silver nitrate because of possible interference with PDMAEMA chains. Nonetheless, the conjugate is slightly visible with in coomassie staining (Figure S-6 lane 4). The protein band visible in lane 7 might be from small contaminant protein from handling of the samples, such as keratin or other. Silver staining, being nearly 100 times more sensitive than coomassie, might have over stained the contaminant protein.3
Gel electrophoreses were performed on a 4-15 % gradient polyacrylamide gel (90 V, ca. 2.5 h, Mini-PROTEAN® Electrophoresis System-Bio-Rad, München, Germany). Samples were prepared by denaturing the protein using 2-mercaptoethanol at 65 °C for 3 min. Then, 8 µl of each sample was loaded onto the gel. Silver as well as coomassie staining (with Spectra™ Multicolor High Range Protein Ladder from Thermo-Fisher, USA as the marker) were used to resolve the gel.
Figure S-6: SDS-PAGE of the conjugates with PNIPAAm and PDMAEMA. M: protein marker, Lane 1, 5: unmodified FhuA ΔCVFtev, Lane 2, 6: FhuA ΔCVFtev MI, Lane 3, 7: FhuA ΔCVFtev-PNIPAAm, Lane 4, 8: FhuA ΔCVFtev-PDMAEMA. The faded bands at the top of the stacking gel (lane 3, 4 and 7) prove that conjugates were successfully generated.
S-8
6. CD spectroscopy of unmodified FhuA ΔCVFtev and conjugates
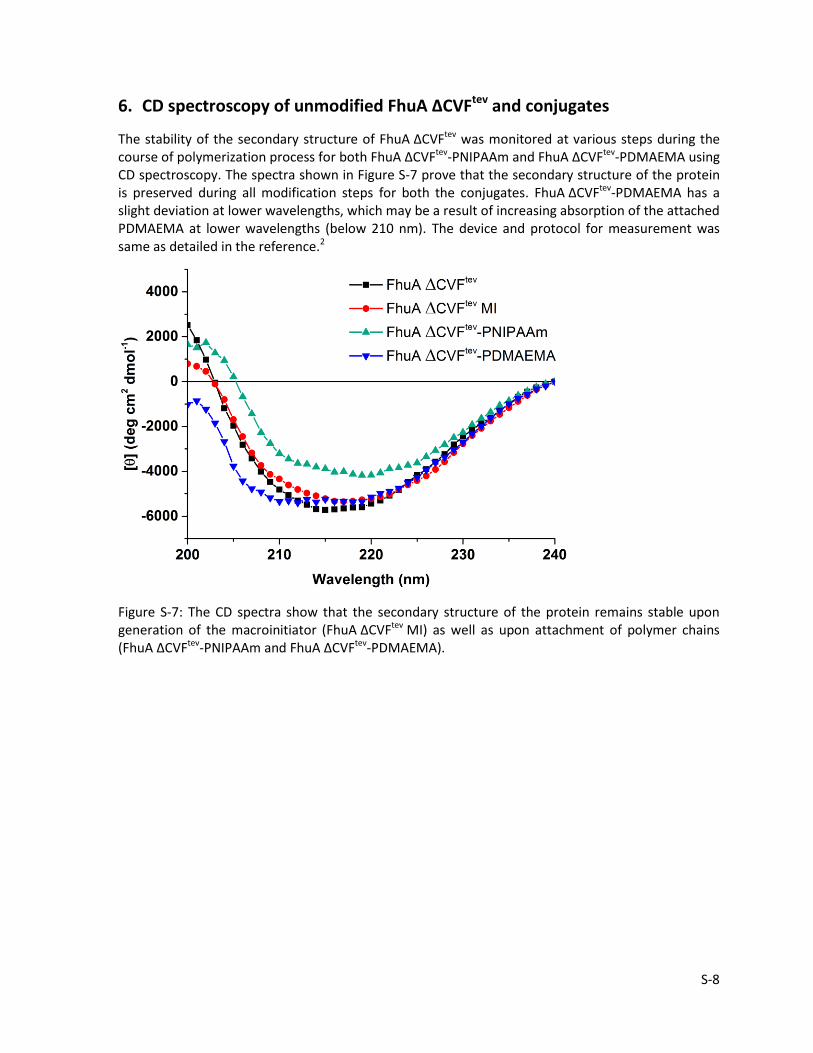
The stability of the secondary structure of FhuA ΔCVFtev was monitored at various steps during the course of polymerization process for both FhuA ΔCVFtev-PNIPAAm and FhuA ΔCVFtev-PDMAEMA using CD spectroscopy. The spectra shown in Figure S-7 prove that the secondary structure of the protein is preserved during all modification steps for both the conjugates. FhuA ΔCVFtev-PDMAEMA has a slight deviation at lower wavelengths, which may be a result of increasing absorption of the attached PDMAEMA at lower wavelengths (below 210 nm). The device and protocol for measurement was same as detailed in the reference.2
Figure S-7: The CD spectra show that the secondary structure of the protein remains stable upon generation of the macroinitiator (FhuA ΔCVFtev MI) as well as upon attachment of polymer chains (FhuA ΔCVFtev-PNIPAAm and FhuA ΔCVFtev-PDMAEMA).
S-9
7. Loss of the captive droplet at higher concentration of FhuA ΔCVFtev in tensiometry
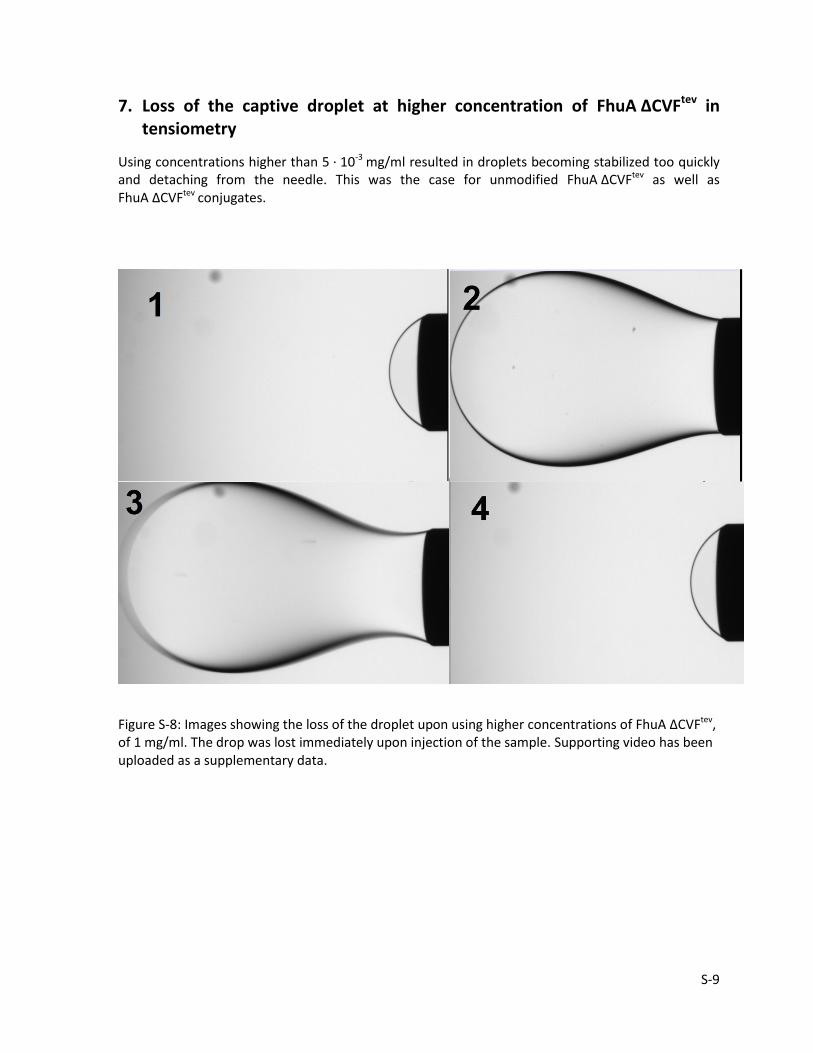
Using concentrations higher than 5 ⋅ 10-3 mg/ml resulted in droplets becoming stabilized too quickly and detaching from the needle. This was the case for unmodified FhuA ΔCVFtev as well as FhuA ΔCVFtev
conjugates.
Figure S-8: Images showing the loss of the droplet upon using higher concentrations of FhuA ΔCVFtev, of 1 mg/ml. The drop was lost immediately upon injection of the sample. Supporting video has been uploaded as a supplementary data.
S-10
8. Cryo-SEM of non-crosslinked emulsion droplets
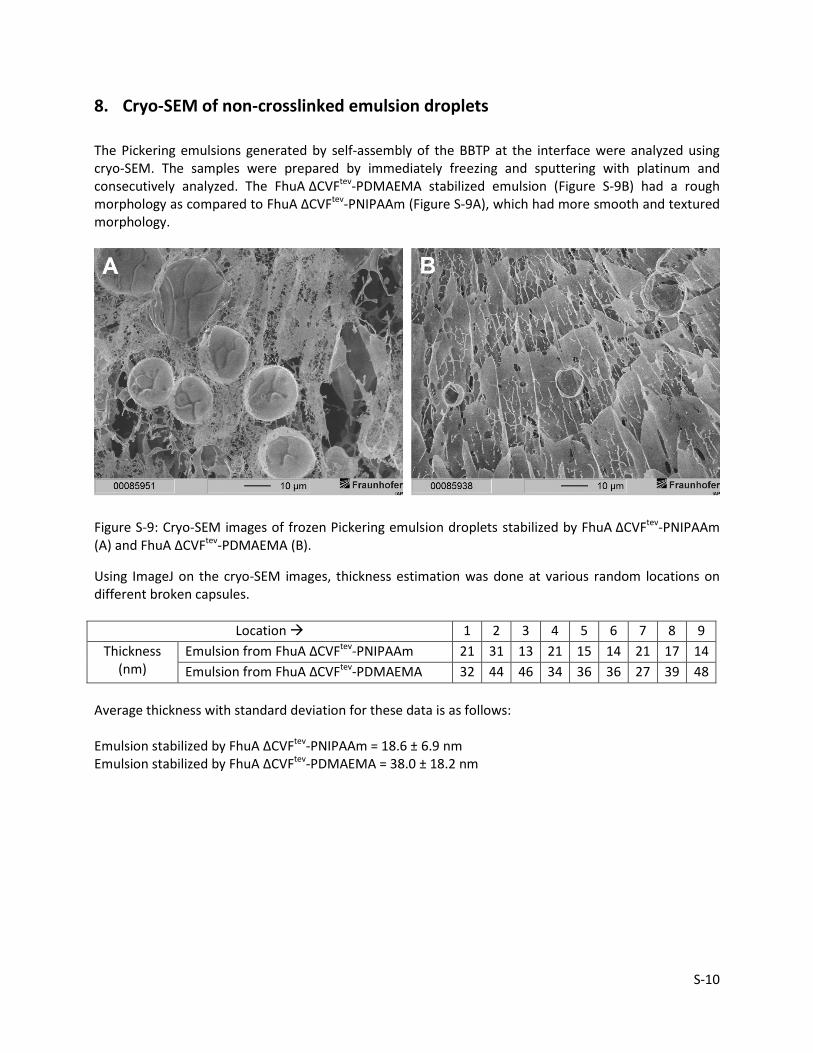
The Pickering emulsions generated by self-assembly of the BBTP at the interface were analyzed using cryo-SEM. The samples were prepared by immediately freezing and sputtering with platinum and consecutively analyzed. The FhuA ΔCVFtev-PDMAEMA stabilized emulsion (Figure S-9B) had a rough morphology as compared to FhuA ΔCVFtev-PNIPAAm (Figure S-9A), which had more smooth and textured morphology.
Figure S-9: Cryo-SEM images of frozen Pickering emulsion droplets stabilized by FhuA ΔCVFtev-PNIPAAm (A) and FhuA ΔCVFtev-PDMAEMA (B).
Using ImageJ on the cryo-SEM images, thickness estimation was done at various random locations on different broken capsules.
Location 1 2 3 4 5 6 7 8 9
Thickness (nm)
Emulsion from FhuA ΔCVFtev-PNIPAAm 21 31 13 21 15 14 21 17 14
Emulsion from FhuA ΔCVFtev-PDMAEMA 32 44 46 34 36 36 27 39 48
Average thickness with standard deviation for these data is as follows: Emulsion stabilized by FhuA ΔCVFtev-PNIPAAm = 18.6 ± 6.9 nm Emulsion stabilized by FhuA ΔCVFtev-PDMAEMA = 38.0 ± 18.2 nm
S-11
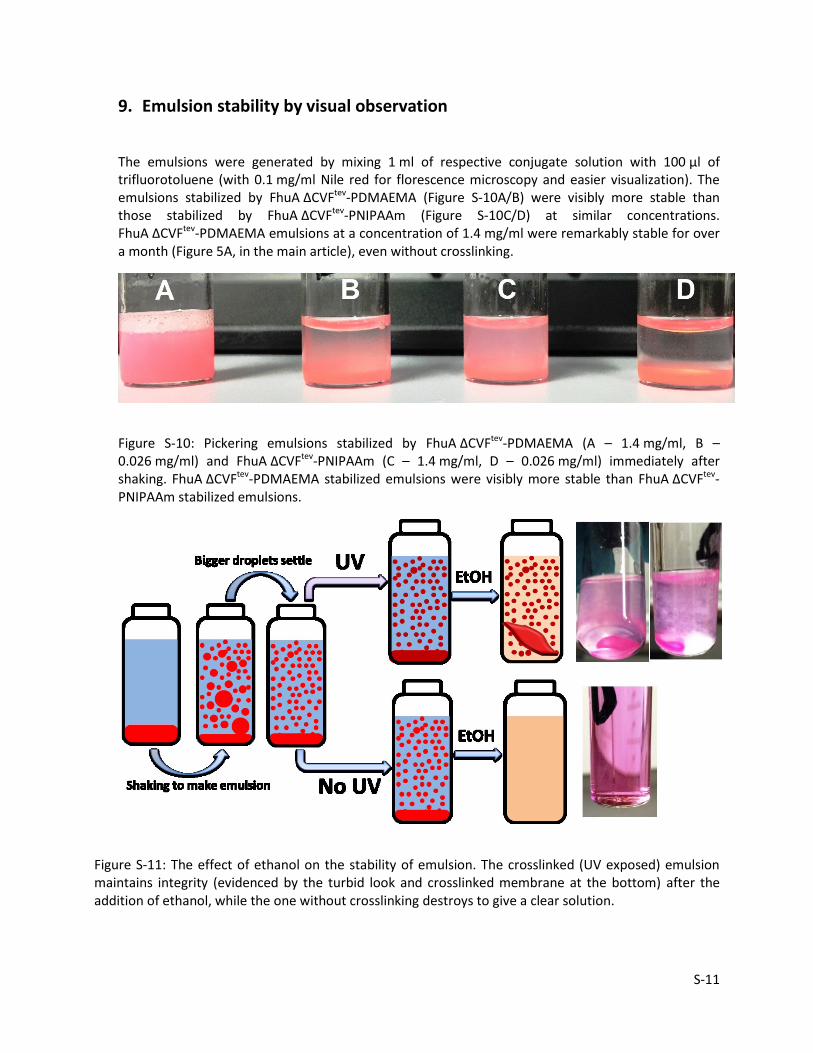
9. Emulsion stability by visual observation
The emulsions were generated by mixing 1 ml of respective conjugate solution with 100 µl of trifluorotoluene (with 0.1 mg/ml Nile red for florescence microscopy and easier visualization). The emulsions stabilized by FhuA ΔCVFtev-PDMAEMA (Figure S-10A/B) were visibly more stable than those stabilized by FhuA ΔCVFtev-PNIPAAm (Figure S-10C/D) at similar concentrations. FhuA ΔCVFtev-PDMAEMA emulsions at a concentration of 1.4 mg/ml were remarkably stable for over a month (Figure 5A, in the main article), even without crosslinking.
Figure S-10: Pickering emulsions stabilized by FhuA ΔCVFtev-PDMAEMA (A – 1.4 mg/ml, B – 0.026 mg/ml) and FhuA ΔCVFtev-PNIPAAm (C – 1.4 mg/ml, D – 0.026 mg/ml) immediately after shaking. FhuA ΔCVFtev-PDMAEMA stabilized emulsions were visibly more stable than FhuA ΔCVFtev-PNIPAAm stabilized emulsions.
Figure S-11: The effect of ethanol on the stability of emulsion. The crosslinked (UV exposed) emulsion maintains integrity (evidenced by the turbid look and crosslinked membrane at the bottom) after the addition of ethanol, while the one without crosslinking destroys to give a clear solution.
S-12
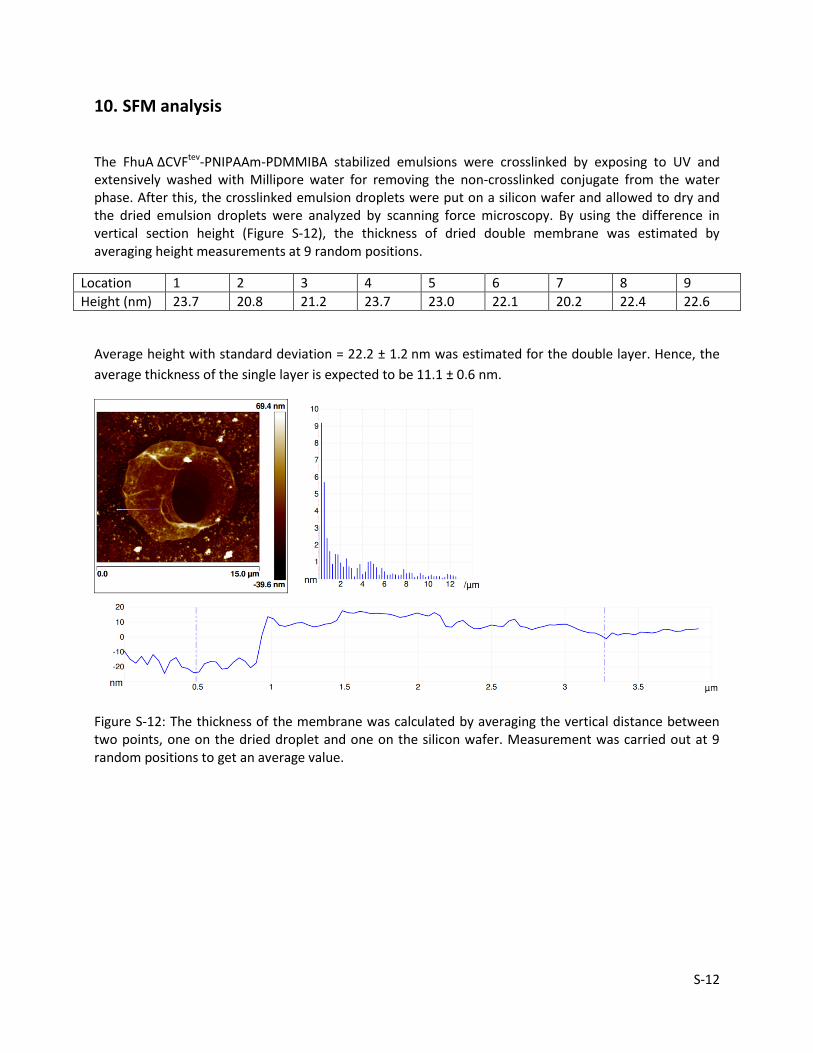
10. SFM analysis
The FhuA ΔCVFtev-PNIPAAm-PDMMIBA stabilized emulsions were crosslinked by exposing to UV and extensively washed with Millipore water for removing the non-crosslinked conjugate from the water phase. After this, the crosslinked emulsion droplets were put on a silicon wafer and allowed to dry and the dried emulsion droplets were analyzed by scanning force microscopy. By using the difference in vertical section height (Figure S-12), the thickness of dried double membrane was estimated by averaging height measurements at 9 random positions.
Location 1 2 3 4 5 6 7 8 9
Height (nm) 23.7 20.8 21.2 23.7 23.0 22.1 20.2 22.4 22.6
Average height with standard deviation = 22.2 ± 1.2 nm was estimated for the double layer. Hence, the
average thickness of the single layer is expected to be 11.1 ± 0.6 nm.
Figure S-12: The thickness of the membrane was calculated by averaging the vertical distance between two points, one on the dried droplet and one on the silicon wafer. Measurement was carried out at 9 random positions to get an average value.
S-13
11. References
(1) Gaitzsch, J.; Appelhans, D.; Wang, L.; Battaglia, G.; Voit, B. Angew. Chem. Int. Ed. 2012, 51, 4448. (2) Charan, H.; Kinzel, J.; Glebe, U.; Anand, D.; Garakani, T. M.; Zhu, L.; Bocola, M.; Schwaneberg, U.; Böker, A. Biomaterials 2016, 107, 115. (3) Rabilloud, T. ELECTROPHORESIS 1990, 11, 785.