ΕΓΚΥΜΟΣΥΝΗ ΚΑΙ ΥΠΕΡΤΑΣΗ Ανδρέας Πιτταράς Καρδιολόγος Hypertension specialist ESH
Expression of M-CSF, TNF-β, IFN-γ, and IL-10 in Rats with LiverCirrhosis and Hypersplenism and its SignificanceYunfu Lv1*, Jie Deng2, Bookyong Yu2, Qingqing Li1,2 and Xinqiu Li3
1Department of General Surgery, Hainan Provincial People's Hospital, Haikou, China2Department of General Surgery, The People's Liberation Army 187 Hospital, Haikou, China3Hubei Province People's Hospital affiliated to School of Pharmacy, Shiyan, China*Corresponding author: Yunfu Lv, Department of General Surgery, Hainan Provincial People's Hospital, Haikou 570311, China, Tel: 8613687598368; E-mail: [email protected]
Received date: December 20, 2016; Accepted date: December 26, 2016; Published date: December 31, 2016
Copyright: © 2016 Yunfu L, et al. This is an open-access article distributed under the terms of the Creative Commons Attribution License, which permits unrestricteduse, distribution, and reproduction in any medium, provided the original author and source are credited.
Abstract
Objective: This study aimed to examine the expression of M-CSF, TNF-β, IFN-γ, and IL-10 in rats with livercirrhosis and hypersplenism, and to investigate its significance.
Methods: Seventy-two healthy male SD rats were randomly divided into a model group (n=60) and a controlgroup (n=12). The rats in the model group were first gavaged with a 40% CCL4/peanut oil solution to developcirrhosis and hypersplenism. The expression rates and intensities of the pro-inflammatory cytokines M-CSF, TNF-β,and IFN-γ, and the anti-inflammatory cytokine IL-10 in the spleen were measured and compared with the controlgroup. The pro-inflammatory/anti-inflammatory cytokine ratio and its role were analyzed.
Results: The positive expression rates of M-CSF, TNF-β, IFN-γ, and IL-10 in the model group (cirrhosis andhypersplenism) were 61.76%, 79.41%, 64.70%, and 88.24%, respectively, which were significantly different (P<0.05)from the 25%, 33.33%, 16.67%, and 50% in the control group. The relative protein expression intensities of M-CSF,TNF-β, IFN-γ, and IL-10 in the model group were 0.63 ± 0.58, 1.06 ± 0.49, 0.99 ± 0.38, and 1.12 ± 0.42,respectively, and were significantly different (P<0.05) from the 0.18 ± 0.12, 0.52 ± 0.27, 0.38 ± 0.28, and 0.60 ± 0.32in the control group. The relative mRNA expression levels of M-CSF, TNF-β, IFN-γ, and IL-10 in the model groupwere 2.06 ± 0.11, 4.07 ± 0.19, 2.98 ± 0.11, and 7.94 ± 0.27, respectively, and were significantly different (P<0.05)from the 1.01 ± 0.05, 1.06 ± 0.11, 1.00 ± 0.31, and 1.02 ± 0.08 in the control group.
Conclusion: The abnormally increased expression of M-CSF, TNF-β, IFN-γ, and IL-10 in rats with liver cirrhosisand hypersplenism, as well as the abnormal pro-inflammatory/anti-inflammatory cytokine ratio and regulation mayplay an important role in enhancing the phagocytosis of macrophages and causing peripheral cytopenias.
Keywords: M-CSF; TNF-β; IFN-γ; IL-10; Cirrhosis; Hypersplenism
IntroductionPatients with splenomegaly due to cirrhotic portal hypertension are
often complicated by mono-lineage cytopenias or multi-lineageperipheral cytopenias, which seriously affects prognosis [1,2]. Thecause of this is related to hypersplenism resulting from increasedactivity of macrophages in the spleen. Studies have shown that insplenomegaly due to cirrhotic portal hypertension, macrophages arehighly activated, with significantly enhanced phagocytosis, cytokinesecretion, and antigen-presenting capability; a large number of bloodcells in the spleen are engulfed and destroyed, which may be the causeof peripheral cytopenias in splenomegaly due to cirrhotic portalhypertension [3-5]. Cytokines that promote the activation ofmacrophages include macrophage colony-stimulating factor (M-CSF),tumor necrosis factor-β (TNF-β), interferon-γ (IFN-γ), andmacrophage activating factor (MAF) [6]. Cytokines that inhibitmacrophages mainly include interleukin-10 (IL-10), which helps tostabilize immune function [7]. Macrophage migration inhibitory factor(MIF) has both anti-inflammatory and pro-inflammatory functions
[8], which are difficult to understand. Currently, M-CSF, TNF-β, IFN-γ, and IL-10, have been extensively studied in lymphoma,atherosclerosis, and liver disease. However, only a single cytokine wasanalyzed in such studies, and multiple cytokines have rarely beeninvestigated in a single disease, especially liver cirrhosis withhypersplenism. Therefore, the present study aimed to investigate theeffects of these four cytokines on macrophage activity and peripheralcytopenias in hypersplenism.
Material and Methods
Reagents and materialsExperimental animals: Seventy two specific pathogen-free (SPF)
inbred SD rats, weighing 240-300 g, were purchased from Hunan SJALaboratory Animal Co., Ltd. (China) (certificate number:43004700011005). They were randomly divided into a liver cirrhosisand hypersplenism model group (n=60) and a control group (n=12).After quarantine inspection, the rats were raised in a separate room inthe barrier area in Hainan Drug Safety Evaluation Center. For the
Yunfu et al., J Hypertens 2016, 5:4 DOI: 10.4172/2167-1095.1000234
Research Article Open Access
J Hypertens, an open access journalISSN: 2167-1095
Volume 5 • Issue 4 • 1000234
Journal of Hypertension: Open Access
Jour
nal o
f H
ypertension: Open Access
ISSN: 2167-1095
model group, five rats were housed in one cage, and for the controlgroup, six in one cage.
Reagents: Carbon tetrachloride (analytical reagent) was purchasedfrom Guangdong Guanghua Sci-Tech Co., Ltd. (China) (batch number:20140410). Commercially available Xiangmanyuan Brand peanut oiland Qianmen Brand Erguotou (alcohol content: 56% vol) were used.Pentobarbital sodium and deionized water used to prepare theanesthetic were provided by Hainan Drug Safety Evaluation Center.
Rabbit polyclonal antibodies for M-CSF, TNF-β, IFN-γ, and IL-10were purchased from Santa Cruz Biotechnology, Inc. The Universal kitand DAB kit were purchased from Beijing Zhongshan JinqiaoBiological Technology Co., Ltd. (China). The enhancedchemiluminescence kit, developing and fixing kit, RIPA lysis buffer(medium), total RNA extraction kit, universal reverse transcription kit,and ComSYBRqPCR Mix (with ROX) were obtained from ShanghaiNovland Co., Ltd. (China).
Experimental methodsDevelopment of cirrhosis and hypersplenism: Rats were raised in
the new environment for seven days after purchase for adaption, withan adequate supply of food and water. Rats in the control group weremaintained on normal diet, without any treatment. Rats in the modelgroup were gavaged a 40% CCL4/peanut oil solution at a dose of 3.0ml/kg twice a week in accordance with the methods of Ye [9]. Gavagedose was adjusted according to weight gain in the previous week. Thedose was not changed when the body weight increased or decreased byless than 5%, but was increased by 0.5 ml/kg with a weight gain ofmore than 5%, decreased by 0.5 ml/kg with a weight reduction of morethan 5%, and discontinued with a weight reduction of more than 10%.After gavage administration, the water was replaced with a mixture of10% liquor and deionized water in the first two weeks and with amixture of 15% liquor and deionized water thereafter. At week 7, onerandomly selected rat from the model group was anesthetized andsacrificed. The right liver lobe and spleen tissues were collected, thenfixed in methanol, embedded in paraffin, and stained withhematoxylin-eosin (HE) to observe the pathological changes in theliver and spleen tissues under the microscope, in order to confirm thedevelopment of cirrhosis and hypersplenism. At week 8, when thedevelopment of cirrhosis and hypersplenism had been confirmed, 2 mlof orbital venous blood was collected from the rats in both groups forliver function and routine blood tests. After blood collection, all ratswere sacrificed by cervical dislocation, and appropriate amounts of theright liver lobe and spleen tissues were collected, then fixed andpreserved. The expression of M-CSF, TNF-β, IFN-γ, and IL-10 in theenlarged spleen of rats with cirrhosis was measured byimmunohistochemistry. Another appropriate amount of spleen tissuewas preserved at -80°C for later Western blotting and RT-PCR.
Criteria for development of cirrhosis and hypersplenism: a.monolineage or multilineage cytopenias (WBC, PLT, and RBC) asrevealed by routine blood tests; b. abnormal liver function indexes; c.liver: visual observation of cirrhotic nodules and microscopicobservation of pseudolobules; and d. spleen: splenomegaly comparedwith the control group, a significantly increased spleen index, andmicroscopic observation of red pulp expansion.
Immunohistochemistry: The fixed liver and spleen tissues wereembedded in paraffin, and cut into 4 μm serial sections. One livertissue section was stained with HE. One spleen tissue section wasstained with HE, one was incubated with PBS in replacement of the
primary antibodies and used as a negative control, and four werestained by immunohistochemical staining for M-CSF, TNF-β, IFN-γ,and IL-10, respectively. HE staining results were reviewed by twophysicians from Hainan Provincial People's Hospital to confirm thediagnosis of cirrhosis and splenomegaly.
The same immunohistochemical procedure was performed for thefour cytokines: Paraffin sections were dewaxed, dehydrated in gradientalcohol, placed in distilled water, transferred into pH-6.0 sodiumcitrate solution, and boiled at high pressure until 2 minutes and 30seconds after valve rotation. The autoclave was then placed into a potof cold water, with running water slowly rushing the surface. Aftercooling, the sections were placed into 3% H2O2 for 5 minutes, theninto distilled water for 1 minute, PBS I for 1 minute, and then PBS II,III, and IV, respectively, for 3 minutes each. After the diluted primaryantibodies were added dropwise, the sections were incubated at 37°Cfor 1 hour, and then rinsed with PBS II, III, and IV, respectively, for 3minutes each. After the immunohistochemistry solution was addeddropwise, the sections were incubated at 37°Cfor 1 hour, and thenrinsed with PBS V, VI and VII, respectively, for 3 minutes each.Afterwards, the sections were developed with freshly prepareddiaminobenzidine (DAB) solution for 3-5 minutes under themicroscope, and then rinsed with running water. Finally, the sectionswere counterstained, dehydrated in gradient alcohol, cleared withxylene, and mounted with gum.
Result judgment: M-CSF, TNF-β, IFN-γ, and IL-10-positive cellswere stained mainly in the cytoplasm and membrane, which turnedbrownish yellow or brown. Five high-power (×400) fields were selectedto calculate the percentage of positive cells and expression intensity.The positive expression intensity was scored as follows: no staining wasscored as 0; faint yellow staining as 1; yellow staining as 2; and brownstaining as 3. The percentage of positive cells rate was scored as follows:5% was scored as 0; 5-25% as 1; 26-50% as 2; 51 -75% as 3; and >75%as 4. The final score was obtained by summing the above two scores: Ascore of 0 indicated negative expression (-); a score of 1 and 2 indicatedweak positive expression (+);a score of 3-5 indicated medium positiveexpression (+); and a score of 6 and 7 indicated strong positiveexpression (+++).
Western blotting: Each tissue sample was treated with 300 μl of celllysis buffer, and mixed with a pipette until complete lysis was observed.The lysate was transferred to a new centrifuge tube. Next, 10 μl ofsample was mixed with 10 μl of 2×SDS-PAGE loading buffer, heated at100°C for 5 minutes, cooled on ice, and centrifuged at 12000 g for 5minutes. Insoluble precipitates were removed. The samples wereseparated by 10% SDS-PAGE at a volume of 20 μl per well. Afterelectrophoresis, the PVDF membranes were immersed in methanol for1 minute. Next, the gel, filter papers, and the PVDF membranes thathad been immersed in methanol were immersed in transfer buffer at4°C for 10 minutes. Transfer sandwiches were then prepared (Note:Semi-dry electrophoretic transfer was performed using a semi-dry cellat 30 mA for 60 min). The PVDF membranes were blocked withblocking buffer at 4°C overnight, washed for 15 minutes three timeswith 1 × TBST the next day, and incubated with diluted primaryantibodies at 37°C for 2 hours. Then, the membranes were washed with1 × TBST for 10 minutes four times, incubated with diluted secondaryantibodies at 37°C for 2 hours and finally washed with 1 × TBST for 10minutes four times. After chemiluminescent detection using thehypersensitive luminescence solution, the membranes were exposed tox-ray films. The films were developed, fixed, dried, and photographed
Citation: Lv Y, Deng J, Yu B, Li Q, Li X (2016) Expression of M-CSF, TNF-β, IFN-γ, and IL-10 in Rats with Liver Cirrhosis and Hypersplenism andits Significance. J Hypertens 5: 234. doi:10.4172/2167-1095.1000234
Page 2 of 6
J Hypertens, an open access journalISSN: 2167-1095
Volume 5 • Issue 4 • 1000234
by a gel imaging system. The images were analyzed by Gel-ProAnalyzer software.
RT-PCR: Total RNA was extracted according to the Trizol total RNAextraction kit instructions, and reversely transcribed according to thereverse transcription kit instructions. Primer sequences were asfollows: M-CSF (126bp) upstream primer: 5’-GACTTGGCTTGGGATGATTCT-3’, downstream primer: 5'-GAGGGTCTGGCAGGTACTC-3'; TNF-β (241bp) upstream primer:5'-CCACCTCCTGAGGGTGCTTA-3', downstream primer: 5 '-ATGTCGGAGAAAGGCGCG-3'; INF-γ (108bp) upstream primer: 5'-GTCATCGAATCGCACCTGA-3', downstream primer: 5'-GTGCTGGATCTGTGGGTTG-3'; IL-10 (105bp) upstream primer: 5'-GCTCTTACTGGCTGGAGTGAG-3', downstream primer: 5'-CTCAGCTCTCGGAGCATGTG-3'; internal reference GAPDH(115bp) upstream primer: 5'-AAGGTCGGTGTGAACGGATTTG-3', downstream primer: 5'-TGTAGTTGAGGTCAATGAAGGGGTC-3'.All primers were synthesized by Shanghai Novland Co., Ltd. (China).Reverse transcription was performed for 30 min at 42°C, and 10 min at85°C. Cycling parameters used for quantitative PCR were:denaturation at 95°C for 3 min, 95°C for 12 seconds, and 62°C for 40seconds for 40 cycles. Fluorescent signal was collected at the extensionphase of each cycle. After amplification was completed, fluorescentsignal in cycles 3-15 was set as baseline, a threshold fluorescence valuewas established where all PCR amplifications were within theexponential phase, and GAPDH was set as an internal reference geneto calculate Ct values for each sample and each gene. Relativequantitation (RQ) of gene expression was determined by the 2-Ctmethod.
Statistical analysis: Test data were analyzed using the SPSS 19.0software package. Normally distributed measurement data wereexpressed as x̄±S. The results of routine blood and liver function tests,Western blotting, and RT-PCR were compared using the independentsamples t-test. Immunohistochemical positive expression wascompared using the chi-square test. P<0.05 was considered statisticallysignificant.
Results
General conditionsTwenty six (43.3%) rats in the model group died from week 5
onward, and nine of them died instantly due to poor gavage technique.The 34 surviving rats had matted fur, severe fur loss, poor appetite,weight loss, and low activity. These rats were in poor spirits, relativelyweak, insensitive to external stimuli, and had a black tongue, whichwas an obvious sign of intoxication. In contrast, no deaths occurred inthe control group, and the rats had glossy fur and good appetite, andwere in good spirits, sensitive to external stimuli, and lively.
Laboratory tests
Routine blood tests: WBC count (×109/L) was significantly higherin the model group than in the control group (25.81 ± 11.50 vs. 6.16 ±2.42, t value=5.67, P<0.05). RBC count (×1012/L) and PLT count (×109/L) were significantly lower in the model group than in the controlgroup (6.08 ± 1.76 vs. 7.96 ± 0.62, t value=-2.51, P<0.05; 355.25 ±286.06 vs. 1109.17 ± 161.30, t-value=-7.14, P<0.01) (Table 1).
Blood Cells Model Group(n=28)
Control Group(n=12)
t Value P Value
WBC (×109/L) 25.81 ± 11.50 6.16 ± 2.42 5.67 <0.05
RBC(×1012/L)
6.08 ± 1.76 7.96 ± 0.62 -2.51 <0.05
PLT (×109/L) 355.25 ± 286.06 1109.17 ± 161.30 -7.14 <0.01
Table 1: Comparison of routine blood test results between the twogroups.
Liver function: ALT (U/L), AST (U/L), and TBIL (μ mol/L) levelswere significantly higher in the model group than in the control group(264.14 ± 111.05 vs. 26.50 ± 7.89, t value=5.65, P<0.05; 687.43 ± 298.64vs. 123.83 ± 20.38, t value=4.98, P<0.05; 20.07 ± 17.75 vs. 1.38 ± 0.39, tvalue=2.58, P<0.05). TP (g/L) and ALB (g/L) levels were significantlylower in the model group than in the control group (54.44 ± 7.59 vs.64.87 ± 2.96, t value=-3.35, P<0.05; 24.53 ± 4.36 vs. 30.25 ± 1.65, t-value=-3.02, P<0.05) (Table 2).
LiverFunction
Model Group(n=28)
Control Group(n=12)
t Value P Value
ALT (U/L) 264.14 ± 111.05 26.50 ± 7.89 5.65 <0.05
AST (U/L) 687.43 ± 298.64 123.83 ± 20.38 4.98 <0.05
TBIL (µmol/L)
20.07 ± 17.75 1.38 ± 0.39 2.58 <0.05
TP (g/L) 54.44 ± 7.59 64.87 ± 2.96 -3.35 <0.05
ALB (g/L) 24.53 ± 4.36 30.25 ± 1.65 -3.02 <0.05
Table 2: Comparison of liver function between the two groups.
Changes in the spleen indexSpleen index=spleen weight (mg)/body weight (g). The spleen index
was 3.14 ± 0.98 for the model group, which was significantly differentfrom the 2.33 ± 1.03 for the control group (t=-2.351, P<0.05).
ImmunohistochemistryIn the model group, 61.76% (21/34, including 10 rats with a
medium or higher level of positive expression) of the rats were M-CSFpositive (a score of ≥ 2), which was significantly higher than the25.00% (3/12) in the control group (X2=4.29, P<0.05). Furthermore,79.41% (27/34, including 12 rats with a medium or higher level ofpositive expression) of the rats were TNF-β positive, which wassignificantly higher than the 33.33% (4/12) in the control group(X2=5.70, P<0.01).
In addition, 64.70% (22/34, including 11 rats with a medium orhigher level of positive expression) of the rats were IFN-γ positive,which was significantly higher than the 16.67% (2/12) in the controlgroup (X2=7.62, P<0.01). Finally, 88.24% (30/34, including 13 rats witha medium or higher level of positive expression) of the rats were IL-10positive, which was significantly higher than the 50.00% (6/12) in thecontrol group (X2=3.97, P<0.05) (Figures 1 and 2).
Citation: Lv Y, Deng J, Yu B, Li Q, Li X (2016) Expression of M-CSF, TNF-β, IFN-γ, and IL-10 in Rats with Liver Cirrhosis and Hypersplenism andits Significance. J Hypertens 5: 234. doi:10.4172/2167-1095.1000234
Page 3 of 6
J Hypertens, an open access journalISSN: 2167-1095
Volume 5 • Issue 4 • 1000234
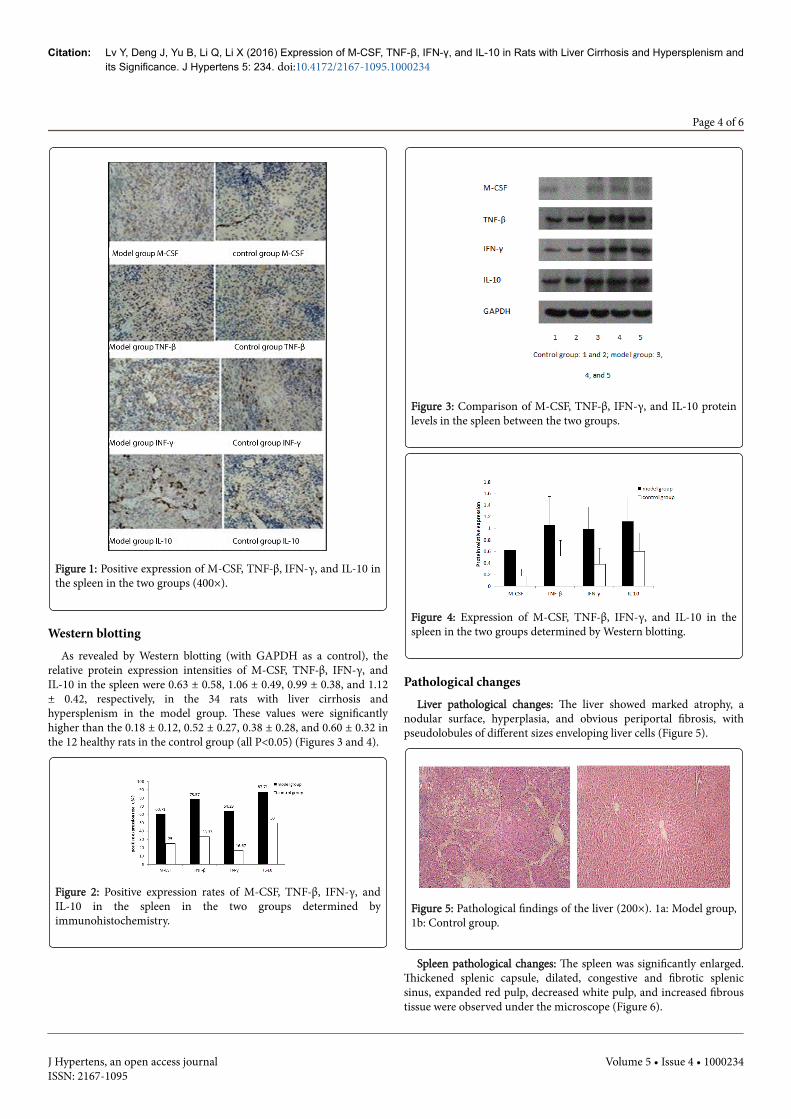
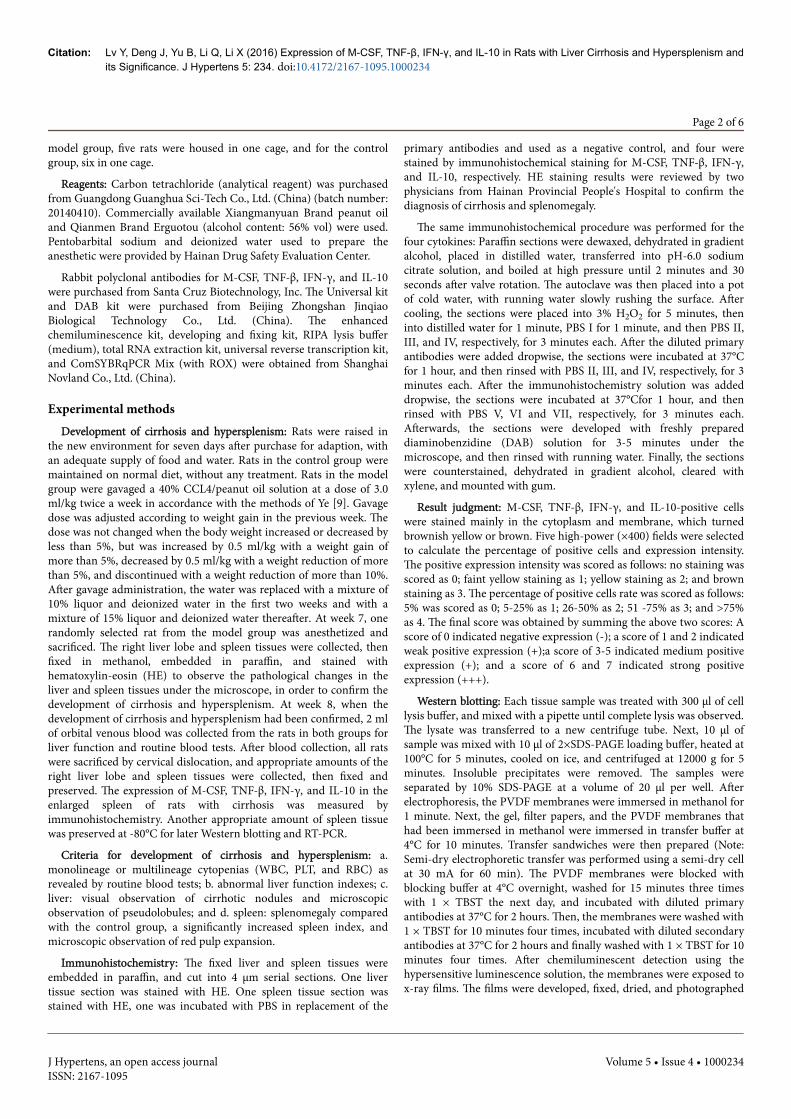
Figure 1: Positive expression of M-CSF, TNF-β, IFN-γ, and IL-10 inthe spleen in the two groups (400×).
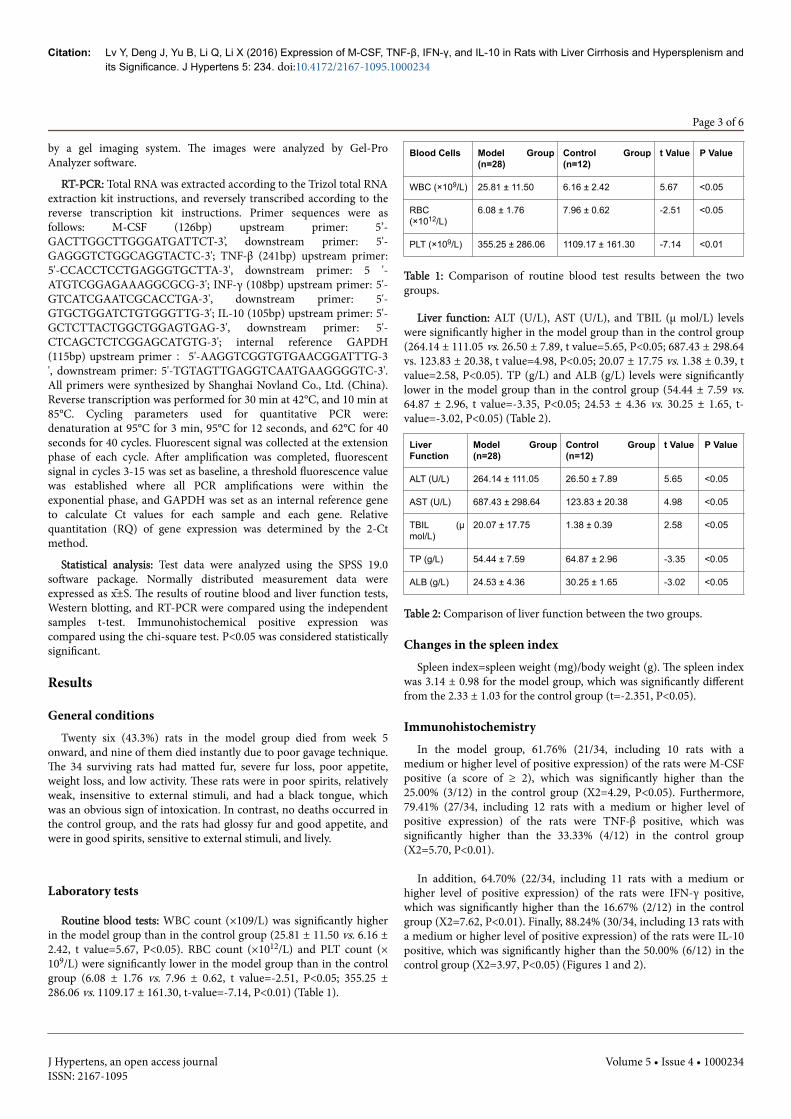
Western blottingAs revealed by Western blotting (with GAPDH as a control), the
relative protein expression intensities of M-CSF, TNF-β, IFN-γ, andIL-10 in the spleen were 0.63 ± 0.58, 1.06 ± 0.49, 0.99 ± 0.38, and 1.12± 0.42, respectively, in the 34 rats with liver cirrhosis andhypersplenism in the model group. These values were significantlyhigher than the 0.18 ± 0.12, 0.52 ± 0.27, 0.38 ± 0.28, and 0.60 ± 0.32 inthe 12 healthy rats in the control group (all P<0.05) (Figures 3 and 4).
Figure 2: Positive expression rates of M-CSF, TNF-β, IFN-γ, andIL-10 in the spleen in the two groups determined byimmunohistochemistry.
Figure 3: Comparison of M-CSF, TNF-β, IFN-γ, and IL-10 proteinlevels in the spleen between the two groups.
Figure 4: Expression of M-CSF, TNF-β, IFN-γ, and IL-10 in thespleen in the two groups determined by Western blotting.
Pathological changesLiver pathological changes: The liver showed marked atrophy, a
nodular surface, hyperplasia, and obvious periportal fibrosis, withpseudolobules of different sizes enveloping liver cells (Figure 5).
Figure 5: Pathological findings of the liver (200×). 1a: Model group,1b: Control group.
Spleen pathological changes: The spleen was significantly enlarged.Thickened splenic capsule, dilated, congestive and fibrotic splenicsinus, expanded red pulp, decreased white pulp, and increased fibroustissue were observed under the microscope (Figure 6).
Citation: Lv Y, Deng J, Yu B, Li Q, Li X (2016) Expression of M-CSF, TNF-β, IFN-γ, and IL-10 in Rats with Liver Cirrhosis and Hypersplenism andits Significance. J Hypertens 5: 234. doi:10.4172/2167-1095.1000234
Page 4 of 6
J Hypertens, an open access journalISSN: 2167-1095
Volume 5 • Issue 4 • 1000234
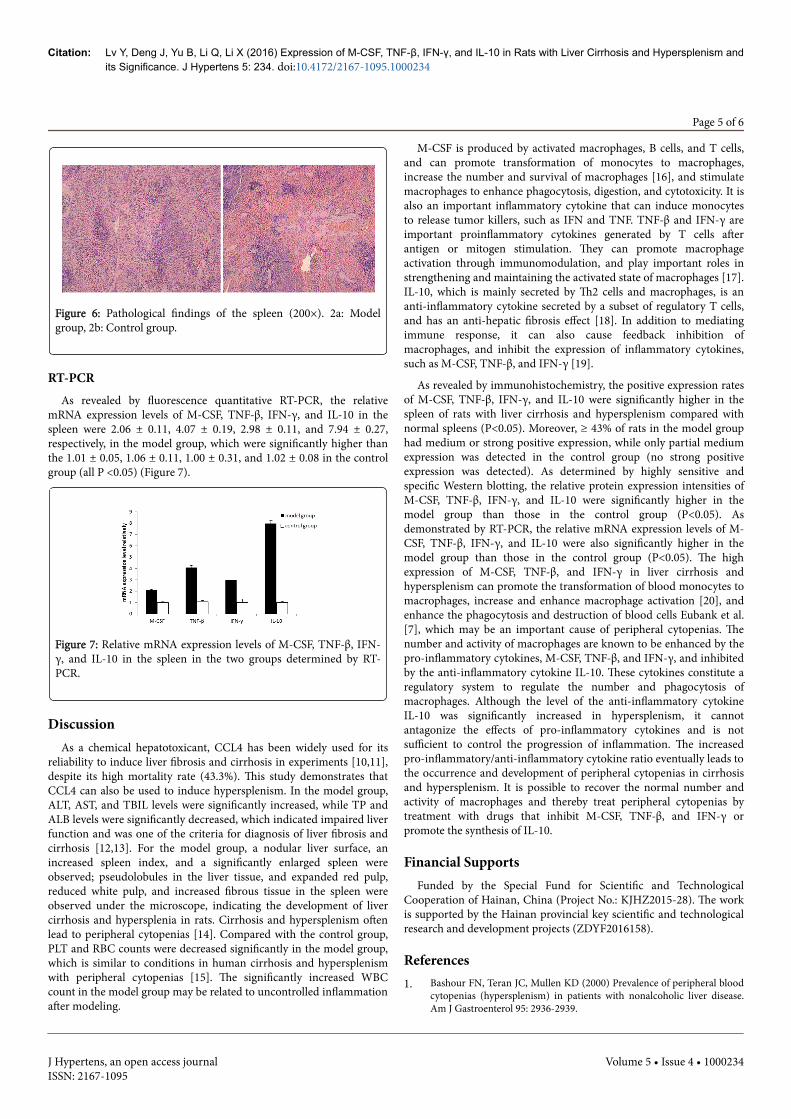
Figure 6: Pathological findings of the spleen (200×). 2a: Modelgroup, 2b: Control group.
RT-PCRAs revealed by fluorescence quantitative RT-PCR, the relative
mRNA expression levels of M-CSF, TNF-β, IFN-γ, and IL-10 in thespleen were 2.06 ± 0.11, 4.07 ± 0.19, 2.98 ± 0.11, and 7.94 ± 0.27,respectively, in the model group, which were significantly higher thanthe 1.01 ± 0.05, 1.06 ± 0.11, 1.00 ± 0.31, and 1.02 ± 0.08 in the controlgroup (all P <0.05) (Figure 7).
Figure 7: Relative mRNA expression levels of M-CSF, TNF-β, IFN-γ, and IL-10 in the spleen in the two groups determined by RT-PCR.
DiscussionAs a chemical hepatotoxicant, CCL4 has been widely used for its
reliability to induce liver fibrosis and cirrhosis in experiments [10,11],despite its high mortality rate (43.3%). This study demonstrates thatCCL4 can also be used to induce hypersplenism. In the model group,ALT, AST, and TBIL levels were significantly increased, while TP andALB levels were significantly decreased, which indicated impaired liverfunction and was one of the criteria for diagnosis of liver fibrosis andcirrhosis [12,13]. For the model group, a nodular liver surface, anincreased spleen index, and a significantly enlarged spleen wereobserved; pseudolobules in the liver tissue, and expanded red pulp,reduced white pulp, and increased fibrous tissue in the spleen wereobserved under the microscope, indicating the development of livercirrhosis and hypersplenia in rats. Cirrhosis and hypersplenism oftenlead to peripheral cytopenias [14]. Compared with the control group,PLT and RBC counts were decreased significantly in the model group,which is similar to conditions in human cirrhosis and hypersplenismwith peripheral cytopenias [15]. The significantly increased WBCcount in the model group may be related to uncontrolled inflammationafter modeling.
M-CSF is produced by activated macrophages, B cells, and T cells,and can promote transformation of monocytes to macrophages,increase the number and survival of macrophages [16], and stimulatemacrophages to enhance phagocytosis, digestion, and cytotoxicity. It isalso an important inflammatory cytokine that can induce monocytesto release tumor killers, such as IFN and TNF. TNF-β and IFN-γ areimportant proinflammatory cytokines generated by T cells afterantigen or mitogen stimulation. They can promote macrophageactivation through immunomodulation, and play important roles instrengthening and maintaining the activated state of macrophages [17].IL-10, which is mainly secreted by Th2 cells and macrophages, is ananti-inflammatory cytokine secreted by a subset of regulatory T cells,and has an anti-hepatic fibrosis effect [18]. In addition to mediatingimmune response, it can also cause feedback inhibition ofmacrophages, and inhibit the expression of inflammatory cytokines,such as M-CSF, TNF-β, and IFN-γ [19].
As revealed by immunohistochemistry, the positive expression ratesof M-CSF, TNF-β, IFN-γ, and IL-10 were significantly higher in thespleen of rats with liver cirrhosis and hypersplenism compared withnormal spleens (P<0.05). Moreover, ≥ 43% of rats in the model grouphad medium or strong positive expression, while only partial mediumexpression was detected in the control group (no strong positiveexpression was detected). As determined by highly sensitive andspecific Western blotting, the relative protein expression intensities ofM-CSF, TNF-β, IFN-γ, and IL-10 were significantly higher in themodel group than those in the control group (P<0.05). Asdemonstrated by RT-PCR, the relative mRNA expression levels of M-CSF, TNF-β, IFN-γ, and IL-10 were also significantly higher in themodel group than those in the control group (P<0.05). The highexpression of M-CSF, TNF-β, and IFN-γ in liver cirrhosis andhypersplenism can promote the transformation of blood monocytes tomacrophages, increase and enhance macrophage activation [20], andenhance the phagocytosis and destruction of blood cells Eubank et al.[7], which may be an important cause of peripheral cytopenias. Thenumber and activity of macrophages are known to be enhanced by thepro-inflammatory cytokines, M-CSF, TNF-β, and IFN-γ, and inhibitedby the anti-inflammatory cytokine IL-10. These cytokines constitute aregulatory system to regulate the number and phagocytosis ofmacrophages. Although the level of the anti-inflammatory cytokineIL-10 was significantly increased in hypersplenism, it cannotantagonize the effects of pro-inflammatory cytokines and is notsufficient to control the progression of inflammation. The increasedpro-inflammatory/anti-inflammatory cytokine ratio eventually leads tothe occurrence and development of peripheral cytopenias in cirrhosisand hypersplenism. It is possible to recover the normal number andactivity of macrophages and thereby treat peripheral cytopenias bytreatment with drugs that inhibit M-CSF, TNF-β, and IFN-γ orpromote the synthesis of IL-10.
Financial SupportsFunded by the Special Fund for Scientific and Technological
Cooperation of Hainan, China (Project No.: KJHZ2015-28). The workis supported by the Hainan provincial key scientific and technologicalresearch and development projects (ZDYF2016158).
References1. Bashour FN, Teran JC, Mullen KD (2000) Prevalence of peripheral blood
cytopenias (hypersplenism) in patients with nonalcoholic liver disease.Am J Gastroenterol 95: 2936-2939.
Citation: Lv Y, Deng J, Yu B, Li Q, Li X (2016) Expression of M-CSF, TNF-β, IFN-γ, and IL-10 in Rats with Liver Cirrhosis and Hypersplenism andits Significance. J Hypertens 5: 234. doi:10.4172/2167-1095.1000234
Page 5 of 6
J Hypertens, an open access journalISSN: 2167-1095
Volume 5 • Issue 4 • 1000234
2. YunfuLv, Xiaoyu Han, Xiaoguang Gong,Qingyong Ma, Shunwu Chang, etal. (2015) Grading of peripheral cytopenias caused by nonalcoholiccirrhotic portal hypertension and its clinical significance. CellBiochemistry and Biophysics 71: 1141-1145.
3. Li ZF, Zhang Y, Gao J (2004) Expression and significance of Toll-likereceptor 4 of splenic macrophage in patients with hypersplenism due toportal hypertension. Zhonghuayixuezazhi 84: 1088-10891.
4. Li ZF, Zhang S (2009) Changes in splenic macrophage function ofhypersplenism due to portal hypertension . Zhonghuawaikezazhi Chinesejournal of surgery 47: 89-91.
5. Jiang A, Zhang S, Li Z (2011) miR-615-3p promotes the phagocyticcapacity of splenic macrophages by targeting ligand-dependent nuclearreceptor corepressor in cirrhosis-related portal hypertension. Exp BiolMed (Maywood) 236: 672-680.
6. Mantovani A, Sica A, Sozzani S (2004) The chemokine system in diverseforms ofmacrophage activation and polarization. Trends Immunol 25:677-686.
7. Eubank TD, Galloway M, Montague CM, Waldman WJ, Marsh CB (2003)M-CSF induces vascular endothelial growth factor production andangiogenic activity from human monocytes. J Immunol 171: 2637-2643.
8. Ma J, Chen T, Mandelin J, Ceponis A, Miller NE, et al. (2003) Regulationof macrophage activation. Cell Mol Life Sci 60: 2334-2346.
9. Ye CH, Liu XY (2005) Study on method of inducing hepatic cirrhosismodel in rats by carbon tetrachloride. Journal of Clinical Research 05:619-622.
10. Zheng L, Chen X, Guo J, Sun H, Liu L, et al. (2012) Differentialexpression of PTEN in hepatic tissue and hepatic stellate cells during ratliver fibrosis and its reversal. Int J Mol Med 30: 1424-1430.
11. Zhang ZG, Lu XB, Xiao L, Tang L, Zhang LJ, et al. (2012) Antioxidanteffects of the Uygur herb, FoeniculumVulgare Mill, in a rat model ofhepatic fibrosis. ZhonghuaGanZang Bing ZaZhi 20: 221-226.
12. Li N, Cui XF, Zhang XL, Pei YH (2014) Liver function test results inpatients with hepatitis B and fatty liver. Clinical Medicine of China 1:51-53.
13. Li TM (2014) Clinical value of combined measurement of six liverfunction indexes in liver disease diagnosis. Guide of China Medicine 29:272.
14. YunfuLv, Xiaoguang Gong, XianheXie, Baochun Wang, Yijun Yang, et al.(2014) Clinical study on the relationship between hematocytopenia andsplenomegaly caused by cirrhotic portal hypertension. Cell BiochemBiophys 70: 355-360.
15. Zapatero MC, Pérez P, Vázquez MJ, Colmenarejo G, Frailes M, et al.(2016) Discovery of novel inhibitors of the tautomeraseactivity ofmacrophage migration inhibitory factor (MIF). J Biomol Screen.
16. Tran DD, Saran S, Dittrich-Breiholz O, Williamsonet AJK, Färber Sk, etal. (2013) Transcriptional regulation of immediate-early gene response byTHOC5, a member of mRNA export complex, contributes to the M-CSF-induced macrophage differentiation. Cell Death Dis 4: e879.
17. Kurihara Y, Furue M (2013) Interferon-gamma enhancesphorbolmyristate acetate-induced cell attachment and tumor necrosisfactor production via the NF-kappaB pathway in THP-1 humanmonocytic cells. Mol Med Rep 7: 1739-1744.
18. Bouzgarrou N, Hassen E, Bahri O, Gabbouj S, Mami NB, et al. (2011)Combined effect of pro- and anti-inflammatory cytokine genepolymorphisms on susceptibility to liver cirrhosis in Tunisian HCV-infected patients. Hepatology International 5: 681-687.
19. Mittal SK, Cho KJ, Ishido S, Roche PA (2015) IL-10 mediatedimmunosuppression: March-I induction regulates antigen presentationby macrophages but not dendritic cells. J Biol Chem 290: 27158-27167.
20. Lu YF, Li XQ, Han XY, Gong XG, Chang SW, et al. (2013) Peripheralblood cell variations in cirrhotic portal hypertension patients withhypersplenism. Asian Pac J Trop Med 6: 663-666.
Citation: Lv Y, Deng J, Yu B, Li Q, Li X (2016) Expression of M-CSF, TNF-β, IFN-γ, and IL-10 in Rats with Liver Cirrhosis and Hypersplenism andits Significance. J Hypertens 5: 234. doi:10.4172/2167-1095.1000234
Page 6 of 6
J Hypertens, an open access journalISSN: 2167-1095
Volume 5 • Issue 4 • 1000234