Multiscale modelling of insulin secretion during an intravenous ...
14
Multiscale modelling of insulin secretion during an intravenous glucose tolerance test Morten Gram Pedersen and Claudio Cobelli Department of Information Engineering University of Padova Via Gradenigo 6/b 35131 Padova, Italy [email protected], [email protected]
Transcript of Multiscale modelling of insulin secretion during an intravenous ...
Multiscale modelling of insulin secretion during anintravenous glucose tolerance test
Morten Gram Pedersen and Claudio Cobelli
Department of Information EngineeringUniversity of Padova
Via Gradenigo 6/b35131 Padova, Italy
Abstract
Dysfunctional insulin secretion from pancreatic β-cells plays a major rolein the development of diabetes. The intravenous glucose tolerance test(IVGTT) is a widely used clinical test to assess beta-cell function. The anal-ysis of IVGTT data is conveniently performed using mathematical models,which need to be fairly simple to enable parameter identifiability (minimalmodels), but should at the same time have sound biological foundation at thecellular level. Using mathematical analysis and model reduction, we showhere that our recent mathematical model of insulin secretory granule dy-namics in β-cells provides mechanistic underpinning for our minimal modelof pancreatic insulin secretion during an IVGTT.
Running title: Multiscale IVGTT insulin secretion
Keywords: beta-cell function – C-peptide secretion – mathematical models– secretory granules
Introduction
The glucose-lowering hormone insulin is secreted from pancreatic β-cells inresponse to elevated glucose levels. It is now widely accepted that insufficientinsulin secretion plays a major role in the pathogenesis of the metabolicdisease diabetes [1], characterized by elevated plasma glucose levels, whichleads to severe complications.
The intravenous glucose tolerance test (IVGTT) is a commonly usedclinical approach to study beta-cell function. The technique consists of theinjection of a glucose bolus and frequent sampling of plasma glucose andinsulin or C-peptide concentrations. Often, the acute insulin response (AIR)calculated as the area under the insulin curve during the first 10 minutes af-ter the glucose bolus is taken as a measure of β-cell function [2], but the AIRdoes also reflect hepatic extraction of insulin. C-peptide is secreted equimo-larly with insulin, and has the benefit that in contrast to insulin it is notcleared in the liver, and thus, C-peptide data directly reflects secretion fromβ-cells whereas insulin samples only carry information of the combination ofsecretion and hepatic extraction.
Minimal models are useful tools for the study of IVGTT data by esti-mating parameters from model fitting to the observed data [3–5], and canprovide a fuller picture of β-cell function than the AIR index, in particularwhen based on C-peptide measurements [5, 6]. These models must be fairlysimple to allow parameter identification, but should at the same time reflecttruthfully the underlying biology down to the cellular events underlying in-sulin secretion. That is, the models should be minimal in the sense thatfurther reduction would make the model nonphysiological and/or preventand accurate description of the data.
One way to make the coupling between events at different physiologicallevels consists in the use of multiscale modelling. We have previously used[7] such an approach to get insight in the mechanistic interpretation of pa-rameters in models of insulin secretion during the oral glucose tolerance test(OGTT) [8–11], and in a minimal oral model [12] of glucagon-like peptide 1(GLP-1) action on secretion [13].
For this purpose, appropriate cellular models built from a mechanistic de-scription of well-defined subcellular events must be analysed and simplified.Inspired by the earlier phenomenological model by Grodsky [14], we devel-oped a mathematical model of insulin granule dynamics that incorporatedcell-to-cell heterogeneity in the glucose threshold for cell activation and se-cretion [15]. By analysing this model with a multiscale approach, we showedthat the cell-activation threshold distribution underlies the fact that the pan-
1
creas senses not only the glucose concentration but also its rate-of-change,so-called derivative control, in OGTT secretion models [7]. In addition, ourmechanistic model was recently suggested as the core of a bio-inspired arti-ficial pancreas [16], further underlining the need for a thorough multiscaleunderstanding of the cellular model.
Here we follow the multiscale strategy to investigate how the various dy-namical steps of our mechanistic model [15] relates to the minimal modeldescription of IVGTT insulin secretion [5]. We find that the IVGTT modelcan be derived from the cellular model, and in particular that derivative con-trol is negligible during an IVGTT. Our work has some similarities to previ-ous studies [3, 17] that used the early phenomenological model by Grodsky[14] to investigate IVGTT secretion models, but with the advantage thatour mechanistic model [15] is based on experimental data establishing theactivation threshold distribution at the cellular level [18].
Minimal modeling
The minimal model of insulin secretion during an IVGTT proposed by Tof-folo et al. [5] describes the dynamics of a pool of releasable insulin (X) refilledby a delayed process (Y ) in response to a given glucose profile (G) as follows:
dX
dt= Y −mX, X(0) = X0, (1a)
d Y
dt= α(max{0, β(G− h)} − Y ), Y (0) = 0, (1b)
where secretion occurs with rate
SR = mX + SRb. (2)
Here, m is the rate constant of secretion, α determines the delay in Y , β setsthe slope of the glucose-dependence of Y , h is the corresponding off-set belowwhich only basal secretion is active, and SRb is the basal rate of secretion,assumed to be glucose-independent.
Cellular modeling
The mechanistic model [15] describes the dynamics of granule pools in a het-erogeneous β-cell population as outlined in Fig. 1. Granules are assumed tobe mobilized to a pool of granules docked to the plasma membrane (D) from
2
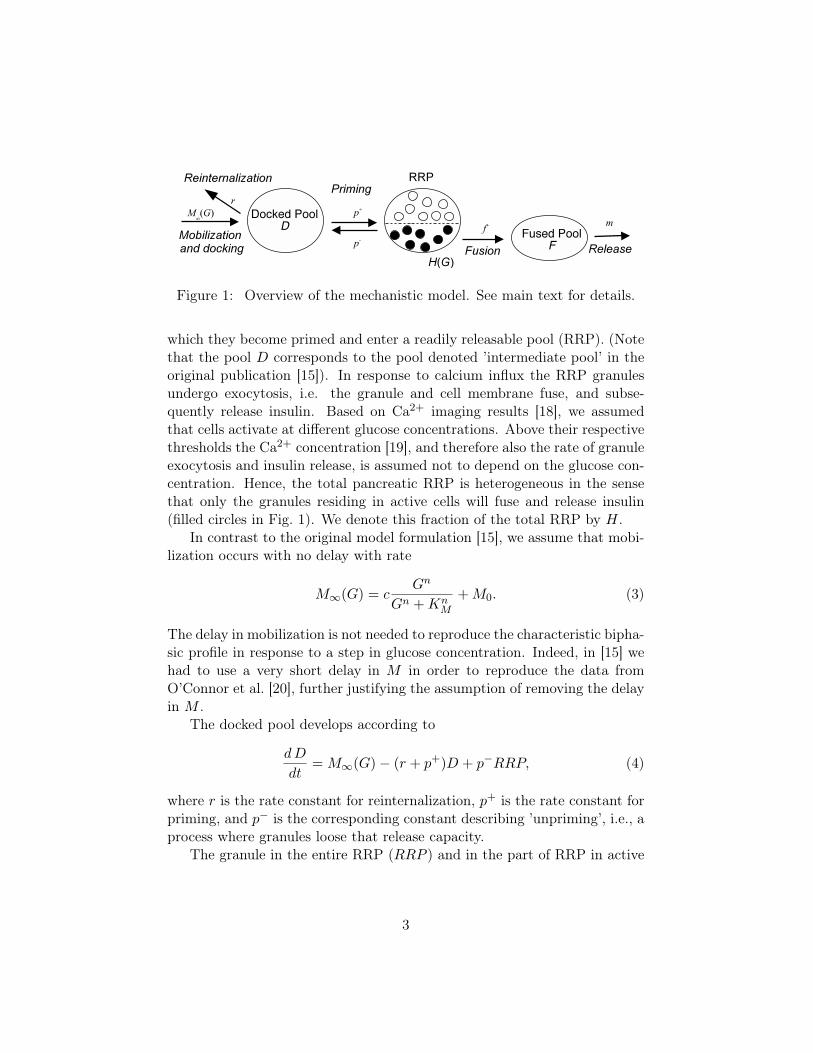
Figure 1: Overview of the mechanistic model. See main text for details.
which they become primed and enter a readily releasable pool (RRP). (Notethat the pool D corresponds to the pool denoted ’intermediate pool’ in theoriginal publication [15]). In response to calcium influx the RRP granulesundergo exocytosis, i.e. the granule and cell membrane fuse, and subse-quently release insulin. Based on Ca2+ imaging results [18], we assumedthat cells activate at different glucose concentrations. Above their respectivethresholds the Ca2+ concentration [19], and therefore also the rate of granuleexocytosis and insulin release, is assumed not to depend on the glucose con-centration. Hence, the total pancreatic RRP is heterogeneous in the sensethat only the granules residing in active cells will fuse and release insulin(filled circles in Fig. 1). We denote this fraction of the total RRP by H.
In contrast to the original model formulation [15], we assume that mobi-lization occurs with no delay with rate
M∞(G) = cGn
Gn +KnM
+M0. (3)
The delay in mobilization is not needed to reproduce the characteristic bipha-sic profile in response to a step in glucose concentration. Indeed, in [15] wehad to use a very short delay in M in order to reproduce the data fromO’Connor et al. [20], further justifying the assumption of removing the delayin M .
The docked pool develops according to
dD
dt= M∞(G)− (r + p+)D + p−RRP, (4)
where r is the rate constant for reinternalization, p+ is the rate constant forpriming, and p− is the corresponding constant describing ’unpriming’, i.e., aprocess where granules loose that release capacity.
The granule in the entire RRP (RRP ) and in the part of RRP in active
3
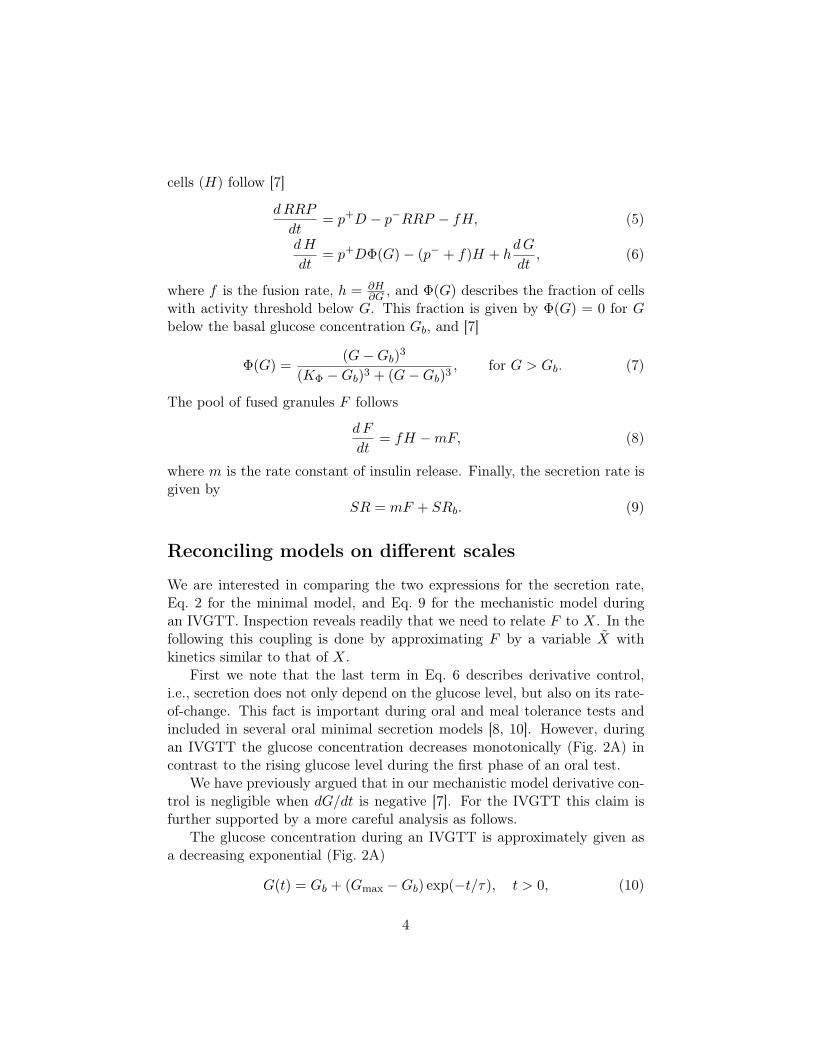
cells (H) follow [7]
dRRP
dt= p+D − p−RRP − fH, (5)
dH
dt= p+DΦ(G)− (p− + f)H + h
dG
dt, (6)
where f is the fusion rate, h = ∂H∂G , and Φ(G) describes the fraction of cells
with activity threshold below G. This fraction is given by Φ(G) = 0 for Gbelow the basal glucose concentration Gb, and [7]
Φ(G) =(G−Gb)
3
(KΦ −Gb)3 + (G−Gb)3, for G > Gb. (7)
The pool of fused granules F follows
dF
dt= fH −mF, (8)
where m is the rate constant of insulin release. Finally, the secretion rate isgiven by
SR = mF + SRb. (9)
Reconciling models on different scales
We are interested in comparing the two expressions for the secretion rate,Eq. 2 for the minimal model, and Eq. 9 for the mechanistic model duringan IVGTT. Inspection reveals readily that we need to relate F to X. In thefollowing this coupling is done by approximating F by a variable X withkinetics similar to that of X.
First we note that the last term in Eq. 6 describes derivative control,i.e., secretion does not only depend on the glucose level, but also on its rate-of-change. This fact is important during oral and meal tolerance tests andincluded in several oral minimal secretion models [8, 10]. However, duringan IVGTT the glucose concentration decreases monotonically (Fig. 2A) incontrast to the rising glucose level during the first phase of an oral test.
We have previously argued that in our mechanistic model derivative con-trol is negligible when dG/dt is negative [7]. For the IVGTT this claim isfurther supported by a more careful analysis as follows.
The glucose concentration during an IVGTT is approximately given asa decreasing exponential (Fig. 2A)
G(t) = Gb + (Gmax −Gb) exp(−t/τ), t > 0, (10)
4
where Gb is the basal glucose concentration, Gmax is the maximal glucoseconcentration reached shortly after the delivery of glucose bolus at timet = 0, and τ ≈ 30 minutes is a time-constant describing the decay of theglucose concentration. Equivalently, we can describe the glucose profile by
dG
dt= −G−Gb
τ, G(0) = Gmax. (11)
The fraction of the RRP with glucose threshold equal to g is h(g) =∂H∂G |G=g, and for g < G it is described by [7, 15]
d h(g)
dt= p+Dφ(g)− (p− + f)h(g), (12)
where φ(g) = dΦdG |G=g. The time-constant for this equation is 1/(p− + f),
which is of the order of seconds because of rapid fusion, much faster thanthe other kinetic processes in the model as well as the glucose time-scale τ .Thus, Eq. 12 is in a quasi steady-state, which yields
h(g) ≈ p+Dφ(g)
p− + f. (13)
By integration, we obtain immediately
H(G) ≈ p+DΦ(G)
p− + f. (14)
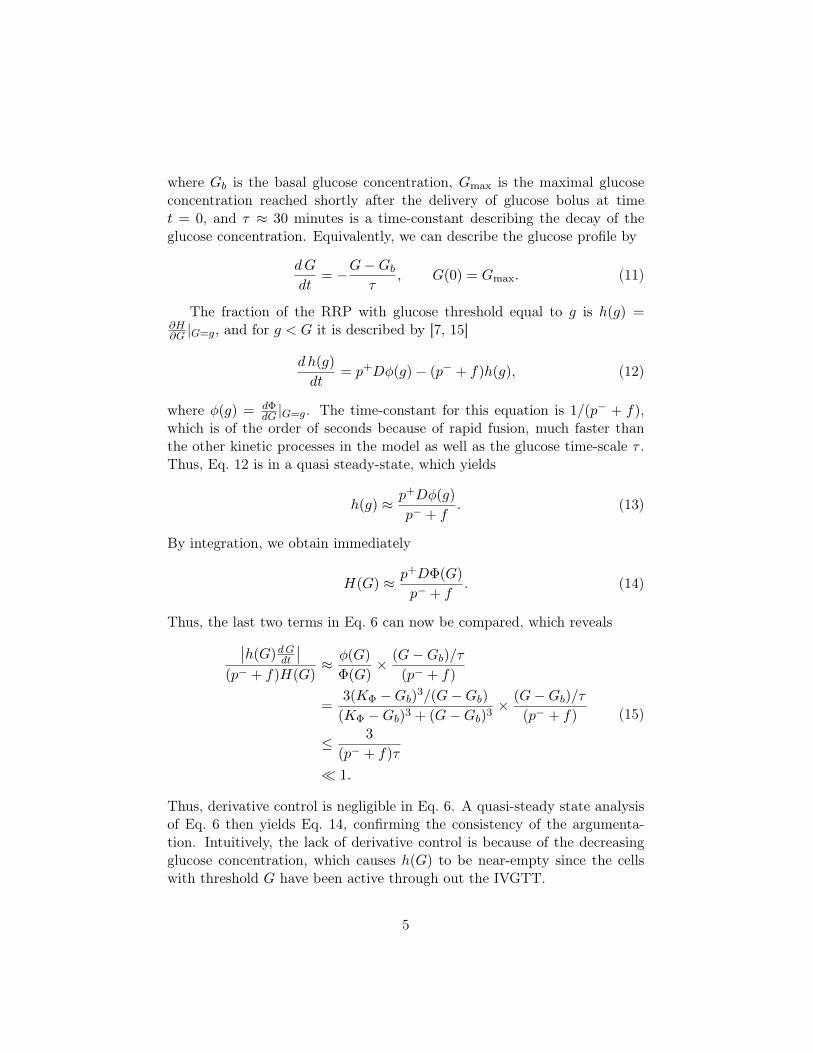
Thus, the last two terms in Eq. 6 can now be compared, which reveals∣∣h(G)dGdt∣∣
(p− + f)H(G)≈ φ(G)
Φ(G)× (G−Gb)/τ
(p− + f)
=3(KΦ −Gb)
3/(G−Gb)
(KΦ −Gb)3 + (G−Gb)3× (G−Gb)/τ
(p− + f)
≤ 3
(p− + f)τ
� 1.
(15)
Thus, derivative control is negligible in Eq. 6. A quasi-steady state analysisof Eq. 6 then yields Eq. 14, confirming the consistency of the argumenta-tion. Intuitively, the lack of derivative control is because of the decreasingglucose concentration, which causes h(G) to be near-empty since the cellswith threshold G have been active through out the IVGTT.
5
0 20 60 100
05
15
t (min)
G (m
M)
A
0 20 60 100
020
40
t (min)F
(µg)
B
0 5 10 15 20
04
8
G (mM)
Y∞ (µ
g/m
in)
C
0 5 10 15 20
0.06
0.08
0.10
G (mM)
α (min−1)
D
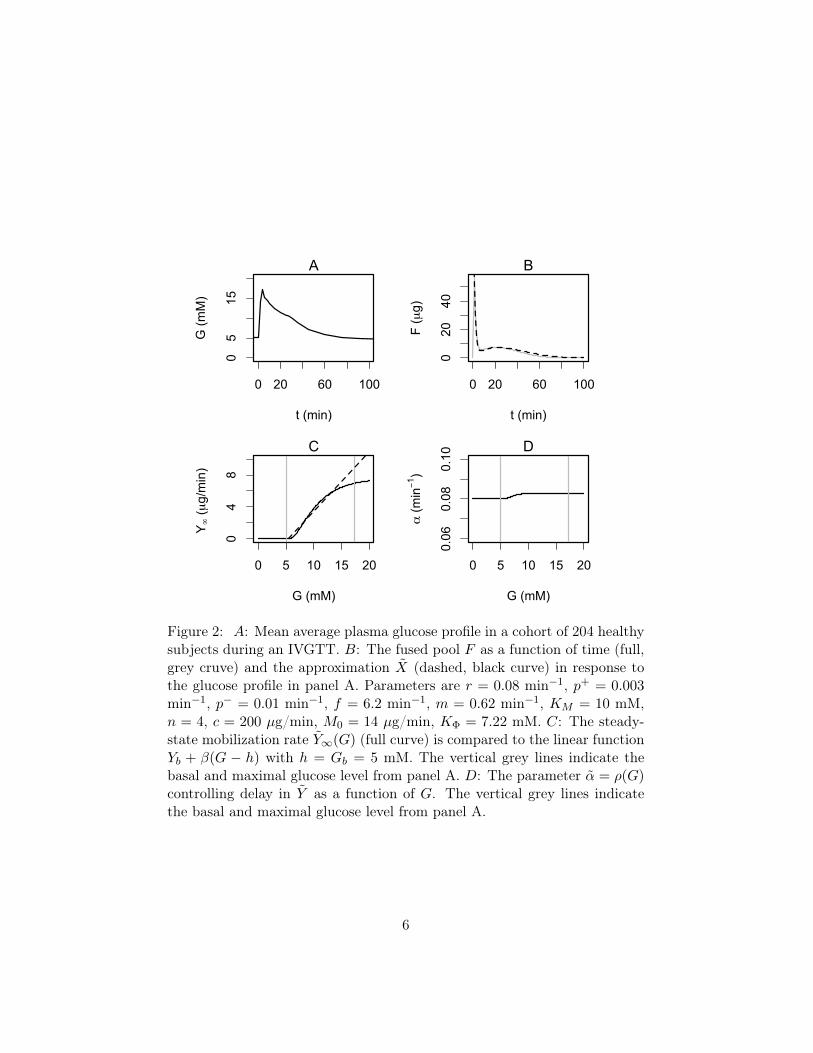
Figure 2: A: Mean average plasma glucose profile in a cohort of 204 healthysubjects during an IVGTT. B: The fused pool F as a function of time (full,grey cruve) and the approximation X (dashed, black curve) in response tothe glucose profile in panel A. Parameters are r = 0.08 min−1, p+ = 0.003min−1, p− = 0.01 min−1, f = 6.2 min−1, m = 0.62 min−1, KM = 10 mM,n = 4, c = 200 µg/min, M0 = 14 µg/min, KΦ = 7.22 mM. C: The steady-state mobilization rate Y∞(G) (full curve) is compared to the linear functionYb + β(G − h) with h = Gb = 5 mM. The vertical grey lines indicate thebasal and maximal glucose level from panel A. D: The parameter α = ρ(G)controlling delay in Y as a function of G. The vertical grey lines indicatethe basal and maximal glucose level from panel A.
6
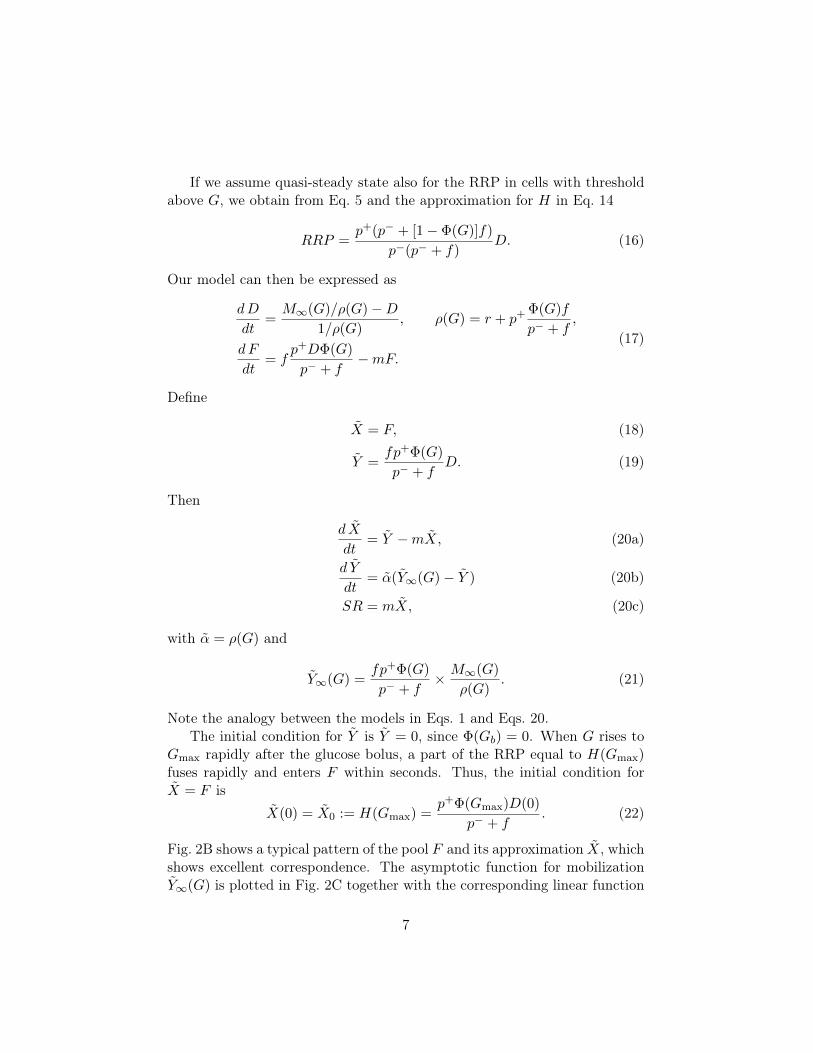
If we assume quasi-steady state also for the RRP in cells with thresholdabove G, we obtain from Eq. 5 and the approximation for H in Eq. 14
RRP =p+(p− + [1− Φ(G)]f)
p−(p− + f)D. (16)
Our model can then be expressed as
dD
dt=M∞(G)/ρ(G)−D
1/ρ(G), ρ(G) = r + p+ Φ(G)f
p− + f,
d F
dt= f
p+DΦ(G)
p− + f−mF.
(17)
Define
X = F, (18)
Y =fp+Φ(G)
p− + fD. (19)
Then
d X
dt= Y −mX, (20a)
d Y
dt= α(Y∞(G)− Y ) (20b)
SR = mX, (20c)
with α = ρ(G) and
Y∞(G) =fp+Φ(G)
p− + f× M∞(G)
ρ(G). (21)
Note the analogy between the models in Eqs. 1 and Eqs. 20.The initial condition for Y is Y = 0, since Φ(Gb) = 0. When G rises to
Gmax rapidly after the glucose bolus, a part of the RRP equal to H(Gmax)fuses rapidly and enters F within seconds. Thus, the initial condition forX = F is
X(0) = X0 := H(Gmax) =p+Φ(Gmax)D(0)
p− + f. (22)
Fig. 2B shows a typical pattern of the pool F and its approximation X, whichshows excellent correspondence. The asymptotic function for mobilizationY∞(G) is plotted in Fig. 2C together with the corresponding linear function
7
max{0, β(G − h)} from Eq. 1b. Note the good correspondence over mostof the glucose range attained during an IVGTT (indicated by vertical greylines).
The minimal model in Eqs. 1 has a constant delay 1/α whereas the delay1/α in Eq. 20 depends on G. However, α is nearly constant (Fig. 2C) sincer is an order of magnitude greater than p+, justifying the minimal modelassumption of constant delay. With the parameters used here, we find thatthe delay 1/α is of the order of 12 minutes, in reasonable agreement withToffolo et al. [5], who found a delay of approximately 15 minutes.
Discussion
The biology underlying insulin secretion during an IVGTT or an OGTT isobviously the same, while the minimal secretion models, although similar,are not identical. We have here shown that our model description of the cel-lular events underlying glucose-stimulated insulin secretion [15] simplifies toour IVGTT minimal model [5] when the β-cells respond to a IVGTT glucoseprofile. Similarly, in our previous work [7] we showed that the β-cell model[15] reduces to our OGTT minimal secretion model [8] when subjected to atypical glucose stimulus seen during an OGTT. Thus, depending on the clin-ical setting, a single mechanistic β-cell model simplify to either the IVGTTor the OGTT minimal secretion models needed for parameter identifiabilityin tests of β-cell function. This fact justifies on one hand the differencesbetween the two minimal models that represent the same underlying biologybut under different conditions, and on the other hand highlights why the twominimal models have a structural similarity.
We found that the delay parameter α is nearly constant and, surpris-ingly, approximately equal to the reinternalization rate r. The parameterα reflects the time needed for the docked pool D to respond to changes inD (see Eq. 17), and when granule movement to and from the membrane issubstantial, this time-constant is mainly controlled by the reinternalizationrate. A recent study using TIRF imaging experiments has indeed suggestedsuch frequent movement [21].
The minimal model parameter X0 corresponds to the amount of the RRPthat is released when glucose increases to Gmax (Eq. 22), and the first-phaseindex Φ1 = X0/(Gmax−Gb) is hence related to the function h = ∂H/∂G. Forthe OGTT minimal model, we found a similar relation between the dynamicindex ΦD and the function h, again reflecting that the two minimal modelsshare similarities because they are reflecting the same underlying biology.
8
Finally, the parameter β in Eq. 1 is approximately equal to dY∞(G)/dG(see Fig. 2C). Using that f � p− and ρ(G) ≈ r, we find that
β ≈ dY∞(G)
dG≈ p+
r
d
dG[Φ(G)M∞(G)] . (23)
Hence, the second phase index Φ2 = β reflects the combined effect of mobi-lization, cell recruitment and the strength of priming versus reinternalization,i.e., the net effect of the processes that lead to an increased amount of readilyreleasable insulin.
Our cellular model describes the dynamics of secretory granule pools, butdoes not include time-varying signals that might contribute to the secretoryprofiles [20]. In particular, the model does not consider Ca2+ dynamics,which is known to have complex temporal patterns with a first phase ofraised cytosolic Ca2+ concentrations followed by oscillations [22]. It is mostlikely that both granule pool dynamics and Ca2+ patterns contribute to thetypical biphasic secretion patterns seen after a rapid rise in glucose [23],such as following the glucose bolus in the IVGTT, as well as other secretionprofiles. It will be interesting to investigate the relative contribution ofCa2+ vs. granule pool dynamics to IVGTT and OGTT insulin secretionprofiles following the multiscale ideas presented in [7] and in the presentmanuscript. Moreover, to obtain deeper insight in the cellular control ofclinically relevant secretion patterns, it might be favourable to add anotherlayer to the multiscale approach by using mathematical models, preferablybased on data from human β-cells, of glucose control of electrical activity[24], and of Ca2+ and exocytosis [25].
References
1. Kahn, S. E., 2003. The relative contributions of insulin resistance andbeta-cell dysfunction to the pathophysiology of Type 2 diabetes. Dia-betologia 46:3–19. http://dx.doi.org/10.1007/s00125-002-1009-0.
2. Kahn, S. E., R. L. Prigeon, D. K. McCulloch, E. J. Boyko, R. N.Bergman, M. W. Schwartz, J. L. Neifing, W. K. Ward, J. C. Beard,and J. P. Palmer, 1993. Quantification of the relationship between in-sulin sensitivity and beta-cell function in human subjects. Evidence fora hyperbolic function. Diabetes 42:1663–72. http://dx.doi.org/10.2337/diab.42.11.1663.
3. Ličko, V., and A. Silvers, 1975. Open-loop glucose-insulin control with
9
threshold secretory mechanism: Analysis of intravenous glucose toler-ance tests in man. Math Biosci 27:319–332. http://dx.doi.org/10.1016/0025-5564(75)90110-8.
4. Toffolo, G., R. N. Bergman, D. T. Finegood, C. R. Bowden, and C. Co-belli, 1980. Quantitative estimation of beta cell sensitivity to glucosein the intact organism: a minimal model of insulin kinetics in the dog.Diabetes 29:979–90. http://dx.doi.org/10.2337/diab.29.12.979.
5. Toffolo, G., F. D. Grandi, and C. Cobelli, 1995. Estimation of beta-cell sensitivity from intravenous glucose tolerance test C-peptide data.Knowledge of the kinetics avoids errors in modeling the secretion. Dia-betes 44:845–854. http://dx.doi.org/10.2337/diab.44.7.845.
6. Cobelli, C., G. M. Toffolo, C. D. Man, M. Campioni, P. Denti, A. Caumo,P. Butler, and R. Rizza, 2007. Assessment of beta-cell function in hu-mans, simultaneously with insulin sensitivity and hepatic extraction,from intravenous and oral glucose tests. Am J Physiol Endocrinol Metab293:E1–E15. http://dx.doi.org/10.1152/ajpendo.00421.2006.
7. Pedersen, M. G., G. M. Toffolo, and C. Cobelli, 2010. Cellular model-ing: insight into oral minimal models of insulin secretion. Am J Phys-iol Endocrinol Metab 298:E597–E601. http://dx.doi.org/10.1152/ajpendo.00670.2009.
8. Breda, E., M. K. Cavaghan, G. Toffolo, K. S. Polonsky, and C. Cobelli,2001. Oral glucose tolerance test minimal model indexes of beta-cellfunction and insulin sensitivity. Diabetes 50:150–158. http://dx.doi.org/10.2337/diabetes.50.1.150.
9. Cretti, A., M. Lehtovirta, E. Bonora, B. Brunato, M. G. Zenti, F. Tosi,M. Caputo, B. Caruso, L. C. Groop, M. Muggeo, and R. C. Bonadonna,2001. Assessment of beta-cell function during the oral glucose tolerancetest by a minimal model of insulin secretion. Eur J Clin Invest 31:405–16. http://dx.doi.org/10.1046/j.1365-2362.2001.00827.x.
10. Mari, A., O. Schmitz, A. Gastaldelli, T. Oestergaard, B. Nyholm, andE. Ferrannini, 2002. Meal and oral glucose tests for assessment of beta-cell function: modeling analysis in normal subjects. Am J Physiol En-docrinol Metab 283:E1159–66. http://dx.doi.org/10.1152/ajpendo.00093.2002.
10
11. Hovorka, R., L. Chassin, S. D. Luzio, R. Playle, and D. R. Owens,1998. Pancreatic beta-cell responsiveness during meal tolerance test:model assessment in normal subjects and subjects with newly diag-nosed noninsulin-dependent diabetes mellitus. J Clin Endocrinol Metab83:744–50. http://dx.doi.org/10.1210/jc.83.3.744.
12. Dalla Man, C., F. Micheletto, A. Sathananthan, R. A. Rizza, A. Vella,and C. Cobelli, 2010. A model of GLP-1 action on insulin secretion innondiabetic subjects. Am J Physiol Endocrinol Metab 298:E1115–E1121.http://dx.doi.org/10.1152/ajpendo.00705.2009.
13. Pedersen, M. G., C. Dalla Man, and C. Cobelli, 2011. Multiscalemodeling of insulin secretion. IEEE Trans Biomed Eng 58:3020–3.http://dx.doi.org/10.1109/TBME.2011.2164918.
14. Grodsky, G. M., 1972. A threshold distribution hypothesis for packetstorage of insulin and its mathematical modeling. J. Clin. Invest.51:2047–2059. http://dx.doi.org/10.1172/JCI107011.
15. Pedersen, M. G., A. Corradin, G. M. Toffolo, and C. Cobelli, 2008.A subcellular model of glucose-stimulated pancreatic insulin secretion.Philos Transact A Math Phys Eng Sci 366:3525–3543. http://dx.doi.org/10.1098/rsta.2008.0120.
16. Herrero, P., P. Georgiou, N. Oliver, D. G. Johnston, and C. Touma-zou, 2012. A bio-inspired glucose controller based on pancreatic β-cellphysiology. J Diabetes Sci Technol 6:606–16.
17. Overgaard, R. V., J. E. Henriksen, and H. Madsen, 2005. Insights to theminimal model of insulin secretion through a mean-field beta cell model.J Theor Biol 237:382–9. http://dx.doi.org/10.1016/j.jtbi.2005.04.023.
18. Jonkers, F. C., J.-C. Jonas, P. Gilon, and J.-C. Henquin, 1999. Influenceof cell number on the characteristics and synchrony of Ca2+ oscillationsin clusters of mouse pancreatic islet cells. J. Physiol. 520:839–849. http://dx.doi.org/10.1111/j.1469-7793.1999.00839.x.
19. Heart, E., R. F. Corkey, J. D. Wikstrom, O. S. Shirihai, and B. E.Corkey, 2006. Glucose-dependent increase in mitochondrial membranepotential, but not cytoplasmic calcium, correlates with insulin secretionin single islet cells. Am. J. Physiol. Endocrinol. Metab. 290:E143–E148.http://dx.doi.org/10.1152/ajpendo.00216.2005.
11
20. O’Connor, M., H. Landahl, and G. Grodsky, 1980. Comparison ofstorage- and signal-limited models of pancreatic insulin secretion. Am.J. Physiol. 238:R378–R389.
21. Hatlapatka, K., M. Matz, K. Schumacher, K. Baumann, and I. Rusten-beck, 2011. Bidirectional insulin granule turnover in the submembranespace during K(+) depolarization-induced secretion. Traffic 12:1166–78.http://dx.doi.org/10.1111/j.1600-0854.2011.01231.x.
22. Henquin, J. C., 2009. Regulation of insulin secretion: a matter of phasecontrol and amplitude modulation. Diabetologia 52:739–51. http://dx.doi.org/10.1007/s00125-009-1314-y.
23. Pedersen, M. G., and A. Sherman, 2009. Newcomer insulin secretorygranules as a highly calcium-sensitive pool. Proc Natl Acad Sci U S A106:7432–7436. http://dx.doi.org/10.1073/pnas.0901202106.
24. Pedersen, M. G., 2010. A biophysical model of electrical activity inhuman β-cells. Biophys J 99:3200–3207. http://dx.doi.org/10.1016/j.bpj.2010.09.004.
25. Pedersen, M. G., G. Cortese, and L. Eliasson, 2011. Mathematical mod-eling and statistical analysis of calcium-regulated insulin granule exocy-tosis in β-cells from mice and humans. Prog Biophys Mol Biol 107:257–64. http://dx.doi.org/10.1016/j.pbiomolbio.2011.07.012.
12