MMT Symposium June 14th, 2006 Steven Finkelstein (ASU)1 The Nature of High Equivalent- Width...
27
MMT Symposium June 14th, MMT Symposium June 14th, 2006 Steven Finkelstei 2006 Steven Finkelstei n (ASU) n (ASU) 1 The Nature of High The Nature of High Equivalent-Width Lyman- Equivalent-Width Lyman- α α Galaxies Galaxies Steven Finkelstein, James Rhoads, Steven Finkelstein, James Rhoads, Sangeeta Malhotra (ASU), Norbert Sangeeta Malhotra (ASU), Norbert Pirzkal (STScI) & Junxian Wang (USTC) Pirzkal (STScI) & Junxian Wang (USTC)
-
Upload
lesley-gray -
Category
Documents
-
view
222 -
download
2
Transcript of MMT Symposium June 14th, 2006 Steven Finkelstein (ASU)1 The Nature of High Equivalent- Width...
MMT Symposium June 14th, 200MMT Symposium June 14th, 2006 Steven Finkelstein (ASU)6 Steven Finkelstein (ASU)
11
The Nature of High Equivalent-The Nature of High Equivalent-Width Lyman-Width Lyman-αα Galaxies Galaxies
Steven Finkelstein, James Rhoads, Sangeeta Steven Finkelstein, James Rhoads, Sangeeta Malhotra (ASU), Norbert Pirzkal (STScI) & Malhotra (ASU), Norbert Pirzkal (STScI) &
Junxian Wang (USTC)Junxian Wang (USTC)
MMT Symposium June 14th, 200MMT Symposium June 14th, 2006 Steven Finkelstein (ASU)6 Steven Finkelstein (ASU)
22
OutlineOutline
• Why do we study Lyman Alpha Emitters Why do we study Lyman Alpha Emitters (LAEs) ?(LAEs) ?
• Intro to LALA surveyIntro to LALA survey
• MMT/Megacam data acquisition/reductionMMT/Megacam data acquisition/reduction
• ResultsResults
• DiscussionDiscussion
• Future WorkFuture Work
MMT Symposium June 14th, 200MMT Symposium June 14th, 2006 Steven Finkelstein (ASU)6 Steven Finkelstein (ASU)
33
Lyman Alpha Emitters - Lyman Alpha Emitters - BackgroundBackground
• LyLyαα gives an easy way to spot high-z galaxies gives an easy way to spot high-z galaxies• LyLyαα emission was proposed as a signpost of emission was proposed as a signpost of
primitive galaxies in formation (Partridge & primitive galaxies in formation (Partridge & Peebles 1967)Peebles 1967)
• Past optical and X-ray work show the Past optical and X-ray work show the LyLyαα emission is not powered by AGN (Malhotra et al. emission is not powered by AGN (Malhotra et al. 2003; Dawson et al. 2004).2003; Dawson et al. 2004).
• LyLyαα too narrow to be Type I (broad-lined) AGN too narrow to be Type I (broad-lined) AGN• ChandraChandra data show no X-ray detections of 49 LAEs, so Type data show no X-ray detections of 49 LAEs, so Type
II AGN ruled outII AGN ruled out
MMT Symposium June 14th, 200MMT Symposium June 14th, 2006 Steven Finkelstein (ASU)6 Steven Finkelstein (ASU)
44
Large Area Lyman Alpha (LALA) Large Area Lyman Alpha (LALA) SurveySurvey
• LALA began in 1998 at KPNO (Rhoads et al. 2000)LALA began in 1998 at KPNO (Rhoads et al. 2000)• Final area of 0.72 degFinal area of 0.72 deg22 in two fields, Bo in two fields, Boöötes tes
(14:25:57 +35:32) and Cetus (02:05:20 -04:55).(14:25:57 +35:32) and Cetus (02:05:20 -04:55).• This survey includes broad and narrow band This survey includes broad and narrow band
imaging, as well as spectroscopic data on LAEs.imaging, as well as spectroscopic data on LAEs.• Spectroscopic success rate of up to 70%Spectroscopic success rate of up to 70%• This survey represents ~ 40 nights on the Kitt Peak This survey represents ~ 40 nights on the Kitt Peak
4m, 8 nights on Keck, 7 nights (so far) on the MMT, 4m, 8 nights on Keck, 7 nights (so far) on the MMT, and ongoing programs at the Magellan Observatory.and ongoing programs at the Magellan Observatory.
• 12+ published papers12+ published papers
MMT Symposium June 14th, 200MMT Symposium June 14th, 2006 Steven Finkelstein (ASU)6 Steven Finkelstein (ASU)
55
What is causing the emission?What is causing the emission?
• EW ~ 80 Å for a normal stellar populationEW ~ 80 Å for a normal stellar population• Malhotra and Rhoads (2002) found numerous LAEs with Malhotra and Rhoads (2002) found numerous LAEs with
EWs > 200 ÅEWs > 200 Å• Large EW could be produced via star formation if the Large EW could be produced via star formation if the
stellar photospheres were hotter than normalstellar photospheres were hotter than normal– Could be true in:Could be true in:
• Low metallicity galaxiesLow metallicity galaxies• Galaxies with an extreme IMFGalaxies with an extreme IMF
• Both scenarios possible in primitive galaxies, which Both scenarios possible in primitive galaxies, which contain young stars and little dustcontain young stars and little dust
• EW could be enhanced from the geometry of the ISMEW could be enhanced from the geometry of the ISM– Dusty clouds embedded in a tenuous inter-cloud mediumDusty clouds embedded in a tenuous inter-cloud medium
MMT Symposium June 14th, 200MMT Symposium June 14th, 2006 Steven Finkelstein (ASU)6 Steven Finkelstein (ASU)
66
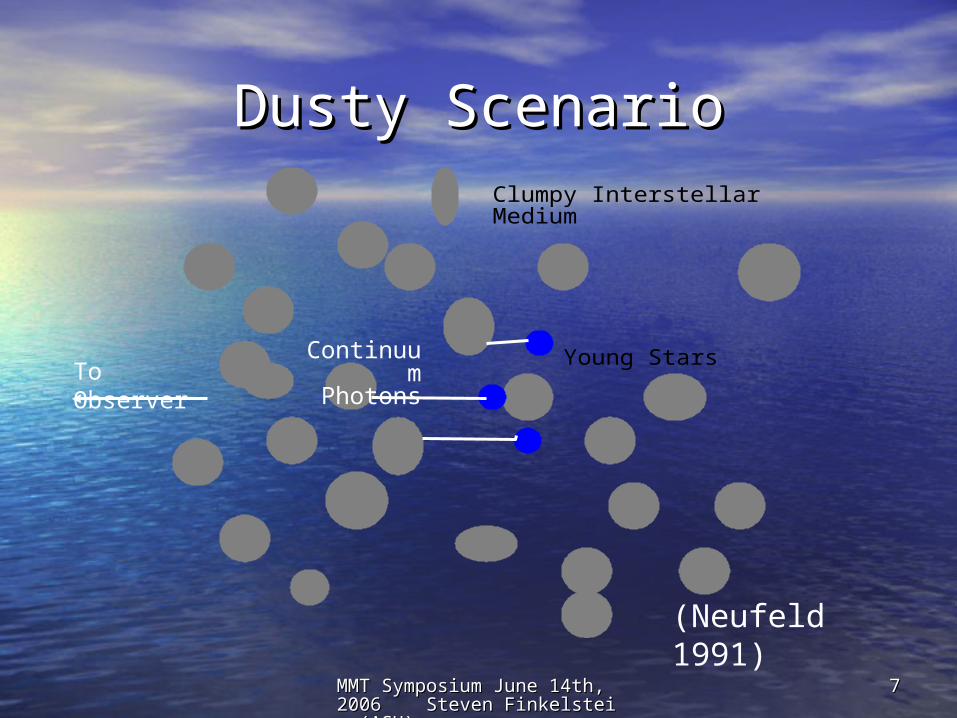
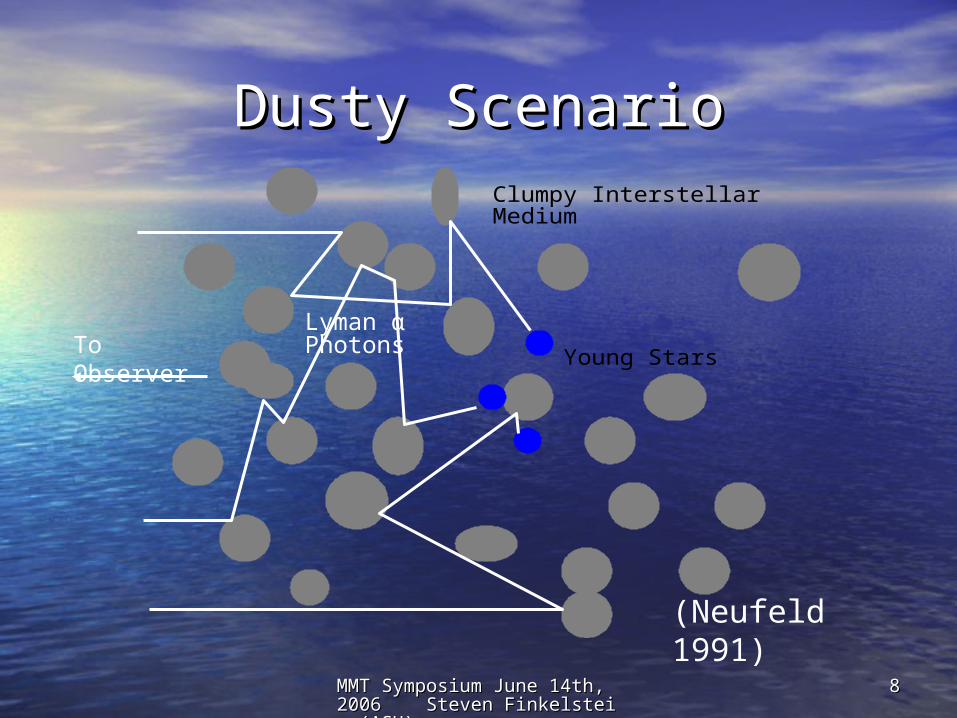
Dusty ScenarioDusty Scenario
• If the dust is primarily in cold neutral clouds:If the dust is primarily in cold neutral clouds:• LyLyαα photons scatter of the clouds and spent most of their photons scatter of the clouds and spent most of their
time in the inter-cloud mediumtime in the inter-cloud medium ICM hot, mainly ionizedICM hot, mainly ionized
• Continuum photons penetrate deep into the clouds and suffer Continuum photons penetrate deep into the clouds and suffer greater extinction (Neufeld 1991; Hansen & Oh 2006)greater extinction (Neufeld 1991; Hansen & Oh 2006)
• ISM of our Galaxy is known to be clumpy ISM of our Galaxy is known to be clumpy down to small scalesdown to small scales
• If the continuum is more absorbed than If the continuum is more absorbed than the the LyLyαα photons, than the transmitted EW is photons, than the transmitted EW is larger than the source EWlarger than the source EW
MMT Symposium June 14th, 200MMT Symposium June 14th, 2006 Steven Finkelstein (ASU)6 Steven Finkelstein (ASU)
77
Dusty ScenarioDusty ScenarioClumpy InterstellarMedium
Young StarsContinuum PhotonsTo Observer
(Neufeld 1991)
MMT Symposium June 14th, 200MMT Symposium June 14th, 2006 Steven Finkelstein (ASU)6 Steven Finkelstein (ASU)
88
Dusty ScenarioDusty ScenarioClumpy InterstellarMedium
Young Stars
Lyman α PhotonsTo Observer
(Neufeld 1991)
MMT Symposium June 14th, 200MMT Symposium June 14th, 2006 Steven Finkelstein (ASU)6 Steven Finkelstein (ASU)
99
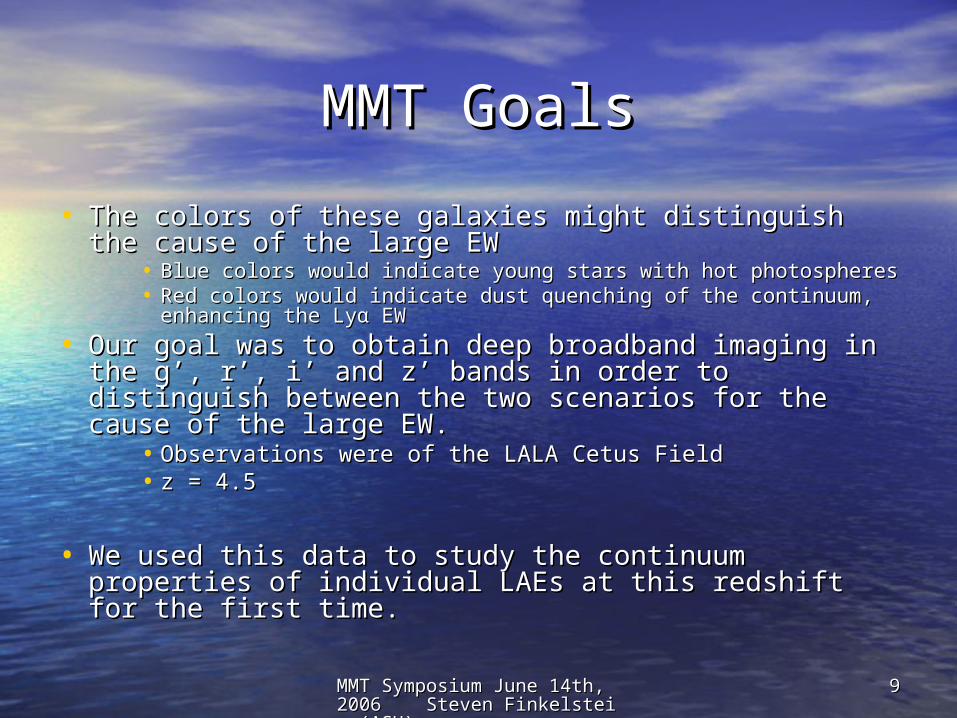
MMT GoalsMMT Goals
• The colors of these galaxies might distinguish the cause The colors of these galaxies might distinguish the cause of the large EWof the large EW
• Blue colors would indicate young stars with hot photospheresBlue colors would indicate young stars with hot photospheres• Red colors would indicate dust quenching of the continuum, Red colors would indicate dust quenching of the continuum,
enhancing the Lyenhancing the Lyαα EW EW
• Our goal was to obtain deep broadband imaging in the Our goal was to obtain deep broadband imaging in the g’, r’, i’ and z’ bands in order to distinguish between the g’, r’, i’ and z’ bands in order to distinguish between the two scenarios for the cause of the large EW.two scenarios for the cause of the large EW.
• Observations were of the LALA Cetus FieldObservations were of the LALA Cetus Field• z = 4.5z = 4.5
• We used this data to study the continuum properties of We used this data to study the continuum properties of individual LAEs at this redshift for the first time.individual LAEs at this redshift for the first time.
MMT Symposium June 14th, 200MMT Symposium June 14th, 2006 Steven Finkelstein (ASU)6 Steven Finkelstein (ASU)
1010
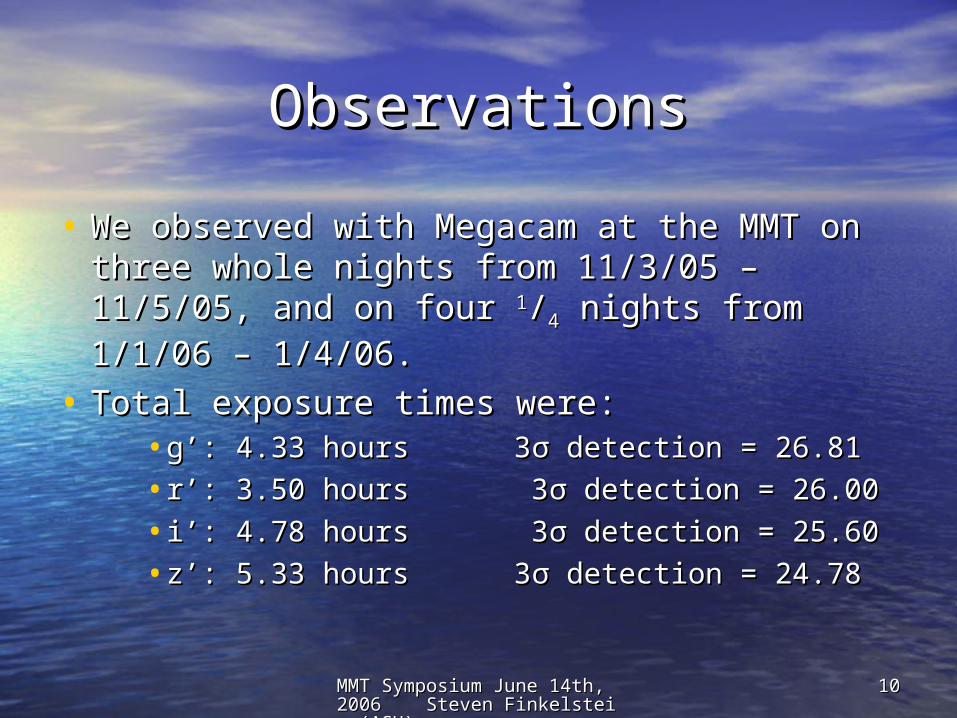
ObservationsObservations
• We observed with Megacam at the MMT on We observed with Megacam at the MMT on three whole nights from 11/3/05 – 11/5/05, and three whole nights from 11/3/05 – 11/5/05, and on four on four 11//44 nights from 1/1/06 – 1/4/06. nights from 1/1/06 – 1/4/06.
• Total exposure times were: Total exposure times were: • g’: 4.33 hours 3g’: 4.33 hours 3σσ detection = 26.81 detection = 26.81
• r’: 3.50 hours 3r’: 3.50 hours 3σσ detection = 26.00 detection = 26.00
• i’: 4.78 hours 3i’: 4.78 hours 3σσ detection = 25.60 detection = 25.60
• z’: 5.33 hours 3z’: 5.33 hours 3σσ detection = 24.78 detection = 24.78
MMT Symposium June 14th, 200MMT Symposium June 14th, 2006 Steven Finkelstein (ASU)6 Steven Finkelstein (ASU)
1111
Data ReductionData Reduction
• We developed a pipeline using the MSCRED (Valdes & We developed a pipeline using the MSCRED (Valdes & Tody 1998; Valdes 1998) and MEGARED (McLeod) Tody 1998; Valdes 1998) and MEGARED (McLeod) packages in IRAF (Tody 1986, 1993) , along with the packages in IRAF (Tody 1986, 1993) , along with the image combining software SWarp (Bertin).image combining software SWarp (Bertin).
• We gave SWarp an input weight map which flagged We gave SWarp an input weight map which flagged the MEGARED bad pixels and cosmic raysthe MEGARED bad pixels and cosmic rays
• Photometric zeropoints calculated in each band Photometric zeropoints calculated in each band using standard stars from Landolt (1992).using standard stars from Landolt (1992).– Used transforms to SDSS bands from Fukugita et al. Used transforms to SDSS bands from Fukugita et al.
(1996).(1996).
MMT Symposium June 14th, 200MMT Symposium June 14th, 2006 Steven Finkelstein (ASU)6 Steven Finkelstein (ASU)
1212
LyLyαα Galaxy Selection Galaxy Selection
• We used narrow band images from LALA to find LAEs at We used narrow band images from LALA to find LAEs at z ~ 4.5z ~ 4.5– 5 filters: 5 filters: λλλλ6559,6611,6650,6695,67306559,6611,6650,6695,6730– FWHM = 80ÅFWHM = 80Å– Redshift coverage 4.37 < z < 4.57Redshift coverage 4.37 < z < 4.57
• Also used broadband data from the NOAO Deep Wide-Also used broadband data from the NOAO Deep Wide-Field Survey (Jannuzi & Dey 1999).Field Survey (Jannuzi & Dey 1999).– Bw, R & IBw, R & I
• Used SExtractor (Bertin & Arnouts 1996) to identify the Used SExtractor (Bertin & Arnouts 1996) to identify the objects and perform photometryobjects and perform photometry
• The Megacam data was registered and remapped onto the The Megacam data was registered and remapped onto the same grid as the narrow band data (0.26 “/pixel). same grid as the narrow band data (0.26 “/pixel).
• SExtractor used a nine pixel (2.32”) apertureSExtractor used a nine pixel (2.32”) aperture
MMT Symposium June 14th, 200MMT Symposium June 14th, 2006 Steven Finkelstein (ASU)6 Steven Finkelstein (ASU)
1313
LyLyαα Galaxy Selection Galaxy Selection
• LyLyαα galaxy detection criteria: galaxy detection criteria:– 55σσ significance detection in the narrowband significance detection in the narrowband
• Calculated using a SExtractor aperture flux with the Calculated using a SExtractor aperture flux with the associated flux error: flux/error ≤ 5.associated flux error: flux/error ≤ 5.
– 44σσ significant excess of narrowband flux significant excess of narrowband flux• Calculated via (narrow flux – broad flux)/sqrt(errorCalculated via (narrow flux – broad flux)/sqrt(errornn
22 + error + errorbb22) )
≥ 4.≥ 4.
– Factor of ≥ 2 ratio between narrow and broad band Factor of ≥ 2 ratio between narrow and broad band flux densities.flux densities.
– No more than 2No more than 2σσ significant flux in the B significant flux in the Bww filter. filter.
MMT Symposium June 14th, 200MMT Symposium June 14th, 2006 Steven Finkelstein (ASU)6 Steven Finkelstein (ASU)
1414
ResultsResults
• 98 galaxies met our detection criteria within the 24’ x 98 galaxies met our detection criteria within the 24’ x 24’ Megacam field of view24’ Megacam field of view
• 22 of those had 22 of those had ≥ 2≥ 2σσ detections in two of the r’, i’ or detections in two of the r’, i’ or z’ bands.z’ bands.– 14 of the 22 galaxies have Magellan – IMACS spectra14 of the 22 galaxies have Magellan – IMACS spectra
• 7 of these have confirmed Ly7 of these have confirmed Lyαα lines putting the galaxies at z lines putting the galaxies at z ~ 4.5~ 4.5
– Other 7 do not show a strong LyOther 7 do not show a strong Lyαα line, but 3-4 of these may line, but 3-4 of these may with deeper spectrawith deeper spectra
– 12 of the 22 galaxies detected in the H0 (6559 Å) 12 of the 22 galaxies detected in the H0 (6559 Å) filter, 6 in H8 (6650 Å) and 4 in H16 (6730 Å)filter, 6 in H8 (6650 Å) and 4 in H16 (6730 Å)
MMT Symposium June 14th, 200MMT Symposium June 14th, 2006 Steven Finkelstein (ASU)6 Steven Finkelstein (ASU)
1515
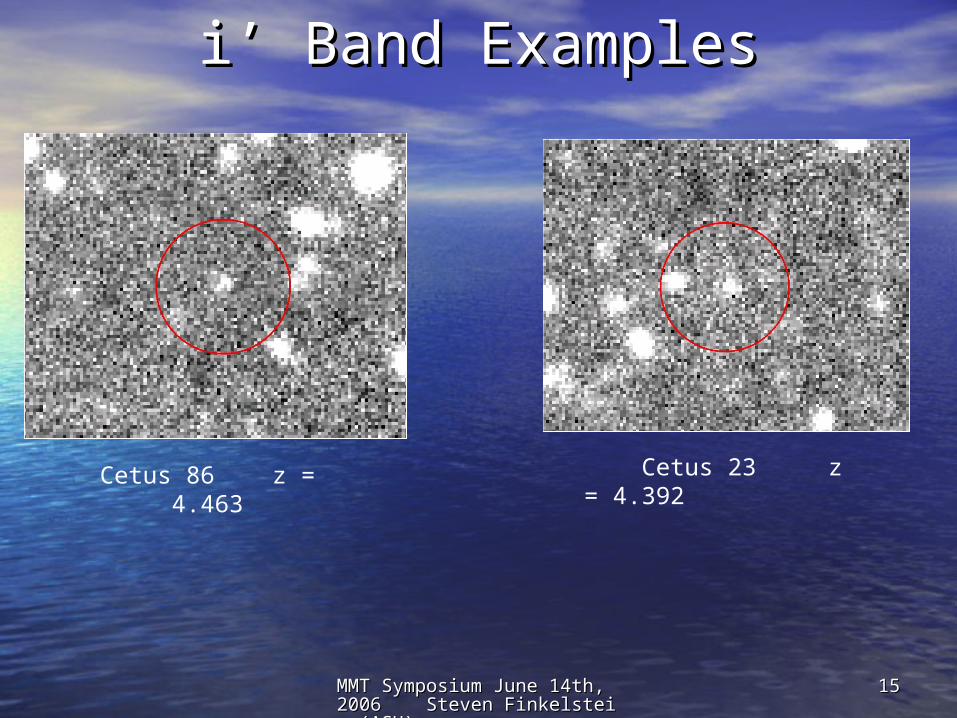
i’ Band Examplesi’ Band Examples
Cetus 86 z = 4.463 Cetus 23 z = 4.392
MMT Symposium June 14th, 200MMT Symposium June 14th, 2006 Steven Finkelstein (ASU)6 Steven Finkelstein (ASU)
1616
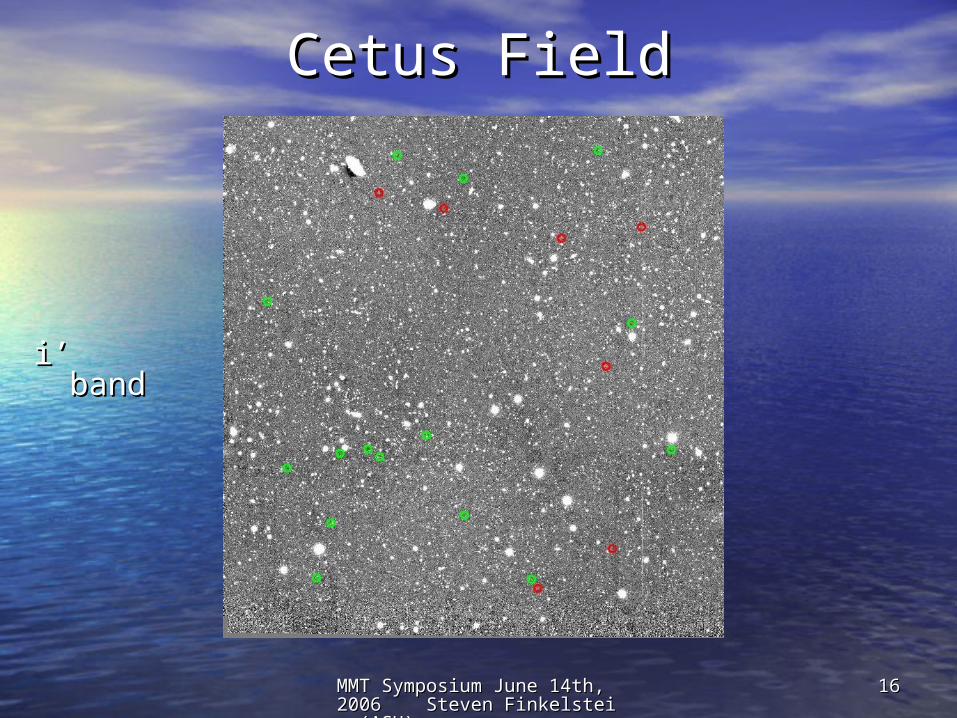
Cetus FieldCetus Field
i’ bandi’ band
MMT Symposium June 14th, 200MMT Symposium June 14th, 2006 Steven Finkelstein (ASU)6 Steven Finkelstein (ASU)
1717
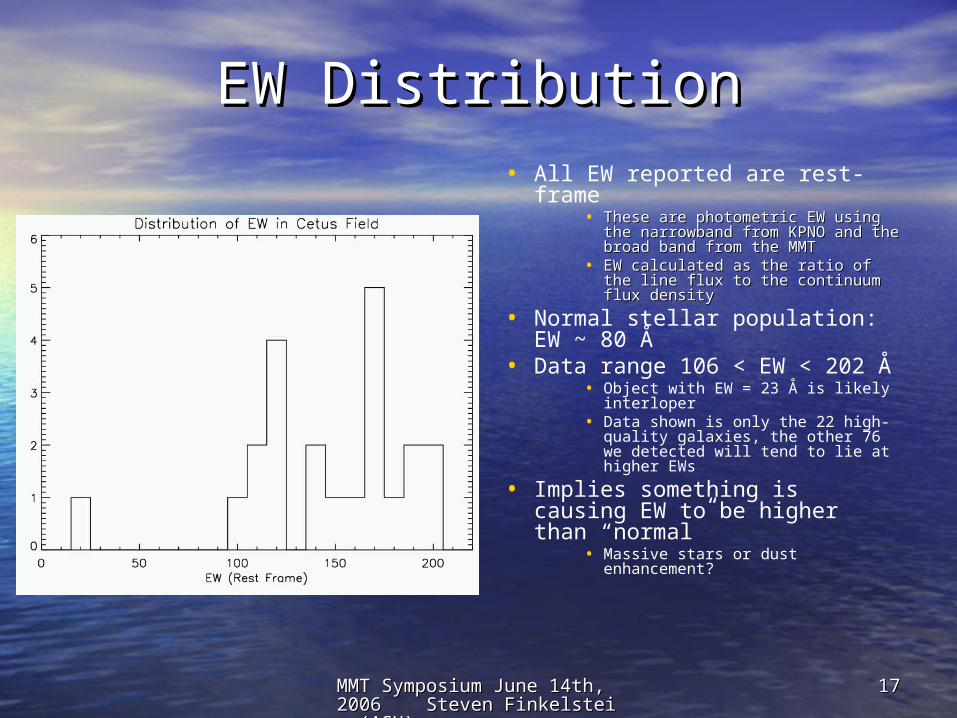
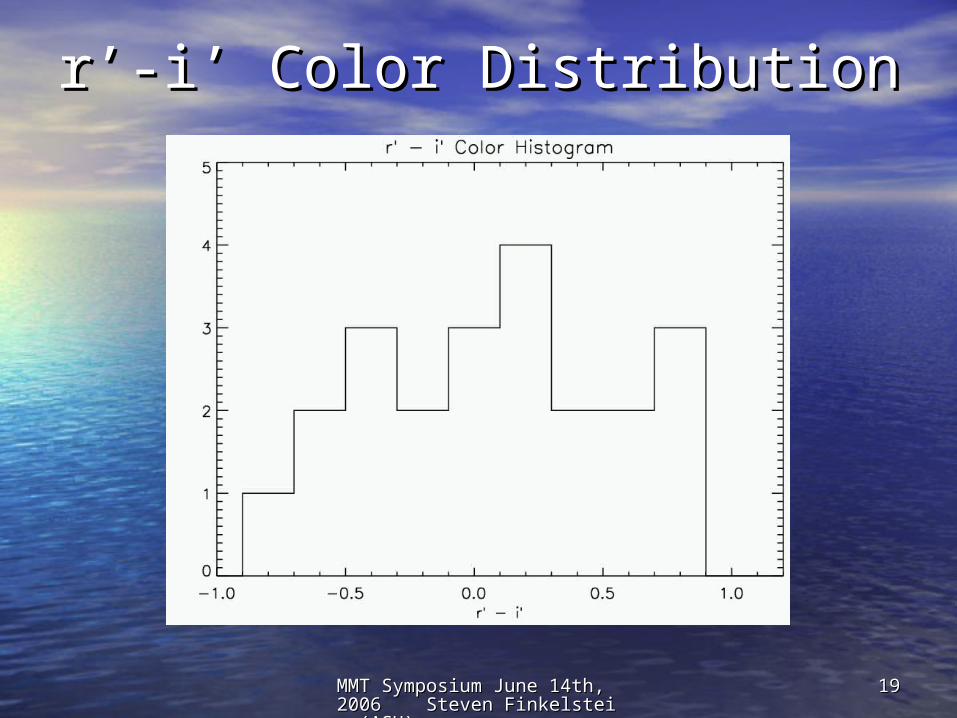
EW DistributionEW Distribution• All EW reported are rest-frame
• These are photometric EW These are photometric EW using the narrowband from using the narrowband from KPNO and the broad band from KPNO and the broad band from the MMTthe MMT
• EW calculated as the ratio of EW calculated as the ratio of the line flux to the continuum the line flux to the continuum flux densityflux density
• Normal stellar population: EW ~ 80 Å
• Data range 106 < EW < 202 Å• Object with EW = 23 Å is likely
interloper• Data shown is only the 22 high-
quality galaxies, the other 76 we detected will tend to lie at higher EWs
• Implies something is causing EW to be higher than “normal”
• Massive stars or dust enhancement?
MMT Symposium June 14th, 200MMT Symposium June 14th, 2006 Steven Finkelstein (ASU)6 Steven Finkelstein (ASU)
1818
Stellar Population ModelsStellar Population Models
• Bruzual and Charlot (2003) (BC03)Bruzual and Charlot (2003) (BC03)• Model Parameters:Model Parameters:
• Age: 10Age: 1066 – 10 – 1099 years years• Metallicity: .02*Solar – SolarMetallicity: .02*Solar – Solar• LyLyαα emission: Calculated from the number of ionizing photons emission: Calculated from the number of ionizing photons
produced from a given stellar populationproduced from a given stellar population• SFR: Exponential DecaySFR: Exponential Decay
Tau = 10Tau = 1033 years (Instantaneous burst) years (Instantaneous burst) Tau = 10Tau = 107 7 yearsyears Tau = 10Tau = 108 8 yearsyears Tau = 2*10Tau = 2*1099 years (Continuous SF) years (Continuous SF)
• Calzetti Law (1994) dust extinction (0-2 mags at 1200 Calzetti Law (1994) dust extinction (0-2 mags at 1200 ÅÅ)) Applied only to the continuum light (i.e. not the LyApplied only to the continuum light (i.e. not the Lyαα emission) in emission) in
order to model the clumpy dust scenario.order to model the clumpy dust scenario.• IGM Absorption via Madau (1995)IGM Absorption via Madau (1995)
MMT Symposium June 14th, 200MMT Symposium June 14th, 2006 Steven Finkelstein (ASU)6 Steven Finkelstein (ASU)
1919
r’-i’ Color Distributionr’-i’ Color Distribution
MMT Symposium June 14th, 200MMT Symposium June 14th, 2006 Steven Finkelstein (ASU)6 Steven Finkelstein (ASU)
2020
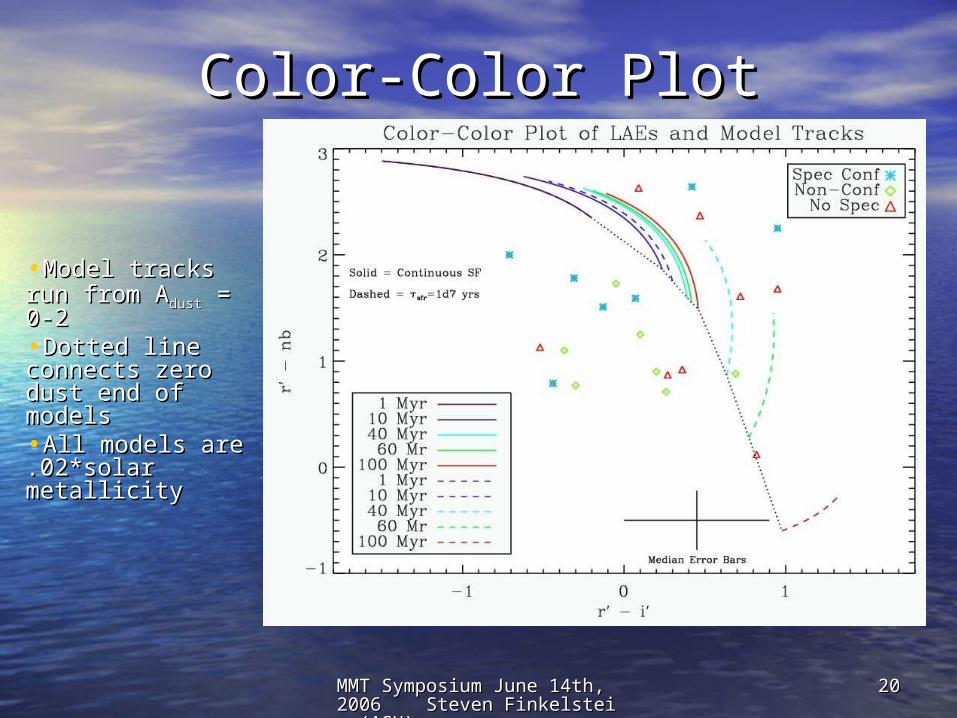
Color-Color PlotColor-Color Plot
•Model tracks run Model tracks run from Afrom Adustdust = 0-2 = 0-2•Dotted line Dotted line connects zero dust connects zero dust end of modelsend of models•All models All models are .02*solar are .02*solar metallicitymetallicity
MMT Symposium June 14th, 200MMT Symposium June 14th, 2006 Steven Finkelstein (ASU)6 Steven Finkelstein (ASU)
2121
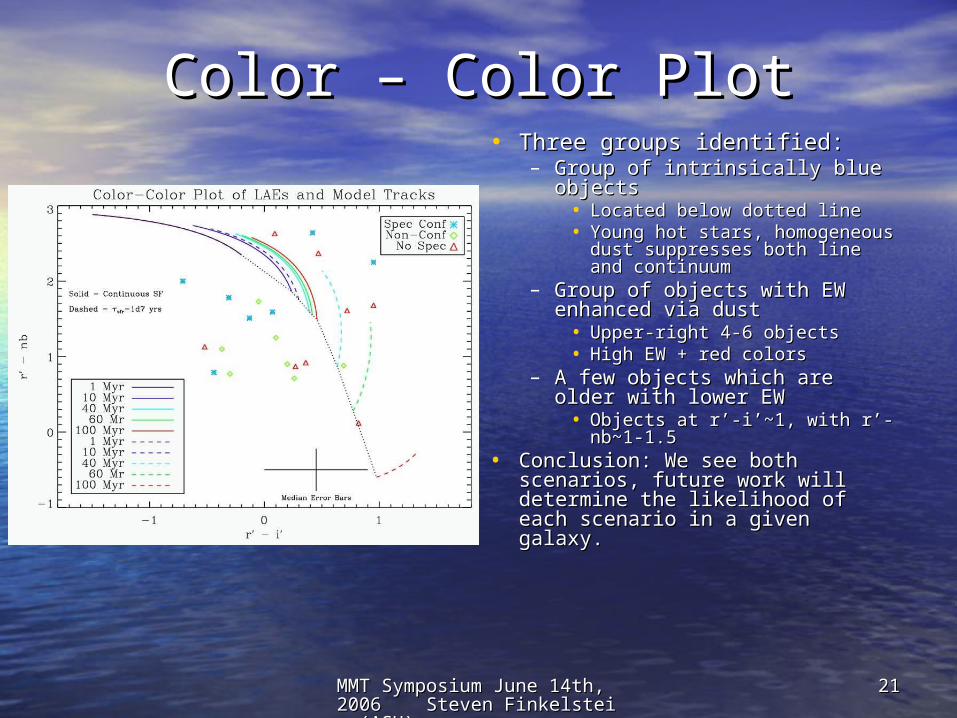
Color – Color PlotColor – Color Plot• Three groups identified:Three groups identified:
– Group of intrinsically blue objectsGroup of intrinsically blue objects• Located below dotted lineLocated below dotted line• Young hot stars, homogeneous Young hot stars, homogeneous
dust suppresses both line and dust suppresses both line and continuumcontinuum
– Group of objects with EW Group of objects with EW enhanced via dustenhanced via dust
• Upper-right 4-6 objectsUpper-right 4-6 objects• High EW + red colorsHigh EW + red colors
– A few objects which are older A few objects which are older with lower EWwith lower EW
• Objects at r’-i’~1, with r’-nb~1-Objects at r’-i’~1, with r’-nb~1-1.51.5
• Conclusion: We see both scenarios, Conclusion: We see both scenarios, future work will determine the future work will determine the likelihood of each scenario in a given likelihood of each scenario in a given galaxy.galaxy.
MMT Symposium June 14th, 200MMT Symposium June 14th, 2006 Steven Finkelstein (ASU)6 Steven Finkelstein (ASU)
2222
Work In ProgressWork In Progress
• We plan to fit the 22 individual LAEs to We plan to fit the 22 individual LAEs to BC03 models to determine:BC03 models to determine:
•AgeAge
•MassMass
•MetallicityMetallicity
•Star formation historyStar formation history
•Dust contentDust content
• Stacking analysis of 76 other galaxiesStacking analysis of 76 other galaxies
MMT Symposium June 14th, 200MMT Symposium June 14th, 2006 Steven Finkelstein (ASU)6 Steven Finkelstein (ASU)
2323
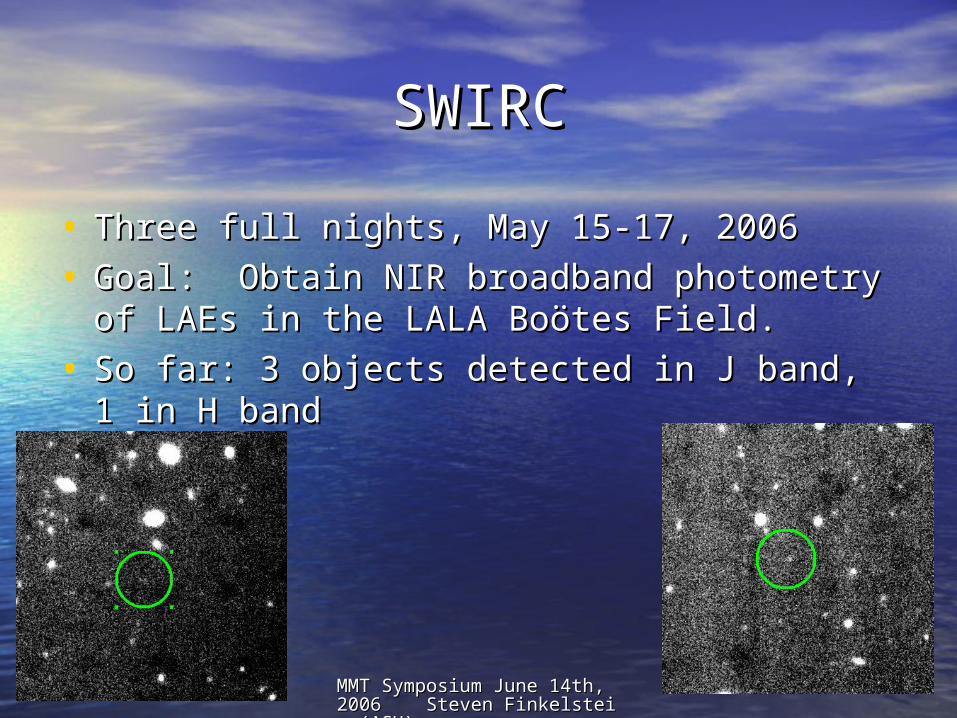
SWIRCSWIRC
• Three full nights, May 15-17, 2006Three full nights, May 15-17, 2006
• Goal: Obtain NIR broadband photometry of Goal: Obtain NIR broadband photometry of LAEs in the LALA BoLAEs in the LALA Boöötes Field.tes Field.
• So far: 3 objects detected in J band, 1 in H So far: 3 objects detected in J band, 1 in H bandband
MMT Symposium June 14th, 200MMT Symposium June 14th, 2006 Steven Finkelstein (ASU)6 Steven Finkelstein (ASU)
2424
Future WorkFuture Work
• We plan to do a similar analysis with We plan to do a similar analysis with broadband data for the Bobroadband data for the Boöötes Fieldtes Field
•Using broadband photometry from the KPNO Using broadband photometry from the KPNO 4m and the NIR data from SWIRC4m and the NIR data from SWIRC
•Larger wavelength baseline, more Larger wavelength baseline, more accurately determine existence of dusty accurately determine existence of dusty scenarioscenario
• Continue work out to higher redshiftsContinue work out to higher redshifts•z = 5.7z = 5.7•z = 6.5z = 6.5
MMT Symposium June 14th, 200MMT Symposium June 14th, 2006 Steven Finkelstein (ASU)6 Steven Finkelstein (ASU)
2525
The EndThe End
• This work was supported by the ASU/NASA Space Grant This work was supported by the ASU/NASA Space Grant and the ASU Dept. of Physics and Astronomy.and the ASU Dept. of Physics and Astronomy.
• Abbreviated ReferencesAbbreviated References– Bruzual, G. & Charlot, S. 2003, MNRAS, 344, 1000Bruzual, G. & Charlot, S. 2003, MNRAS, 344, 1000– Dawson, S. et al. 2004, ApJ, 617, 707Dawson, S. et al. 2004, ApJ, 617, 707– Hansen, M., & Oh, S. P. 2006, MNRAS, 367, 979Hansen, M., & Oh, S. P. 2006, MNRAS, 367, 979– Malhotra, S. et al. 2003, ApJ, 585, L25Malhotra, S. et al. 2003, ApJ, 585, L25– Malhotra, S. & Rhoads, J.E. 2002, ApJ, 565, L71Malhotra, S. & Rhoads, J.E. 2002, ApJ, 565, L71– Neufeld, D.A. 1991, ApJ, 370, L85Neufeld, D.A. 1991, ApJ, 370, L85– Papovich, C., Dickinson, M. & Ferguson, H. C. 2001, ApJ, 559, Papovich, C., Dickinson, M. & Ferguson, H. C. 2001, ApJ, 559,
620620– Partridge, R.B. & Peebles, P.J.E. 1967, ApJ, 147, 868Partridge, R.B. & Peebles, P.J.E. 1967, ApJ, 147, 868– Rhoads, J.E. et al. 2000, ApJ, 545, L85Rhoads, J.E. et al. 2000, ApJ, 545, L85
MMT Symposium June 14th, 200MMT Symposium June 14th, 2006 Steven Finkelstein (ASU)6 Steven Finkelstein (ASU)
2626
AbstractAbstract
• Lyman alpha emission lines from high redshift galaxies often show Lyman alpha emission lines from high redshift galaxies often show equivalent widths beyond those expected for normal stellar equivalent widths beyond those expected for normal stellar populations. Spectroscopy and x-ray photometry of these galaxies populations. Spectroscopy and x-ray photometry of these galaxies demonstrates that the Lyman alpha emission is predominantly demonstrates that the Lyman alpha emission is predominantly powered by star formation rather than by accretion power. To powered by star formation rather than by accretion power. To explain the largest equivalent widths then requires either (a) explain the largest equivalent widths then requires either (a) unusually hot stellar populations, as might be expected from a top unusually hot stellar populations, as might be expected from a top heavy initial mass function or from low stellar metallicity; or (b) heavy initial mass function or from low stellar metallicity; or (b) differences in the radiative transfer of Lyman alpha and continuum differences in the radiative transfer of Lyman alpha and continuum photons, which could allow Lyman alpha photons to escape even photons, which could allow Lyman alpha photons to escape even while continuum light is suppressed by dust. while continuum light is suppressed by dust.
• Broad band colors can be used to distinguish between these two Broad band colors can be used to distinguish between these two scenarios, because hot photospheres will result in a blue scenarios, because hot photospheres will result in a blue continuum while dust absorption will redden the escaping continuum while dust absorption will redden the escaping continuum light. We have used Megacam on the MMT to obtain continuum light. We have used Megacam on the MMT to obtain broad band colors of about 100 Lyman alpha galaxies. We will broad band colors of about 100 Lyman alpha galaxies. We will present our photometry and compare it with model colors present our photometry and compare it with model colors expected under these two alternative scenarios.expected under these two alternative scenarios.
MMT Symposium June 14th, 200MMT Symposium June 14th, 2006 Steven Finkelstein (ASU)6 Steven Finkelstein (ASU)
2727
LALA PublicationsLALA Publications• First Results from the Large Area Lyman Alpha Survey; Rhoads, J. E. et al. 2000First Results from the Large Area Lyman Alpha Survey; Rhoads, J. E. et al. 2000• Lyman Alpha Emitters at Redshift z=5.7; Rhoads, J. E. and Malhotra, S. 2001Lyman Alpha Emitters at Redshift z=5.7; Rhoads, J. E. and Malhotra, S. 2001• Large Equivalent Width Lyman-alpha Line Emission at z=4.5: Young Galaxies in a Young Large Equivalent Width Lyman-alpha Line Emission at z=4.5: Young Galaxies in a Young
Universe; Malhotra, S. & Rhoads, J. E. 2002Universe; Malhotra, S. & Rhoads, J. E. 2002• Spectroscopic Confirmation of Three Redshift z~5.7 Lyman-Alpha Emitters from the Large-Area Spectroscopic Confirmation of Three Redshift z~5.7 Lyman-Alpha Emitters from the Large-Area
Lyman Alpha Survey; Rhoads, J. E. et al. 2003 Lyman Alpha Survey; Rhoads, J. E. et al. 2003 • No X-Ray-bright Type II Quasars among the Lyman-Alpha Emitters; Malhotra, S. et al. 2003No X-Ray-bright Type II Quasars among the Lyman-Alpha Emitters; Malhotra, S. et al. 2003• A Luminous Lyman-alpha Emitting Galaxy at Redshift z=6.535: Discovery and Spectroscopic A Luminous Lyman-alpha Emitting Galaxy at Redshift z=6.535: Discovery and Spectroscopic
Confirmation; Rhoads, J. E. et al. 2004Confirmation; Rhoads, J. E. et al. 2004• X-ray Nondetection of the Lyman alpha Emitters at z~4.5; Wang, J. et al. 2004X-ray Nondetection of the Lyman alpha Emitters at z~4.5; Wang, J. et al. 2004• Spectroscopic Properties of the z=4.5 Lyman Alpha Emitters; Dawson, S. et al. 2004Spectroscopic Properties of the z=4.5 Lyman Alpha Emitters; Dawson, S. et al. 2004• 172 ks Chandra Exposure of the LALA Bo172 ks Chandra Exposure of the LALA Boöötes Field: X-ray Source Catalog; Wang, J. et al 2004tes Field: X-ray Source Catalog; Wang, J. et al 2004• Luminosity Functions of Lyman alpha Emitters at Redshift z=6.5 and z=5.7: Evidence Against Luminosity Functions of Lyman alpha Emitters at Redshift z=6.5 and z=5.7: Evidence Against
Reionization at z=6; Malhotra, S. & Rhoads, J. E. 2004Reionization at z=6; Malhotra, S. & Rhoads, J. E. 2004• A Luminous Lyman alpha Emitting Galaxy at Redshift z = 6.535: Discovery and Spectroscopic A Luminous Lyman alpha Emitting Galaxy at Redshift z = 6.535: Discovery and Spectroscopic
Confirmation; Rhoads, J. E. et al. 2004Confirmation; Rhoads, J. E. et al. 2004• The Volume Fraction of Ionized Intergalactic Gas at Redshift z = 6.5; Malhotra, S. & Rhoads, J. The Volume Fraction of Ionized Intergalactic Gas at Redshift z = 6.5; Malhotra, S. & Rhoads, J.
E. 2006E. 2006• Physical Properties of Lyman Alpha Emitting Galaxies at z ~ 4.5; Finkelstein, S. L. et al. Physical Properties of Lyman Alpha Emitting Galaxies at z ~ 4.5; Finkelstein, S. L. et al. in in
preparationpreparation