
Mid-infrared images of β Pictoris and the possible role of planetesimal collisions in the central...
4
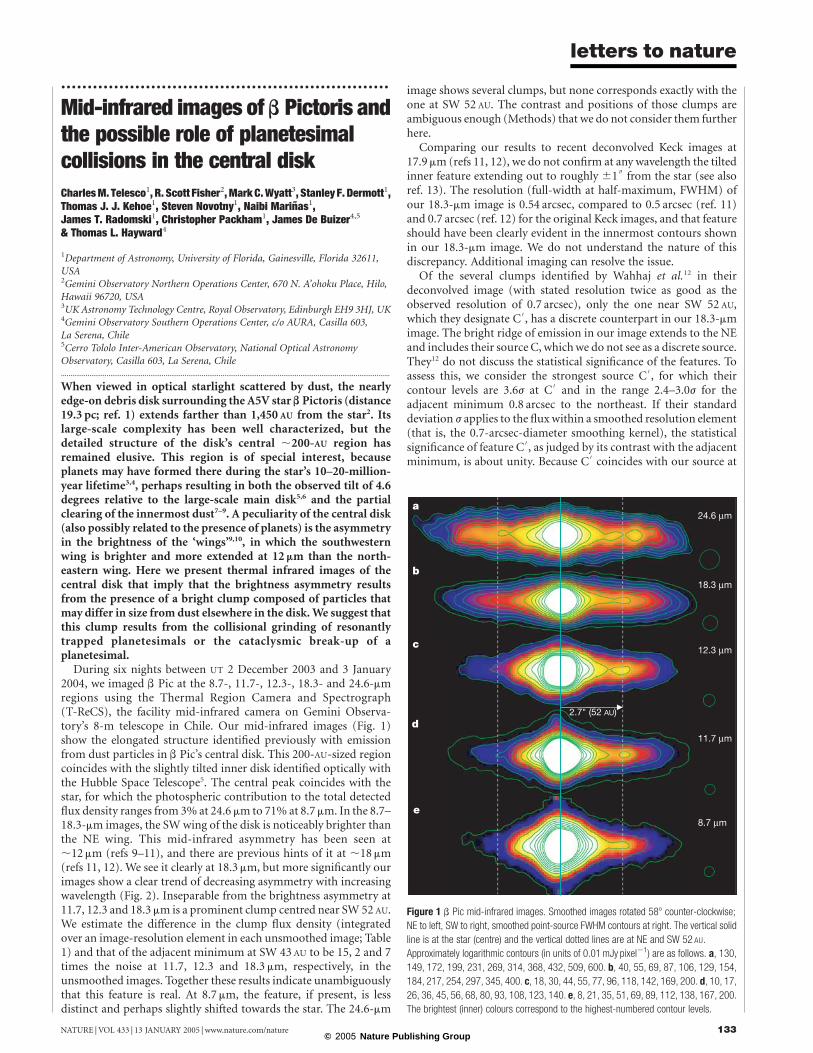
.............................................................. Mid-infrared images of b Pictoris and the possible role of planetesimal collisions in the central disk Charles M. Telesco 1 , R. Scott Fisher 2 , Mark C. Wyatt 3 , Stanley F. Dermott 1 , Thomas J. J. Kehoe 1 , Steven Novotny 1 , Naibi Marin ˜as 1 , James T. Radomski 1 , Christopher Packham 1 , James De Buizer 4,5 & Thomas L. Hayward 4 1 Department of Astronomy, University of Florida, Gainesville, Florida 32611, USA 2 Gemini Observatory Northern Operations Center, 670 N. A’ohoku Place, Hilo, Hawaii 96720, USA 3 UK Astronomy Technology Centre, Royal Observatory, Edinburgh EH9 3HJ, UK 4 Gemini Observatory Southern Operations Center, c/o AURA, Casilla 603, La Serena, Chile 5 Cerro Tololo Inter-American Observatory, National Optical Astronomy Observatory, Casilla 603, La Serena, Chile ............................................................................................................................................................................. When viewed in optical starlight scattered by dust, the nearly edge-on debris disk surrounding the A5V star b Pictoris (distance 19.3 pc; ref. 1) extends farther than 1,450 AU from the star 2 . Its large-scale complexity has been well characterized, but the detailed structure of the disk’s central ,200-AU region has remained elusive. This region is of special interest, because planets may have formed there during the star’s 10–20-million- year lifetime 3,4 , perhaps resulting in both the observed tilt of 4.6 degrees relative to the large-scale main disk 5,6 and the partial clearing of the innermost dust 7–9 . A peculiarity of the central disk (also possibly related to the presence of planets) is the asymmetry in the brightness of the ‘wings’ 9,10 , in which the southwestern wing is brighter and more extended at 12 mm than the north- eastern wing. Here we present thermal infrared images of the central disk that imply that the brightness asymmetry results from the presence of a bright clump composed of particles that may differ in size from dust elsewhere in the disk. We suggest that this clump results from the collisional grinding of resonantly trapped planetesimals or the cataclysmic break-up of a planetesimal. During six nights between UT 2 December 2003 and 3 January 2004, we imaged b Pic at the 8.7-, 11.7-, 12.3-, 18.3- and 24.6-mm regions using the Thermal Region Camera and Spectrograph (T-ReCS), the facility mid-infrared camera on Gemini Observa- tory’s 8-m telescope in Chile. Our mid-infrared images (Fig. 1) show the elongated structure identified previously with emission from dust particles in b Pic’s central disk. This 200-AU-sized region coincides with the slightly tilted inner disk identified optically with the Hubble Space Telescope 5 . The central peak coincides with the star, for which the photospheric contribution to the total detected flux density ranges from 3% at 24.6 mm to 71% at 8.7 mm. In the 8.7– 18.3-mm images, the SW wing of the disk is noticeably brighter than the NE wing. This mid-infrared asymmetry has been seen at ,12 mm (refs 9–11), and there are previous hints of it at ,18 mm (refs 11, 12). We see it clearly at 18.3 mm, but more significantly our images show a clear trend of decreasing asymmetry with increasing wavelength (Fig. 2). Inseparable from the brightness asymmetry at 11.7, 12.3 and 18.3 mm is a prominent clump centred near SW 52 AU. We estimate the difference in the clump flux density (integrated over an image-resolution element in each unsmoothed image; Table 1) and that of the adjacent minimum at SW 43 AU to be 15, 2 and 7 times the noise at 11.7, 12.3 and 18.3 mm, respectively, in the unsmoothed images. Together these results indicate unambiguously that this feature is real. At 8.7 mm, the feature, if present, is less distinct and perhaps slightly shifted towards the star. The 24.6-mm image shows several clumps, but none corresponds exactly with the one at SW 52 AU. The contrast and positions of those clumps are ambiguous enough (Methods) that we do not consider them further here. Comparing our results to recent deconvolved Keck images at 17.9 mm (refs 11, 12), we do not confirm at any wavelength the tilted inner feature extending out to roughly ^1 00 from the star (see also ref. 13). The resolution (full-width at half-maximum, FWHM) of our 18.3-mm image is 0.54 arcsec, compared to 0.5 arcsec (ref. 11) and 0.7 arcsec (ref. 12) for the original Keck images, and that feature should have been clearly evident in the innermost contours shown in our 18.3-mm image. We do not understand the nature of this discrepancy. Additional imaging can resolve the issue. Of the several clumps identified by Wahhaj et al. 12 in their deconvolved image (with stated resolution twice as good as the observed resolution of 0.7 arcsec), only the one near SW 52 AU, which they designate C 0 , has a discrete counterpart in our 18.3-mm image. The bright ridge of emission in our image extends to the NE and includes their source C, which we do not see as a discrete source. They 12 do not discuss the statistical significance of the features. To assess this, we consider the strongest source C 0 , for which their contour levels are 3.6j at C 0 and in the range 2.4–3.0j for the adjacent minimum 0.8 arcsec to the northeast. If their standard deviation j applies to the flux within a smoothed resolution element (that is, the 0.7-arcsec-diameter smoothing kernel), the statistical significance of feature C 0 , as judged by its contrast with the adjacent minimum, is about unity. Because C 0 coincides with our source at Figure 1 b Pic mid-infrared images. Smoothed images rotated 588 counter-clockwise; NE to left, SW to right, smoothed point-source FWHM contours at right. The vertical solid line is at the star (centre) and the vertical dotted lines are at NE and SW 52 AU. Approximately logarithmic contours (in units of 0.01 mJy pixel 21 ) are as follows. a, 130, 149, 172, 199, 231, 269, 314, 368, 432, 509, 600. b, 40, 55, 69, 87, 106, 129, 154, 184, 217, 254, 297, 345, 400. c, 18, 30, 44, 55, 77, 96, 118, 142, 169, 200. d, 10, 17, 26, 36, 45, 56, 68, 80, 93, 108, 123, 140. e, 8, 21, 35, 51, 69, 89, 112, 138, 167, 200. The brightest (inner) colours correspond to the highest-numbered contour levels. letters to nature NATURE | VOL 433 | 13 JANUARY 2005 | www.nature.com/nature 133 © 2005 Nature Publishing Group
Transcript of Mid-infrared images of β Pictoris and the possible role of planetesimal collisions in the central...
..............................................................
Mid-infrared images of b Pictoris andthe possible role of planetesimalcollisions in the central diskCharles M. Telesco1, R. Scott Fisher2, Mark C. Wyatt3, Stanley F. Dermott1,Thomas J. J. Kehoe1, Steven Novotny1, Naibi Marinas1,James T. Radomski1, Christopher Packham1, James De Buizer4,5
& Thomas L. Hayward4
1Department of Astronomy, University of Florida, Gainesville, Florida 32611,USA2Gemini Observatory Northern Operations Center, 670 N. A’ohoku Place, Hilo,Hawaii 96720, USA3UK Astronomy Technology Centre, Royal Observatory, Edinburgh EH9 3HJ, UK4Gemini Observatory Southern Operations Center, c/o AURA, Casilla 603,La Serena, Chile5Cerro Tololo Inter-American Observatory, National Optical AstronomyObservatory, Casilla 603, La Serena, Chile.............................................................................................................................................................................
When viewed in optical starlight scattered by dust, the nearlyedge-on debris disk surrounding the A5V star bPictoris (distance19.3 pc; ref. 1) extends farther than 1,450 AU from the star2. Itslarge-scale complexity has been well characterized, but thedetailed structure of the disk’s central ,200-AU region hasremained elusive. This region is of special interest, becauseplanets may have formed there during the star’s 10–20-million-year lifetime3,4, perhaps resulting in both the observed tilt of 4.6degrees relative to the large-scale main disk5,6 and the partialclearing of the innermost dust7–9. A peculiarity of the central disk(also possibly related to the presence of planets) is the asymmetryin the brightness of the ‘wings’9,10, in which the southwesternwing is brighter and more extended at 12 mm than the north-eastern wing. Here we present thermal infrared images of thecentral disk that imply that the brightness asymmetry resultsfrom the presence of a bright clump composed of particles thatmay differ in size from dust elsewhere in the disk. We suggest thatthis clump results from the collisional grinding of resonantlytrapped planetesimals or the cataclysmic break-up of aplanetesimal.
During six nights between UT 2 December 2003 and 3 January2004, we imaged b Pic at the 8.7-, 11.7-, 12.3-, 18.3- and 24.6-mmregions using the Thermal Region Camera and Spectrograph(T-ReCS), the facility mid-infrared camera on Gemini Observa-tory’s 8-m telescope in Chile. Our mid-infrared images (Fig. 1)show the elongated structure identified previously with emissionfrom dust particles in b Pic’s central disk. This 200-AU-sized regioncoincides with the slightly tilted inner disk identified optically withthe Hubble Space Telescope5. The central peak coincides with thestar, for which the photospheric contribution to the total detectedflux density ranges from 3% at 24.6 mm to 71% at 8.7 mm. In the 8.7–18.3-mm images, the SW wing of the disk is noticeably brighter thanthe NE wing. This mid-infrared asymmetry has been seen at,12mm (refs 9–11), and there are previous hints of it at ,18 mm(refs 11, 12). We see it clearly at 18.3 mm, but more significantly ourimages show a clear trend of decreasing asymmetry with increasingwavelength (Fig. 2). Inseparable from the brightness asymmetry at11.7, 12.3 and 18.3 mm is a prominent clump centred near SW 52 AU.We estimate the difference in the clump flux density (integratedover an image-resolution element in each unsmoothed image; Table1) and that of the adjacent minimum at SW 43 AU to be 15, 2 and 7times the noise at 11.7, 12.3 and 18.3 mm, respectively, in theunsmoothed images. Together these results indicate unambiguouslythat this feature is real. At 8.7 mm, the feature, if present, is lessdistinct and perhaps slightly shifted towards the star. The 24.6-mm
image shows several clumps, but none corresponds exactly with theone at SW 52 AU. The contrast and positions of those clumps areambiguous enough (Methods) that we do not consider them furtherhere.
Comparing our results to recent deconvolved Keck images at17.9 mm (refs 11, 12), we do not confirm at any wavelength the tiltedinner feature extending out to roughly ^1
00from the star (see also
ref. 13). The resolution (full-width at half-maximum, FWHM) ofour 18.3-mm image is 0.54 arcsec, compared to 0.5 arcsec (ref. 11)and 0.7 arcsec (ref. 12) for the original Keck images, and that featureshould have been clearly evident in the innermost contours shownin our 18.3-mm image. We do not understand the nature of thisdiscrepancy. Additional imaging can resolve the issue.
Of the several clumps identified by Wahhaj et al.12 in theirdeconvolved image (with stated resolution twice as good as theobserved resolution of 0.7 arcsec), only the one near SW 52 AU,which they designate C 0 , has a discrete counterpart in our 18.3-mmimage. The bright ridge of emission in our image extends to the NEand includes their source C, which we do not see as a discrete source.They12 do not discuss the statistical significance of the features. Toassess this, we consider the strongest source C 0 , for which theircontour levels are 3.6j at C 0 and in the range 2.4–3.0j for theadjacent minimum 0.8 arcsec to the northeast. If their standarddeviation j applies to the flux within a smoothed resolution element(that is, the 0.7-arcsec-diameter smoothing kernel), the statisticalsignificance of feature C
0, as judged by its contrast with the adjacent
minimum, is about unity. Because C 0 coincides with our source at
Figure 1 b Pic mid-infrared images. Smoothed images rotated 588 counter-clockwise;
NE to left, SW to right, smoothed point-source FWHM contours at right. The vertical solid
line is at the star (centre) and the vertical dotted lines are at NE and SW 52 AU.
Approximately logarithmic contours (in units of 0.01mJy pixel21) are as follows. a, 130,
149, 172, 199, 231, 269, 314, 368, 432, 509, 600. b, 40, 55, 69, 87, 106, 129, 154,
184, 217, 254, 297, 345, 400. c, 18, 30, 44, 55, 77, 96, 118, 142, 169, 200. d, 10, 17,
26, 36, 45, 56, 68, 80, 93, 108, 123, 140. e, 8, 21, 35, 51, 69, 89, 112, 138, 167, 200.
The brightest (inner) colours correspond to the highest-numbered contour levels.
letters to nature
NATURE | VOL 433 | 13 JANUARY 2005 | www.nature.com/nature 133© 2005 Nature Publishing Group

SW 52 AU, our interpretation of their noise characterization may beinaccurate. Nevertheless, we have found in simulations that whitenoise applied to a uniformly bright, extended source before imagesmoothing can lead to the appearance of unresolved clumps in thesmoothed image resembling those detected in ref. 12.
To probe the nature of the brightness asymmetry, we subtractedthe emission in the fainter NW wing from the SW wing at thosewavelengths for which we observed an asymmetry (Fig. 3). Most ofthe resultant residual emission, which has a high signal-to-noiseratio, arises in the projected radial band from 40 to 60 AU, althoughit is not entirely confined to that region. The distribution is resolvedalong the major axis at all four wavelengths (resolution elements,Table 1) and is defined by the bright clump at SW 52 AU and a fainterridge extending out to ,70 AU, both of which seem to be embeddedin a fainter component. A point source with peak brightnessnormalized to the clump peak at 8.7, 11.7, 12.3 and 18.3 mm,respectively, would emit 16, 11, 17 and 15% of the total residualemission between 26 and 113 AU in radius and ^43 AU along theminor axis. The clump appears resolved along the minor (vertical)axis at all wavelengths. At 8–12 mm, the measured minor-axisFWHM values through the clump peak are about twice thesmoothed point-spread function (PSF) values (0.4–0.5 arcsec,or 8–10 AU). Quadratic subtraction of the PSF implies intrinsicminor-axis clump widths roughly in the range 13–17 AU. At18 mm the minor-axis distribution through the clump peak isnoticeably asymmetric, with an intrinsic width of about 19 AU. Weemphasize that the derived structure and resolution of the clumpmust be viewed cautiously (and confirmed in detail), because itdepends in a complex way on details of the emission on both sides ofthe disk.
We find that the spectral energy distribution (SED) of the residualemission is noticeably different from that of the NE wing and thecentral disk as a whole. In contrast to the total wing emission fromeither side (Fig. 4), for which the flux density increases withwavelength to beyond 25 mm, the SED of the residual peaks short-ward of 25 mm. To explore this contrast, we constructed a multi-annulus model for the NE emission wing, assuming it representspart of a disk, with dust particles having an emission efficiency withthe generic power-law form Qn / n, where n is the frequency. Themodel, based initially only on the 11.7- and 18.3-mm images,indicates that the optical-depth distribution in the NE wing has amaximum at 60–80 AU and a gradual fall-off between 60 and 30 AU
(Fig. 5). We identify this central fall-off with the hole inferredpreviously from the larger-scale SED7,8 and from 12-mm images withan assumed temperature distribution9,10. The NE-wing optical
depth drops smoothly by factors of two and three between 70 and120 AU and 70 and 30 AU, respectively, roughly compatible with theresults obtained by Pantin et al.10, who incorporated the brighterSW wing into their models, thereby enhancing the deduced densitycontrast of the hole. The resultant temperature distribution, whichdecreases gradually with distance, is much hotter than a blackbody,as expected for small, inefficiently emitting particles7. The tempera-ture is ,140 K near NE 52 AU. In contrast, for the same power-lawefficiency we estimate the temperature of the clump particles at SW52 AU to be ,190 K (Fig. 4b). For composite grains composed ofsilicate and organic refractory material14, 1-mm-diameter particlesat 52 AU can be heated to 140 K, whereas the particles must be five-to-ten times smaller (0.1–0.2 mm) to attain 190 K at that distance.They would also have very high values (..1) of b, the ratio ofradiation and gravitational forces, and so be expelled quickly fromthe system. Although detailed dust models are needed to explorethis issue robustly, the key conclusion based on the relative appear-ance of the component SEDs is reasonably firm: the particles in the
Figure 2 SW flux divided by NE flux versus distance from star. The SW wing is much
brighter than the NE wing at shorter wavelengths. At each wavelength, flux densities have
been integrated over a strip 10 AU wide along the disk major axis and 97 AU (5 arcsec)
along the minor axis and centred on the major axis at the positions where the ratios of the
flux densities are plotted. Error bars (1-j) are as indicated at 24.6 mm and smaller than
symbols at other wavelengths.
Table 1 Observational parameters
l (mm) Dl (mm) FWHM ( 00 ) Fn (Jy) j (mJypixel21) Dt (s).............................................................................................................................................................................
8.7 0.8 0.31 2.92 0.032 91211.7 1.1 0.38 2.72 0.020 2,32412.3 1.2 0.41 2.72 0.053 91218.3 1.5 0.54 5.04 0.130 7,29824.6 2.0 0.72 12.50 0.700 6,604
.............................................................................................................................................................................
Pixel size 0.09 arcsec. Array field of view 21 00£ 28 00 . Dl (mm), filter spectral width at 50%
transmission. FWHM, measured full-width at half-maximum intensity of comparison stars, andcorresponds to a ‘resolution element’ referred to in the text. F n (Jy), total fluxes integrated over20 00
£ 5 00 region aligned with disk and centred on star. At 8.7, 11.7, 12.3, 18.3 and 24.6 mm,respectively, peak image brightnesses are 12.4, 17.1, 30.5, 42,3 and 63.9mJypixel21, andstellar photospheric emission is 71, 42, 38, 10 and 3% of tabulated total fluxes. j (mJypixel21),standard deviation for unsmoothed final frames. Dt(s), total time of source photon collectionduring chop-nod sequence.
Figure 3 The residual emission. Images result from subtracting the NE wing from the SW
wing along lines through the star. The nine evenly spaced contour levels are at the 10, 20,
30, 40, 50, 60, 70, 80 and 90% peak values of 0.228, 0.321, 0.335 and
0.527mJy pixel21 at 8.7, 11.7, 12.3 and 18.3 mm, respectively. Corresponding peak
signal-to-noise ratios are 27, 48, 24 and 15, respectively. The 24.6-mm residual is not
shown, because features are ambiguous. PSF FWHM contours are in the lower left
corners. Each inset shows a minor-axis scan (with the displayed linear scale compressed
by a factor of two) through the peak (NW to right, SE to left) and the normalized PSF.
letters to nature
NATURE | VOL 433 | 13 JANUARY 2005 | www.nature.com/nature134© 2005 Nature Publishing Group

vicinity of the clump at SW 52 AU differ in temperature, size and/orcomposition from the dust elsewhere in the disk.
The clump particles may have distinct, detectable spectroscopicsignatures. Recent mid-infrared spectroscopy indicates an asym-metric distribution of sub-micrometre glassy olivine grains emittingwithin 30 AU of the star13, which is much closer to the star than theclump region. The possible relationship of these components has yetto be explored, but the lower inferred temperatures of the clumpparticles (,200 K) compared to those inner particles (.300 K;ref. 13) suggests that the silicate feature, if emitted by the clumpparticles, would probably be at least one to two orders of magnitudeweaker than that seen closer to the star.
There are several mechanisms that produce a selective enhance-ment or diminishment of particles with certain ranges of size, shapeor composition that can lead to a spatially localized, visuallyprominent inhomogeneity in the dust population of a disk. Ifplanets are present in a debris disk, the inward migration of dustparticles due to Poynting–Robertson drag can lead to resonanttrapping15–17, which produces localized structure sensitive to thephysical properties of the particles. However, those disks arerelatively tenuous, in contrast to the higher-density b Pic disk,where the particles are expected to be destroyed by mutual collisionson timescales too short for them to experience significant Poynting–Robertson drag18. Another possibility is that the very small particlesthat we observe in the b Pic clump are produced by ongoing,grinding collisions among a planetesimal population itself trappedin planetary resonances15,19, which has the appealing attribute thatthe resultant clumps are quasi-permanent and thus more likely to beobservable. However, in view of the relatively young age of the b Picsystem and the evidence of orbital dynamism there20,21, we empha-size the alternative possibility that the catastrophic collisionalbreak-up of a large planetesimal has released a distinct, spatiallyasymmetric population of particles into the disk. This distinctpopulation, we speculate, might have a size distribution favouringparticles smaller than those more widely distributed in the disk22.We estimate the total mass of the mid-infrared-emitting clump
particles (density, 1 g cm23) to be 4 £ 1020 g, which would consti-tute a spherical parent body around 100 km in diameter. Dependingon the size distribution of collision fragments, the parent bodycould be substantially larger than this. Because they are blown out ofthe system quickly, this collision would have occurred within afraction of the orbital period of 270 yr, unless blow-out is substan-tially inhibited by gas drag23. Fragment post-collision velocities of,1–2 km s21 could account for the bright clump’s tentativelyidentified vertical size of ,10–20 AU if the collisional break-upoccurred 50 yr ago. That timescale is also commensurate withradiation-pressure-driven dispersal from the clump peak of high-b, submicrometre-sized debris particles at typically 4–6 km s21 toaccount for the ,40-AU radial extent of the residual distribution(Fig. 3). The probability of observing such an event is low22,24, butwe do know that during the late stages of planet formation in theSolar System, violent, catastrophic collisions must have been com-mon; such collisions have even been suggested to account for theorigin of the Moon25 and structures in the zodiacal cloud26. Asimilar event in the b Pic debris disk would result in its flaring intovisibility, perhaps as we see it today and in accord with recentsuggestions26,27 that catastrophic collisions must lead to just suchdramatic observable consequences. A
MethodsObservational procedureWe used standard chop-nod techniques at the Gemini South telescope with a 15-arcsecchop throw orthogonal to the disk’s major axis. The PSF at 8.7–18.3 mm was determinedfrom the K1 III star PPM 335509 (HR 2553) located ,108 from b Pic. We used thestandard g Reticulum to determine the PSF at 24.6 mm. At each wavelength theobservation sequence consisted of imaging the PSF star, then b Pic, then the PSF star. Thefinal images at 11.7, 18.3 and 24.6 mm were formed from registered stacks of five, seven andseven individual images, respectively. Between each exposure within a stack, the telescopewas offset (‘dithered’) approximately 1 arcsec. The images at 8.7 and 12.3 mm were eachobtained as a single on-source exposure. Some artefacts are apparent: the bright spots, dueto previously known detector cross-talk, 2.5 arcsec above and below the main peak at8.8 mm, and the optical ghost 2 arcsec above the peak at 11.7 mm. Previous mid-infraredimaging of b Pic indicates that the major axis of the central disk is oriented at positionangle 338. To minimize the introduction of any spurious features due to row- or column-correlated pattern structure known to be associated with this detector device, while alsoallowing for the possibility of detecting extended emission along the major axis at 11.7,18.3 and 24.6 mm, T-ReCS was rotated so that the disk’s major axis was oriented diagonallyon the array. At 8.7 and 12.3 mm the disk’s major axis was oriented vertically (that is, alonga 240-pixel-long column) on the detector array. The sky was clear during all observations,
Figure 4 Disk spectral energy distributions. a, SEDs of NE and SW wings. Flux densities
are total values in a 1-arcsec-diameter circle centred at NE and SW 52 AU along the disk’s
major axis from the star. Symbol sizes indicate magnitudes of flux uncertainties, primarily
due to uncertainties in photometric calibration (^10%). b, SED of residual emission
based on SEDs. Uncertainties as in a. The upper limit at 24.6mm is 3j. The curve is
Q nB n(T ), normalized to the 11.7- and 18.3-mm flux densities, where the assumed
particle emission efficiency follows the relation Q n / n and the particle temperature has
the value T ¼ 190 K.
Figure 5 Model distributions for the NE side of disk. a, b, Face-on optical depth (a), and
temperature of dust particles (b) emitting the 11.7- and 18.3-mm emission, both
computed assuming Q n / n. The expected blackbody temperature distribution (dashed
line in b) is shown for comparison. Because of the presence of silicate-feature emission
and uncertainties in the PSF, the modelling is uncertain for locations within 20 AU of the
star, and those results are not shown.
letters to nature
NATURE | VOL 433 | 13 JANUARY 2005 | www.nature.com/nature 135© 2005 Nature Publishing Group
and all images were made at airmasses less than 1.2 with Gemini facility guiding and tip-tilt engaged. To improve the signal-to-noise ratio, the images displayed in Fig. 1 have beensmoothed with gaussians of FWHM of 0.223, 0.223, 0.267, 0.356 and 0.445 arcsec at 8.7,11.7, 12.3, 18.3 and 24.6 mm, respectively.
The probability that the SW 52 AU clump is a chance superposition of an unrelatedbackground object is negligibly small (,4 £ 1025), as determined elsewhere28 for a sourceof comparable brightness. Regarding the clumps apparent in the 24.6-mm image, weestimate the contrast of the brightest clump at SW 60 AU with the adjacent inner minimumto be approximately three times the noise, but the centroid of that clump is separated fromthe minimum (SW 52 AU) by less than the 24.6-mm resolution of 14 AU (Table 1). Thus, wemake no firm judgement about the reality of the 24.6-mm clumps, ignoring for now thedetailed 24.6-mm structure. We note that, if ultimately confirmed, it could providesignificant additional insight into disk processes.
Dust mass and modelsTo characterize the NE disk emission, we considered a single population of dust grainswith the commonly used approximation that the emission efficiency Qn is proportional tofrequency. Other forms for Qn basically raise or lower the temperature and optical depthdistributions, but our purpose, which is to contrast the dust properties in the NE and SWwings, is well served by our simple assumption. The assumed value for the stellarluminosity is 8.7L(, where L( is the luminosity of the Sun. The model disk extends out to150 AU and is composed of 11 annuli that are 10 AU wide in the 0–110 AU region and oneannulus that is 40 AU wide in the 110–150-AU region. We ignore results for the regionwithin 20 AU of the star because of the contribution of the silicate feature and uncertaintiesin the PSF. Each annulus is assumed to be uniform in temperature and density. Themodelling computes the distributions of temperature and face-on optical depth for theannuli that give rise to the brightness distributions observed at 11.7 and 18.3 mm. Themodels incorporate an inclination of the whole disk to the line of sight and opening anglesas free parameters for each annulus. Optical depths and temperatures of the annuli wereused to determine the flux in the appropriate wavebands emitted by the portion of the diskin a narrow radial range. The model is three-dimensional, with flux spread evenly in bothlatitude (in the range allowed by the disk opening angle) and longitude. The diskobservations were simulated with the flux from the model being integrated along the lineof sight of each pixel. The point-like stellar flux was then included at the centre. The imagewas then convolved with the PSF observed at the appropriate wavelength and additionalsmoothing added at the same level applied for the displayed images. The modellingprocedure started with initial values for the annuli, then the parameters for each annuluswere improved in turn by considering how varying them affected the resulting image. Thisprocedure worked from the outermost to the innermost annulus and was repeated untilthe parameters converged. Uncertainties in the derived parameters were determined fromthe pixel-to-pixel deviation in the observation. A detailed description of the modelling forb Pic will be presented elsewhere by M.C.W. and co-workers.
Received 14 September; accepted 2 December 2004; doi:10.1038/nature03255.
1. Crifo, F., Vidal-Madjar, A., Lallement, R., Ferlet, R. & Gerbaldi, M. b Pictoris revisited by Hipparcos.
Star properties. Astron. Astrophys. 320, L29–L32 (1997).
2. Larwood, J. D. & Kalas, P. G. Close stellar encounters with planetesimal disks: the dynamics of
asymmetry in the b Pictoris system. Mon. Not. R. Astron. Soc. 323, 402–416 (2001).
3. Barrado y Navascues, D., Stauffer, J. R., Song, I. & Caillault, J.-P. The age of Beta Pictoris. Astrophys. J.
520, L123–L126 (1999).
4. Zuckerman, B., Song, I., Bessell, M. S. & Webb, R. A. The b Pictoris moving group. Astrophys. J. 562,
L87–L90 (2001).
5. Heap, S. et al. Space telescope imaging spectrograph coronagraphic observations of b Pictoris.
Astrophys. J. 539, 435–444 (2000).
6. Mouillet, D., Larwood, J. D., Papaloizou, J. C. B. & Lagrange, A. M. A planet on an inclined orbit as an
explanation of the warp in the b Pictoris disc. Mon. Not. R. Astron. Soc. 292, 896–904 (1997).
7. Telesco, C. M., Becklin, E. E., Wolstencroft, R. D. & Decher, R. Resolution of the circumstellar disk of b
Pictoris at 10 and 20 mm. Nature 335, 51–53 (1988).
8. Backman, D. E., Gillett, F. C. & Witteborn, F. C. Infrared observations and thermal models of the b
Pictoris dust disk. Astrophys. J. 385, 670–679 (1992).
9. Lagage, P. O. & Pantin, E. Dust depletion in the inner disk of Beta Pictoris as a possible indicator of
planets. Nature 369, 628–630 (1994).
10. Pantin, E., Lagage, P. O. & Artymowicz, P. Mid-infrared images and models of the b Pictoris dust disk.
Astron. Astrophys. 327, 1123–1136 (1997).
11. Weinberger, A. J., Becklin, E. E. & Zuckerman, B. The first spatially resolved mid-infrared
spectroscopy of b Pictoris. Astrophys. J. 584, L33–L37 (2003).
12. Wahhaj, Z. et al. The inner rings of b Pictoris. Astrophys. J. 584, L27–L31 (2003).
13. Okamoto, Y. K. et al. An extrasolar planetary system revealed by planetesimal belts in b Pictoris.
Nature 431, 660–662 (2004).
14. Li, A. & Greenberg, J. M. A comet dust model for the b Pictoris disk. Astron. Astrophys. 331, 291–313
(1998).
15. Ozernoy, L. M., Gorkavyi, N. N., Mather, J. C. & Taidakova, T. A. Signatures of exosolar planets in dust
disks. Astrophys. J. 537, L147–L151 (2000).
16. Sicardy, B., Beauge, C., Ferraz-Mello, S., Lazzaro, D. & Roques, F. Capture of grains into resonances
through Poynting-Robertson drag. Celest. Mech. Dyn. Astron. 57, 373–390 (1993).
17. Dermott, S. F., Jayaraman, S., Xu, Y. L., Gustafson, B. & Liou, J. C. A circumsolar ring of asteroidal dust
in resonant lock with the Earth. Nature 369, 719–723 (1994).
18. Wyatt, M. C. et al. How observations of circumstellar disk asymmetries can reveal hidden planets:
pericenter glow and its application to the HR4796 disk. Astrophys. J. 527, 918–944 (1999).
19. Wyatt, M. C. Resonant trapping of planetesimals by planet migration: debris disk clumps and Vega’s
similarity to the Solar System. Astrophys. J. 598, 1321–1340 (2003).
20. Lagrange-Henri, A. M., Vidal-Madjar, A. & Ferlet, R. The b Pictoris circumstellar disk. VI. Evidence
for material falling on to the star. Astron. Astrophys. 190, 275–282 (1988).
21. Beust, H., Vidal-Madjar, A., Ferlat, R. & Lagrange-Henri, A. M. Cometary-like bodies in the
protoplanetary disk around b Pictoris. Astrophys. Space Sci. 212, 147–157 (1994).
22. Wyatt, M. C. & Dent, W. R. F. Collisional processes in extrasolar planetesimal discs—dust clumps in
Fomalhaut’s debris disc. Mon. Not. R. Astron. Soc. 334, 589–607 (2002).
23. Brandeker, A., Liseau, R., Olofsson, G. & Fridlund, M. The spatial structure of the b Pictoris gas disk.
Astron. Astrophys. 413, 681–691 (2004).
24. Dominik, C. & Decin, G. Age dependence of the Vega phenomenon: theory. Astrophys. J. 598, 626–635
(2003).
25. Hartmann, W. K. & Davis, D. R. Satellite-sized planetesimals and lunar origin. Icarus 24, 504–515
(1975).
26. Dermott, S. F., Kehoe, T. J. J., Durda, D. D., Grogan, K. & Nesvorny, D. in Asteroids, Comets, and
Meteors 2002 (ed. Warmbein, B.) ESA SP-500, 319–322 (Publications Division, Noordwijk, 2002).
27. Kenyon, S. J. & Bromley, B. C. Detecting the dusty debris of terrestrial planet formation. Astrophys. J.
602, L133–L136 (2004).
28. Van Paradijs, J., Telesco, C. M., Kouveliotou, C. & Fishman, G. J. 10 micron detection of the hard x-ray
transient GRO J0422+32: free-free emission from an x-ray-driven accretion disk wind? Astrophys. J.
429, L19–L23 (1994).
Acknowledgements We dedicate this paper to the memory of our colleague F. Gillett, infrared
astronomy pioneer and co-discoverer of circumstellar debris disks. We thank K. Hanna, J. Julian
and R. Pina for contributions to the success of T-ReCS; F. Varosi for assistance with data
reduction; the Gemini Observatory staff in Chile, particularly M.-C. Hainaut-Rouelle, for
technical assistance; and D. Simons of Gemini Observatory for support. This paper is based on
observations (programme number GS-2003B-14) obtained at the Gemini Observatory, which is
operated by the Association of Universities for Research in Astronomy, Inc., under a cooperative
agreement with the NSF on behalf of the Gemini partnership: the National Science Foundation
(United States), the Particle Physics and Astronomy Research Council (United Kingdom), the
National Research Council (Canada), CONICYT (Chile), the Australian Research Council
(Australia), CNPq (Brazil) and CONICET (Argentina). This research was funded in part by an
NSF grant to C.M.T.
Competing interests statement The authors declare that they have no competing financial
interests.
Correspondence and requests for materials should be addressed to C.M.T.
..............................................................
Revised rates for the stellar triple-aprocess from measurement of 12Cnuclear resonancesHans O. U. Fynbo1, Christian Aa. Diget1, Uffe C. Bergmann2,Maria J. G. Borge3, Joakim Cederkall2, Peter Dendooven4, Luis M. Fraile2,Serge Franchoo2, Valentin N. Fedosseev2, Brian R. Fulton5,Wenxue Huang6, Jussi Huikari6, Henrik B. Jeppesen1, Ari S. Jokinen6,7,Peter Jones6, Bjorn Jonson8, Ulli Koster2, Karlheinz Langanke1,Mikael Meister8, Thomas Nilsson2, Goran Nyman8, Yolanda Prezado3,Karsten Riisager1, Sami Rinta-Antila6, Olof Tengblad3, Manuela Turrion3,Youbao Wang6, Leonid Weissman2, Katarina Wilhelmsen8,Juha Aysto6,7 & The ISOLDE Collaboration2
1Department of Physics and Astronomy, University of Aarhus, 8000 Arhus C,Denmark2CERN, CH-1211 Geneva 23, Switzerland3Instituto Estructura de la Materia, CSIC, Serrano 113bis, E-28006, Madrid,Spain4KVI, Zernikelaan, 9747 AA Groningen, The Netherlands5Department of Physics, University of York, Heslington, YO10 5DD, UK6Department of Physics, University of Jyvaskyla, FIN-40351 Jyvaskyla, Finland7Helsinki Institute of Physics, FIN-00014 University of Helsinki, Finland8Experimental Physics, Chalmers University of Technology and GoteborgUniversity, S-41296 Goteborg, Sweden.............................................................................................................................................................................
In the centres of stars where the temperature is high enough,three a-particles (helium nuclei) are able to combine to form 12Cbecause of a resonant reaction leading to a nuclear excited state1.(Stars with masses greater than ,0.5 times that of the Sun will atsome point in their lives have a central temperature high enoughfor this reaction to proceed.) Although the reaction rate is ofcritical significance for determining elemental abundances in the
letters to nature
NATURE | VOL 433 | 13 JANUARY 2005 | www.nature.com/nature136© 2005 Nature Publishing Group


![Solutions of Mid Semester Examination - Webs of Mid Semester Examination DataGiven: Densityofwater,ˆ= 1000 kg/m3,gravitationalacceleration,g= 9:81 m/s2 Question # 1: [4+4+2] Considertheflowofwaterthroughacleartube(cross-sectionareaA](https://static.fdocument.org/doc/165x107/5b2472ca7f8b9ad64b8b4c61/solutions-of-mid-semester-examination-of-mid-semester-examination-datagiven-densityofwater.jpg)