Math and the Olympics - Simon Fraser...
64
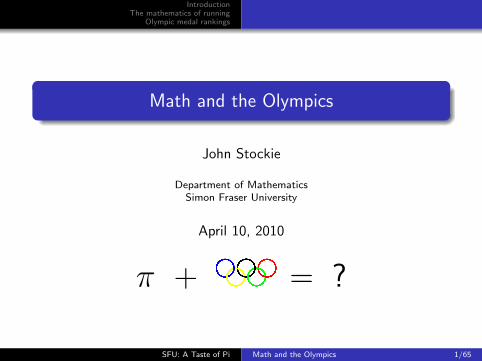
Introduction The mathematics of running Olympic medal rankings Math and the Olympics John Stockie Department of Mathematics Simon Fraser University April 10, 2010 π + =? SFU: A Taste of Pi Math and the Olympics 1/65
Transcript of Math and the Olympics - Simon Fraser...
IntroductionThe mathematics of running
Olympic medal rankings
Math and the Olympics
John Stockie
Department of MathematicsSimon Fraser University
April 10, 2010
π + = ?
SFU: A Taste of Pi Math and the Olympics 1/65

IntroductionThe mathematics of running
Olympic medal rankings
Outline
1 Introduction
2 The mathematics of runningTrack geometryDynamic models for sprinting
3 Olympic medal rankingsWeighted medal countsBiases in medal rankings
SFU: A Taste of Pi Math and the Olympics 2/65

IntroductionThe mathematics of running
Olympic medal rankings
Outline
1 Introduction
2 The mathematics of runningTrack geometryDynamic models for sprinting
3 Olympic medal rankingsWeighted medal countsBiases in medal rankings
SFU: A Taste of Pi Math and the Olympics 3/65

IntroductionThe mathematics of running
Olympic medal rankings
Why study sport?
Sports and games have played a central role in human life forthousands of years – some researchers claim we’re geneticallyprogrammed to compete in sports!
Many sports are major cultural and social phenomena(e.g., soccer in Latin America).
Everyone can participate in sport, at least recreationally.
Everyone can be (likes to be) an “expert” on some sport.
Today’s media permits us to view sporting events from aroundthe world in real time.
Professional sport is a multi-billion dollar business!
Sport is complex scientifically (i.e., interesting).
It’s fun!
SFU: A Taste of Pi Math and the Olympics 4/65

IntroductionThe mathematics of running
Olympic medal rankings
Why study math in sport?
It’s a challenge: complexities in sport appear on many levels:
individuals, pairs, teams, leagues, tools,and their interactions
. . . and in many different aspects of sport:
biomechanics, judging, tournament design, technology,rankings, gambling, crowd control, finance,
media ratings, nutrition, doping, . . .
. . . all of which can be described mathematically!
There’s an opportunity: advanced mathematical techniqueshave not penetrated sport science as much as other “hard”sciences (physics, chemistry, . . . )
Math is general: methods developed for one sport can oftenbe applied to others.
It’s fun!
SFU: A Taste of Pi Math and the Olympics 5/65

IntroductionThe mathematics of running
Olympic medal rankings
Perspective: Benefits of sport
Sadovskiı and Sadovskiı, Mathematics and Sports:
“Sports have a beneficial effect on one’s intellectual activities,state of mind, and will power . . . the extraordinary longevity ofmany of our outstanding mathematicians and physicists is due totheir affinity for sports.”
Examples: Niels Bohr (soccer, skiing), Einstein (yachting),Joe Keller (tennis, golf, . . . ), and many others.
SFU: A Taste of Pi Math and the Olympics 6/65

IntroductionThe mathematics of running
Olympic medal rankings
Perspective: Recognition of athletes vs. scientists
Society has an unreasonable fascination with athletes, and rewardsthem disproportionately . . .
Vitruvius (1st century BC):
“The wrestler, by training, merely hardens his own body for theconflict; a [writer], however, not only cultivates his own mind, butaffords every one else the same opportunity, by laying downprecepts or acquiring knowledge and exciting the talents of hisreader . . . Since individuals as well as the public are so indebted tothese [writers] for the benefits they enjoy, I think them not onlyentitled to the honour of palms and crowns, but even to benumbered among the gods.”
To the Greeks: “writer” = “scientist” or “mathematician”
SFU: A Taste of Pi Math and the Olympics 7/65

IntroductionThe mathematics of running
Olympic medal rankings
Why study the Olympics?
It involves a wide variety of sports.
It’s the largest sporting event in the world.
The Winter Games descended on Vancouver inFebruary/March 2010!
SFU: A Taste of Pi Math and the Olympics 8/65

IntroductionThe mathematics of running
Olympic medal rankings
Why teach (take) a course on math in Olympic sport?
WHY NOT?!
Many resources available at http://www.mathaware.org.
SFU: A Taste of Pi Math and the Olympics 9/65

What equations describe the
mechanics of a golf swing?
Mathematics Awareness Month | April 2010Mathematics Awareness Month - April 2010 Mathematics and Sports
Ph
oto
: Stu
art Franklin
/Ge
tty Imag
es
Sponsored by the Joint Policy Board for Mathematics: American Mathematical Society | American Statistical Association | Mathematical Association of America | Society for Industrial and Applied Mathematics www.mathaware.org
Mathematics can answer this question and many others. www.mathaware.org
A B B
Bh
θ φ φ θ φ φ θ τ τθ
+ ( ) ( ) = +cos – – sin – –
co
20
ss – sin – –φ θ θ φ θ φ τ( ) + ( ) + =B C h
2
v vc m
m mball cR c
c ball
=+( )
+lublub
lub
1

IntroductionThe mathematics of running
Olympic medal rankings
And yes, golf is an Olympic sport!!(starting in London 2012)
SFU: A Taste of Pi Math and the Olympics 11/65

IntroductionThe mathematics of running
Olympic medal rankings
Math 302: Topics
This talk is based on a course (MATH 302) taught in Fall 2009:
Who really won the Olympics? (medals)
What are the limits of human performance? (records)
Who is the fastest person on the planet? (running)
Is there an optimal technique for putting a shot? (projectiles)
How miraculous was the “1968 Mexico City long jump miracle”?
What are the chances of winning at tennis?
Is there really a home ice advantage in the Stanley Cup playoffs?(tournaments)
Is the judging system in figure skating a fair one?
Does the Olympic triathlon penalize good swimmers?
The economics of major sporting events.
SFU: A Taste of Pi Math and the Olympics 12/65

IntroductionThe mathematics of running
Olympic medal rankings
Math 302: Projects
SFU: A Taste of Pi Math and the Olympics 13/65

IntroductionThe mathematics of running
Olympic medal rankings
Mathematical content of this talk
In the next little while, we’ll delve into some
geometry
calculus: derivatives, integrals and differential equations
statistics (“descriptive statistics”, nothing serious)
. . . with some physics thrown in for good measure!
SFU: A Taste of Pi Math and the Olympics 14/65

IntroductionThe mathematics of running
Olympic medal rankings
Track geometryDynamic models for sprinting
Outline
1 Introduction
2 The mathematics of runningTrack geometryDynamic models for sprinting
3 Olympic medal rankingsWeighted medal countsBiases in medal rankings
SFU: A Taste of Pi Math and the Olympics 15/65

IntroductionThe mathematics of running
Olympic medal rankings
Track geometryDynamic models for sprinting
How fast can people run? And why?Ben Johnson (CAN) Oscar Pistorius (RSA)
Florence Griffith-Joyner (USA)
(l-r) Asafa Powell (JAM)Tyson Gay (USA)Usain Bolt (JAM)
SFU: A Taste of Pi Math and the Olympics 16/65

IntroductionThe mathematics of running
Olympic medal rankings
Track geometryDynamic models for sprinting
Running is arguably the oldest sport, and also one of the simplest.
BUT there are still many aspects of running that are worthy ofstudy:
physics governing forces and propulsion,
air resistance,
oxygen intake and metabolism, and how they governperformance,
race strategies,
(for track events) design of the track itself,
progression of records.
SFU: A Taste of Pi Math and the Olympics 17/65

IntroductionThe mathematics of running
Olympic medal rankings
Track geometryDynamic models for sprinting
Origin of the word “stadium”
stadium (Greek) =stadion or stade:
An ancient Greek footrace. Theword changed in meaning overtime to mean a standard measureof length for the race, roughly180–200 m. Later, it was alsoused to refer to the actual placewhere the race took place.
The original Greek stadion waslong and narrow.
SFU: A Taste of Pi Math and the Olympics 18/65

IntroductionThe mathematics of running
Olympic medal rankings
Track geometryDynamic models for sprinting
Constraints on outdoor track design
The typical outdoor track is designed as follows:
Two straight sections joined by semi-circular ends.
Semi-circular ends have radius 36.5 m.
Complete circuit around lane 1 measures 400 m.
(picky point) Running distance is measured along a line 0.3 mfrom the inner edge of lane 1, and 0.2 m from the inner edgeof all other lanes.
8 lanes, each of width 1.25 m. Lanes are numbered startingfrom 1 on the inside.
Question 1:
Based on these constraints, what is the length of the straights?
SFU: A Taste of Pi Math and the Olympics 19/65

IntroductionThe mathematics of running
Olympic medal rankings
Track geometryDynamic models for sprinting
SFU: A Taste of Pi Math and the Olympics 20/65

IntroductionThe mathematics of running
Olympic medal rankings
Track geometryDynamic models for sprinting
Circular tracks?
Question 2:
Why don’t they simply make running tracks circular?
There are a number of reasons:
A straight stretch is required for events 6 100 m.
The javelin event is held in the middle of the track. Thelongest throws are ≈ 100 m, which rules out circular andlong/thin tracks for safety reasons.
When running around curved sections:
Runners experience centrifugal force which slows their progress.Circular tracks have a constant curvature, and so runners getno relief from this force.Curvature is greatest in lane 1 which puts that runner at adisadvantage.
SFU: A Taste of Pi Math and the Olympics 21/65

IntroductionThe mathematics of running
Olympic medal rankings
Track geometryDynamic models for sprinting
Why counter-clockwise?
Question 3:
Why are running events on a track always run counter-clockwise?
The answer to this question is not known as far as I can tell. Somepossible answers (gleaned mostly from internet discussion groups):
Asymmetry in human bodies means the right leg is stronger thanthe left leg – “leggedness” follows “handedness”??
To please the crowd. When runners are nearest to spectators, theyperceive the runners moving from left to right – the same directionour eyes move when we read.
The Coriolis effect, due to the Earth’s rotation. But then why aretracks the same in Australia?
If runners ran clockwise, lane numbers would be upside down.
The choice was arbitrary and has been passed down over time(think baseball).
SFU: A Taste of Pi Math and the Olympics 22/65

IntroductionThe mathematics of running
Olympic medal rankings
Track geometryDynamic models for sprinting
Take your marks. Set. BANG!
Running races aretraditionally initiated by astarter who shoots a pistolfrom a location on theinside of the track, closestto lane 1.
The starter is usuallybetween 2 and 10 m awayfrom lane 1’s startposition, located on theinside of the track.
Since the speed of sound is 343 m/s, the retort of the pistolwill be heard first by the runner in lane 1 and slightly later bythe other runners.
SFU: A Taste of Pi Math and the Olympics 23/65

IntroductionThe mathematics of running
Olympic medal rankings
Track geometryDynamic models for sprinting
Question 4:
Does the delay in hearing the starting pistol amount to asignificant disadvantage for runners in lanes 2 through 8?
Consider the 100 m sprint (not staggered) and assume the starteris on the same line as the runners.
SFU: A Taste of Pi Math and the Olympics 24/65

IntroductionThe mathematics of running
Olympic medal rankings
Track geometryDynamic models for sprinting
Fairness in starting IIMany (most?) international competitions now require an electronic pistoland speakers behind each starting block.
In the USATF Rules of Competition:
“In races where the competitors are not placed behind the same startingline, the Starter should use a microphone transmitting to speakerspositioned at or near the starting line in each lane. Where such a deviceis not used, the Starter shall so be placed that the distance between theStarter and each of the competitors is approximately the same.”
World Championships (and other events) started using electronicguns in 1995.
Olympics use a “loud gun,” with the sound sent over a speakerbehind the starting block.
Loud gun could favour runners in lane 1, for several reasons . . .
[ Science Update (www.sciencenetlinks.com): article — podcast ]
SFU: A Taste of Pi Math and the Olympics 25/65

IntroductionThe mathematics of running
Olympic medal rankings
Track geometryDynamic models for sprinting
The “loud gun” method should not be used
Julin and Dapena (2003) studied loud and silent guns:
They measured starting/reaction times in all 8 lanes forevents with “silent” and “loud guns.”Reaction times for silent gun do not depend on lane.Reaction times for loud guns increase linearly, with slopeclosely matching the speed of sound.Conclusion: Runners don’t react to the speaker sound eventhough it actually reaches them first!
◦ = loud gun (1996 summer Olymipcs)� = silent gun (1995 world championships)• = calculated using speed of sound
SFU: A Taste of Pi Math and the Olympics 26/65
IntroductionThe mathematics of running
Olympic medal rankings
Track geometryDynamic models for sprinting
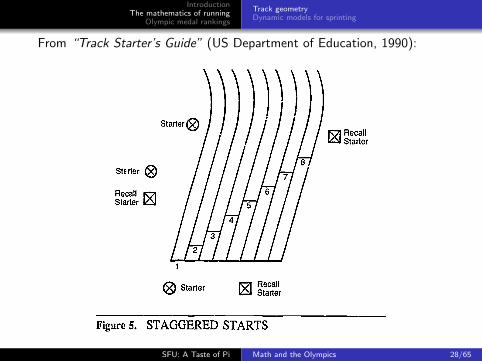
From “Track Starter’s Guide” (US Department of Education, 1990):
SFU: A Taste of Pi Math and the Olympics 28/65

IntroductionThe mathematics of running
Olympic medal rankings
Track geometryDynamic models for sprinting
Staggered starts
In the 400 m run, assume that the starting line for lane 1 is atthe start of a semi-circular section.
Naturally, the finish line must be at the same location as lane1’s starting line (i.e., 1 lap = 400 m).
Question 5:
By what distance must the runners in lanes 2–8 be staggered sothat they also run 400 m when reaching the same finish line?
Note: Marking lanes, especially in international competitions,requires a surprising degree of care and precision!
SFU: A Taste of Pi Math and the Olympics 29/65

IntroductionThe mathematics of running
Olympic medal rankings
Track geometryDynamic models for sprinting
Can you spot an error in this track diagram?
SFU: A Taste of Pi Math and the Olympics 30/65

IntroductionThe mathematics of running
Olympic medal rankings
Track geometryDynamic models for sprinting
Other effects
Centripetal force: reduces peak speed when rounding acurve, which is most disadvantageous to the runner in lane 1– slows time by 0.12 s in the 200 m — HUGE!
Psychology: runner in lane 8 starts ahead of others and socannot see their competitors at the beginning of the race.
Question 6:
Putting all of these lane-dependent effects together (curvature,pistol sound delay, pistol loudness, psychology, . . . ) which lane isreally the best?
An excellent question! Lane 1 seems to be a bad selection, butno-one has a definitive “best choice” yet . . .
SFU: A Taste of Pi Math and the Olympics 31/65

IntroductionThe mathematics of running
Olympic medal rankings
Track geometryDynamic models for sprinting
Outline
1 Introduction
2 The mathematics of runningTrack geometryDynamic models for sprinting
3 Olympic medal rankingsWeighted medal countsBiases in medal rankings
SFU: A Taste of Pi Math and the Olympics 32/65

IntroductionThe mathematics of running
Olympic medal rankings
Track geometryDynamic models for sprinting
Motivation
Running record data indicates aclear trend in record time (oraverage velocity) versus distancerun, suggesting that there issome predictable (bio-)physicalprocess at work.
Question:
Can a mathematical model befound that captures thisbehaviour?
Average velocities fromworld record times
SFU: A Taste of Pi Math and the Olympics 33/65

IntroductionThe mathematics of running
Olympic medal rankings
Track geometryDynamic models for sprinting
Basic physics
We’ll develop a model using Newton’s Laws of Motion:
1 A body remains in a state of rest or uniform motion unlessacted upon by an external force.
2 The net external force acting on a body is equal to theproduct of its mass and its acceleration:
F = m · a = mdv
dt= m
d2x
dt2
( x = distance, v = dxdt = velocity, a = d2x
dt2 = acceleration )
3 For any force, there is an equal and opposite reaction force.
Here, we’ll be mainly concerned with Newton’s Second Law.
SFU: A Taste of Pi Math and the Olympics 34/65

IntroductionThe mathematics of running
Olympic medal rankings
Track geometryDynamic models for sprinting
Forces on a runner
A number of forces act on a runner:
propulsive force of the muscles,
“internal friction,” consisting offrictional and other losses within themuscles and converted into heat,
friction between the feet and ground,
air resistance (≈ 3%).
The largest forces by far are due to musclepropulsion and internal friction.
SFU: A Taste of Pi Math and the Olympics 35/65

IntroductionThe mathematics of running
Olympic medal rankings
Track geometryDynamic models for sprinting
Governing equations
Define:
v(t) = speed of the runner (in m/s) at time t.
F (t) = muscular propulsion force per unit mass(in m/s2) – depends only on time.
R(v) = internal resistance force per unit mass(also in m/s2) – depends on running speed.
Newton’s Second Law then becomes
mdv
dt= mF −mR (1)
SFU: A Taste of Pi Math and the Olympics 36/65

IntroductionThe mathematics of running
Olympic medal rankings
Track geometryDynamic models for sprinting
Governing equations II
Assumption #1 (linearity): internal resistance is linear invelocity. So R(v) = kv with k constant (units 1/s).Assumption #2 (sprinting): During a sprint, a runnerexerts their maximum propulsive force for the entire race. SoF (t) = Fo constant.Using these two assumptions, Equation (1) becomes
dv
dt= Fo − kv
This is a first order, linear, ordinary differential equation(ODE) with constant coefficients!
CAN YOU SOLVE IT?(Townend (1983) has a nice derivation)
SFU: A Taste of Pi Math and the Olympics 37/65

IntroductionThe mathematics of running
Olympic medal rankings
Track geometryDynamic models for sprinting
Impulsive forces
In real races, runners don’t act sopredictably. [ video ]
Occasionally someone puts on aburst of energy, coming frombehind and/or surging ahead.
This burst corresponds to animpulsive force, where “impulsive”=⇒ large and short.
Mimic using the function
fh(t) =
{1h , if −h
2 6 t 6 h2
0, otherwise
where Area = 1 (constant).
SFU: A Taste of Pi Math and the Olympics 38/65

IntroductionThe mathematics of running
Olympic medal rankings
Track geometryDynamic models for sprinting
Impulsive forces II
Mathematicians love to generalize!
Consider the limit as h → 0 and define δ(t) = limh→0
fh(t).
δ(t) is called the Dirac delta function and is an example of a“generalized function” or “distribution.”
Example: forces in collisions between pool balls areparticularly large and act nearly instantaneously.
Mathematical definition of the delta function:
δ(t) =
{+∞, if t = 0
0, if t 6= 0and
∫ ∞
−∞δ(t) = 1
SFU: A Taste of Pi Math and the Olympics 39/65

IntroductionThe mathematics of running
Olympic medal rankings
Track geometryDynamic models for sprinting
Running with an impulsive force
In our running model, we can add an extra term for an impulsiveforce (or “burst of energy”) at time t = t1:
dv
dt= Fo − kv + F1δ(t − t1)
The solution is then
v(t) =
Fok
(1− e−kt
), if t < t1
F1 + Fok
(1− e−kt
), if t > t1
. . . which gives a discontinuous “kick” to the runner’s velocity.
SFU: A Taste of Pi Math and the Olympics 40/65

IntroductionThe mathematics of running
Olympic medal rankings
Track geometryDynamic models for sprinting
Extensions
Other effects that can be incorporated easily into the ODE model:
Track curvature and centripetal forces,
Wind resistance.
This ODE approach can also applied to other sports such as:
cycling
swimming
wheelchair athletics
and others . . .
SFU: A Taste of Pi Math and the Olympics 41/65
IntroductionThe mathematics of running
Olympic medal rankings
Track geometryDynamic models for sprinting
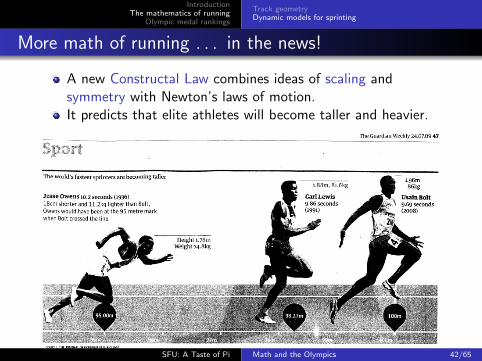
More math of running . . . in the news!
A new Constructal Law combines ideas of scaling andsymmetry with Newton’s laws of motion.It predicts that elite athletes will become taller and heavier.
SFU: A Taste of Pi Math and the Olympics 42/65

IntroductionThe mathematics of running
Olympic medal rankings
Weighted medal countsBiases in medal rankings
Outline
1 Introduction
2 The mathematics of runningTrack geometryDynamic models for sprinting
3 Olympic medal rankingsWeighted medal countsBiases in medal rankings
SFU: A Taste of Pi Math and the Olympics 43/65

IntroductionThe mathematics of running
Olympic medal rankings
Weighted medal countsBiases in medal rankings
Olympic medal rankings
Motivation:
There are many methods for determining Olympic medalstandings. Consequently, different media reports can identifydifferent “winners” for the same Games.
Which method is the “right one”? Which is the most fair?
SFU: A Taste of Pi Math and the Olympics 44/65

IntroductionThe mathematics of running
Olympic medal rankings
Weighted medal countsBiases in medal rankings
Medal standings in the media (Beijing, Summer 2008)
Official IOC standings NBC standings(by gold medal count) (by total medals G+S+B)
www.olympic.org www.nbc.com
SFU: A Taste of Pi Math and the Olympics 45/65

IntroductionThe mathematics of running
Olympic medal rankings
Weighted medal countsBiases in medal rankings
Medal standings in the media (Vancouver, Winter 2010)
Official IOC standings VANOC/USA standings(by gold medal count) (by total medals G+S+B)
wikipedia.org www.vancouver2010.com
SFU: A Taste of Pi Math and the Olympics 46/65

IntroductionThe mathematics of running
Olympic medal rankings
Weighted medal countsBiases in medal rankings
Interesting observations:
All media (except USA, CAN) report “official” IOC rankings,which use lexicographic ordering – nations are ordered by goldmedal count, and silver/bronze only determine ties.
USA/CAN ranking assumes that first, second and thirdplacings have equal merit.
USA consistently wins more silver/bronze than gold!
Canada follows the USA even though the IOC ranking placesCanada first in Winter 2010!!!
Why? I’m guessing that the US media simply overwhelms us.
Question 1:
These two rankings are obviously different. Which is better? Andare there other better ranking methods?
SFU: A Taste of Pi Math and the Olympics 47/65

IntroductionThe mathematics of running
Olympic medal rankings
Weighted medal countsBiases in medal rankings
How much is a medal worth?
Neither lexicographic ordering nor total medal count seemreasonable.
Generalize: Both are examples of a weighted medal count
M = αG + βS + γB
[ IOC: α = 1, β = γ = 0; USA: α = β = γ = 1 ]
SFU: A Taste of Pi Math and the Olympics 48/65

IntroductionThe mathematics of running
Olympic medal rankings
Weighted medal countsBiases in medal rankings
How much is a medal worth? II
M = αG + βS + γB
Certainly, we should restrict 0 < γ < β < α so that:
Each medal has a non-zero value.
Strict inequality means that gold 6= silver 6= bronze.
Hierarchy of medals is maintained.
Question 2:
Is there a “best” choice of weights α, β, γ?
Question 3:
What other factors might we be neglecting?
SFU: A Taste of Pi Math and the Olympics 49/65

IntroductionThe mathematics of running
Olympic medal rankings
Weighted medal countsBiases in medal rankings
Choosing weights: One possible solution
Try weights α = 10, β = 5, γ = 3 (used by may others).
Apply to the Beijing 2008 results, giving a different “top 10”:
IOC Change Nation G S B Total Weighted1 0 China 51 21 28 100 6992 0 USA 36 38 36 110 6583 0 Russian Fed. 23 21 28 72 4194 0 Great Britain 19 13 15 47 3006 +1 Australia 14 15 17 46 2665 -1 Germany 16 10 15 41 2557 0 South Korea 13 10 8 31 20410 +2 France 7 16 17 40 2019 0 Italy 8 10 10 28 1608 -2 Japan 9 6 10 25 150
Top four finishers are unchanged (CHN, USA, RUS, GBR)and rest of the top 10 changes only slightly.
SFU: A Taste of Pi Math and the Olympics 50/65

IntroductionThe mathematics of running
Olympic medal rankings
Weighted medal countsBiases in medal rankings
Choosing weights II
The next 6 in the rankings:
IOC Change Nation G S B Total Weighted11 0 Ukraine 7 5 15 27 14014 +2 Spain 5 10 3 18 10928 +15 Cuba 2 11 11 24 10812 -2 Netherlands 7 5 4 16 10719 +4 Canada 3 9 6 18 9315 -1 Kenya 5 5 4 14 87
Canada jumps 4 positions, from 19th to 15th.
Cuba has the largest gain, from 28th to 13th.
It’s amazing that a nation as small/poor as Cuba (pop. 11M,GDP $55B) can surpass Canada (pop. 33M, GDP $1.5T).
SFU: A Taste of Pi Math and the Olympics 51/65

IntroductionThe mathematics of running
Olympic medal rankings
Weighted medal countsBiases in medal rankings
Medal success and wealth
Plot Gross Domestic Product (GDP) vs. weighted medal totalfor Athens (2004) Summer Olympics.
Fit a straight line to the data using linear regression.
Several countries fitthe straight line quitewell.
The line separatescountries thatperform better(above) or worse(below) than“average”.
SFU: A Taste of Pi Math and the Olympics 52/65

IntroductionThe mathematics of running
Olympic medal rankings
Weighted medal countsBiases in medal rankings
Biases in medal rankings
1 The number of medals generally increases over time owing tothe addition of new sports and events.
2 The number of countries is also increasing, which enhancescompetition (acts to counter bias #1).
3 Certain “special years” yield anomalous results:Boycotts of Montreal 1976 (by 22 nations), Moscow 1980 (66nations), and Los Angeles 1984 (13 nations).Break-up of the Soviet Union between 1988–1996.Exclusion of Germany after WWII (1948).
4 Historically, the host nation has a perceived advantage.
[ NY Times Olympic Medal Map ]
SFU: A Taste of Pi Math and the Olympics 53/65

IntroductionThe mathematics of running
Olympic medal rankings
Weighted medal countsBiases in medal rankings
Biases in medal rankings II
5 All rankings ignore any placings below third.
6 Winter Games are heavily biased toward wealthy nationslocated in the upper latitudes. Summer Games are moreinclusive.
7 Some countries are strategic in an “underhanded” way – theyaim training programs at specific sports solely to maximizemedal counts (e.g., China’s “Project 119”).
8 Some countries do exceedingly well in judged events (figureskating) relative to events that are measured/timed(swimming) or scored (hockey).
SFU: A Taste of Pi Math and the Olympics 54/65

IntroductionThe mathematics of running
Olympic medal rankings
Weighted medal countsBiases in medal rankings
Inequities of simple weightings
Using a ranking based only on weighted medal counts biases theresults in favour of countries that are . . .
wealthy: and able to fund large, national training andrecruitment programs in a wide range of sports
populous: with a much larger pool of athletes to select from
healthy: better health correlates with higher levels of fitness
well-educated: ensures the population has the greatestpossible access to opportunities
Note: These factors are not independent, e.g. health depends onwealth and education.
SFU: A Taste of Pi Math and the Olympics 55/65

IntroductionThe mathematics of running
Olympic medal rankings
Weighted medal countsBiases in medal rankings
Example #1: Eliminate bias due to wealth
Idea: Remove the advantage of wealth by defining a modifiedmedal count that is scaled by GDP:
M =αG + βS + γB
GDP
Results: Using a 10-5-3 weighting the top 10 are:
Mongolia∗, Jamaica, Zimbabwe∗, Georgia, Kenya, Ethiopia,Cuba, Kyrgyzstan∗, Tadjikistan∗, Armenia∗
(∗ denotes GDP in the bottom 10)
Question: Are these really the “winners of the Olympics”?(e.g., recent collapse of Zimbabwe’s economy)
SFU: A Taste of Pi Math and the Olympics 56/65

IntroductionThe mathematics of running
Olympic medal rankings
Weighted medal countsBiases in medal rankings
Example #2: Eliminate bias due to population
Remove the effects of large populations, scaling M bypopulation:
M =αG + βS + γB
POP
Results: The top 10 are again totally different!
Australia, Jamaica∗, Bahamas∗, Iceland∗, Bahrain∗, Slovenia∗,Norway, New Zealand, Estonia∗
(∗ denotes population in the bottom 10)
Neither approach identifies a clear winner, except Jamaica?
Note: India sits at the bottom of the list of medals perpopulation, and second-last in medals per GDP! . . . chronicunderperformer
SFU: A Taste of Pi Math and the Olympics 57/65

IntroductionThe mathematics of running
Olympic medal rankings
Weighted medal countsBiases in medal rankings
Example #3: Host nation advantage
The host nation typically sees a “spike” in medals won relativeto other years.Some possible explanations:
The host nation typically has a large contingent of participants.Athletes are more familiar with venues.Less travel and jet-lag than other countries.
Canada has “underperformed” as host, winning no goldmedals in Montreal (summer 1976) or Calgary (winter 1988).
Idea: Compare the medal count M(Y ) in the host year Y to theaverage for the previous M(Y − 4) and next M(Y + 4) Olympics:
M∗ =M(Y )
12 [M(Y − 4) + M(Y + 4)]
SFU: A Taste of Pi Math and the Olympics 58/65

IntroductionThe mathematics of running
Olympic medal rankings
Weighted medal countsBiases in medal rankings
SFU: A Taste of Pi Math and the Olympics 59/65

IntroductionThe mathematics of running
Olympic medal rankings
Weighted medal countsBiases in medal rankings
Host nation advantage II
Average host wins approximately 2 times as many medals asthey win in other previous/succeeding Games:
In only two years has the host won fewer medals (M∗ < 1).Canada did well in the 2010 Winter Games (M∗ = 2.7)!
SFU: A Taste of Pi Math and the Olympics 60/65
IntroductionThe mathematics of running
Olympic medal rankings
Weighted medal countsBiases in medal rankings
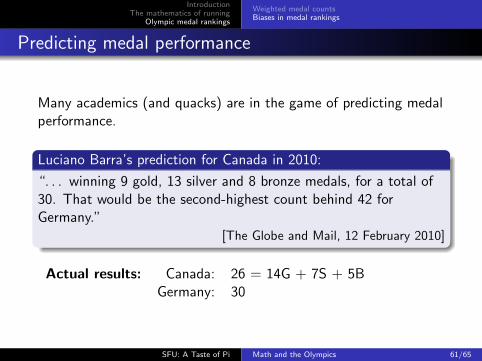
Predicting medal performance
Many academics (and quacks) are in the game of predicting medalperformance.
Luciano Barra’s prediction for Canada in 2010:
“. . . winning 9 gold, 13 silver and 8 bronze medals, for a total of30. That would be the second-highest count behind 42 forGermany.”
[The Globe and Mail, 12 February 2010]
Actual results: Canada: 26 = 14G + 7S + 5BGermany: 30
SFU: A Taste of Pi Math and the Olympics 61/65

IntroductionThe mathematics of running
Olympic medal rankings
Weighted medal countsBiases in medal rankings
Predicting medal performance II
In fact, I have an undergraduate student analysing medal data andlooking at predictions for the 2012 Summer Olympics in London. . .
SFU: A Taste of Pi Math and the Olympics 62/65
IntroductionThe mathematics of running
Olympic medal rankings
Weighted medal countsBiases in medal rankings
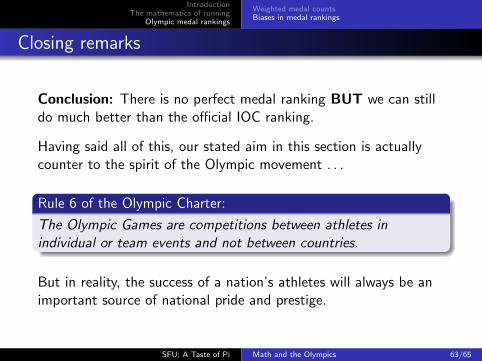
Closing remarks
Conclusion: There is no perfect medal ranking BUT we can stilldo much better than the official IOC ranking.
Having said all of this, our stated aim in this section is actuallycounter to the spirit of the Olympic movement . . .
Rule 6 of the Olympic Charter:
The Olympic Games are competitions between athletes inindividual or team events and not between countries.
But in reality, the success of a nation’s athletes will always be animportant source of national pride and prestige.
SFU: A Taste of Pi Math and the Olympics 63/65

IntroductionThe mathematics of running
Olympic medal rankings
Weighted medal countsBiases in medal rankings
References I
Alexander M. Brown, Zoltan R. Kenwell, Brian K. V. Maraj,and David F. Collins.“Go” signal intensity influences the sprint start.Med. Sci. Sports Exer., 40(6):1144–1150, 2008.
A. Lennart Julin and Jesus Dapena.Sprinters at the 1996 Olympic Games in Atlanta did not hearthe starter’s gun through the loudspeakers on the startingblocks.New Studies in Athletics, 18(1):23–27, 2003.
L. E. Sadovskiı and A. L. Sadovskiı.Mathematics and Sports, volume 3 of Mathematical World.American Mathematical Society, 1993.Translated from the Russian by S. Makar-Limanov.
SFU: A Taste of Pi Math and the Olympics 64/65

IntroductionThe mathematics of running
Olympic medal rankings
Weighted medal countsBiases in medal rankings
References II
Paul M. Sommers.Meddling with Olympic results.J. Recreational Math., 28(1):49–52, 1996.
M. S. Townend.The mathematics of sprinting.Teaching Mathematics and its Applications, 2(3):93–95, 1983.
SFU: A Taste of Pi Math and the Olympics 65/65


![19[A Math CD]](https://static.fdocument.org/doc/165x107/563db786550346aa9a8bd681/19a-math-cd.jpg)