Taxonomic and functional based beta diversity in a western ...
Mapping Patterns of ββ — Diversity for Beetles Across theWestern Amazon Basin: A Preliminary Case for Improving
Inventory Methods and Conservation Strategies
Terry L. Erwin,1 María Cleopatra Pimienta,2 Oscar E. Murillo,3 and Valeria Aschero4
1 Hyper-diversity Group, Department of Entomology, MRC-187, National Museum of Natural History,Smithsonian Institution, Washington, DC 20013-7012, USA, Email: [email protected];
2 Departamento de Biología, Universidad del Valle, Cali, Colombia, Email: [email protected];3 Departamento de Biología, Universidad del Valle, Cali, Colombia, Email: [email protected];
4 Laboratorio de Investigaciones Ecológicas de Las Yungas – Universidad Nacional de Tucumán,Argentina, Email: [email protected]
Beetles sampled by insecticidal fogging were investigated to test for temporal andspatial β-diversity between two western Amazon rain forest sites located less thanone-degree latitude from the equator and 21 kilometers distant from each other. Arigorously controlled sampling regime of terrestrial arthropods in the canopy andunderstory resulted in a dataset containing trans-seasonal and trans-annual infor-mation. This paper focuses on the Carabidae and Curculionidae (Otidocephalini)from a larger dataset because the species accumulation curves for them nearlyreaches an asymptote, that is, enough samples have been sorted to account for near-ly all the canopy species in the general area. Canopy trees in the two sites are verydifferent at the species level (Complementarity Index = 0.73), moderately differentat the generic level (CI = 0.53), but similar at the family level (CI = 0.26). The beetlefauna was predicted to be different at the two sites depending upon feeding guildsbecause the tree species composition is so different. The assumption is made thatplant feeding species have some degree of host specialization, whereas predators andscavengers do not. For otidocephaline Curculionidae and Carabidae, this analysissuggests the opposite of that prediction: a larger percentage of herbivore species areshared between sites than predator species. These results suggest variable degrees ofspecies turnover across short distances in both forest composition and their insectdependents in the western Amazon Basin and this may impact inventory methodsand the conservation strategies derived from them.
Se estudiaron coleópteros muestreados con la técnica de fumigación para determinarla tasa de recambio temporal y espacial de especies (diversidad-β) entre dos sitiosque corresponden a Bosque Húmedo Tropical, localizados a menos de un grado delatitud de la línea Ecuatorial y 21 kilómetros de distancia entre ellos. Un rigurosomuestreo de artrópodos terrestres habitantes del dosel y sotobosque, resultó en unamplio registro de datos conteniendo información inter-estacional e inter-anual. Estainvestigación se centra principalmente en las familias Carabidae y Curculionidae(Otidocephalini) debido a que sus curvas de acumulación de especies casi alcanzanuna asíntota, esto significa, que se han tomado suficientes muestras para registrartodas las especies presentes en el área general. Entre los dos sitios, los árboles sonmuy diferentes a nivel especie (Indice de Complementariedad = 0.73), moderada-mente diferentes a nivel de género (IC= 0.53), pero similares a nivel de familia (IC =
PROCEEDINGS OF THE CALIFORNIA ACADEMY OF SCIENCES
Volume 56, Supplement I, No. 7, pp. 72–85, 11 figs., 1 table. June 3, 2005
72
Reprinted from the Proceedings of the California Academy of Sciences, ser. 4, 56(Suppl. I)
0.26). Predecimos que los escarabajos difieren dependiendo de sus gremios tróficosya que la composición de árboles es diferente. Se asume que las especies herbívorastienen algún nivel de especialización hacia las plantas huéspedes, mientras que lospredadores y carróñenos no. Para los Otidocephalini y Carabidae, nuestro análisissugiere lo opuesto a nuestra predicción: encontramos que el porcentaje de especiesherbívoras compartidas entre sitios es mayor que el porcentaje de las especiespredadoras compartidas. Estos resultados sugieren grados variables en la tasa derecambio de especies a través de distancias cortas tanto a nivel de composición veg-etal del bosque como en los insectos asociados en la cuenca Amazónica Occidental, locual puede tener un impacto en los métodos de inventario y en las estrategias de con-servación derivadas de estos.
Crucial to strategic planning for conservation areas is knowledge of species diversity and theirdistributions, at both local and regional scales across a multitude of fractal universes. If the goal ofconservation strategies is to provide reserved areas for most of biodiversity, and that should be thegoal, knowledge is needed from the fractal universe of mites and tardigrades to that of large treesand their vertebrate inhabitants. Eventually, as technology catches up with inventory, this meansthat the minute organisms (internal and external parasites, bacteria, viruses, etc.) inside and on themites and tardigrades will need documentation, as well. However, at present we have no reason-ably complete biodiversity map (Wilson 2000) that is valid for more than a miniscule percentageof life on the planet, nor do we have practical technology to access the smallest of species — theprokaryotes. Not even all vertebrates, butterflies, nor tree species are well mapped at scales to besignificantly meaningful at a global scale. As pointed out by Lowman and Wittman (1996) andBasset (2001), we know little thus far about patterns in tropical forest canopies, the very heart ofbiodiversity (Erwin 1988). Thus, the question arises, how does one plan areas for conserving mostof the species occurring locally or regionally? Areas now receiving attention may or may not con-tain the same species, whereas those not attended to may have a substantially different fauna andflora. Assumptions derived from larger and supposedly well-known organisms may not serve at allfor minute insects living in the rain forest canopy (cf. Carroll and Pearson 1998).
Our investigation was undertaken to determine spatial and temporal turnover (β-diversity)across 21 kilometers distance in tropical lowland rain forest at the equator in the western AmazonBasin (on the margin of Yasuni National Park) with a very large dataset containing trans-seasonaland trans-annual information. By definition, the two sites studied are representatives of the localfauna and flora in a continuous lowland rain forest, but the question remains, how much of theregional forest biodiversity do they actually represent? Such Neotropical forests are complex notonly in species composition, but also in forest architecture. Because these equatorial forested sitesare complex, it was thought that a study of their canopy and understory arthropod fauna might pro-vide crucial insights regarding the distribution of most of biodiversity in time and space. Theywere, thus, chosen for intensive long-term biodiversity and taxonomic studies. Several studies havesuggested that the western Amazon Basin is the richest biome on Earth (Erwin 1982, 1983a, 1983b,1988; Lamas et al. 1991; Gentry 1993; Kress et al. 1998; Heyer et al. 1999; and Pitman et al. 2001).Preliminary observations across the western Amazon Basin of one family of a dominant tropicalcanopy beetle family (Carabidae) indicated that nearly complete species turnover might be occur-ring every 250 kilometers (cf. Lucky et al. 2002). Unfortunately, methods of collecting and samplesize were not sufficient to give solid evidence for this pattern. For the most part, carabid beetles arepredators. What might be the turnover across distance/seasons for other guilds of beetles? Onemight predict that scavengers, like predators, would be more widespread, whereas herbivores andother types of feeding specialists would be more restricted. In addition, one might predict that host
ERWIN ET AL.: BEETLE DIVERSITY IN WESTERN AMAZON BASIN 73
restricted herbivores and fungivores would have a similar pattern to their hosts locally, but whatabout co-occurring regional patterns? Do local patterns hold regionally? This investigation opensexploration of some of these questions and predictions with canopy and understory fogging events(Erwin 1989; Lucky et al. 2002) on the equator in the western Amazon Basin.
Here, we initiate our reports stemming from fogging events at each of two localities resultingin more than 500,000 beetle specimens. This initial paper focuses on our methods, sites, suite ofstudy taxa, particularly beetles of two families, and observations from preliminary data of another14 family-group taxa. We regard our 16 family-group taxa as a first cut into the massive amount ofdata collected over eight years of field work at four month intervals over an eight year period.Processing 1800 samples containing one half million specimens and taking them to an identifica-tion level of morphospecies are not easy chores. However, we believe that by reporting on our stud-ies periodically we will provoke debate and interest in the project. Our subsequent investigationswill include as many feeding guilds and phylogenetic lineages as possible.
FIELD SITES AND METHODS
Data for the beetles and site vegetation reported in out investigation came from a canopyarthropod biodiversity study, conducted at Onkone Gare Station (cited as “Piraña” in Pitman et al.2001), (0°39′25.685″S, 76°27′10.813″W; 216 m), and Tiputini Biodiversity Station (cited as“Tiputini” in Pitman et al. 2001) (0°37′55.397″S, 76°08′39.204″W; 216 m) Ecuador, betweenJanuary 1994 and July 2002. These two sites are connected by continuous primary tropical rain for-est at the margin of Yasuní National Park in the Ecuadorian part of the Amazon Basin located inOrellana Province. Both sites are at first sight very similar terra firma forest (non-floodplain) con-taining extremely diverse lowland forest vegetation and characteristic of the forests of the westernAmazon Basin (Condit et al. 2002; Pitman et al. 2001; Erwin and Aschero [in preparation]).Precipitation is somewhat seasonal, 2.7 m of rainfall per year, with the dry and wet seasons run-ning from approximately November to April, and May to October, respectively.
Samples
Sampling by insecticidal fogging was employed to gather the specimens we analyzed to deter-mine species turnover of a component of species living in the canopy/understory fractal universes,a measure of at least 2/3 of the biodiversity at this site (cf. Erwin 1982). In order to determine theinsect biodiversity of the forested sites, we established two study plots (Lucky et al. 2002), one in1994 (Piraña) and the other in 1997 (Tiputini). Each was a 100 m × 1000 m area that consisted often 10 m × 100 m transects spaced at 100 m from each other along the plot. Ten collection stations,each 3 m × 3 m, were randomly located within each 10 m × 100 m zone arrayed on both sides of acenterline. Fogging stations at each site were numbered 1–100 at the beginning of the study andwere then, each one, used repeatedly for 9 sampling events across three years, “three seasons” peryear (dry, wet, and wet to dry transitional). Canopy/understory sampling spanned eight years fromJanuary 1994 through July 2002 (intermittent funding as well as sporadic political unrest inEcuador extended the field work at Tiputini), three at the Piraña site and parts of five years at theTiputini site to account for trans-annual variation. In order to account for seasonal variation, sam-pling took place in January/February the dry season, June/July the wet season, as well as October,which represented a transition period between the wet and dry seasons. The fogging techniqueshave been described previously (Erwin 1983a, 1983b). The only modification made for this studyas opposed to those previously undertaken was the use of 3 m×3 m sampling sheets suspended by
74 PROCEEDINGS OF THE CALIFORNIA ACADEMY OF SCIENCESVolume 56, Supplement I, No. 7
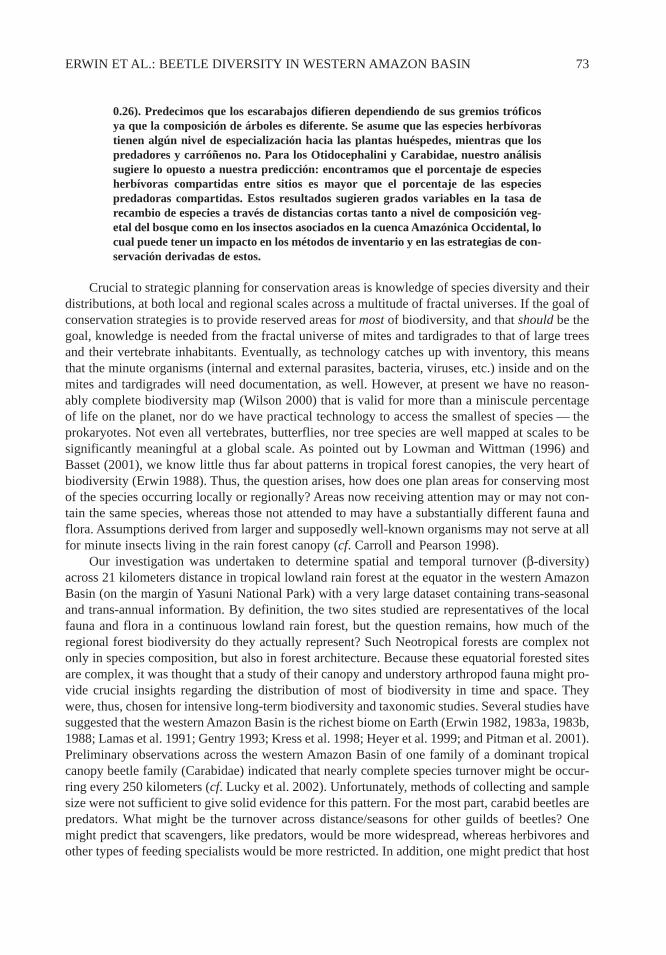
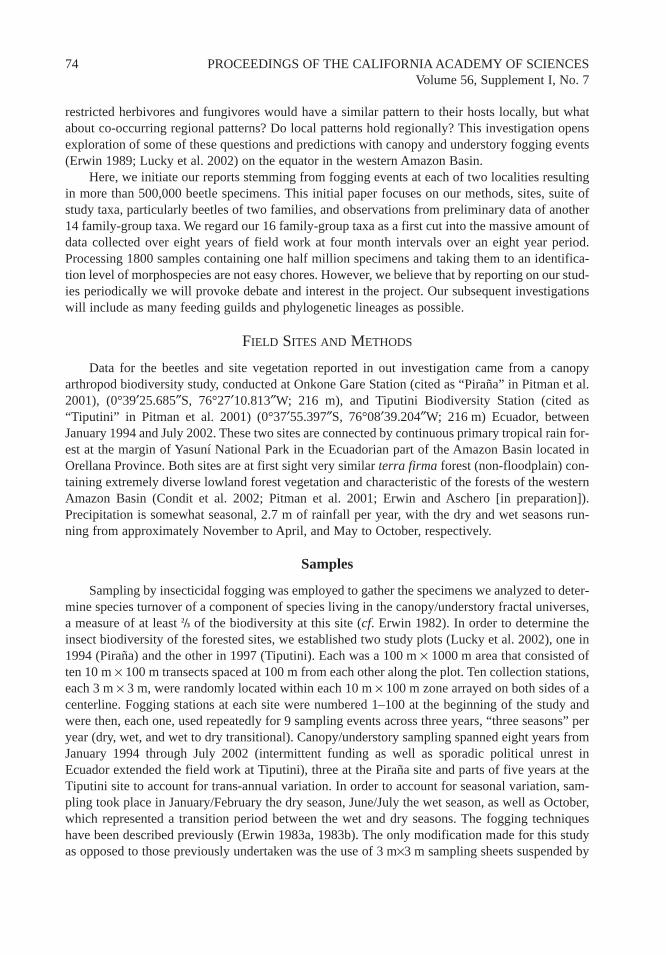
nylon string tied to trees or stakes andarranged one meter off the ground ateach station (Fig. 1). Foggings weremade from just above each sheet as acolumn (1 m to ‘n’ m high) into thecanopy at 0345–0500 hours. Height offog ascendancy was measured for allfogging events. Hence, the target was acolumn of forest including the understo-ry above one meter and the canopy stra-ta at each station. In this area, canopystrata vary from one to three levels, withsome super-emergent trees rising above40 m. None of the widely dispersedsuper-emergents was located over any ofthe fogging stations.
Specimens collected from each fog-ging event at Piraña were sorted and 14target taxa were extracted, including theColeoptera, for another purpose (moni-toring Maxus Oil Company road build-ing activities and their impact on forestarthropods). In order to test for β-Diversity, a plot at Tiputini was established in 1997.Subsequently, a portion of the beetles from both sites was resorted to acquire the 16 family-grouptaxa for the present project. We then sorted at least 600 samples, 300 or more from Piraña and 300from Tiputini from like seasons, of many of the 16 family-group taxa to the level of morphospecies(Table 1). Two of these family-group taxa had been previously removed from all samples for otherstudies (Carabidae, cf. Lucky et al. 2002 and Cleridae for taxonomy). We focus here on two of thefamily-group taxa because only they reached nearly an asymptote on the species accumulationcurve when samples from both plots were combined. No family-group taxon at this point in ourinvestigation has reached an asymptote at one site. We discuss some other family-group taxa hereto illustrate certain points.
In total, the area sampled within each of the two plots (Piraña and Tiputini) was 9250 m2, amere 1.11% of the entire plot area. Previous experiments have demonstrated that faunal re-popula-tion occurs within 10 days after fogging (Erwin unpublished data) and rapid re-population wasagain demonstrated with data from the present study at a time interval of four months. Thus, thesampling setup and methodology permitted re-sampling of the same stations at four-month season-al intervals throughout the three-year study at Piraña without affecting species abundance anddiversity (Lucky et al. 2002).
In order to provide a characterization of forest composition, trees within the two plots’ ten tran-sect zones with diameter at breast height (dbh measured at 1.33 m from tree base) greater than 10cm were tagged by the senior author’s team and subsequently identified by Nigel Pitman and col-leagues (Pitman et al. 2001).
Analysis
We wanted to know if our sampling procedures of selecting 600 samples, one third of our totalof 1800 samples, would be sufficient for comparisons between the two study sites. These compar-
ERWIN ET AL.: BEETLE DIVERSITY IN WESTERN AMAZON BASIN 75
FIGURE 1. Diagrammatic depiction of fogging event stationwith column of effective fog and tree architecture.
isons would have validity only if the Complementarity Index (see below) demonstrates that mostof the targeted fauna at each site is included. In no family-group taxa sorted thus far did we achievean absolute asymptote on the accumulation curves with 600 samples. We believe, however, that weare close enough using 600 samples to analyze the data from one family-group taxon(Curculionidae–Otidocephalini), and we were close enough using the 1200 samples of Carabidaefor initial insights in the local distribution of beetle taxa in our area. Thus, these preliminary resultsare based on far fewer than our total 1800 available samples we took in the field over a period of8 years. We recognize that each family-group taxon will respond differently to theComplementarity analysis depending upon its real diversity, i.e., the larger the taxon’s diversity thegreater is the overestimation bias (Colwell and Coddington 1994).
Analysis Tools
We used the EstimateS Version 6.01b program (Colwell 2000) to obtain the species accumu-lation curves and we used the Complementarity Index (CI) of Colwell and Coddington (1994) todetermine the difference (or turnover) in faunas between the two sites. Sigma Plot 8.0 was used tograph the data from EstimateS. For explanations of the estimators we use here, such as ICE, ACE,Chao 1, Chao 2, and Jack 2, see Colwell and Coddington (1994) and documentation of the programEstimateS at <http://viceroy.eeb.uconn.edu/estimates>.
RESULTS
Characterization of Forest Composition
Within the ten transect zones of the study plot at Piraña, 669 trees with dbh >10cm were foundto represent 250 species and 51 families (data from Pitman, pers. commun.). Forty trees (5.98%)remain unidentified, so the true plot richness may be 9 to 15 species higher. The most common treefamilies, i.e., represented by more than 19 trees each, include (in order of abundance): Fabaceae(87 individuals), Arecaceae (60), Bombacaceae (57), Moraceae (46), Lecythidaceae (43),Burseraceae (36), Cecropiaceae (24) Myristacaceae (22), and Euphorbiaceae (19). The commonesttree is Matisia malacocalyx s. lat. (Bombacaceae) and is represented by 42 individuals.
The trees at Tiputini were similarly tagged by Erwin’s team and subsequently identified, againby Pitman’s team. Within the ten transect zones of the study plot at Tiputini, 623 trees with dbh >10cm were found to represent 252 species, and 48 families (data from N. Pitman pers. comm.).Twenty-nine trees (4.65%) remain unidentified, so the true plot richness may be 5 to 10 specieshigher. The most common tree families, represented by 19 or more trees, include (in order of abun-dance) Fabaceae (82), Moraceae (57), Arecaceae (41), Bombacaceae (27), Cecropiaceae (34), andMyristacaceae (34), Lecythidaceae (30), Euphorbiaceae (27), Sapotaceae (27), Lauraceae (26),Meliaceae (20), and Burseraceae (19). The commonest species is the palm Iriartea deltoidea Ruiz& Pav. and it is represented by 40 individuals.
Although the most common tree species of western terra firma forests are represented in ourplots, only part of the total regional tree species is represented. In addition to our plots, Pitman’steam studied 22 other plots, each one square hectare, across the Yasuni region. He listed 1176 treespecies (Pitman. pers. commun.). The two plots studied here have about 250 species each, thuseach plot represents 21.42% (Tiputini) and 21.26% (Piraña) of regional tree species richness.However, because each plot has a different composition, together they represent about 34% of treespecies richness in the Yasuni region.
As demonstrated above, tree composition at the two sites is very similar at the family level (CI
76 PROCEEDINGS OF THE CALIFORNIA ACADEMY OF SCIENCESVolume 56, Supplement I, No. 7
= 0.26), Fabaceae, Arecaceae, Moraceae, Bombacaceae, Moraceae, Lecythidaceae, Burseraceae,Cecropiaceae, Myristacaceae, and Ephorbiaceae are the commonest families at both sites.However, at the generic level, the difference is more pronounced (CI = 0.52) and at the specieslevel, dramatically so (CI = 0.73) (Erwin and Aschero, in prep.).
Beetle Diversity
The canopy sampling regime from forest columns at Piraña, as described above, resulted incapture of some 1.7 million counted specimens belonging to 16 target taxa. The total samplingregime acquired, based on estimates of other taxa, indicate that we have 3.8 million specimens,49% of which are ants. Beetles in the 900 Piraña samples accounted for 214,747 individuals, 13%of the total of fogging captures. This count was second in abundance at 22% to Diptera (althoughthis dipteran abundance is because of one family whose populations burst out incredibly in therainy season when fungus are available, i.e., Mycetophilidae). We detected no significant seasonaldifference for abundance in the 16 target taxa (see below) across the nine seasonal fogging eventsat Piraña (ANOVA: F = 0.39, P >0.05). From 300 of the samples at Piraña, plus another 300 likesamples at the second site, Tiputini, specimens of 16 family-group beetle taxa were extracted forour study.
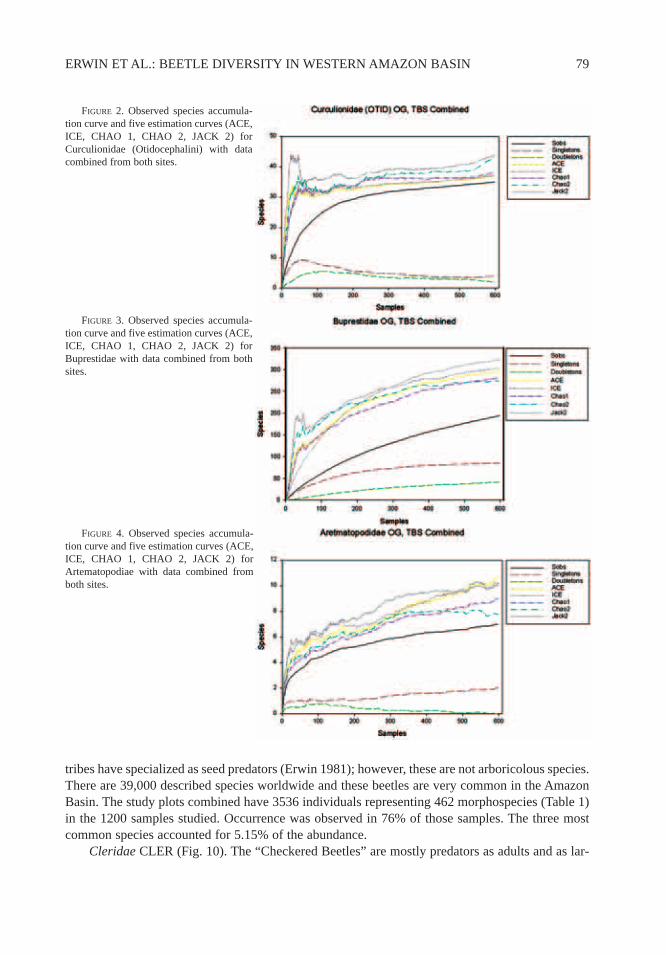
From these Piraña and Tiputini samples, a total of 15,126 adults representing 2010 morpho-species of the target taxa have been sorted to date (Table 1). For one family-group taxon,Curculionidae (Otidocephalini), combining 300 samples from both sites proved adequate to near-ly reach a species accumulation curve asymptote for the area (Fig. 2), whereas in Buprestidae (Fig.3), Artematopodiae (Fig. 4), Cleridae (Fig. 5), and the rest of the families, at least 300 or more sam-ples will need to be added to the database to reach a species accumulation curve asymptote. Oneother family, Carabidae, required analysis of 1200 fogging events to close in on an asymptote (Fig.6). The Carabidae at Piraña were not adequately sampled with 900 samples, however the 300 sam-ples of carabids that have been processed thus far from Tiputini provided enough additional speciesfor a species accumulation curve to reach an asymptote for the local area. When these two family-group taxa were analyzed for Complementarity between the two sites, values were CI= 0.29 for oti-docephaline Curculionidae and CI=0.69 for Carabidae (Table 1).
The Taxa
Artematopodidae ATRM (Fig. 7). The artematopodid beetles are known to be associated withmosses as larvae and adults are found on foliage. There are 60 described species worldwide, andthey are relatively common in tropical forest canopies in the Amazon Basin. The study plots com-bined have 287 individuals representing seven morphospecies (Table 1) in the 600 samples stud-ied. Occurrence was observed in 24.5% of those samples. The three most common species account-ed for 94% of the abundance.
Buprestidae BUPR (Fig. 8). The “Jewel Beetles” visit flowers as adults and bore in plant tis-sue as larvae. There are 15,000 described species worldwide and these beetles are very common inthe Amazon Basin. The study plots combined have 544 individuals representing 194 morpho-species (Table 1) in the 600 samples studied. Occurrence was observed in 47% of those samples.The three most common species accounted for 6.13% of the abundance.
Carabidae CARA (Fig. 9). The “Ground Beetles” (appropriately named in temperate region,however, in the tropics more than 50% of the species live on shrubs and trees) are for the most partpredatory on other arthropods or their eggs, as both adults and larvae. Members of the dominantcanopy genus, Agra, have been observed drinking plant exudates (Arndt et al. 2001). Two large
ERWIN ET AL.: BEETLE DIVERSITY IN WESTERN AMAZON BASIN 77
78 PROCEEDINGS OF THE CALIFORNIA ACADEMY OF SCIENCESVolume 56, Supplement I, No. 7
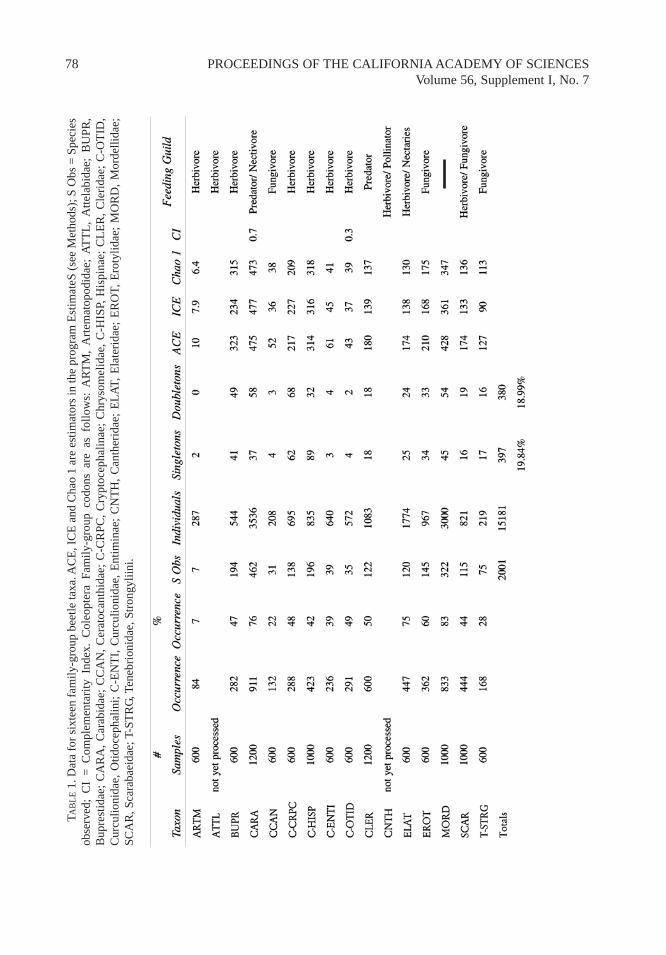
TAB
LE
1.D
ata
for
sixt
een
fam
ily-g
roup
bee
tle ta
xa. A
CE
, IC
E a
nd C
hao
1 ar
e es
timat
ors
in th
e pr
ogra
m E
stim
ateS
(se
e M
etho
ds);
S O
bs =
Spe
cies
obse
rved
; C
I =
Com
plem
enta
rity
Ind
ex.
Col
eopt
era
Fam
ily-g
roup
cod
ons
are
as f
ollo
ws:
AR
TM
, A
rtem
atop
odid
ae;
AT
TL
, A
ttela
bida
e; B
UPR
,B
upre
stid
ae;
CA
RA
, C
arab
idae
; C
CA
N,
Cer
atoc
anth
idae
; C
-CR
PC,
Cry
ptoc
epha
linae
; C
hrys
omel
idae
, C
-HIS
P, H
ispi
nae;
CL
ER
, C
leri
dae;
C-O
TID
,C
urcu
lioni
dae,
Otid
ocep
halin
i; C
-EN
TI,
Cur
culio
nida
e, E
ntim
inae
; C
NT
H,
Can
ther
idae
; E
LA
T, E
late
rida
e; E
RO
T, E
roty
lidae
; M
OR
D,
Mor
delli
dae;
SCA
R, S
cara
baei
dae;
T-S
TR
G, T
eneb
rion
idae
, Str
ongy
liini
.
tribes have specialized as seed predators (Erwin 1981); however, these are not arboricolous species.There are 39,000 described species worldwide and these beetles are very common in the AmazonBasin. The study plots combined have 3536 individuals representing 462 morphospecies (Table 1)in the 1200 samples studied. Occurrence was observed in 76% of those samples. The three mostcommon species accounted for 5.15% of the abundance.
Cleridae CLER (Fig. 10). The “Checkered Beetles” are mostly predators as adults and as lar-
ERWIN ET AL.: BEETLE DIVERSITY IN WESTERN AMAZON BASIN 79
FIGURE 2. Observed species accumula-tion curve and five estimation curves (ACE,ICE, CHAO 1, CHAO 2, JACK 2) forCurculionidae (Otidocephalini) with datacombined from both sites.
FIGURE 3. Observed species accumula-tion curve and five estimation curves (ACE,ICE, CHAO 1, CHAO 2, JACK 2) forBuprestidae with data combined from bothsites.
FIGURE 4. Observed species accumula-tion curve and five estimation curves (ACE,ICE, CHAO 1, CHAO 2, JACK 2) forArtematopodiae with data combined fromboth sites.
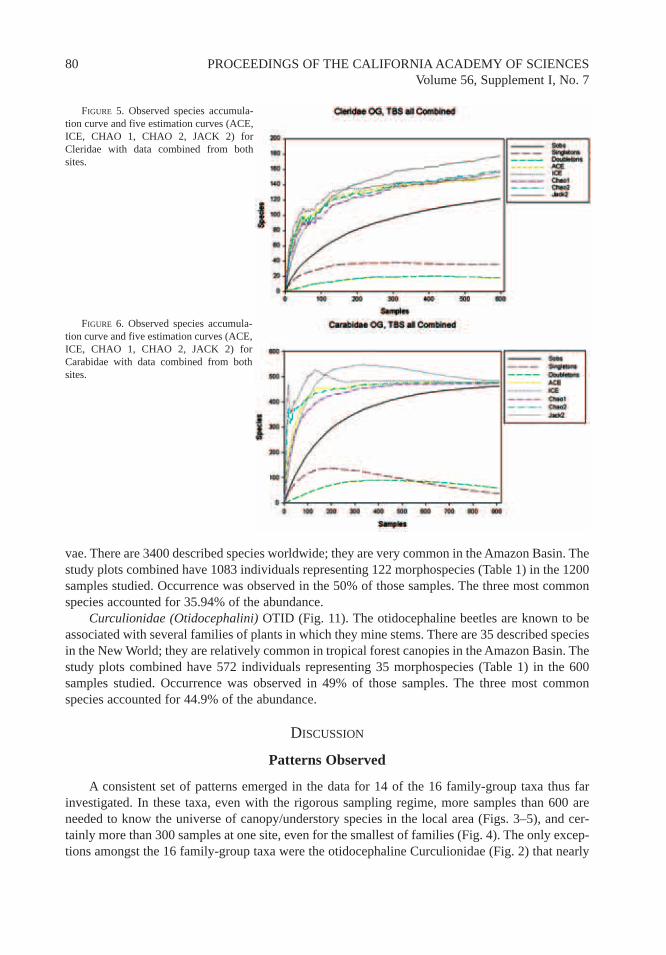
vae. There are 3400 described species worldwide; they are very common in the Amazon Basin. Thestudy plots combined have 1083 individuals representing 122 morphospecies (Table 1) in the 1200samples studied. Occurrence was observed in the 50% of those samples. The three most commonspecies accounted for 35.94% of the abundance.
Curculionidae (Otidocephalini) OTID (Fig. 11). The otidocephaline beetles are known to beassociated with several families of plants in which they mine stems. There are 35 described speciesin the New World; they are relatively common in tropical forest canopies in the Amazon Basin. Thestudy plots combined have 572 individuals representing 35 morphospecies (Table 1) in the 600samples studied. Occurrence was observed in 49% of those samples. The three most commonspecies accounted for 44.9% of the abundance.
DISCUSSION
Patterns Observed
A consistent set of patterns emerged in the data for 14 of the 16 family-group taxa thus farinvestigated. In these taxa, even with the rigorous sampling regime, more samples than 600 areneeded to know the universe of canopy/understory species in the local area (Figs. 3–5), and cer-tainly more than 300 samples at one site, even for the smallest of families (Fig. 4). The only excep-tions amongst the 16 family-group taxa were the otidocephaline Curculionidae (Fig. 2) that nearly
80 PROCEEDINGS OF THE CALIFORNIA ACADEMY OF SCIENCESVolume 56, Supplement I, No. 7
FIGURE 5. Observed species accumula-tion curve and five estimation curves (ACE,ICE, CHAO 1, CHAO 2, JACK 2) forCleridae with data combined from bothsites.
FIGURE 6. Observed species accumula-tion curve and five estimation curves (ACE,ICE, CHAO 1, CHAO 2, JACK 2) forCarabidae with data combined from bothsites.
ERWIN ET AL.: BEETLE DIVERSITY IN WESTERN AMAZON BASIN 81
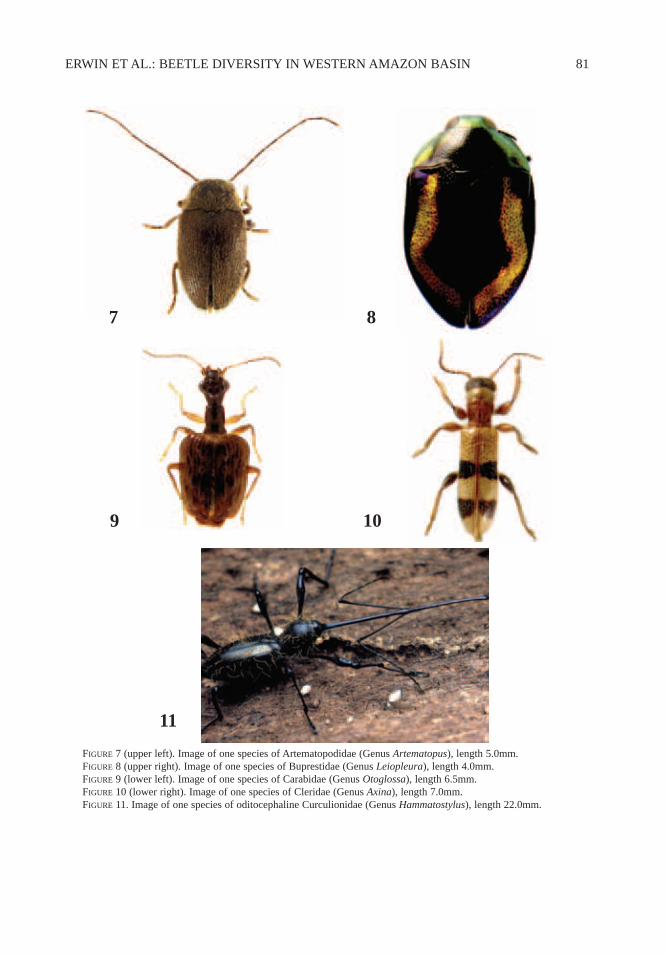
FIGURE 7 (upper left). Image of one species of Artematopodidae (Genus Artematopus), length 5.0mm.FIGURE 8 (upper right). Image of one species of Buprestidae (Genus Leiopleura), length 4.0mm.FIGURE 9 (lower left). Image of one species of Carabidae (Genus Otoglossa), length 6.5mm.FIGURE 10 (lower right). Image of one species of Cleridae (Genus Axina), length 7.0mm.FIGURE 11. Image of one species of oditocephaline Curculionidae (Genus Hammatostylus), length 22.0mm.
7 8
9 10
11
reach an asymptote with 600 samples and the Carabidae (Fig. 6) that required 1200 samples, butonly when samples were combined from both sites.
The difference in number of individual trees at Piraña (669) and Tiputini (623) is accountedfor by a blow-down along two transects between the time of setting up the plot and its inventoryby Pitman’s team. Some 30 trees were felled in this blow-down and were not included on the iden-tification list. Even so, both of our study sites represent accurately the expected tree compositionof the terra firma forests in the equatorial Amazon Basin. The Piraña site accounts for 80.5% andTiputini for 82.9% of the total 41 common species identified that dominate this type of vegetationin the Yasuni area (Pitman et al. 2001). For a more detail explanation of how similar westernAmazonian forests are in terms of tree oligarchies, and particularly the Ecuadorian forests, seePitman et al. (2001).
Analyses Compared
Even though we did not have all possible species at either of the two sites, we had indicationsthat we had close to all the species of the “regional” fauna in two family-group taxa. So, we decid-ed to do an analysis of complementarity for those. We predicted that we would get an overestima-tion of distinctness for the sites and this would be more exaggerated for the highly diverseCarabidae (cf. Colwell and Coddington 1994). Even so, based on the disparity between the CIs, therelationship between the two CIs was of interest, even if overestimated. This analysis hinted at ahigh degree of turnover for the carabids between the sites (CI = 0.69), and much less so for the oti-docephaline Curculionidae (CI = 0.29). This is the opposite of what we predicted. The former arepredators and would not be expected to be dependent on the vegetation in some way as food. Luckyet al. (2002) showed that only palms significantly affected carabids negatively at Piraña, that is, themore palms the less carabid species richness. The weevils are herbivores and should reflect themarked degree of complementarity of tree species between the sites, but they do not. We do notknow enough about the host plants for the weevils; perhaps they use only the commonest treespecies as hosts which make up the majority of the tree flora at both sites (see above); thereforethey could occur everywhere in this type of forest.
Even though members of both Carabidae and Cleridae are comparable predator taxa, theclerids (Fig. 5) were not sampled with the same efficiency as the carabids. The carabids form twodistinct components of the fauna: ground dwellers and canopy dwellers. Almost no ground dwellerswere sampled by fogging. Thus, the results are based on species that live in the canopy habitat.Whereas adult clerids concentrate on fallen trees and limbs in the understory, perhaps moving tothe canopy occasionally where there is dead wood and their prey, there are many more chance cap-tures with the fogging technique for clerids, and hence more singletons or doubletons turn up whichaffect the EstimateS algorithms.
A careful look at the larger dataset for Carabidae reveals that after inadequately reaching theaccumulation curve asymptote at the Piraña site, more than 100 additional species were found atTiputini in a mere 1/3 of the available samples. Then, with both sites combined using various esti-mators, an asymptote was nearly reached. This was due to lowering the number of singletons anddoubletons with additional samples. Are the other family patterns the same? Or, will the smallerfamilies behave as did the Cleridae that were not adequately sampled at Piraña, nor fully sampledregionally even with 1200 samples. It is likely that some definitive conclusions might be reachedwhen all 1800 samples of several families are analyzed. Until these are all processed, what doesthis preliminary step in the study tell us?
82 PROCEEDINGS OF THE CALIFORNIA ACADEMY OF SCIENCESVolume 56, Supplement I, No. 7
Results Applied
A faunistic and floristic inventory can be an important and necessary tool for planning and cre-ating protected areas. Also, such inventories establish the basic information for monitoring com-munity dynamics in space and time. Our study provides methodological information that couldassist in the design and creation of protocols for entomofauna inventories in the Amazonian terrafirma forests and elsewhere. We have demonstrated that it is likely possible to adequately sampleinsect family-group taxa for a local area in a relatively short time, inexpensively, even in an areaof incredible diversity.
A series of fogging plots across a region at various floristically determined locals rigorouslysampled, as were Piraña and Tiputini, may better describe the apparent mosaic distribution ofcanopy and understory arthropods (e.g., in plants, see Tuomisto et al. 2003). For all terrestrialarthropod species and other organisms, larger and more diversely sampled plots will be necessary(Erwin, in prep.) and undertaken on the scale accomplished by Tuomisto et al. (2003). This shouldlead to better understanding of species diversity and distributions, in turn leading to better strate-gic planning for conservation areas.
Equatorial forests are incredibly rich in beetle species dwelling in the canopy and understoryvegetation, even at a local scale. The pattern of distribution of species is likely arrayed in a mosa-ic or discontinuous pattern rather than evenly distributed across the local landscape (Tuomisto etal. 2003). With our present knowledge, we cannot predict whether it is very subtle forest, soil, orclimatic differences, or perhaps something historical that accounts for the pattern; likely, it is acombination of many things and probably a different suite of things for different taxa. Our resultshint at a variable degree of species turnover across feeding guilds and across a forest mosaic with-in short distances even in similar forests in the western Amazon Basin, which in turn suggests thata conservation strategy of a few large conservation areas widely separated may not preserve a largeshare of existing biodiversity, namely insect species. Perhaps a new conservation paradigm may benecessary if we are to protect much of Earth’s precious natural heritage in the fractal universehumans normally ignore, that of very small terrestrial arthropods.
ACKNOWLEDGMENTS
Foggers: The following (in order of number of times of participation) were those who treadout into the forest at 0345 hours to set up collection sheets and clear paths for operations, a trulydedicated bunch: First Team (also includes substantial specimen sorting): Pablo E. Araujo, SandraEnríquez, Fabian Bersosa, Ruben Carranco, María Teresa Lasso, Vladimir Carvajal, Ana MariaOrtega, Paulina Rosero, Andrea Lucky, Sarah Weigel, Valeria Granda. Sometimes or one-time FieldAssistants (in alphabetical order): Mila Coca Alba, Gillian Bowser, Franklin, Paulo Guerra, Henry,Peter Hibbs, Amber Jonker, Pella Larsson, Keeta DeStefano Lewis, Jennifer Lucky, Ana Mariscal,Marinez Marques, Mayer, Raul F. Medina, Wendy Moore, Karen Ober, Monica O’Chaney, KristinaPfannes, Mike G. Pogue, Wendy Porras, Theresia Radtke, Jennifer Rogan, Leah Russin, MercedesSalgado, Linda Sims, Dawn Southard, George L. Venable, Joe Wagner Jr., and Winare.
Museum team: The following (in alphabetical order) provided all those important things in theMuseum that allowed production: Gary H. Hevel, Jonathan Mawdsley, Mike G. Pogue, Linda Sims,Warren Steiner, George L. Venable, Carol Youmans.
Technical assistance: Grace Servat for assistance with the Sigma Plot program for graphingour results and translating the abstract; Rob Colwell for assistance with the EstimateS program;Charles Bellamy, Mary Liz Jameson, Paul Johnson, Jonathan Mawdsley, Brett Ratcliff, Paul Skelly,and Warren Steiner for generic determinations of some beetles used in our study.
ERWIN ET AL.: BEETLE DIVERSITY IN WESTERN AMAZON BASIN 83
Grants. The following provided the important thing in the National Museum of NaturalHistory that allowed everything, funding: the Programs NLRP (Richard Vari, P.I.), BSI (GeorgeZug, P.I.), the Department of Entomology, and the Casey Fund (Entomology). Field support fromEcuambiente, S.A. in Quito, Ecuador allowed participation of several Ecuadorian students atOnkone Gare Station.
LITERATURE CITED
ARNDT, E., S. KIMSE, AND T.L. ERWIN. 2001. Arboreal beetles of Neotropical forests: Agra Fabricius, larvaldescriptions with notes on natural history and behaviour (Coleoptera, Carabidae, Lebiini, Agrina). TheColeopterists Bulletin 55(3):297–311.
BASSET, Y. 2001. Invertebrates in the canopy of tropical rain forests: How much do we really know? PlantEcology 153:87–107.
CARROLL, S.S., AND D.L. PEARSON. 1998. Spatial modeling of butterfly species richness using tiger beetles(Cicindelidae) as a bioindicator taxon. Ecological Applications 8:531–543.
COLWELL, R.K. 2000. EstimateS: Statistical estimation of species richness and shared species from samples.Version 6.01b. User’s Guide and application e-published at: http://viceroy.eeb.uconn.edu/estimates.
COLWELL, R.K., AND J.A. CODDINGTON. 1994. Estimating terrestrial biodiversity through extrapolation.Philosophical Transactions of the Royal Society of London, Series B: Biological Sciences 345:101–118.
CONDIT, R., N. PITMAN, E.G. LEIGH, JR., J. CHAVE, J. TERBORGH, R.B. FOSTER, P. NÚÑEZ V., S. AGUILAR, R.VALENCIA, G. VILLA, H.C. MULLER-LANDAU, E. LOSOS, AND S.P. HUBBELL. 2002. Beta-diversity in tropicalforest trees. Science 295:666–669.
ERWIN, T.L. 1981. Natural history of Plummers Island, Maryland. XXVI. The ground beetles of a temperateforest site (Coleoptera: Carabidae): An analysis of fauna in relation to size, habitat selection, vagility, sea-sonality, and extinction. Bulletin of the Biological Society of Washington 5:105–224.
ERWIN, T.L. 1982. Tropical forests: Their richness in Coleoptera and other arthropod species. TheColeopterists Bulletin 36(1):74–75.
ERWIN, T.L. 1983a. Tropical forest canopies, the last biotic frontier. Bulletin of the Entomological Society ofAmerica 29(1):14–19.
ERWIN, T.L. 1983b. Beetles and other arthropods of the tropical forest canopies at Manaus, Brasil, sampledwith insecticidal fogging techniques. Pages 59–75 in S.L. Sutton, T.C. Whitmore, and A.C. Chadwick,eds., Tropical Rain Forests: Ecology and Management. Blackwell Scientific Publications, Oxford,England, UK.
ERWIN, T.L. 1988. The tropical forest canopy: The heart of biotic diversity. Pages 123–129 in E.O. Wilson,ed., Biodiversity. National Academy Press, Washington, DC, USA.
ERWIN, T.L. 1989. Canopy arthropod biodiversity: A chronology of sampling techniques and results. RevistaPeruana de Entomologia 32:71–77.
ERWIN, T.L. (In prep.) Standardized terrestrial biodiversity inventory protocols for conservation (SIP).ERWIN, T.L., AND V. ASCHERO. (In prep.) Patterns of tree distribution across two kilometers of lowland tropi-
cal rain forest in the Yasuni area of eastern Ecuador.GENTRY, A. 1993. A Field Guide to the Families and Genera of Woody Plants of Northwest South America
(Colombia, Ecuador, Perú) with Supplementary Notes on Herbaceous Taxa. Conservation International,Washington, DC, USA. 895 pp.
HEYER, W.R., J.A. CODDINGTON, W.J. KRESS, P. ACEVEDO, D. COLE, T.L. ERWIN, B.J. MEGGERS, M.G. POGUE,R.W. THORINGTON, R.P. VARI, M.J. WEITZMAN, AND S.H. WEITZMAN. 1999. Amazonian biotic data and con-servation decisions. Ciência e Cultura 51(5, 6):372–385.
KRESS, J., W.R. HEYER, P. ACEVEDO, J.A. CODDINGTON, D. COLE, T.L. ERWIN, B.J. MEGGERS, M.G. POGUE,R.W. THORINGTON, R.P. VARI, M.J. WEITZMAN, AND S.H. WEITZMAN. 1998. Amazon biodiversity:Assessing conservation priorities with taxonomic data. Biodiversity and Conservation 7:1577–1587.
LAMAS, G., R.K. ROBBINS, AND D.J. HARVEY. 1991. A preliminary survey of the butterfly fauna of Pakitza,Parque Nacional del Manu, Perú, with an estimate of its species richness. Publicaciones del Museo de
84 PROCEEDINGS OF THE CALIFORNIA ACADEMY OF SCIENCESVolume 56, Supplement I, No. 7
Historia Natural, Universidad Nacional Mayor de San Marcos (A) 40:1–19.LOWMAN, M.D., AND P.K. WITTMAN. 1996. Forest canopies: Methods, hypothesis, and future directions.
Annual Review of Ecology and Systematics 27:55–81.LUCKY, A., T.L. ERWIN, AND J.D. WITMAN. 2002. Temporal and spatial diversity and distribution of arboreal
Carabidae (Coleoptera) in a western Amazonian rain forest. Biotropica 34(3):376–386.PITMAN, N.C.A., J. TERBORGH, M.R. SILMAN, P. NÚÑEZ V., D.A. NEILL, C.E. CERÓN, W. PALACIOS, AND M.
AULESTIA. 2001. Dominance and distribution of tree species in upper amazonian terra firme forests.Ecology 82(8):2101–2117.
TUOMISTO, H., R. KALLE, AND Y. MARKKU. 2003. Dispersal, environment, and floristic variation of westernAmazonian forests. Science 299:241–244.
WILSON, E.O. 2000. A global biodiversity map. Science 289:2279.
ERWIN ET AL.: BEETLE DIVERSITY IN WESTERN AMAZON BASIN 85
Copyright © 2005 by the California Academy of SciencesSan Francisco, California, U.S.A.